application of microbial fuel cells in a forested wetland
TRANSCRIPT

Clemson UniversityTigerPrints
All Theses Theses
5-2012
Application of microbial fuel cells in a forestedwetlandJianing DaiClemson University, [email protected]
Follow this and additional works at: https://tigerprints.clemson.edu/all_theses
Part of the Environmental Engineering Commons
This Thesis is brought to you for free and open access by the Theses at TigerPrints. It has been accepted for inclusion in All Theses by an authorizedadministrator of TigerPrints. For more information, please contact [email protected].
Recommended CitationDai, Jianing, "Application of microbial fuel cells in a forested wetland" (2012). All Theses. 1369.https://tigerprints.clemson.edu/all_theses/1369
APPLICATION OF MICROBIAL FUEL CELLS IN A FORESTED WETLAND ENVIRONMENT
A Thesis Presented to
the Graduate School of Clemson University
In Partial Fulfillment of the Requirements for the Degree
Master of Science Biosystems Engineering
by Jianing Dai May 2012
Accepted by: Dr. Alex T. Chow, Committee Chair
Dr. William H. Conner Dr. Kevin T. Finneran

ii
ABSTRACT
Electricity can be generated from forest residues, especially the organic matter
from litter fall, in freshwater forested wetland environments with a microbial fuel cell
(MFC) system. Electricity generation efficiency was examined for cypress, tupelo, and
pine litter extracts, using dual-chamber reactors. The maximum power density generated
with cypress extracts was on the level of 320 mW/m2, higher than tupelo (230 mW/m2),
and pine (210 mW/m2). The efficacy of cypress extracts was also higher than tupelo and
pine, demonstrating that organic matter from cypress litter is a preferred substrate for
electricity generation with MFCs. Meanwhile, low aromaticity of the substrate was
advantageous to the power generation in MFC, as examined in cypress extract. Power
generated in the column reactors had a positive relationship with temperature, whereas
there was a negative relationship with electrode distance. In a field situation, power
generation using sediment MFCs depended mainly on temperature when temperatures
were lower than 10-15 ° C; but depended more on substrate characteristics (especially
concentrations of DOC and SUVA) than temperature when temperatures were higher.
Based on the lab study, the annul energy input from dissolved organic matter from litter
fall to the studied wetland is 16.74 GJ, of which 4.12% can be utilized with current
sediment MFCs technology as used in this study. However, power density is still too low,
two orders of magnitude lower than dual-chamber reactors can deliver.

iii
DEDICATION
I dedicate this work to my parents, Qiuying Jin and Kui Dai.

iv
ACKNOWLEDGMENTS
I would like to thank my advisor, Dr. Alex T. Chow, for his help, guidance and
support during my work. I am also greatly indebted to my other committee members: Dr.
William H. Conner and Dr. Kevin T. Finneran for their help and guidance.
I would also like to thank all faculty members and staff at the Baruch Institute of
Coastal Ecology and Forest Science for their help in the lab and field and Vickie Byko
for helping with any and all problems I incurred. Also, I would like to thank my
undergraduate teammates for all their help: Williams Wilson, Elizabeth O’Rourke.
Last but not the least, I would like to thank Miss Shuangshuang Xie for her help
and encouragement, as well as the lesson to let me know myself during thesis writing.

v
TABLE OF CONTENTS
Page
ABSTRACT ............................................................................................................................... ii
DEDTCATION ......................................................................................................................... iii
ACKNOWLEDGEMENTS ...................................................................................................... iv
LIST OF TABLES .................................................................................................................. viii
LIST OF FIGURES ................................................................................................................... ix
I. INTRODUCTION .............................................................................................................. 0
References ............................................................................................................................. 4
II. REVIEW OF LITERATURE ............................................................................................. 5
2.1. Types of Microorganisms ............................................................................................ 6
2.2. Type of Substrates......................................................................................................... 7
2.3 Type of Electrodes ......................................................................................................... 9
2.3.a Anodes ................................................................................................................ 9
2.3.b Cathodes ........................................................................................................... 10
2.4 Membrane ..................................................................................................................... 12
2.5 Other Physiochemical Factors .................................................................................... 14
2.5.a. Temperature ..................................................................................................... 14
2.5.b Electrical Conductivity (EC) ............................................................................ 14
2.5.c Electrode Spacing ............................................................................................. 15
2.6 Potential Applications of MFC .................................................................................. 15
2.6.a Energy Production ............................................................................................ 15
2.6.b Wastewater Treatment ...................................................................................... 16
2.6.c Bioremediation.................................................................................................. 16
2.6.d Biosensor .......................................................................................................... 17

vi
2.7 Limitations .................................................................................................................... 18
2.8 Isolated Freshwater Forested Wetlands .................................................................... 19
References ........................................................................................................................... 20
III. MATERIAL AND METHODS ........................................................................................ 23
3.1 Dual-chamber Reactor Configuration and Operation ............................................. 23
3.2 Culture and Medium .................................................................................................... 26
3.3 Column Reactor Configuration .................................................................................. 27
3.3.a. Effect of Temperature Fluctuation ................................................................... 30
3.3.b. Water Level and Electrode Distance ............................................................... 30
3.4 In-situ MFC Configuration ......................................................................................... 31
3.5 Analytical Methods ...................................................................................................... 33
3.5.a Electrochemical Analysis ................................................................................. 33
3.5.b Chemical Analysis ............................................................................................ 34
3.5.c Fluorescence Spectroscopy ............................................................................... 35
References ........................................................................................................................... 35
IV. RESULTS AND DISCUSSION ....................................................................................... 37
4.1. Results .......................................................................................................................... 37
4.1.a. Characterization of Litter Extracts ................................................................... 37
4.1.b. Energy Generation from Different Litter Substrates ....................................... 41
4.1.c. Energy Production as a Function of Concentration ......................................... 43
4.1.d. Energy Production as a Function of Temperature and Electrode Distance ..... 47
4.1.e. Field sMFC Performance ................................................................................. 48
4.2. Discussion .................................................................................................................... 50
4.2.a. Effect of Substrate Concentration on Energy Generation ............................... 50
4.2.b. Effect of Substrate Species on Energy Generation .......................................... 51
4.2.c. Effect of Electrode Distance ............................................................................ 52

vii
4.2.d. Effect of Temperature Oscillation on the Performance of MFCs ................... 54
4.2.e. Energy Budget ................................................................................................. 58
References ........................................................................................................................... 59
V. CONCLUSIONS AND RECOMMENDATIONS ........................................................... 60
5.1 Conclusions ......................................................................................................... 60
5.2 Recommendations /Future Research Directions.................................................. 61
5.2.a. Energy Generation from Litter Biomass .......................................................... 61
5.2.b. Environmental Factors in Coastal Areas ......................................................... 62
5.2.c. Environmental Impact of In-situ MFCs ........................................................... 62
References ........................................................................................................................... 63

viii
LIST OF TABLES
Table Page
4. 1 Characterization of three litter extracts ..................................................................... 38
4. 2 Characterization of feeding extracts before and after microbial fuel treatments....... 39
4. 3 Effects of electrode distance on internal resistance of MFC. .................................... 47
ix
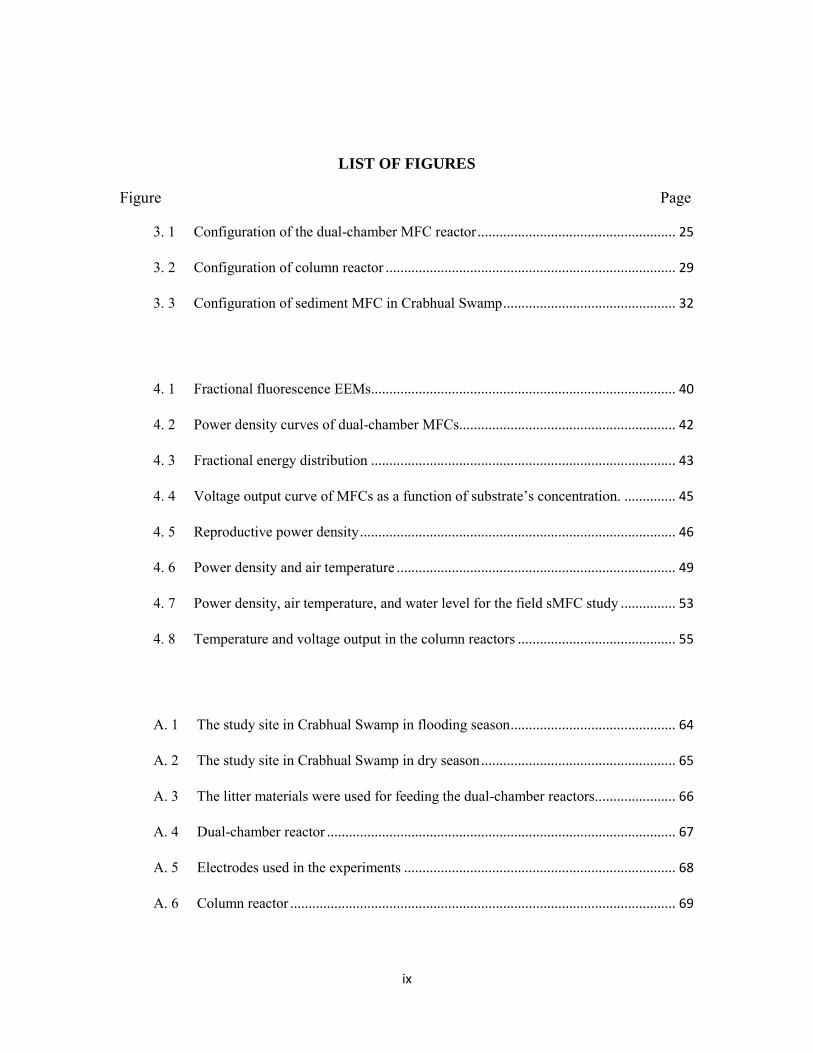
LIST OF FIGURES
Figure Page
3. 1 Configuration of the dual-chamber MFC reactor ...................................................... 25
3. 2 Configuration of column reactor ............................................................................... 29
3. 3 Configuration of sediment MFC in Crabhual Swamp ............................................... 32
4. 1 Fractional fluorescence EEMs................................................................................... 40
4. 2 Power density curves of dual-chamber MFCs........................................................... 42
4. 3 Fractional energy distribution ................................................................................... 43
4. 4 Voltage output curve of MFCs as a function of substrate’s concentration. .............. 45
4. 5 Reproductive power density ...................................................................................... 46
4. 6 Power density and air temperature ............................................................................ 49
4. 7 Power density, air temperature, and water level for the field sMFC study ............... 53
4. 8 Temperature and voltage output in the column reactors ........................................... 55
A. 1 The study site in Crabhual Swamp in flooding season ............................................. 64
A. 2 The study site in Crabhual Swamp in dry season ..................................................... 65
A. 3 The litter materials were used for feeding the dual-chamber reactors.. .................... 66
A. 4 Dual-chamber reactor ............................................................................................... 67
A. 5 Electrodes used in the experiments .......................................................................... 68
A. 6 Column reactor ......................................................................................................... 69

x
A. 7 Sediment MFC installed in the field ......................................................................... 70
A. 8 Graphite rod used in sediment MFC as anode .......................................................... 70

CHAPTER I
INTRODUCTION
Microbial fuel cells (MFCs) have been studied intensively in the last decade because they
represent a potential green technology that produces electrical energy utilizing natural
organic matter through microbial redox processes (Logan et al. 2006; Juang et al. 2011;
Hou et al. 2012; Winfield et al. 2012). Electrons released during the redox process are
transferred through external circuits resulting in electricity generation (Logan et al. 2006).
In additional to lab scale reactors, scientists and engineers have conducted trials using
sediment MFCs (sMFC) to produce electrical energy for field application (Dumas et al.
2007). The MFCs are mainly driven by redox potential differences between anodic and
cathodic environments, and they do not require complicated manipulation of reactants or
reaction conditions. Any environments that have oxic and anoxic conditions can be used
for MFCs. Bacteria residing on the anodes of MFCs, and maybe the cathodes, are the
“local workers” to process the redox reactions. The communities selected by MFC
reactions ensure sustainability of such an environmental friendly system. Therefore,
MFCs could be a reliable approach for generating power in the field and deserves study
as a source of power for field devices.
Isolated freshwater forested wetlands located in low-lying coastal areas of the
southeastern U.S. comprise a unique forested ecosystem. These forests are subjected to
both upland runoff and groundwater seepage (Tiner 2003). Isolated freshwater wetlands

1
have received rather nominal scientific attention in regards to the diversity of the
vegetation and their production of large amounts of biomass. These ecosystems in the
coastal area of South Carolina are among the most sensitive to sea-level rise. Intensive
field monitoring of freshwater forested wetlands in the southeastern U.S. have been, and
are currently being, conducted by research teams. Many types of in-situ equipment (e.g.,
water level recorders and water quality sensors) are currently collecting data in the field.
Field monitoring devices have been installed in various environments to investigate
ecological processes and climate change effects on short- and long-term temporal scales.
These remote devices rely on batteries to operate. Conventional chemical batteries are
mostly used currently. There are two concerns of using chemical batteries. The first is the
short life time, so to ensure the reliability and quality of the data, researchers need to
replace the batteries at regular intervals. The frequent field trips take time, and also can
be difficult in special sites, like jungles or swamps. In some programs, researchers desire
to take as few field trips as possible to keep the study sites undisturbed. The second
concern of using conventional batteries is the potential for heavy metal pollution. A
conventional battery, which is usually a chemical fuel cell, is composed of many heavy
metals such as lead, cadmium, and chromium. Under damp conditions, erosion may cause
leakage of chemicals and pollute the environment. By using MFCs on field monitoring
devices, it is expected that they will either elongate the life time of the traditional
chemical batteries or replace the chemical batteries entirely.

2
There are two limitations to the application of MFCs under field conditions: a conductive
aqueous environment and presence of organic matter as a fuel source. A well conductive
aqueous environment consists of electrolytes which are crucial to transport the positive
charge from the anode to the cathode in MFC reactions. Cathodes floating on the water
surface will freely accept the electron via external circuits and positive charge through
the water, using oxygen in the air as the electron acceptor. In isolated freshwater forested
wetlands, seasonal flooding creates the reaction condition for sMFC. Natural organic
matter that has accumulated at the soil-water interface serves as a fuel source of sMFC.
Bacteria degrade the organic matter near the underground anodes or at the soil-water
interface. In addition, high levels of dissolved humic substances such as humic acid can
enhance the conductivity of water significantly, increasing the transport of the charge
through water (Thygesen et al. 2009). In an investigation of electricity generation using
MFCs in a rice paddy field (Kaku et al. 2008), low power generation was observed and
was attributed to the low electrical conductivity in the soil and water matrix. In marine
environments, low organic concentrations turn out to be one of the major limiting factors
for using sMFC (Dumas et al. 2007).
In an isolated wetland on Hobcaw Barony near Georgetown, SC, leaf litter production is
very high (833 g/m2/yr), resulting in an accumulation of a thick layer of organic matter on
the soil surface which serves as a substrate source. Some storm events may also bring in
organic matter to the wetland from adjacent forest areas. Bacteria break down the detritus

3
each year and release the organic matter to the water and air. Actually, sMFC could take
advantage of these components via a series of biogeochemical reactions and generate
power. This annual litter fall can be regarded as a renewable energy source and is
environmental friendly. Wind power and solar power technologies are more applicable
and commercially available in the market compared with MFCs. Investigations by DOE
show that wind and solar technology yields 1.3% of the electricity generation in the U.S.
However, in forested wetlands, wind power is limited by the numerous trees and less
wind. Solar panels do not work well in forests due to limited sunlight passing through the
dense canopy. These situations mean that sMFC have a good chance to make use of the
“forgotten resource”-forest leaf litter. The productivity and optimal reaction conditions of
MFCs and sMFC will be investigated in this study. A small scale MFC system could be
created for household use, which can be fueled with vegetation residue as a free or cheap
substrate, rather than burned up as is the current treatment process, such as septic tanks
which produce air pollution. In order to understand the effectiveness of the application of
MFCs using natural organic matter as a substrate, a series of biogeochemical experiments
were conducted to figure out the change of characteristics of organic carbon after
electricity generation through microbial processes. Wetlands have been reported as one of
the most important dissolved organic matter sources to the adjacent land surface area. It
has been shown that dissolved organic carbon and nitrogen serve as the precursors of
disinfection byproducts (Diaz et al. 2008). The effect of microbial activity on the change
of DOC in wastewater treatment has been intensely studied (Jiang et al. 2011). However,
the effect of MFC reactions on the change of natural DOC characteristics has not been
4
studied. Some organic matters secreted by bacteria can serve as the electron shuttle when
MFC reaction applies in the field, which should be investigated. The characteristics of the
organic matter should be figured out to analyze and predict the future of application of
sMFC in the natural environment.
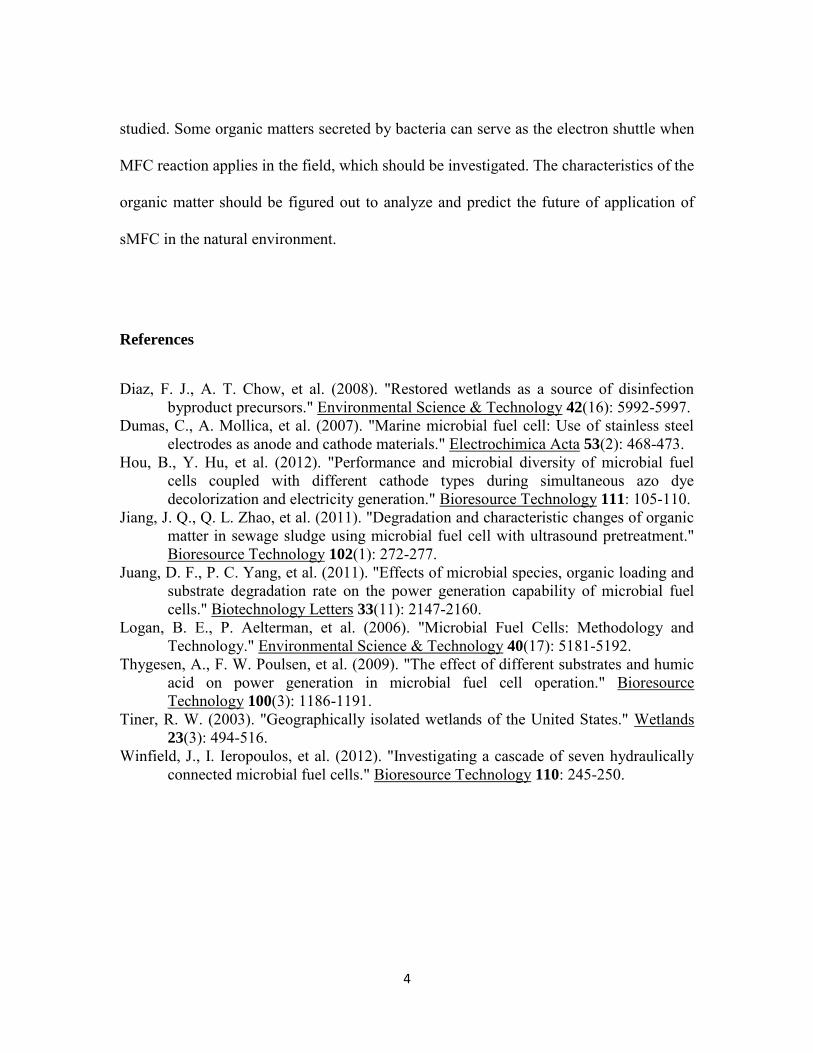
References
Diaz, F. J., A. T. Chow, et al. (2008). "Restored wetlands as a source of disinfection byproduct precursors." Environmental Science & Technology 42(16): 5992-5997.
Dumas, C., A. Mollica, et al. (2007). "Marine microbial fuel cell: Use of stainless steel electrodes as anode and cathode materials." Electrochimica Acta 53(2): 468-473.
Hou, B., Y. Hu, et al. (2012). "Performance and microbial diversity of microbial fuel cells coupled with different cathode types during simultaneous azo dye decolorization and electricity generation." Bioresource Technology 111: 105-110.
Jiang, J. Q., Q. L. Zhao, et al. (2011). "Degradation and characteristic changes of organic matter in sewage sludge using microbial fuel cell with ultrasound pretreatment." Bioresource Technology 102(1): 272-277.
Juang, D. F., P. C. Yang, et al. (2011). "Effects of microbial species, organic loading and substrate degradation rate on the power generation capability of microbial fuel cells." Biotechnology Letters 33(11): 2147-2160.
Logan, B. E., P. Aelterman, et al. (2006). "Microbial Fuel Cells: Methodology and Technology." Environmental Science & Technology 40(17): 5181-5192.
Thygesen, A., F. W. Poulsen, et al. (2009). "The effect of different substrates and humic acid on power generation in microbial fuel cell operation." Bioresource Technology 100(3): 1186-1191.
Tiner, R. W. (2003). "Geographically isolated wetlands of the United States." Wetlands 23(3): 494-516.
Winfield, J., I. Ieropoulos, et al. (2012). "Investigating a cascade of seven hydraulically connected microbial fuel cells." Bioresource Technology 110: 245-250.

5
CHAPTER II
REVIEW OF LITERATURE
Microbial fuel cell (MFC) technology is based on the principle of bioelectrochemistry. A
MFC system consists of anodes, cathodes, internal connections, and external connections.
The internal connection includes the electrolyte and exchange membrane that separates
anode and cathode, which determines the internal resistance of an MFC. The smaller the
internal resistance is the better the performance of the MFC. The external connection is
an electrical circuit to transfer the electrons. The electron donors, which are generally
organic substrates such as acetate and glucose, are oxidized by bacteria in anodes under
anoxic conditions, and electrons are released and are shuttled by mediator or microbial
nanowire to the anodes, as shown in Figure 2.1. Because of the potential differences
between anode and cathode, electrons pass through the external circuits and are accepted
by electron acceptors at cathodes which are usually under aerobic conditions. Meanwhile,
the positive charge (proton) moves through the internal connection pathway from anodes
to cathodes to create a charge balance. In addition to electrical production, MFCs have
been used for wastewater treatment because of their oxidation capability on organic
matter (Feng et al. 2008). In recent years, MFCs have received intense focus due to their
versatility and energy recovery benefits. There are a number of biological and chemical
factors able to affect power output and wastewater treatment efficacy of MFCs, such as
types of microorganisms, electron donors, and acceptors. In this chapter, I will review

6
the literature and summarize recent scientific findings that affect the performance of
MFCs. In addition, I will discuss the potential application of MFCs.
2.1. Types of Microorganisms
The microorganisms in charge of transferring electrons into the MFC systems are usually
called exoelectrogens which are obligating oxidation reactions near anodes. The diversity
of microbes capable of generating electricity has been explored by analyzing the
composition of biofilms on the electrode surface and feeding substrate environments.
Two major dissimilartory genera (Shewanella and Geobacter) of exoelectrogens have
been well studied (Biffinger et al. 2007; Richter et al. 2009). Bacteria can secrete or
utilize the mediators (Rabaey et al. 2005) to assist in electron transfer. It was observed
that the bacteria and communities were capable of passing electrons via nanowires and
cell surfaces (Huang et al. 2008). Both Geobacter and Shewanella produce electron
shuttling mechanism via special structures on the cell like nanowires, pili. Shewanella
was found to be able to transfer electrons via membrane-bound proteins on membranes,
periplasm, and outer membranes. This breakthrough has encouraged researchers to
explore the application of sediment MFCs in outdoor environments because of the higher
efficiency of transfer electron via pili. Sediment MFCs involving biofilm is dominated by
geobacteraceae which possesses both membrane and secreted mediator transfer avenues
(Logan et al. 2006).

7
Both pure culture and mixed culture bacteria inoculated in MFCs have been studied.
There is no definite conclusion affirming which type is more efficient. For example,
Lovely’s group at the University of Massachusetts at Amherst produced 1.9W/m2 with
cultured Geobacter Sulferredusens using acetate as the substrate, 0.3 W/m2 more power
than that with mixed culture bacteria in similar reactors (Nevin et al. 2008). However,
they did admit that in most cases, the power produced by mixed communities was higher
(Rabaey et al. 2004). Mixed culture bacterial communities usually have a broader
adaptation to the environment and are more sustainable due to successive transfer and
enrichment of biofilms, but it is difficult to replicate the communities to maintain the
stable power generation and to elucidate the function of each species in the communities.
The performance of MFCs depends on the composition of substrates used. Normally,
pure culture bacteria requires simple substrates, like acetate, or certain pretreatments
before the feeding process; mixed culture communities are able to utilize more
complicated substrates, like wastewater or biomass extracts (Feng et al. 2008; Mohan et
al. 2008).
2.2. Type of Substrates
In order to expand the application of MFCs, a great variety of organic substrates were
tested or pretreated to test for electricity generation. The initial purpose of MFC
technology was to remove contaminants or organic matters in wastewater (Ahn et al.
2010; Zhuang et al. 2012). Acetate was the most popular substrate for MFC

8
experimentation due to the easiness of the degradation reactions compared to other
components in wastewater. Also, acetate was the end product of many metabolism
pathways for higher order carbon compounds. Therefore, acetate was usually used to
benchmark the effects of other substrates and configurations on the performance of MFCs.
A power density of 3600 kW/m2 using acetate was the highest record with MFCs
(Rabaey et al. 2003). In view of columbic efficiency, acetate-fed MFCs could recover
72.3% of the electrons by generating electricity, much higher than fermentable substrates
like butyrate (43.0%), propionate (36.0%), and glucose (15.0%) (Chae et al. 2009). Lee et
al. (2008) compared electricity generation behavior between acetate and glucose and
found that, under the same reactor and concentration conditions, acetate generates 4.66
mA current and is consumed within two days, whereas glucose was consumed in 10 days
at a current of 0.76 mA.
A complex mixture of organic matter in wastewater, biomass extracts and residue, and
natural water-sediment have also been examined to generate energy in MFCs. Feng et al.
(2008) produced a power density of 528 mW/m2 with brewery wastewater of 3000-5000
mg of chemical oxygen demand (COD)/L. Sun et al. (2011) reported that a mixture of
model azo dye and wastewater enhanced decolorization activity. Wang et al. (2009)
found electricity generation with raw corn biomass was 331 mW/m2; and pretreatment of
the steam explosion can enhance power generation by 8% (406 mW/m2); the system
could produce 551 mW/m2 power with glucose as the substrate. However, as complicated
as the substrates are, diverse and proper microbial communities are required to adapt to
the condition. This kind of system is better with respect to more stable states, despite the

9
lower efficiency and output than pure cultured and pure substrate fed MFCs. Pant et al.
(2010) reviewed power generation as well as waste treatment with a variety of substrates
and concluded that complex substrates will be the major type to use in terms of
improving the application of MFCs to produce electricity or hydrogen on a commercial
level.
2.3 Type of Electrodes
2.3.a Anodes
Anodes either accept the electrons from the suspended bacteria via mediation or provide
the bioreaction sites for electron transfer on the electrode surface. Better electrical
conductivity of anode materials is the central topic among various considerations. A
number of materials and configurations for constructing anodes have been developed and
examined. Metal materials are known for their low resistance in electricity conductivity.
However, most of them are so corrosive that they are ruled out for use, like copper.
Carbon and graphite materials have taken over the market due to their excellent
conductivity and non-corrosive characteristics. The conductivity of carbon paper is 0.8
ohm/cm while carbon cloth is 2.2 ohm/cm and graphite fiber is 1.6 ohm/cm. For graphite
materials, a lightly sanded pretreatment is usually applied to create greater surface area
which is easier for microorganisms to attach to. Graphite brushes and granules providing
large porosity and specific surface area are advantageous for electrogen’s growth and
generate a power density of 1430 mW/m2 (Logan et al. 2007). Conductive polymers were

10
invented, but have not been well investigated. The voltage output of coated polymer
anodes was only 55% of carbon cloth (Logan, unpublished). Unstable and erratic signal
output is another concern to maintain a well-qualified power support while applying the
polymer anodes in MFCs. Some other metal based coating technologies are applied to
enhance the anodes’ performance. However, whether the increases result from the
galvanized metal or metal oxides are not well clarified so far. Park et al. (2002) added Mn
(4+) and Zn (2+) to graphite-ceramics and produced 1.7 to 2.2 fold increases in current,
providing a novel way to enhance anode performance. Stainless steel anodes were tested
in both lab and field sMFCs, and 11.2 mW/m2 power density was achieved (Song et al.
2011). Dumas et al. (2008) compared stainless steel and graphite anodes, and 0.1 mW/m2
was generated from graphite MFCs, which was more efficient than steel MFCs.
Ammonia-gas-modified carbon cloth has an advantage over plain carbon cloth in
producing energy (1970 mW/m2 versus 1640 mW/m2, respectively), but the mechanism
of increase is still not well explained (Cheng et al. 2007).
2.3.b Cathodes
Electron acceptors combine with the electrons on the cathodes to complete the reduction
reaction. In some MFC reactor designs, cathode reaction has been found to be the
limiting factor, thus the need to examine methods to improve the reaction.
Chemical reagents can be used to adjust the reaction rate by controlling the concentration.
Oh et al. (2004) generated a maximum power density of 0.17 mW with ferricyanide in

11
the cathode compartment, compared to 0.095 mW with Pt-coated carbon cloth. However,
the potential toxicity of these reagents is a drawback preventing broad utilization.
Oxygen is used mostly in waste water biological treatment processes as an electron
acceptor. It is also used in MFC cathodes (Liu et al. 2005; Logan et al. 2007) due to its
safety and availability, though the efficiency is somehow lower than ferricyanide, 1.37
mW/m2 versus 4.35 mW/m2, respectively (Kong et al. 2010). Carbon-based cathodes
coated with catalyst have been developed to enhance the reaction. Carbon cloth with Pt-
loading is commercially available and widely used. Air-cathodes employ newly
developed subtle layers design. Besides the carbon conductive layer and catalytic layer,
there is a binding layer (obligated to transporting the protons, electrons, and oxygen), and
a diffusion layer (controls gas diffusion into the reactor). This design can increase the
cathode reaction by maximizing the concentration of oxygen, while minimizing the
electrode distance. The reported power density is as high as 766 mW/m2, while without
the diffusion layer, power density is only 538 mW/m2 (Zuo et al. 2008). Balance is
needed to control these layers: greater thickness will block the transfer process,
decreasing the oxygen mass transfer coefficient from 2.3×10⁻³ cm/s with 4 diffusion
layers to 0.6×10⁻³ cm/s with 8 diffusion layers (Logan 2008).
Other catalysts, like cobalttetramethoxyphenylporphyrin (0.6 mg/cm2), were examined
using air-cathodes, and reached a power density of 369±8 mW/m2, which is 12% lower
than that with 0.5 mg-Pt/cm2 (Logan 2008).

12
Biocathodes are a new technology where bacteria are used as the catalyst to assist
electron transfer on the cathode. Some microorganisms, like algae, can produce oxygen
via photosynthesis for cathode reaction to save the cost of an oxygen supply. This idea is
considered to be of great help to field MFC application because it promotes the cathode
reaction, which is usually a limiting factor, and enhances the sustainability and energy
generation ability (Velasquez-Orta et al. 2009). There are also other species of bacteria
that reduce iron or manganese and can be used to compose the biocathode. Biocathodes
are used to remove nitrogen compounds via denitrification in wastewater treatment. The
denitrifier will acquire electrons from the cathode emitting nitrogen, which will exit the
liquid phase as gas. At this point, energy production is not the major purpose, compared
to waste removal (He et al. 2006).
2.4 Membrane
Membrane application in MFCs has proven to have adverse effects on electricity
generation because of the increase in internal resistance (Li et al. 2011). However, the
requirement for membrane application aims at studying the separated anode or cathode
condition without being affected by other parts. The membranes are the conductive
separator for positive charges which means metal foil will not meet the requirement.
Protons or positive charges transfer through the electrolyte from anode to cathode. Cation
exchange membrane is commonly used due to its ability to exchange cations while
keeping the anolyte and catholyte separate. Commonly, anion exchange membrane is also

13
applied in MFCs, because it is recognized as an anion buffer that can transport protons
effectively. Ultrafiltration membranes limiting proton pass through are regarded as a way
to achieve separation and conductivity simultaneously. Kim et al. (2007) conducted a
comparison study among these membranes and found that when phosphate buffer
solution is used as an electrolyte, anion exchange membrane performs best in terms of
electricity generation (610 mw/m2), followed by nafion and cation exchange membrane.
The performance of ultrafiltration membranes depends on their ability to sieve molecules,
the smaller molecules are allowed to pass, and the larger internal resistance occurs, the
less power provided. Nafion membrane is most permeable for oxygen, which may be the
reason it is harmful to electricity generation. Though the anion exchange membrane can
produce the highest power density, the highest acetate diffusion effect from anode to
cathode may cause damage to cathode catalyst or by growing unwanted bacteria.
Ultrafiltration membranes provide better control for separation, but with less efficiency
due to high internal resistance. Further balance calculations are necessary for large scale
and long-term utilization (Kim et al. 2007).
When MFCs are applied under extreme environmental conditions, like strong acid or
base, membrane fouling is a major problem; separation condition is needed for bacteria
(such as A. ferrooxidans) growth. A bipolar membrane composed of anion and cation
membranes joined in series is used with the respect of the resistance ability of low pH
(<2.5) (Ter Heijne et al. 2006).

14
2.5 Other Physiochemical Factors
2.5.a. Temperature
Most studies examining temperature impacts on MFC operation are conducted within a
temperature range from 10 to 35 o C. In this range, electricity generation has a positive
relationship with operating temperature. Liu et al. (2005) reported that a reactor operated
at 32 o C generates 9% higher power density than that at 20 o C. In a sMFC model, Hong
et al. (2009) found power density at 35 o C was 2.5 higher than that at 20 o C. The
empirical function of temperature (T) in the biological process (Ɵ) is
ƟT = Ɵ20(T-20)
showing the positive relationship between temperature and microbial activity. Hong et al.
(2009) suggested that temperature affects the power generation of sMFC when the
substrate is adequate to support the max power density; after long periods of column
reactor operation (over 20 days), the temperature effect is not significant, with similar
power generation at 35 o C, 20 o C, and 10 o C probably due to substrate limitation in the
sediment.
2.5.b Electrical Conductivity (EC)
In a MFC system, the more conductive the electrolyte is, the more power generated. Liu
et al. (2005) used ion strength to represent EC, and reported that power density increased
85% as ion strength increased from 100 to 400 mg/L. Hong et al. (2209) observed an
increase after increasing EC in sMFC columns, but no calculated relationship was given.

15
However, additions of salt to enhance conductivity have potential adverse effects on field
environments, which is an area recommended for investigation.
2.5.c Electrode Spacing
Power density increases with decreasing electrode spacing – the distance between anode
and cathode. In a single chamber reactor, Liu et al. (2005) reported that power density
increased about 60% when electrode distance decreased from 4 to 2 cm. Hong et al.
(2009) found that in sMFC columns, power density depends significantly on electrode
spacing when the distance is less than 80 cm. In their experiments, the anodes were
buried 2 cm under the sediment surface in all MFC reaction columns. Cathodes floated
on the water surface. There is no discussion about water phase and sediment phase
contributions to internal resistance (Hong et al. 2009).
2.6 Potential Applications of MFC
2.6.a Energy Production
The most attractive feature of MFCs is the recovery of energy directly as electricity from
waste treatment processes. Before 2001, reported power densities were less than 0.1
mW/m2 with values zooming up to 2400 mW/m2 in 2007, which is still an order
magnitude lower than the theoretical limit with mass transfer to the biofilm being the
limiting factor (Logan 2008). Under natural conditions, sMFC have been tested to supply
power to remote sensors via energy boosting circuits as a promising method to take the
place of traditional chemical batteries. A benthic MFC was installed in seawater to power

16
temperature and oxygen sensors with a power density of 44 mW/m2 (Gong et al. 2011);
Kaku et al. (2008) tested the ability of sMFCs in rice paddy fields to generate a power
density of 6 mW/m2 (Kaku et al. 2008). Zuo et al. (2006) took advantage of the organic
component in corn stover biomass to achieve a power density of 810 mW/m2, after steam
explosion pretreatment.
2.6.b Wastewater Treatment
Conventional wastewater treatment methods, like active sludge, require a huge energy
investment. Anaerobic methods producing methane gas are productive enough to meet
the energy requirement and may still make a profit. For most small scale treatment plants,
or even large scale ones, MFC technology is one way to achieve waste removal and cost
saving. In the lab, Yuan et al. (2010) operated a continuous flow MFC and removed 40-
50% of the total chemical oxygen demand (COD) with 464 mW/m2 power generation.
Low sludge yields of 0.24-0.31 g COD cell/g COD for acetate have been observed
(Aelterman et al. 2008), which is less than one tenth of the yield by anaerobic processes,
but there are no data available from pilot tests in wastewater treatment plant so far.
2.6.c Bioremediation
Bioremediation is the degradation of contaminants by microorganisms under aerobic,
anoxic, or anaerobic conditions. However, some aromatic compounds persist in the soil
that are resistant to anaerobic degradation (Carmona et al. 2009). With the addition of Fe,
nitrate may be reduced under anoxic conditions and cause potential secondary pollution

17
(Rothermich et al. 2002). In an MFC system, bacteria do not have to rely on in-site
electron acceptors but can transfer the electrons through the circuits. On the cathodes,
bacteria can accept the electrons and complete the processes, like nitrogen removal. Yuan
et al. (2010) reported that in an organic-rich sediment environment, MFCs can enhance
the degradation of readily oxidized organic matter and acid volatile sulfide by 36% and
94.9%, respectively, by increasing the oxidation and reduction potential value from 162.5
mV to 245.7 mV. Huang et al. (2011) compared the difference between open circuit and
closed circuit conditions, and observed MFCs can improve the degradation rate of phenol
from 27.6% to 90.1% within 10 days.
2.6.d Biosensor
MFCs can be considered as biosensors, because microbial activity on the electrode,
depending on environmental parameters, produces an electrical signal. Five day
Biological Oxygen Demand (BOD5) is the key parameter to monitor wastewater quality
and examine the sensitivity of MFC biosensor. The electrical signal varies with the BOD5
concentration. However, it is significantly influenced by physiochemical factors, like
temperature, pH, and conductivity. Calibration is necessary to normalize the
measurement result to present valid conditions. Liu et al. (2011) tried to monitor the
anaerobic digestion process with a MFC biosensor. They reported a good correlation with
online measurement and offline analysis for a 6 month operation, but they did not
propose any exact mathematical model to estimate impact factors for the sensor. Stein et
al. (2011) contributed a kinetic model for establishing the biosensor and suggested that a

18
necessary tradeoff has to be made between the robustness and sensitivity of the biofilm.
They also pointed out the limit of the biosensor: the change should not disturb the
robustness of the biofilm (Stein et al. 2011). Zhang et al. (2011) used submersible MFCs
to examine groundwater and concluded that there is little correlation between electrical
signals and groundwater BOD5, due to significant effects from other physiochemical
factors as described above. Further study about monitoring the biofilm and calibration
needs to be conducted.
2.7 Limitations
The voltage depends on the redox potential difference between cathode and anode
reactions. The total cell potential is typically limited to 1.2 V with oxygen at cathode and
glucose at anode. The typical half reactions are:
O2 + 4H+ + 4e- → 2H2O, E` = -0.414 V;
6CO2 + 24H+ + 24e- →C6H12O6 + 6H2O, E` = 0.805 V;
Where E` values are electrochemical potentials adjusted for pH=7 at 298 K, and oxygen
partial pressure is 0.2. Considering that appliances operate on 110 V in U.S. and 220 V in
Europe, MFCs have to be connected in series or equipped with power management
circuits to boost the voltage to usable levels, or make the DC/DC, DC/AC conversion
(Donovan et al. 2008).

19
2.8 Isolated Freshwater Forested Wetlands
Isolated freshwater forested wetlands located in low-lying coastal areas of the
southeastern U.S. comprise a unique forested ecosystem. These forests are isolated from
major water bodies, but get their water from both upland runoff and groundwater seepage
(Tiner 2003).
In the southeastern U.S., swamp tupelo (Nyssa sylvatica var. biflora), water tupelo (Nyssa
aquatica), and bald cypress (Taxodium distictum) are the dominant tree species in this
wetland ecosystem. These wetlands not only provide habitat for many animals, but also
serve as sites for nutrient cycling and storage. Forested wetlands in the southeastern U.S.
are very productive with annual litterfall productivity ranging between about 300 and 600
g dry wt/m2 (Conner 1994). Through physical and biogeochemical processes, this high
input of litter is decomposed and contributes organic matter to the soil and water. Rates
of organic matter decomposition in the ecosystem depend on hydrology, temperature, and
litter quality (Lockaby et al. 1998). Along the coast, these forests are exposed to saltwater
intrusion, and the freshwater plants are sensitive to high salinity. Unfortunately these
forests have received only nominal scientific attention until recently. High salinity causes
tree mortality and forest dieback, and the ecosystem turns into salt marsh (Doyle et al.
2007; Krauss et al. 2009).
The high productivity of organic matter in these wetlands has been regarded as potential
sources of disinfection byproducts precursors (DBPs), especially in tidally affected areas.
High concentrations of chloride and bromide may increase the formation of DBPs,
including trihalomethanes (THMs), haloacetonitriles (HANs), and chloral hydrate (CH),

20
during chlorination which creates human health issues (Mullener 2007). Some
microorganisms may have an effect on the formation of DBPs through biological
processes. Plummer et al. (2001) found an increase of DBPs formation from algae
suspension ambience without preozonation. No study on the effect of MFC reaction on
the conversion of natural DOMs related to DBPs precursors production has been reported.
References
Aelterman, P., S. Freguia, et al. (2008). "The anode potential regulates bacterial activity in microbial fuel cells." Applied Microbiology and Biotechnology 78(3): 409-418.
Ahn, Y. and B. E. Logan (2010). "Effectiveness of domestic wastewater treatment using microbial fuel cells at ambient and mesophilic temperatures." Bioresource Technology 101(2): 469-475.
Biffinger, J. C., J. Pietron, et al. (2007). "A biofilm enhanced miniature microbial fuel cell using Shewanella oneidensis DSP10 and oxygen reduction cathodes." Biosensors & Bioelectronics 22(8): 1672-1679.
Carmona, M., M. T. Zamarro, et al. (2009). "Anaerobic Catabolism of Aromatic Compounds: a Genetic and Genomic View." Microbiology and Molecular Biology Reviews 73(1): 71-+.
Chae, K. J., M. J. Choi, et al. (2009). "Effect of different substrates on the performance, bacterial diversity, and bacterial viability in microbial fuel cells." Bioresource Technology 100(14): 3518-3525.
Cheng, S. A. and B. E. Logan (2007). "Ammonia treatment of carbon cloth anodes to enhance power generation of microbial fuel cells." Electrochemistry Communications 9(3): 492-496.
Conner, W. H. (1994). " Effect of forest management practices on southern forested wetland productivity." Wetlands 14(1): 27-40.
Donovan, C., A. Dewan, et al. (2008). "Batteryless, wireless sensor powered by a sediment mcrobial fuel cell." Environmental Science & Technology 42(22): 8591-8596.
Doyle, T. W., W. H. Conner, et al. (2007). Chapter 15 - Assessing the impact of tidal flooding and salinity on long-term growth of baldcypress under changing climate and riverflow, Springer, Po Box 17, 3300 Aa Dordrecht, Netherlands.
Dumas, C., A. Mollica, et al. (2008). "Checking graphite and stainless anodes with an experimental model of marine microbial fuel cell." Bioresource Technology 99(18): 8887-8894.
21
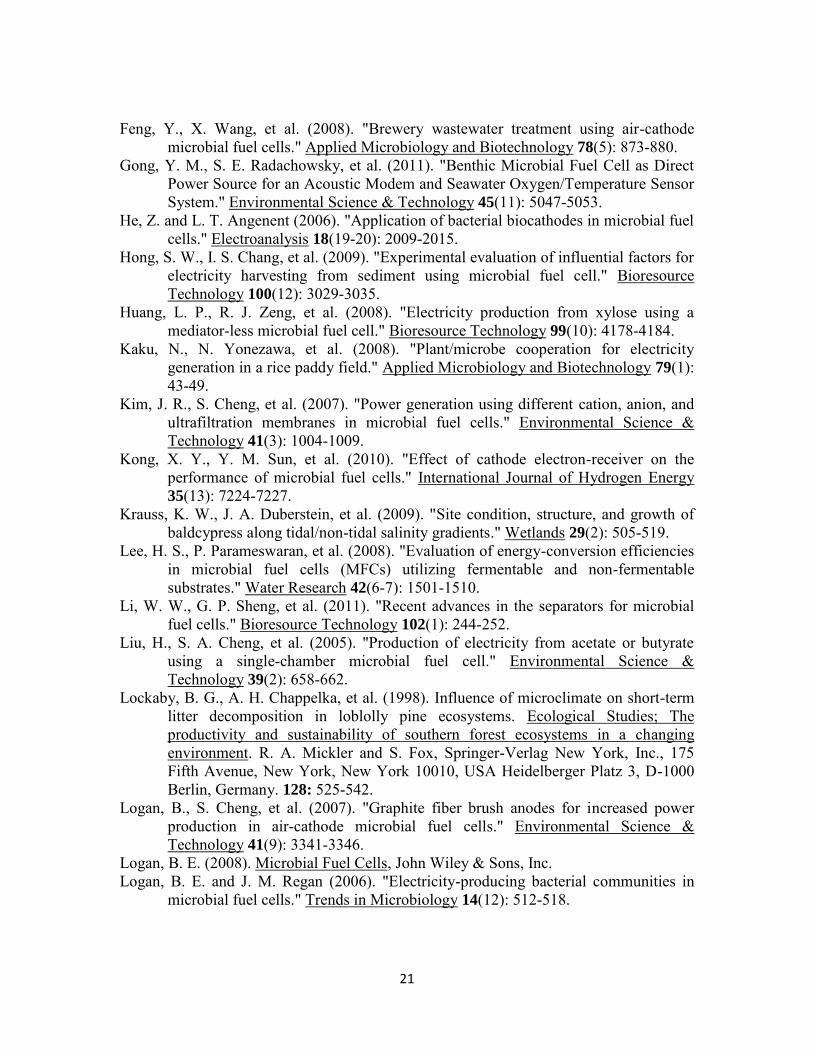
Feng, Y., X. Wang, et al. (2008). "Brewery wastewater treatment using air-cathode microbial fuel cells." Applied Microbiology and Biotechnology 78(5): 873-880.
Gong, Y. M., S. E. Radachowsky, et al. (2011). "Benthic Microbial Fuel Cell as Direct Power Source for an Acoustic Modem and Seawater Oxygen/Temperature Sensor System." Environmental Science & Technology 45(11): 5047-5053.
He, Z. and L. T. Angenent (2006). "Application of bacterial biocathodes in microbial fuel cells." Electroanalysis 18(19-20): 2009-2015.
Hong, S. W., I. S. Chang, et al. (2009). "Experimental evaluation of influential factors for electricity harvesting from sediment using microbial fuel cell." Bioresource Technology 100(12): 3029-3035.
Huang, L. P., R. J. Zeng, et al. (2008). "Electricity production from xylose using a mediator-less microbial fuel cell." Bioresource Technology 99(10): 4178-4184.
Kaku, N., N. Yonezawa, et al. (2008). "Plant/microbe cooperation for electricity generation in a rice paddy field." Applied Microbiology and Biotechnology 79(1): 43-49.
Kim, J. R., S. Cheng, et al. (2007). "Power generation using different cation, anion, and ultrafiltration membranes in microbial fuel cells." Environmental Science & Technology 41(3): 1004-1009.
Kong, X. Y., Y. M. Sun, et al. (2010). "Effect of cathode electron-receiver on the performance of microbial fuel cells." International Journal of Hydrogen Energy 35(13): 7224-7227.
Krauss, K. W., J. A. Duberstein, et al. (2009). "Site condition, structure, and growth of baldcypress along tidal/non-tidal salinity gradients." Wetlands 29(2): 505-519.
Lee, H. S., P. Parameswaran, et al. (2008). "Evaluation of energy-conversion efficiencies in microbial fuel cells (MFCs) utilizing fermentable and non-fermentable substrates." Water Research 42(6-7): 1501-1510.
Li, W. W., G. P. Sheng, et al. (2011). "Recent advances in the separators for microbial fuel cells." Bioresource Technology 102(1): 244-252.
Liu, H., S. A. Cheng, et al. (2005). "Production of electricity from acetate or butyrate using a single-chamber microbial fuel cell." Environmental Science & Technology 39(2): 658-662.
Lockaby, B. G., A. H. Chappelka, et al. (1998). Influence of microclimate on short-term litter decomposition in loblolly pine ecosystems. Ecological Studies; The productivity and sustainability of southern forest ecosystems in a changing environment. R. A. Mickler and S. Fox, Springer-Verlag New York, Inc., 175 Fifth Avenue, New York, New York 10010, USA Heidelberger Platz 3, D-1000 Berlin, Germany. 128: 525-542.
Logan, B., S. Cheng, et al. (2007). "Graphite fiber brush anodes for increased power production in air-cathode microbial fuel cells." Environmental Science & Technology 41(9): 3341-3346.
Logan, B. E. (2008). Microbial Fuel Cells, John Wiley & Sons, Inc. Logan, B. E. and J. M. Regan (2006). "Electricity-producing bacterial communities in
microbial fuel cells." Trends in Microbiology 14(12): 512-518.

22
Mohan, S. V., R. Saravanan, et al. (2008). "Bioelectricity production from wastewater treatment in dual chambered microbial fuel cell (MFC) using selectively enriched mixed microlora: Effect of catholyte." Bioresource Technology 99(3): 596-603.
Nevin, K. P., H. Richter, et al. (2008). "Power output and columbic efficiencies from biofilms of Geobacter sulfurreducens comparable to mixed community microbial fuel cells." Environmental Microbiology 10(10): 2505-2514.
Park, D. H. and J. G. Zeikus (2002). "Impact of electrode composition on electricity generation in a single-compartment fuel cell using Shewanella putrefaciens." Applied and Environmental Microbiology 59(1): 4.
Rabaey, K., N. Boon, et al. (2005). "Microbial phenazine production enhances electron transfer in biofuel cells." Environmental Science & Technology 39(9): 3401-3408.
Rabaey, K., N. Boon, et al. (2004). "Biofuel cells select for microbial consortia that self-mediate electron transfer." Applied and Environmental Microbiology 70(9): 5373-5382.
Rabaey, K., G. Lissens, et al. (2003). "A microbial fuel cell capable of converting glucose to electricity at high rate and efficiency." Biotechnology Letters 25(18): 1531-1535.
Richter, H., K. P. Nevin, et al. (2009). "Cyclic voltammetry of biofilms of wild type and mutant Geobacter sulfurreducens on fuel cell anodes indicates possible roles of OmcB, OmcZ, type IV pili, and protons in extracellular electron transfer." Energy & Environmental Science 2(5): 506-516.
Rothermich, M. M., L. A. Hayes, et al. (2002). "Anaerobic, sulfate-dependent degradation of polycyclic aromatic hydrocarbons in petroleum-contaminated harbor sediment." Environmental Science & Technology 36(22): 4811-4817.
Song, T. S., Z. S. Yan, et al. (2011). "Construction and operation of freshwater sediment microbial fuel cell for electricity generation." Bioprocess and Biosystems Engineering 34(5): 621-627.
Stein, N. E., K. J. Keesman, et al. (2011). "Kinetic models for detection of toxicity in a microbial fuel cell based biosensor." Biosensors & Bioelectronics 26(7): 3115-3120.
Ter Heijne, A., H. V. M. Hamelers, et al. (2006). "A bipolar membrane combined with ferric iron reduction as an efficient cathode system in microbial fuel cells." Environmental Science & Technology 40(17): 5200-5205.
Tiner, R. W. (2003). "Geographically isolated wetlands of the United States." Wetlands 23(3): 494-516.
Velasquez-Orta, S. B., T. P. Curtis, et al. (2009). "Energy From Algae Using Microbial Fuel Cells." Biotechnology and Bioengineering 103(6): 1068-1076.
Zhuang, L., Y. Zheng, et al. (2012). "Scalable microbial fuel cell (MFC) stack for continuous real wastewater treatment." Bioresource Technology 106: 82-88.
Zuo, Y., S. Cheng, et al. (2008). "Ion exchange membrane cathodes for scalable microbial fuel cells." Environmental Science & Technology 42(18): 6967-6972.

23
CHAPTER III
MATERIAL AND METHODS
Two controlled laboratory experiments and one field experiment using detritus materials
from a typical cypress-tupelo wetland were conducted. Dual-chamber reactors and
column reactors were used in the two controlled experiments to examine MFCs operating
in aqueous phases only and aqueous-solid phases, respectively. Dual-chamber reactors
were used to determine the optimal energy production level of dissolved organic
substrates and evaluate two biogeochemical factors (leaf species and concentrations of
extracts) on the performance of MFCs. Water extracts of three common common tree
species, including baldcypress (Taxodium distichum), water tupelo (Nyssa aquatica) and
longleaf pine (Pinus palustris), were used as organic substrates. Column reactors with
aqueous-solid phases mimicked actual field conditions and were used to study effects of
physical parameters such as electrode distance and operating temperature. In the field
study, the power output of two in-situ MFCs installed in a cypress-tupelo wetland in
coastal South Carolina along with water quality during the inundated period between
October and May were recorded. Details of the experimental procedures are described
below.
3.1 Dual-chamber Reactor Configuration and Operation
Dual-chamber reactors with aqueous phase only were used to examine the optimal
electrical energy production from foliar litter extracts (Figure 3.1). Anode and cathode
chambers (0.2 L cubes) were made of plexiglass. Each chamber held 0.18 L of solution,

24
and the two chambers were separated by a 16 cm2 anion exchange membrane
(International Membrane Co. Ringwood, NJ, USA). The membrane was pretreated in 10
g/L NaCl (Fisher Scientific, USA) solution for 1 day and rinsed with deionized water
before assembling. Air was continuously pumped into the cathode chamber during the
experiment. A magnetic stirrer was used to keep the anode compartment solution
completely mixed. Each anode was a graphite fiber brush (Mills-Rose Co., Mentor, OH)
with a surface area of 0.22 m2, which was pretreated by immersing in deionized water for
one day before use. The cathode was a 10 cm2 carbon cloth coated with a Pt catalyst
(0.5mg/cm2, 10% Pt, Fuel Cell Earth Co. Stoneham, MA, USA) on one side. One
thousand ohm resistors were used to complete the circuits.

25
Figure 3. 1 Configuration of the dual-chamber MFC reactor for measurement of substrates’ effect and change.

26
The dual-chamber reactors were inoculated with anaerobic digester sludge (see Culture
and Media below), which are common inoculums used in other MFC studies (Lobato et
al. 2012). An inoculum of 0.18 L containing both 20% sludge by volume and nutrient
media was fed into the anode compartment for the first time. The cathode chamber was
fed with 100 mM PBS. The nutrient media was fed to the anode part after one week or
when voltage output decreased from an obvious peak. Until voltage outputs were stable at
over 500 mV, the nutrient media was refreshed weekly to maintain energy production
levels. After inoculation, the reactor was fed with litter extracts, in lieu of nutrient media.
After each feeding of solution, litter extracts were purged with nitrogen gas for 10
minutes to deplete the oxygen, and then withdrawn into the anode chamber, modified into
100 mM PBS instead of nutrient media. Voltage of each type of material was recorded till
the voltage output fell below 0.05 V from peak value with the interval of 5 minutes.
3.2 Culture and Medium
The digest sludge from an anaerobic digester from the Greenville, SC Wastewater
Treatment Plant was used to inoculate the anode compartment of the dual-chamber MFC.
Anaerobic sludge is widely used as the inoculum in MFC studies (Logan 2004), because
of the high density of microbes. In the inoculation, 0.5g/L NaAc was prepared as a
substrate in phosphorous buffer solution (PBS) containing 5.38g/L Na2HPO4 and 8.66g/L
NaH2PO4 (Fisher Scientific, USA) as the nutrient media. All chemicals were reagent

27
grade from Fisher Scientific, USA. Fresh litter was collected using five 0.5 m × 0.5 m
litterfall traps with 1 mm mesh fiberglass screen bottoms, which were randomly placed in
Crabhual Swamp, a forested wetland on Hobcaw Barony near Georgetown, SC. The
traps were elevated 1 m to prevent inundation during flooding. In the test, fresh litter was
dried at 70 to 80° C for 2 to 3 days, 12 g of each litter type was ground and sieved through
a 1 mm pore size sieve, and then soaked in 0.4 L of deionized water at 18 to 22° C and
shaken for 4 hours. The initial litter extract fed into the dual-chamber reactor was filtered
from the shaken sample (0.45 um Supor450, Pall Corporation). To measure the effect of
concentration factor on the performance of MFCs, a series of diluted cypress litter extract
were fed into the dual-chamber reactors. The initial litter extract was diluted for 10, 50,
100, 125 times. PBS supernatants were added into the supernatant to the concentration of
100mM as the single test substrates in the experiment, respectively. To remove the
dissolved oxygen, the solutions fed to anode compartment were purged with nitrogen gas
for 15 minutes. All reactors were operated at 28±2° C in the laboratory.
3.3 Column Reactor Configuration
The column reactor mimicked field conditions with a solid phase and aqueous inter-phase.
Transparent plexiglass columns (10 cm inside diameter, 30 cm height) were filled with a
5 cm granule and sand layer at the bottom (Figure 3.2). A tube was connected from the
bottom and hung to a desired level to control its water level. Graphite felt (Weaverind,
Denver, Pennsylvania, USA) of 10 cm2 area and 0.5 cm thickness, as anode, was buried 5
cm below the water-soil interface. The cathode was a 10 cm2 carbon cloth coated with a

28
Pt-catalyst floating on the water surface. A ten thousand ohms resistor was used to
complete the circuit. In another group of column reactors, electrode distance was tested
as a controllable factor. In the sMFC, water level (on which the cathode floats), and
anode depth under the sediment surface both can contribute to internal resistance and
further affect the performance of the sMFC. Temperature effects were tested and
compared under indoor and natural outdoor condition.

29
Figure 3. 2 Configuration of column reactor for measurement of temperature and electrode distance effects

30
3.3.a. Effect of Temperature Fluctuation
Temperature in coastal forested wetlands in South Carolina can fluctuate over 10° C a day
(Chow et al. 2012). In order to examine the effects of temperature fluctuation on MFC
performance, two groups of MFC column reactors were placed in indoor and shaded
outdoor areas for 10 days in the month of August. Temperature data loggers were buried
next to the anodes and were used to record temperature changes. The temperature of the
indoor columns fluctuated between 26 and 30° C while the temperature of outdoor
columns fluctuated between 20 and 30° C. Voltage outputs were recorded at 15 minute
intervals with voltage dataloggers.
3.3.b. Water Level and Electrode Distance
The effects of depth of anode and water levels were examined using column reactors. For
the electrode depth experiment, graphite fiber brush anodes (0.88 m2) were buried at 1 cm,
5 cm, and 15 cm below the soil-water interface in three columns. A Pt-catalytic carbon
cloth cathode floated on the surface of the water (5 cm deep). For the water level
experiment, another three columns were filled to different water levels (H=5 cm, 10 cm,
and 35 cm) above the soil-water interface, with anodes buried 1 cm below the soil-water
interface. Voltage of 10 kΩ resistors in all the circuits was recorded. The experiment was
operated under room temperature for 10 days. For the electrode and water depth studies,
only fresh soil without litter addition was tested. For all the column reactors, the internal
resistances were measured using a polarization curve once the voltage became stable for

31
two days. The series of loads used in internal resistance measurement were 100 kΩ, 30
kΩ, 10 kΩ, 3 kΩ, 600 Ω, 100 Ω, 20 Ω, 4 Ω, and 0.8Ω.
3.4 In-situ MFC Configuration
In-situ MFCs (Figure 3.3) were installed in November 2010 in a freshwater forested
wetland on Hobcaw Barony near Georgetown, SC. The site was chosen because it has
been well studied in terms of vegetation types and density, productivity and litterfall, and
nutrient dynamics (Busbee et al. 2003; Chow et al. 2012). The MFCs were composed of
an array of graphite rods (diameters of 0.6 cm and 0.30 m in length) (Poco EDM, Saturn
Industries, Hudson, NY, USA) as the anodes with a total surface area of 246 cm2 and an
array of graphite fiber brushes (Mills-Rose Co., Mentor, OH) as cathodes with a total
surface area of 0.66 m2. The anodes were buried about 5 cm below the soil-water
interface, while the cathodes floated freely on the water surface. A one hundred ohm
resistor was used to complete the circuit. Voltage output was recorded every 30 minutes
by a data logger (VR-71, T&D Corporation, U.S). In addition, surface and soil pore
water samples were collected weekly for dissolved nutrient analyses and litterfall was
collected monthly from October 2010 to May 2011. Site description, nutrient analyses,
and litterfall collection details can be found in (Chow et al. 2012)

32
Figure 3. 3 Configuration of sediment MFC in Crabhual Swamp

33
3.5 Analytical Methods
3.5.a Electrochemical Analysis
Power output was recorded with a data logger (Keithley 2700, Keithley Instruments Inc.
City, State, USA) as a function of time. The calculation of power and current for the
polarization curve follows Ohm’s Law:
I=UR and P=UI
Where I is current
U is voltage reading of the load
R is resistance of the load, and
P is power.
In all of the dual chamber reactors, power is normalized to cathode surface area (Acathode),
because the performance depends on the cathode area, compared to the large area of the
anode (Logan et al. 2007), so the power density (PAVG) is PAVG=P/Acathode. In the
column reactors and in-situ MFCs, however, the power density depends on the anode’s
project surface area, PAVG=P/Aanode.

34
3.5.b Chemical Analysis
Biological oxygen demand for 5 days (BOD5) of litter extracts before and after MFC
treatment were measured according to standard method #5210 (APHA 1992). The BOD
used for electricity generation is calculated as follows:
∑
where BOD is measured in mg
U is voltage output over the resistor
R is resistance
MO2 is the molecular weight of oxygen
F is Faraday’s constant
bes = 4 for the number of electrons exchanged per mole of oxygen
V is the volume of feeding liquid.
Dissolved organic carbon (DOC) and total dissolved nitrogen (TDN) were analyzed from
filtered samples (0.45 um Supor450, Pall Corporation) using a combustion technique
with a TOC-5000 TOC/TN Analyzer (Shimazu Corporation). Ultraviolet absorbance
from 200 nm to 700 nm was measured using a quartz cell with a 1 cm path length in a
UV-1800 spectrophotometer (Shimadzu Corporation). The instrument was zeroed using
milli-Q water as a blank. Specific ultraviolet light absorbance at 254 nm (SUVA) was
calculated as UV-254/DOC, expressed in L mg-C-1 m-1. The spectral slope ratio was
calculated as the ratio of two spectral slopes between 275-295 nm and 350-400, which
was correlated with molecular weight (MW) of DOC and to photochemically-induced

35
shifts in MW (Helms et al. 2008). The E2/E3 ratio was calculated as absorbance at 254
nm divided by absorbance at 365 nm, which is negatively correlated with hydrogen
peroxide (H2O2) (Dalrymple et al. 2010). pH values of extracts before reaction and the
liquid phase of column reactors were measured (Accumet, XL60).
3.5.c Fluorescence Spectroscopy
The excitation-emission matrix (EEM) was measured in a 1 cm cuvette with a
spectrofluorometer RF5301 (Shimazu Corporation). The samples were diluted to
ultraviolet absorbrance at 254 nm absorbance between 0.2 and 0.3 before fluorescence
measurement. A Xenon excitation source was used in the spectrometer and the hand-pass
of both excitation and emission were set to an interval of 5 nm. The EEM of each sample
was scanned over the excitation wavelength from 240 nm to 450 nm steps with 5 nm
stand emission wavelength from 350 nm to 550 nm with 1 nm steps.
References
Busbee, W. S., W. H. Conner, et al. (2003). "Composition and aboveground productivity of three seasonally flooded depressional forested wetlands in coastal South Carolina." Southeastern Naturalist 2(3): 335-346.
Chow, A. T., J. Dai, et al. (2012). "Dissolved organic matter and nutrient dynamics of a coastal freshwater forested wetland in Winyah Bay, South Carolina." Biogeochemistry.
Dalrymple, R. M., A. K. Carfagno, et al. (2010). "Correlations between dissolved organic matter optical properties and quantum yields of singlet oxygen and hydrogen peroxide." Environmental Science & Technology 44(15): 5824-5829.

36
Helms, J. R., A. Stubbins, et al. (2008). "Absorption spectral slopes and slope ratios as indicators of molecular weight, source, and photobleaching of chromophoric dissolved organic matter." Limnology and Oceanography 53(3): 955-969.
Lobato, J., P. Canizares, et al. (2012). "An evaluation of aerobic and anaerobic sludges as start-up material for microbial fuel cell systems." New Biotechnology 29(3): 415-420.
Logan, B., S. Cheng, et al. (2007). "Graphite fiber brush anodes for increased power production in air-cathode microbial fuel cells." Environmental Science & Technology 41(9): 3341-3346.

37
CHAPTER IV
RESULTS AND DISCUSSION
4.1. Results
4.1.a. Characterization of Litter Extracts
After 5 days of BOD tests (BOD5), significant differences in biodegradability emerged
among the three types of litter extracts (Table 4.1). The BOD5 concentration of pine,
tupelo, and cypress extracts were 144.64 mg/L, 80.55 mg/L, and 38.14 mg/L,
respectively. Dissolved organic carbon (DOC) as the major component of DOM in the
extracts had concentrations of 100.04 mg/L, 95.67 mg/L, and 42.55 mg/L, respectively,
extracted from each gram of dry litter material. However, cypress extracts contained the
most total nitrogen at 2.12 mg/L, followed by pine at 0.94 mg/L and tupelo at 0.93 mg/L.
As the result, ratios of carbon to nitrogen were 23.45, 120.72, and 125.28 for cypress,
tupelo, and pine, respectively. To compare the difference of utilization among the three
types of litter extracts, all feeding solutions were diluted to approximately 50 mg/L to
minimize the concentration factor. Electricity generation was a result of BOD5
consumption (Table 4.2). BOD5 of pine, cypress, and tupelo extracts decreased from,
43.39 mg/L to 24.28 mg/L, 45.77 mg/L to 18.18 mg/L, and 48.33 mg/L to 26.04 mg/L,
respectively. Concentration of DOC as the major substrate component had a similar
change, decreasing from 30.12 mg/L to 25.46 mg/L, 51.06 mg/L to 24.56 mg/L, and
57.04 mg/L to 47.54 mg/L, for pine, cypress, and tupelo, respectively. However, as
shown in Table 4.2, spectral slope ratio increases significantly only for tupelo and

38
cypress. Lower SUVA can be observed after the MFC process only for cypress and pine.
E2/E3 dropped for all the materials.
Table 4. 1 Characterization of three litter extracts. The parameters were based on one gram of dry mass mixed with 330 ml deionized water, shaken for 4 hours at room temperature.
type cypress pine tupelo
DOC
(mg/L) 42.55 ± 1.97 100.40 ± 0.69 95.67 ± 1.41
TN (mg/L) 2.12 ± 0.13 0.94 ± 0.03 0.93 ± 0.06
TC/TN
molar
ratio
23.45 ± 0.32 125.28 ± 3.74 120.72 ± 6.74
BOD5
(mg/L) 38.14 ± 0.64 144.64 ± 2.32 80.55 ± 2.18

39
Table 4. 2 Characterization of feeding extracts before and after microbial fuel treatments. All substrates were diluted to about 50 mg/L as BOD5 before MFC treatments.
type cypress pine tupelo
condition before treatment
after treatment change before
treatment after treatment change before
treatment after treatment change
E2/E3 7.81 ± 0.14
6.19 ± 0.22 -20.73% 13.87 ±
0.32 7.90 ± 0.14
-43.04%
5.08 ± 0.05
3.60 ± 0.01
-29.18%
SR 0.67 ± 0.02
0.94 ± 0.03 41.90% 1.63 ±
0.03 1.73 ± 0.06 6.16%a 0.62 ±
0.01 0.85 ± 0.02 36.10%
SUVA (L
mg-C-1
m-1)
0.79 ± 0.01
1.77 ± 0.03 123.65% 1.19 ±
0.02 1.81 ± 0.06 52.35% 3.52 ±
0.12 3.41 ± 0.07
-3.26%a
DOC
(mg/L)
51.06 ± 2.36
24.56 ±0.76 -51.90% 30.12 ±
0.02 25.46 ±
0.70 -
15.46% 57.40 ±
0.84 47.54 ±
1.31 -
17.17%
BOD5
(mg/L)
45.77 ± 0.60
18.18 ± 1.59 -60.28% 43.39 ±
0.97 24.28 ±
1.87 -
44.04% 48.33 ±
0.72 26.04 ±
0.84 -
46.12%
a: the change is not significantly important according to statistical calculation
Comparing the fractional fluorescence EEM matrix between the feeding extracts before
and after MFC reaction shows that the maximum fluorescence index of pine substrate
was 1451 AU/ (mg C/L) existing at intermediate excitation wavelength and shorter
emission wavelength (260~280 nm, <380 nm), and decreased to 785 AU/ (mg C/L) in the
same region (Figure 4.1). However, another peak in region of 240~260 nm excitation
wavelength and 420 to 450 wavelength increased from 295 AU/ (mg C/L) to 464 AU/
(mg C/L). For cypress extracts, the peaks increased from 99 AU/ (mg C/L) to 207 AU/
(mg C/L) and 70 AU/ (mg C/L) to 200 AU/ (mg C/L), respectively, in the same region as
above. There was another obvious increase in the region of 275~300 nm excitation
wavelength and 410-460 emission wavelength from 54 AU/ (mg C/L) to 206 AU/ (mg
C/L). The peaks of tupelo extracts increased in three regions similar to cypress.

40
Before MFC Reaction After MFC Reaction
Figure 4. 1 Fractional fluorescence EEMs of the organic matter feeding extracts before and after the reaction in dual-chamber MFC reactors fed with 50mg/L as BOD5 diluted
litter extracts.
360 380 400 420 440 460 480 500 520 540
250
300
350
400
450
Emission (nm)
Excita
tio
n (
nm
)
0
40.00
80.00
120.0
160.0
200.0
240.0
360 380 400 420 440 460 480 500 520 540
250
300
350
400
450
Emission (nm)
Excita
tio
n (
nm
)
0
40.00
80.00
120.0
160.0
200.0
240.0
360 380 400 420 440 460 480 500 520 540
250
300
350
400
450
Emission (nm)
Excita
tio
n (
nm
)
0
200.0
400.0
600.0
800.0
1000
360 380 400 420 440 460 480 500 520 540
250
300
350
400
450
Emission (nm)
Excitation
(nm
)
0
200.0
400.0
600.0
800.0
1000
360 380 400 420 440 460 480 500 520 540
250
300
350
400
450
Emission (nm)
Excitation
(nm
)
0
60.00
120.0
180.0
240.0
300.0
360.0
360 380 400 420 440 460 480 500 520 540
250
300
350
400
450
Emission (nm)
Excitation
(nm
)
0
60.00
120.0
180.0
240.0
300.0
360.0
Cypress extracts
Pine extracts Tupelo extracts

41
4.1.b. Energy Generation from Different Litter Substrates
Stable energy generation curves were considered as effective start up after inoculation
with the three types of litter extracts. The plateaus of the three curves (Figure 4.2)
indicate cypress extracts generated the most electricity on the stable power density level
of 320 mW/m2; tupelo and pine extracts supported stable power density at 240 mW/m2
and 210 mW/m2, respectively. All three types of substrates reacted rapidly after injections
into the reactor within 3 to 5 hours. However, the cypress extracts had a shorter lag time
of about 5 hours than the other two types for 20 hours.

42
Figure 4. 2 Power density curves of dual-chamber MFCs using cypress, tupelo, and pine extracts as substrates. All MFC reactions were fed with a concentration of 50 mg/L BOD5
as an initial value diluted from each original extract.
Despite having the lowest peak power density, pine extracts contained the most electrons
to generate electricity in terms of dry litter mass as 33.32 mg/L as BOD5, followed by
tupelo and cypress at 27.92 mg/L and 18.40 mg/L, respectively. The energy production
efficiency was calculated as 48%, 35%, and 23% for cypress, tupelo, and pine extracts,
respectively. The portion of BOD5 used by microbial growth was 4.58 mg/L, 9.23 mg/L,
and 30.37 mg/L (Figure 4.3).
0 10 20 30 40 50 60 70
0
40
80
120
160
200
240
280
320
360
Pine Extract
Time (hr)
Pow
er
Density (
mW
/m2)
Cypress Extract Tupelo Extract

43
Figure 4. 3 Fractional energy distribution of three types of leaf extracts during MFC treatment in terms of BOD5 per gram of dry litter mass within dual-chamber reactors fed
with leaf extracts separately.
4.1.c. Energy Production as a Function of Concentration
Since they were the most productive among materials tested, cypress extracts were
chosen to investigate energy generation as a function of concentration. The results
indicate that within 20 hours, 45.7 mg/L (1:10) as BOD5 can still generate energy at the
highest stable level in a series of concentration-decreasing tests, and the maximum
voltage output began to drop when the concentration was lower than 9.14 mg/L (1:50) as
0
20
40
60
80
100
120
140
Tupelo Pine
Electricity Generation
Microbial Growth
Residual BOD
BO
D5
(m
g/L
)
Cypress
5

44
BOD5 (Figure 4.4). The sensitivity of the energy generation reaction did not depend on
the concentration significantly as shown in the graph; all of the reactors’ voltage outputs
increased over 200 mV within 2 hours and kept increasing if the substrate concentration
was adequate. Also, the peak value of power density increases with BOD5 concentration
increasing till 45.7 mg/L and then remaining stable (Figure 4.5). Power densities were
observed to recover to 300-330 mW/m2 immediately and continuously for three cycles
with cypress extracts as substrate.
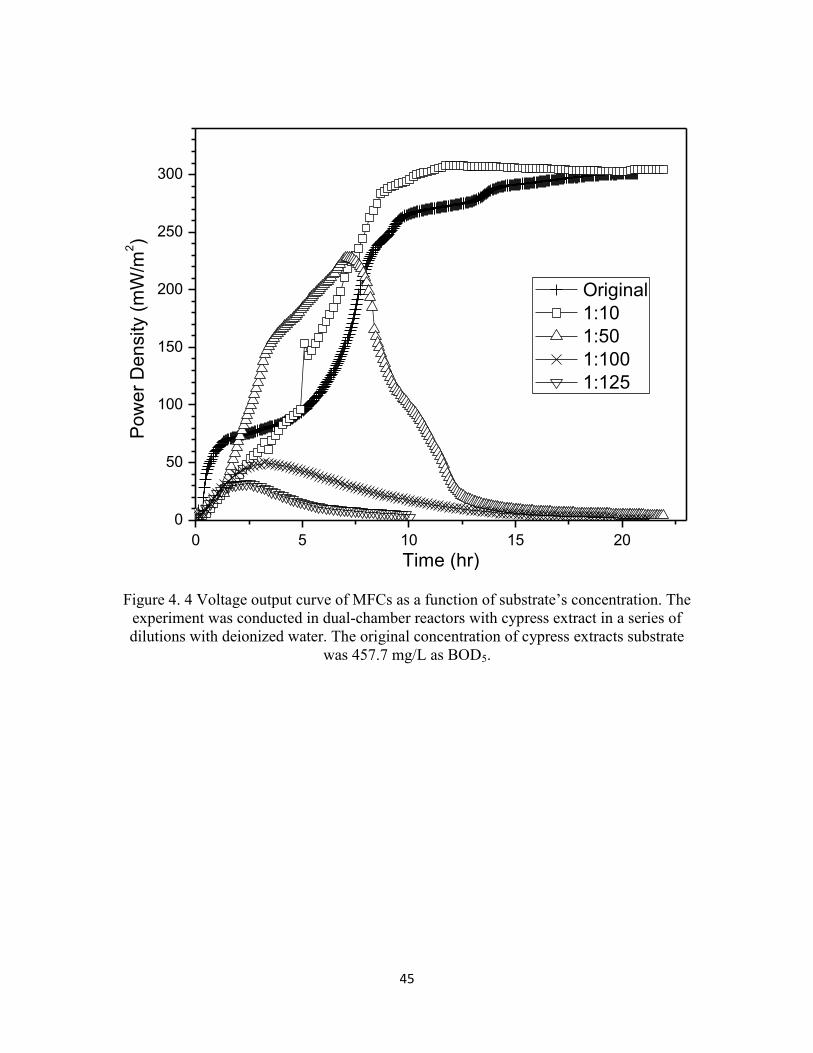
45
Figure 4. 4 Voltage output curve of MFCs as a function of substrate’s concentration. The experiment was conducted in dual-chamber reactors with cypress extract in a series of dilutions with deionized water. The original concentration of cypress extracts substrate
was 457.7 mg/L as BOD5.
0 5 10 15 20
0
50
100
150
200
250
300
Po
we
r D
en
sity (
mW
/m2)
Time (hr)
Original
1:10
1:50
1:100
1:125

46
Figure 4. 5 Reproductive power density generated using 50 mg/L as BOD5 of cypress extract as the substrate in the dual-chamber reactors. Feeding substrate was replenished
once the power density dropped below 10 mW/m2.
0 50 100 150 200
0
50
100
150
200
250
300
350
400Substrate
replenishmentSubstrate
replenishment
Po
we
r D
en
sity (
mW
/m2)
Time (hrs)
Substrate
addition

47
4.1.d. Energy Production as a Function of Temperature and Electrode Distance
Power densities had a positive relationship with temperature, increasing in the range from
20° C to 30° C in the outdoor group, the amplitude of the power density was from 8.84 to
15.31 mW/m2. The indoor columns were maintained under a higher and less oscillating
temperature of 26° C to 30° C, and they generated a power density from 16.65 to 19.25
mW/m2. The average power density of the indoor group was 18.41 mW/m2, which was
higher than those of outdoor group of 13.02 mW/m2.
A maximum power density of 2.57 mW/m2 occurred in the column with a 1 cm deep
anode and 5 cm deep water. The internal resistances of the column with the anode depth
(D) of -10 cm, -5 cm, -1 cm were 10.9 kΩ, 8 kΩ, and 7.5 kΩ, respectively, when the
water level of 5 cm (H). The internal resistances of the column with a water level (H) of 5
cm, 10 cm, 35 cm were 7.5 kΩ, 8.7 kΩ, and 29.7 kΩ, respectively, when anode depth (D)
was 1 cm, as shown in Table 4.3.
Table 4. 3 Effects of electrode distance on internal resistance of MFC.
Column unit I II III IV V VI
Anodea (cm) -1 -1 -1 -1 -5 -10
Cathodea (cm) 5 10 35 5 5 5
Electrode Distance (cm) 6 11 36 6 10 15
Internal R (kΩ) 7.5 8.7 29.7 7.5 8.0 10.9
a: value of electrode depth relative to water-sediment interface

48
4.1.e. Field sMFC Performance
Voltage output, air temperature, and water level data were collected from November
2010 to May 2011. The peak power value reached 2.7 mW/m2 during January while the
water level was around 80 cm. During January, air temperature fluctuated significantly
from -6 to nearly 20° C (Figure 4.6), while the water level was relatively stable at 35 cm.
The power output changed in conjugation with air temperature, but with a 0 to 8 hour lag.
The power output of the sMFC changed significantly from 0.05 to 2.05 mW/m2. When
air temperature dropped to and below 0°C, power density was barely generated. A thin
ice layer observed during that time intercepted the positive charge transfer in the aqueous
phase by freezing the cathode in the ice, but the power density quickly reached the peak
value right after the air temperature rose above the freezing point.

49
(a) (b) Figure 4. 6 Power density and air temperature in the field where the sMFC were installed. The voltage and the air temperature were recorded every 15 minutes. The effect of daily
temperature oscillation is shown in (a) while (b) shows the temperature effect on a weekly level.
0.6
0.8
1.0
1.2
1.4
1.6
1.8
2.0
Power Density
Pow
er
Density (
mW
/m2)
01/2
6/2
011 0
5:2
9'1
4
01/2
6/2
011 1
0:2
9'1
4
01/2
6/2
011 1
5:2
9'1
4
01/2
6/2
011 2
0:2
9'1
4
01/2
7/2
011 0
1:2
9'1
4
01/2
7/2
011 0
6:2
9'1
4
01/2
7/2
011 1
1:2
9'1
4
01/2
7/2
011 1
6:2
9'1
4
01/2
7/2
011 2
1:2
9'1
4
01/2
8/2
011 0
2:2
9'1
4
01/2
8/2
011 0
7:2
9'1
4
01/2
8/2
011 1
2:2
9'1
4
01/2
8/2
011 1
7:2
9'1
4
01/2
8/2
011 2
2:2
9'1
4
01/2
9/2
011 0
3:2
9'1
4
01/2
9/2
011 0
8:2
9'1
4
0
5
10
15
20
Air Temperature
Air
Tem
pera
ture
(oC
)
Time
0.0
0.5
1.0
1.5
2.0
Power Density
Pow
er
Density (
mW
/m2)
01/12/2011-10
-5
0
5
10
15
20
01/08/201101/29/2011
01/24/201101/20/2011
01/16/2011
Air Temperature
Air
Tem
pera
ture
(oC
)
Date

50
4.2. Discussion
4.2.a. Effect of Substrate Concentration on Energy Generation
Substrate concentration is one of the determinative factors to microbial activity, which
will further affect electricity generation (Jadhav et al. 2009). In the dual-chamber reactor
experiment, peak power density increased as the concentration of BOD5 increased in the
cypress extracts until 45.7 mg/L (Figure 4.4). However, this limit may depend on the
system configuration of specific reactors (Li et al. 2009; Li et al. 2010) or natural field
biogeochemical characterization. Acetate sodium was also tested as a control substrate in
the same configured reactors. The MFC produced a maximum power density of 320
mW/m2 compared to 310 mW/m2 using 2 g/L acetate. The result shows that cypress
extract can support a power level as high as the acetate’s, indicating that cypress extract
is a perfect substrate to operate MFC systems. The results of the replenishment of
substrate to the reactors showed that peak power density returns to the same level as
previous cycles, demonstrating that cypress extract is reproductive and a considerable
natural fuel source to power the field device for the long term, in terms of the annual
organic matter input from litter fall. Therefore, the annual cypress litter fall can supply
excellent DOM as substrate to maintain the operation of sMFC without producing severe
biofilm fouling.

51
4.2.b. Effect of Substrate Species on Energy Generation
In addition to the concentration factor, cypress extracts in a preliminary study exhibited
better performance for electricity generation than did pine and tupelo extracts. Further
examination was conducted in this study to determine the reason. Pine extracts provided
the most amount of energy due to maximum soluble organic carbon content and
biodegradable portion on a dry mass basis. However, as shown in Figure 4.3, cypress
extracts served as the most efficient substrate considering that of 48% of the BOD5 can
be utilized for electricity generation with the highest power density. Molecules of less
aromatic and larger molecule weight were dominant in cypress extracts, and may
correspond to the highest power density according to the observation of low SUVA and
high SR. Pine substrates were dominated by soluble microbial by-product-like materials,
with a peak value of 7 to 15 times higher than other species, explaining the less
biodegradability in BOD5 utilization; and the more biodegradable cypress extracts
showed a 100% increase at this peak. More than 40% of dissolved BOD5 cannot be used
by the electricity generation process for all examined litter types, indicating there is a
limit to using natural organic matter.
Higher SUVA and SR were observed in the substrate outflow, suggesting MFC reactions
convert larger DOC molecules into smaller but more aromatic fractions through oxidation,
except for the tupelo extracts due to its high initial SUVA (Chow et al. 2008; Helms et al.
2008). More fulvic acid-like materials were formed in the anode compartments after the
MFC reaction for all three kinds of extracts. Humidification is expected to be the major

52
reaction of the natural organic matter within the sediment where the anodes are buried.
Better carbon to nitrogen ratios of cypress extracts may also improve power generation.
Having enough nitrogen is the key nutrient condition for microbial metabolism; the ideal
carbon to nitrogen ratio to grow bacteria is 100:5, a molar ratio close to that of cypress
(Jana et al. 2001).
4.2.c. Effect of Electrode Distance
Electrode distance plays an important role in affecting the performance of MFCs. The
internal resistance is smaller when the electrode distance is shorter in terms of both anode
soil depth and water level on whose surface the cathodes float, which corresponds to
higher power generation. In column II and column V, the soil is almost as conductive as
the water, indicating that the soluble humic substance is advantageous to charge transfer
improving the performance of the soil as an electrolyte media (Thygesen et al. 2009). In
the field, the electrode distance depends on water level changes, but there is no obvious
relationship between power generation and water level (Figure 4.7).

53
Figure 4. 7 Power density, air temperature, and water level for the field sMFC study. Voltage and air temperature were recorded every 15 minutes, and water level was
recorded every hour. Seasonal characteristics are shown on a monthly level.
0.0
0.5
1.0
1.5
2.0
2.5
3.0P
ow
er
Densi
ty (
mW
/m2)
-10
-5
0
5
10
15
20
25
30
35
Air T
em
pera
ture
(oC
)
11/10/2010 12/10/2010 1/10/2011 2/10/2011 3/10/2011 4/10/2011 5/10/2011
-4
-2
0
2
4
Wate
r Leve
l (m
)
Date
54
4.2.d. Effect of Temperature Oscillation on the Performance of MFCs
Studies have shown that microbial activity is highly temperature dependent, with greater
activities at higher temperatures (Hong et al. 2009). However, the impact of temperature
oscillations on MFCs has not been examined, and it is particularly important for in-situ
MFC performance. In the batch column study, power density was higher when the
temperature oscillated daily in a smaller amplitude in the indoor MFC columns than that
of the outdoor MFC columns (Figures 4.8). However, greater oscillation has been shown
to be advantageous to the deposition of the substrate (Dang et al. 2009). In fact, power
density followed the daily temperature oscillation in both indoor and outdoor MFC
columns. The in-situ MFC not only follows the daily dual oscillation of temperature, but
it is also affected by seasonal temperature changes. The daily oscillation of the in-situ
MFC signal is shown from selected days in Figure 4.8(a).

55
Figure 4. 8 Temperature and voltage output were logged in the column reactors in both indoor and outdoor group
In the columns, within the mesophilic temperature range, the power density had a
positive relationship with temperature, due to mesophilic microbial activity increasing
with increasing temperature. Meanwhile, mass transference was enhanced as temperature
increased. Below 13° C, temperature was the major factor affecting the performance of
sMFC in the field. During December 2010 and January 2011, water level was relatively
stable around 80 cm, with about 10% fluctuation. pH and electrical conductivity were
also fairly stable during that time. Average air temperature for the three days of water
19 20 21 22 23 24 25 26 27 28 29 30 31 32
8
10
12
14
16
18
20
indoor column
outdoor column
Po
we
r D
en
sity (
mW
/m2)
Temperature (oC)

56
sampling showed an increasing trend. Power generation increased along with the
temperature, though the DOC concentration and aromaticity become worse for utilization
(Figure 4.9).
Figure 4.9. Field sMFC performance is influenced by temperature, dissolved NOMs concentration, and characteristics. Average power density was calculated according to the
voltage recorded for three days, including the day before and after the field water sampling day.
3.0
3.2
3.4
3.6
3.8
4.0
4.2
4.4
4.6
4.8
Surface Water
Soil Pore Water
SU
VA
(L m
g-C
-1 m
-1)
Nov Dec Jan Feb Mar Apr May0.0
0.2
0.4
0.6
0.8
1.0
1.2
1.4
1.6
Date
Average Power DensityAvera
ge P
ow
er
Density (
mW
/m2)
Date
-5
0
5
10
15
20
25
Air Temperature
Air T
em
pera
ture
(oC
)
Nov Dec Jan Feb Mar Apr May10
15
20
25
30
35
40
45
50
55
Surface Water
DO
C (
mg/L
)
Soil Pore Water

57
Under high temperatures, power generation depends on NOM characteristics. After mid-
January, temperature does not influence sMFC performance significantly when higher
than 13° C (Figure 4.9); power density was maintained at over 1 mW/m2 from February to
April, and then decreased, though air temperature kept increasing. As microbial activity
recovers from low temperatures, DOC concentration and characteristics tend to have a
more significant relationship with power generation. DOC concentration increased due to
a storm event in early February that flushed organic matter from surrounding areas into
the wetland. The process provided considerable substrate for the bacteria. The SUVA of
both aquatic phase and soil phase increased from mid-January indicating that there was a
greater chance that DOC molecules were more aromatic. Aromatic natural organic
matters, like humic acid, have been proven to enhance electron transfer among bacteria
and may result in higher power generation (Thygesen et al. 2009). This relationship can
also be observed in late-Mach, where concentration and aromaticity decreases leading to
power density decreases.
Microbes can survive under water and quickly recover to normal work conditions
following the cold temperature. When air temperature dropped to or below 0° C, power
density was close to 0. A thin ice layer was observed during that time which might
intercept the positive charge transfer in the aqueous phase by freezing the cathode in the
ice. Cold temperature weakened microbial activity significantly, resulting in little energy
output. Power density can reach a higher value right after the air temperature exceeds the
freezing point. The short time peak values on January 20 and 28 (Figure 7b) indicate that

58
the real time substrate concentration is higher at that time due to the fact that the biofilm
does not change much, and that low microbial activity helps the limiting substrate to
reaccumulate around the anodes through dispersion and refresh the anodes’ reaction
condition.
4.2.e. Energy Budget
Between December 2010 and May 2011, each in-situ MFC produced 2893 J/m2 of energy
in an area of 0.075 m2. Total area of the study wetland is 2.4 ha. Therefore, as much as
0.69 GJ of electrical energy might be produced annually from the wetland. Notably, no
energy was generated during June to October because the wetland is dry during that
period (Busbee et al. 2003; Chow, et al. 2012). Comparing the optimal energy
production from the litter extracts, 79.15 J of energy was generated from 1 g of dry
cypress litter mass and 101.44 J from 1 g of tupelo litter. With a make-up of 34% cypress
and 56% tupelo, the 833 g/m2 of litter fall produced by trees in the area (Busbee et al.
2003), 16.74 GJ can be produced theoretically. The current in-situ MFC only harvests
4.12% of the energy from the litter, suggesting higher energy production is feasible if
more effective MFC configurations are applied (like catalytic cathodes and graphite felt
anodes). Although the wetland potentially contains a huge amount of energy, a power
management system will be essential for field sMFC application (Donovan et al. 2008).

59
References
Busbee, W. S., W. H. Conner, et al. (2003). "Composition and aboveground productivity of three seasonally flooded depressional forested wetlands in coastal South Carolina." Southeastern Naturalist 2(3): 335-346.
Chow, A. T., R. A. Dahlgren, et al. (2008). "Relationships between specific ultraviolet absorbance and trihalomethane precursors of different carbon sources." Journal of Water Supply Research and Technology-Aqua 57(7): 471-480.
Dang, C. K., M. Schindler, et al. (2009). "Temperature oscillation coupled with fungal community shifts can modulate warming effects on litter decomposition." Ecology 90(1): 122-131.
Donovan, C., A. Dewan, et al. (2008). "Batteryless, wireless sensor powered by a sediment mcrobial fuel cell." Environmental Science & Technology 42(22): 8591-8596.
Helms, J. R., A. Stubbins, et al. (2008). "Absorption spectral slopes and slope ratios as indicators of molecular weight, source, and photobleaching of chromophoric dissolved organic matter." Limnology and Oceanography 53(3): 955-969.
Hong, S. W., I. S. Chang, et al. (2009). "Experimental evaluation of influential factors for electricity harvesting from sediment using microbial fuel cell." Bioresource Technology 100(12): 3029-3035.
Jadhav, G. S. and M. M. Ghangrekar (2009). "Performance of microbial fuel cell subjected to variation in pH, temperature, external load and substrate concentration." Bioresource Technology 100(2): 717-723.
Jana, B. B., P. Chakraborty, et al. (2001). "Biogeochemical cycling bacteria as indices of pond fertilization: importance of CNP ratios of input fertilizers." Journal of Applied Microbiology 90(5): 733-740.
Li, F., Y. Sharma, et al. (2009). "Microbial fuel cells: the effects of configurations, electrolyte solutions, and electrode materials on power generation." Applied Biochemistry and Biotechnology 160(1): 168-181.
Thygesen, A., F. W. Poulsen, et al. (2009). "The effect of different substrates and humic acid on power generation in microbial fuel cell operation." Bioresource Technology 100(3): 1186-1191.

60
CHAPTER V
CONCLUSIONS AND RECOMMENDATIONS
5.1 Conclusions
The ultimate goal of this study was to determine the efficacy of dissolved organic matters
extracted from leaf litter of three dominant tree species – cypress, tupelo, and pine - in
coastal freshwater forested wetlands on electricity production using MFCs. The
evaluation was accomplished under controlled conditions, and the total reserved energy
was estimated. The effects of physical and biogeochemical factors on the performance of
MFCs in an isolated forested wetland were also examined, including electrode distance,
temperature, and water quality.
Power density produced by the three types of litter extracts per carbon basis was
significantly different. Dissolved organic matters from cypress litter proved to be the
most effective fuel source because 48% of the extracted biodegradable substance was
utilized for electricity generation on the level of 320 mW/m2. However, pine litter has the
highest energy reservation based on dry mass unit. Using the above mentioned extraction
method, 33.32 mg/L as BOD5 substrate could be used for electricity generation in pine
extracts.

61
Under controlled conditions, the performance of MFCs has a positive relationship with
temperature within a range of 20° C to 31° C. Daily temperature oscillation was harmful
to sMFC electricity generation. Less temperature oscillation could enhance power density
generation by 4 mW/m2 on average between 26° C to 30° C. Distance between cathode
and anode electrodes on the other hand has a negative effect.
In the field, however, the situation was more complicated. The temperature was a major
factor influencing power generation, especially when temperatures were below 13° C.
DOMs have more effect on power generation when temperatures were higher than 13° C.
5.2 Recommendations /Future Research Directions
5.2.a. Energy Generation from Litter Biomass
In this study, I demonstrated that dissolved organic matter from litter extract is a potential
substrate for electrical production by MFCs. In order to exploit the energy effectively,
there is need of a better understanding of how to utilize the rest of the huge quantity of
litter in the wetland. Instead of in-situ utilization, it is possible to develop the ex-situ way
to make use of the forest residue, like collecting the litterfall and then feeding the MFC
with treated litter solids.

62
5.2.b. Environmental Factors in Coastal Areas
There is large area of tidal freshwater forested wetland existing along the coastal plain of
the southeastern U.S. There is on-going research on the effect of saltwater intrusion on
the transformation from forested wetland to marsh underway (Conner et al. 2007). With
better electrical conductivity in seawater, MFCs may perform better at powering field
devices. The effect of salinity can be examined in both lab and field experiments. Besides
power generation, examination of microbial communities would be useful to explain
power generation behavior and community change during high salinity periods. MFCs
are applicable to this situation as a biosensor to detect microbial activity related to the
change.
5.2.c. Environmental Impact of In-situ MFCs
When using MFCs, the redox potential is enhanced (Liu et al. 2005) significantly in the
area adjacent to the anode. This process may increase the oxidation of the organic matter.
In this study, the change is characterized by the MFC reactors. However, there is no
control group without MFCs to compare to. In the field, water samples close to the anode
should be collected for comparison purposes, which may provide further understanding
of the impact of the redox change caused by MFCs.

63
References
Conner, W. H., T. W. Doyle, et al. (2007). Ecology of tidal freshwater forested wetlands of the southeastern United States. Dordrecht, The Netherlands, Springer.
Liu, H., S. A. Cheng, et al. (2005). "Production of electricity from acetate or butyrate using a single-chamber microbial fuel cell." Environmental Science & Technology 39(2): 658-662.

64
APPENDIX
Figure A. 1 The study site in Crabhual Swamp in flooding season

65
Figure A. 2 The study site in Crabhual Swamp in dry season

66
Figure A. 3 The litter materials used for feeding the dual-chamber reactors. Ground cypress, pine, and tupelo (from left to right) are at the front. The untreated extracts are in
the 1000 ml bottles. The treated extracts are in the 250 ml bottles.
Cypress Pine Tupelo

67
Figure A. 4 Dual-chamber reactor. Cathode chamber is on the left; anode chamber is on the right.

68
Figure A. 5 Electrodes used in the experiments
Graphite Brush
Carbon Cloth with Pt-catalyst
Graphite Brush

69
Figure A. 6 Column reactor

70
Figure A. 7 Sediment MFC installed in the field. Cathodes were graphite brushes. Anodes were graphite rods protected in the drilled PVC tubing.
Figure A. 8 Graphite rod used in sediment MFC as anode