application of municipal biosolids to dry-land wheat
TRANSCRIPT

Application of Municipal Biosolids to Dry-Land Wheat Fields – A Monitoring Program near Deer Trail, Colorado (USA)
A presentation for an international conference: “The Future of Agriculture: Science, Stewardship, and Sustainability”, August 7–9, 2006, Sacramento, CA
By James G. Crock, David B. Smith, and Tracy J.B. Yager
Open-File Report 2006–1286
U.S. Department of the Interior U.S. Geological Survey

U.S. Department of the Interior DIRK KEMPTHORNE, Secretary
U.S. Geological Survey P. Patrick Leahy, Acting Director
U.S. Geological Survey, Reston, Virginia 2006
For product and ordering information: World Wide Web: http://www.usgs.gov/pubprod Telephone: 1-888-ASK-USGS
For more information on the USGS—the Federal source for science about the Earth, its natural and living resources, natural hazards, and the environment: World Wide Web: http://www.usgs.gov Telephone: 1-888-ASK-USGS
Suggested citation: Crock, J.G., Smith, D.B., and Yager, T.J.B., 2006, Application of Municipal Biosolids to Dry-Land Wheat fields – A Monitoring Program near Deer Trail, Colorado (USA): U.S. Geological Survey Open-File Report 2006-1286.
Any use of trade, product, or firm names is for descriptive purposes only and does not imply endorsement by the U.S. Government.
Although this report is in the public domain, permission must be secured from the individual copyright owners to reproduce any copyrighted material contained within this report.
ii

Contents Abstract................................................................................................................................................................................1 Introduction .........................................................................................................................................................................2 Methology ............................................................................................................................................................................3
Biosolids ...........................................................................................................................................................................4 Soil .....................................................................................................................................................................................4 Crops .................................................................................................................................................................................5
Discussion and Results .....................................................................................................................................................6 Biosolids ...........................................................................................................................................................................6 Soil .....................................................................................................................................................................................7 Crops .................................................................................................................................................................................7
Acknowledgements ...........................................................................................................................................................8 References Cited ................................................................................................................................................................8 Slides From Presentation ................................................................................................................................................11
iii

Application of Municipal Biosolids to Dry-Land Wheat Fields – A Monitoring Program near Deer Trail, Colorado (USA)
A presentation for an international conference: “The Future of Agriculture: Science, Stewardship, and Sustainability”, August 7–9, 2006, Sacramento, CA
By James G. Crock, David B. Smith, and Tracy J.B. Yager
Abstract Since late 1993, Metro Wastewater Reclamation District of Denver (Metro District), a large
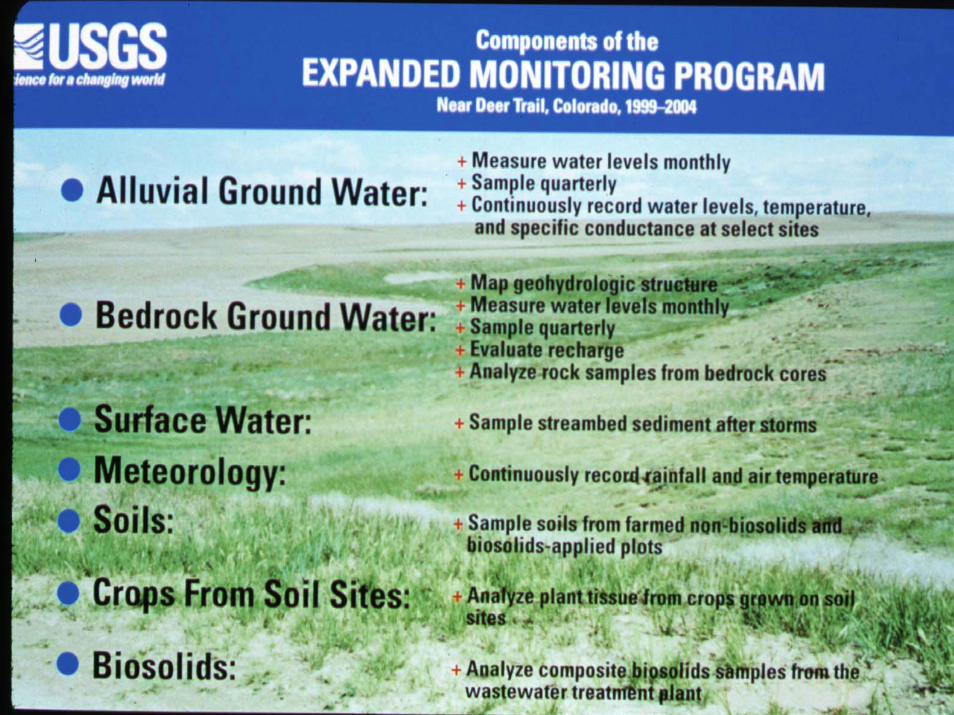
wastewater treatment plant in Denver, Colorado, has applied Grade I, Class B biosolids to about 52,000 acres of non-irrigated farmland and rangeland near Deer Trail, Colorado. In cooperation with the Metro District in 1993, the U.S. Geological Survey (USGS) began monitoring ground water at part of this site. In 1999, the USGS began a more comprehensive study of the entire site to address stakeholder concerns about the chemical effects of biosolids applications. This more comprehensive monitoring program has recently been extended through 2010. Monitoring components of the more comprehensive study included biosolids collected at the wastewater treatment plant, soil, crops, dust, alluvial and bedrock ground water, and stream bed sediment. Streams at the site are dry most of the year, so samples of stream bed sediment deposited after rain were used to indicate surface-water effects. This presentation will only address biosolids, soil, and crops. More information about these and the other monitoring components are presented in the literature (e.g., Yager and others, 2004a, b, c, d) and at the USGS Web site for the Deer Trail area studies at http://co.water.usgs.gov/projects/CO406/CO406.html. Priority parameters identified by the stakeholders for all monitoring components, included the total concentrations of nine trace elements (arsenic, cadmium, copper, lead, mercury, molybdenum, nickel, selenium, and zinc), plutonium isotopes, and gross alpha and beta activity, regulated by Colorado for biosolids to be used as an agricultural soil amendment. Nitrogen and chromium also were priority parameters for ground water and sediment components.
In general, the objective of each component of the study was to determine whether concentrations of priority parameters (1) were higher than regulatory limits, (2) were increasing with time, or (3) were significantly higher in biosolids-applied areas than in a similar farmed area where biosolids were not applied. Where sufficient samples could be collected, statistical methods were used to evaluate effects. Rigorous quality assurance was included in all aspects of the study. The roles of hydrology and geology also were considered in the design, data collection, and interpretation phases of the study.
Study results indicate that the chemistry of the biosolids from the Denver plant was consistent during 1999-2005, and total concentrations of regulated trace elements were consistently lower than the regulatory limits. Plutonium isotopes were not detected in the biosolids. Leach tests
1

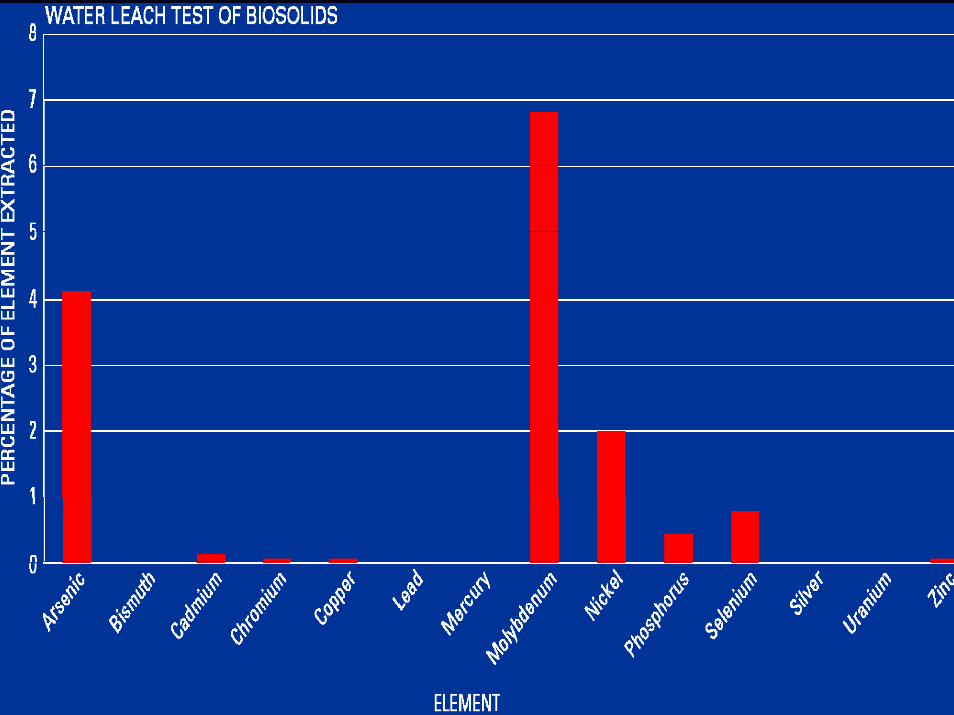
using deionized water to simulate natural precipitation indicate arsenic, molybdenum, and nickel were the most soluble priority parameters in the biosolids.
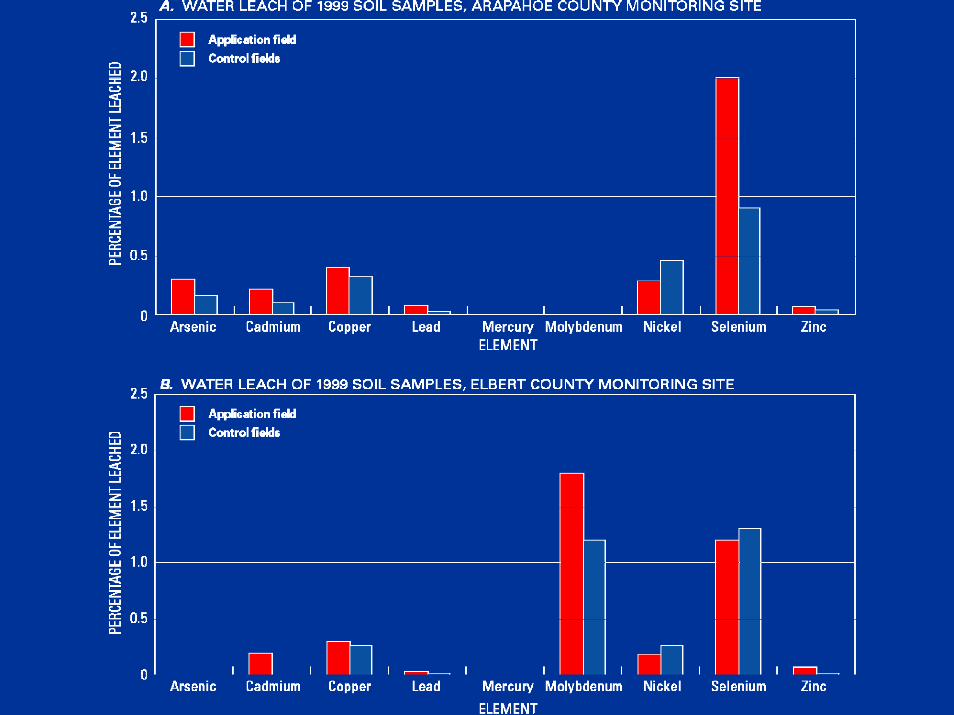
Study results show no significant difference in concentrations of priority parameters between biosolids-applied soils and unamended soils where no biosolids were applied. However, biosolids were applied only twice during 1999-2003. The next soil sampling is not scheduled until 2010. To date concentrations of most of the priority parameters were not much greater in the biosolids than in natural soil from the sites. Therefore, many more biosolids applications would need to occur before biosolids effects on the soil priority constituents can be quantified. Leach tests using deionized water to simulate precipitation indicate that molybdenum and selenium were the priority parameters that were most soluble in both biosolids-applied soil and natural or unamended soil. Study results do not indicate significant differences in concentrations of priority parameters between crops grown in biosolids-applied areas and crops grown where no biosolids were applied. However, crops were grown only twice during 1999-2003, so only two crop samples could be collected. The wheat-grain elemental data collected during 1999-2003 for both biosolids-applied areas and unamended areas are similar to literature values for wheat grain from other areas. Wheat samples have been collected from the Arapahoe County site for 2006 with results still pending.
Data from this study were used to compile an inorganic-chemical biosolids signature that can be contrasted with the geochemical signature for this site. The biosolids signature and an understanding of the geology and hydrology of the site can be used to separate biosolids effects from geochemical effects.
Introduction Since 1993, the Metro Wastewater Reclamation District of Denver (Metro District) has
been applying biosolids from the Denver metropolitan area to their property near Deer Trail, Colorado, as an agricultural soil amendment. The biosolids are applied to non-irrigated farmland according to agronomic loading rates. More information about the sewage-treatment process that results in the Metro District biosolids can be found at http://www.metrowastewater.com. The biosolids-application areas, dates of application, and application rates provided by the Metro District for their properties near Deer Trail for 1999 through 2003 are detailed in Stevens and others (2003), and Yager and others (2004a, b, c). As more information becomes posted, it will be available at the USGS project web page at http://co.water.usgs.gov/projects/CO406/CO406.html.
In 1999, the Metro District property, known as the METROGRO Farm, encompassed about 81 mi2 (52,000 acres) of farmland in Arapahoe and Elbert Counties, Colorado. The Metro District property and surrounding private property are herein referred to as “the study area.” Soils in the study area generally are sandy or loamy on flood plains and stream terraces, clayey to loamy on gently sloping to rolling uplands, and sandy and shaley on steeper uplands (Larsen and others, 1966; Larsen and Brown, 1971). Surface water consists of ponds (usually man-made impoundments) and intermittent and ephemeral streams; streams rarely flow except after heavy rain. Ground water is present in alluvial and bedrock aquifers (Yager and Arnold, 2003). The study area generally was vegetated during 1999 through 2006 except where the land surface was rock or where farm fields were freshly tilled. Crops and semi-arid prairie vegetation dominated the landscape. Tree canopy was sparse and consisted of primarily deciduous varieties such as cottonwood trees along stream beds. Topographic features of the study area include flood plains, terraces with incised channels, valleys with incised channels, rounded hills, and cliffs. In general, the geology of the study area consists of interbedded shale, siltstone, and sandstone, which may be overlain by clay, windblown silt and sand, or alluvial sand and gravel (Yager and Arnold, 2003).
2
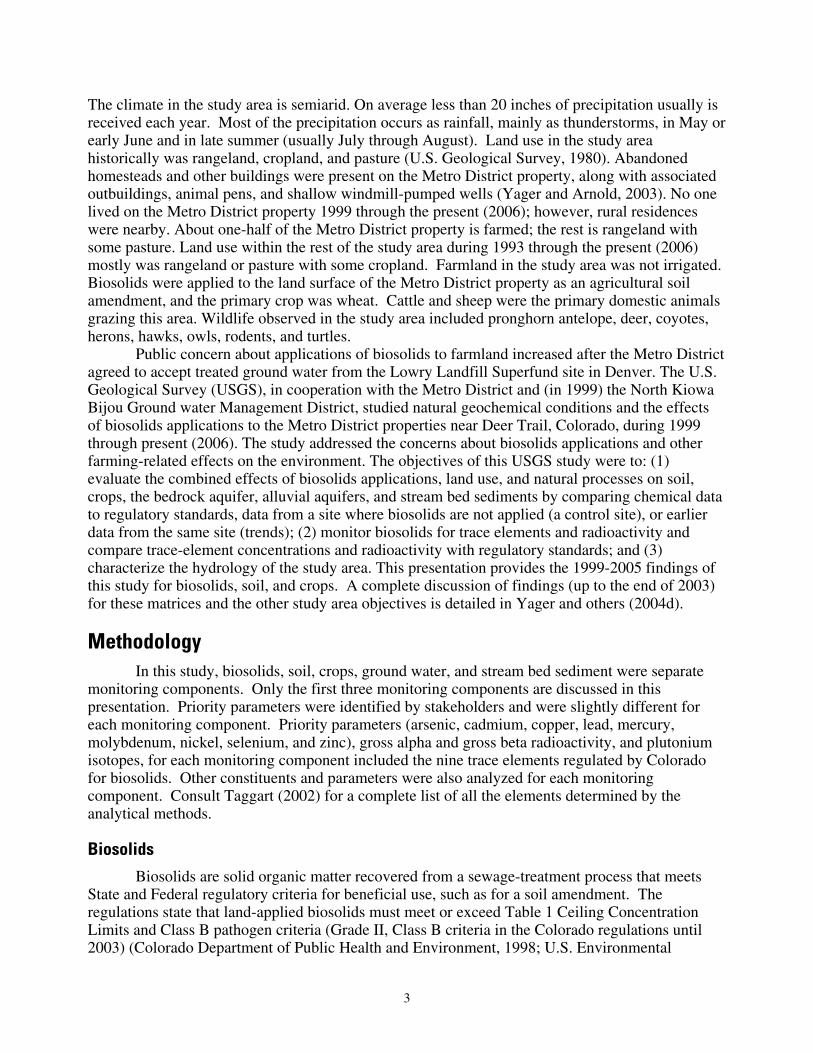
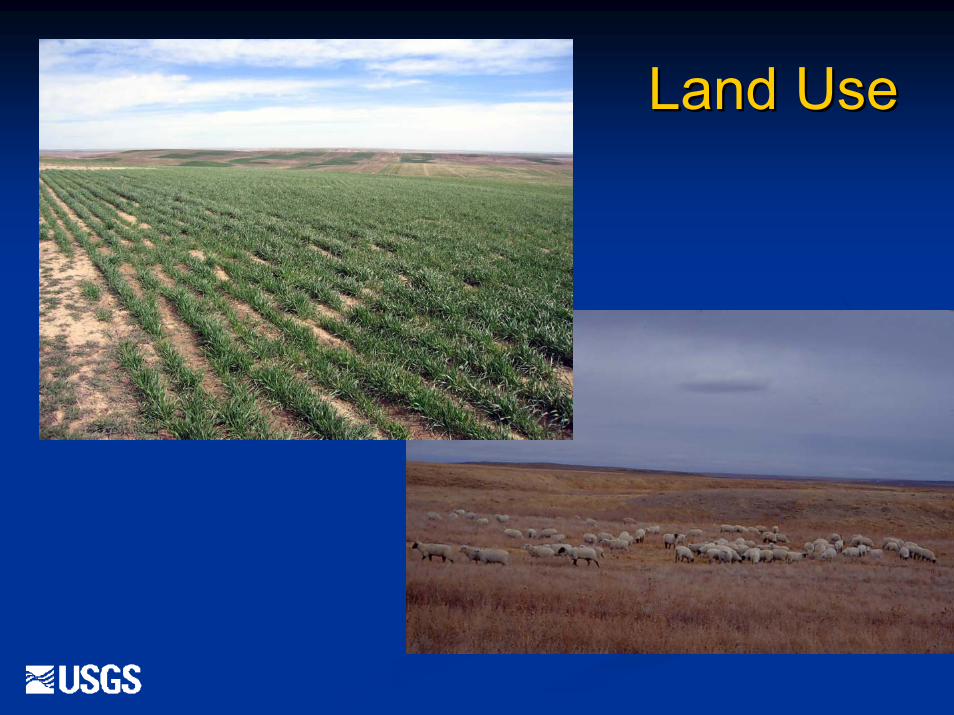
The climate in the study area is semiarid. On average less than 20 inches of precipitation usually is received each year. Most of the precipitation occurs as rainfall, mainly as thunderstorms, in May or early June and in late summer (usually July through August). Land use in the study area historically was rangeland, cropland, and pasture (U.S. Geological Survey, 1980). Abandoned homesteads and other buildings were present on the Metro District property, along with associated outbuildings, animal pens, and shallow windmill-pumped wells (Yager and Arnold, 2003). No one lived on the Metro District property 1999 through the present (2006); however, rural residences were nearby. About one-half of the Metro District property is farmed; the rest is rangeland with some pasture. Land use within the rest of the study area during 1993 through the present (2006) mostly was rangeland or pasture with some cropland. Farmland in the study area was not irrigated. Biosolids were applied to the land surface of the Metro District property as an agricultural soil amendment, and the primary crop was wheat. Cattle and sheep were the primary domestic animals grazing this area. Wildlife observed in the study area included pronghorn antelope, deer, coyotes, herons, hawks, owls, rodents, and turtles.
Public concern about applications of biosolids to farmland increased after the Metro District agreed to accept treated ground water from the Lowry Landfill Superfund site in Denver. The U.S. Geological Survey (USGS), in cooperation with the Metro District and (in 1999) the North Kiowa Bijou Ground water Management District, studied natural geochemical conditions and the effects of biosolids applications to the Metro District properties near Deer Trail, Colorado, during 1999 through present (2006). The study addressed the concerns about biosolids applications and other farming-related effects on the environment. The objectives of this USGS study were to: (1) evaluate the combined effects of biosolids applications, land use, and natural processes on soil, crops, the bedrock aquifer, alluvial aquifers, and stream bed sediments by comparing chemical data to regulatory standards, data from a site where biosolids are not applied (a control site), or earlier data from the same site (trends); (2) monitor biosolids for trace elements and radioactivity and compare trace-element concentrations and radioactivity with regulatory standards; and (3) characterize the hydrology of the study area. This presentation provides the 1999-2005 findings of this study for biosolids, soil, and crops. A complete discussion of findings (up to the end of 2003) for these matrices and the other study area objectives is detailed in Yager and others (2004d).
Methodology In this study, biosolids, soil, crops, ground water, and stream bed sediment were separate
monitoring components. Only the first three monitoring components are discussed in this presentation. Priority parameters were identified by stakeholders and were slightly different for each monitoring component. Priority parameters (arsenic, cadmium, copper, lead, mercury, molybdenum, nickel, selenium, and zinc), gross alpha and gross beta radioactivity, and plutonium isotopes, for each monitoring component included the nine trace elements regulated by Colorado for biosolids. Other constituents and parameters were also analyzed for each monitoring component. Consult Taggart (2002) for a complete list of all the elements determined by the analytical methods.
Biosolids
Biosolids are solid organic matter recovered from a sewage-treatment process that meets State and Federal regulatory criteria for beneficial use, such as for a soil amendment. The regulations state that land-applied biosolids must meet or exceed Table 1 Ceiling Concentration Limits and Class B pathogen criteria (Grade II, Class B criteria in the Colorado regulations until 2003) (Colorado Department of Public Health and Environment, 1998; U.S. Environmental
3

Protection Agency, 1993). Table 3 and Grade I requirements are stricter than Table 1 and Grade II requirements. The Metro District applies Table 3 (Grade I) Class B biosolids to their properties near Deer Trail. The biosolids-application areas, dates of application, and application rates provided by the Metro District for their properties near Deer Trail are detailed in Stevens and others (2003), and Yager and others (2004a, b, c).
In 1999, the USGS began monitoring Metro District biosolids for concentrations of trace elements and radioactivity, as well as other selected parameters. The priority parameters identified by the stakeholders for biosolids were the nine regulated trace elements (arsenic, cadmium, copper, lead, mercury, molybdenum, nickel, selenium, and zinc), plutonium isotopes, and gross alpha and gross beta radioactivity. From January 1999 through June 2000 and from May 2003 through September 2003, biosolids samples were collected quarterly. From August 2000 through April 2003 and October 2003 through present (2006), biosolids samples were collected monthly. Biosolids samples were collected directly from the Metro District facility’s processing line in Denver, rather than from individual trucks or fields near Deer Trail to ensure a more representative sample. Each biosolids sample was a 24-hour composite of 12 subsamples collected about every 2 hours by Metro District personnel at the Metro District facility. The subsamples were collected from the conveyor belt that transfers the biosolids into the transport trucks. The samples were prepared and analyzed at the chemical laboratories of the USGS, Geologic Discipline, Denver. The biosolids material was air dried and then ground to less than 150 µm prior to chemical analysis. Complete details on the analytical methods and the quality-assurance protocols used are described by Stevens and others (2003), Taggart (2002), and Yager and others (2004a, b, c). The concentrations in the samples were compared to applicable Colorado standards for biosolids (Colorado Department of Public Health and Environment, 1998).
Preliminary leach experiments of selected biosolids samples were done to determine if there was substantial reactivity and mobilization of elements upon contact of the biosolids with water. The experiment methodology was a modification of the Field Leach Test of Hageman and Briggs (2000).
Soil
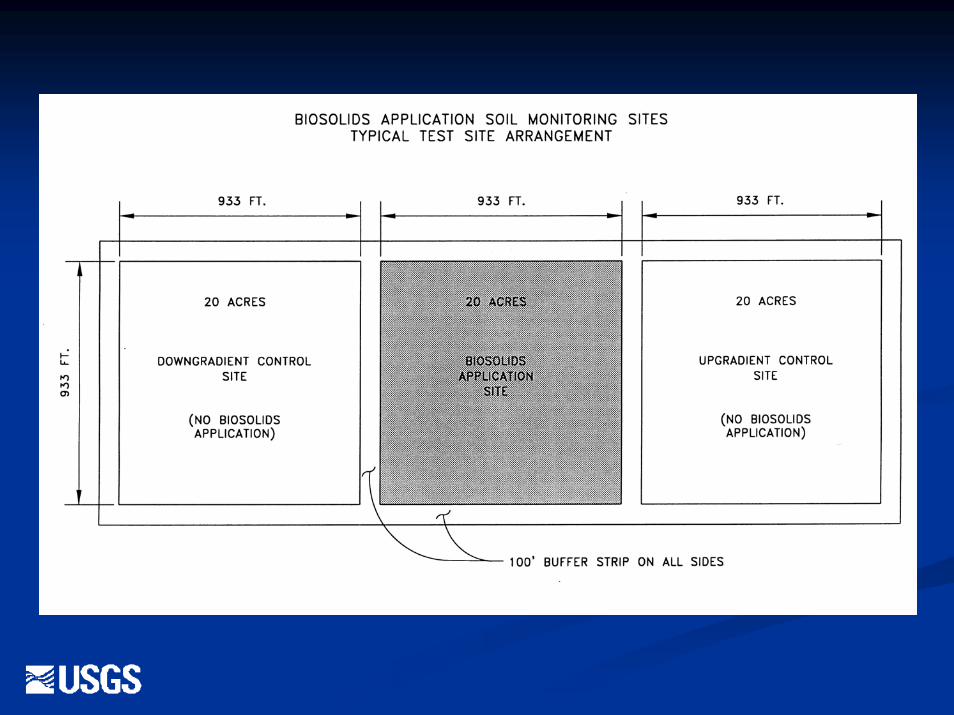
In August 1999, the USGS began monitoring soils on two sites, one site on Metro District property in Arapahoe County and one site on Metro District property in Elbert County. The sites were monitored for priority parameters consisting of (1) nine trace elements for which biosolids are regulated (Colorado Department of Public Health and Environment, 1998): arsenic, cadmium, copper, lead, mercury, molybdenum, nickel, selenium, and zinc; and (2) plutonium isotopes, and gross alpha and gross beta activity. Soil samples were collected once in 1999 before the application of biosolids to the monitoring sites. Soil monitoring continued through two cycles of biosolids application and crop harvest; soil sampling was done within a few months after each harvest. Fields that received biosolids applications were monitored in addition to fields that received no biosolids, which represented reference conditions for comparison. Each of the two soil-monitoring sites consisted of three 20-acre (933 ft x 933 ft) fields separated by 100-ft buffer zones. Biosolids were applied on the center 20-acre field at each site after the initial soil sampling and again after each harvest. The other two 20-acre fields at each site never had biosolids applied and were used as control fields to determine the natural variability of soil composition for the duration of the study. All three 20-acre fields at each site were farmed in a similar way as the rest of the Metro District property and had crops planted and harvested.
The sampling protocol was designed to provide data to determine how the application of biosolids affects soil chemistry within the top 12 inches (30 cm) of the surface; if there is a short-
4

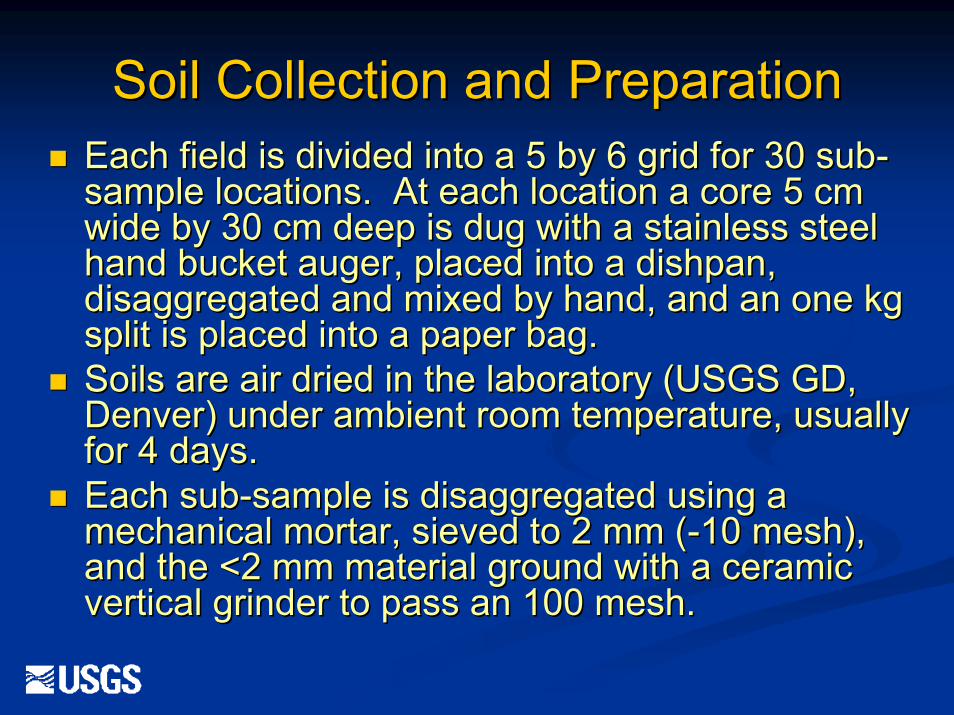
term or long-term buildup or enhancement of metals or radioactivity in the top 12 inches of soil caused by the application of biosolids; and if a buildup occurs, is it within acceptable limits for soil quality as established by Federal and State agencies. A standard soil auger was used to collect subsamples in each field to a depth of 12 inches according to a systematic grid pattern. During each sampling event, 30 subsamples were collected for each of the 20-acre fields. After air drying, disaggregating, sieving to less than 2 mm, and grinding to less than 150 µm, splits of the subsamples were composited into one sample that represented the entire field for chemical analysis. Complete details on site selection, dates of sample collection, sample collection protocols, analytical methods, and quality assurance protocols are described by Stevens and others (2003) and Yager and others (2004a, b, c).
Preliminary leach experiments of selected soil samples were done to determine if there was substantial mobilization of elements upon contact of the soils with water. The experiment methodology was a modification of the Field Leach Test of Hageman and Briggs (2000).
Crops
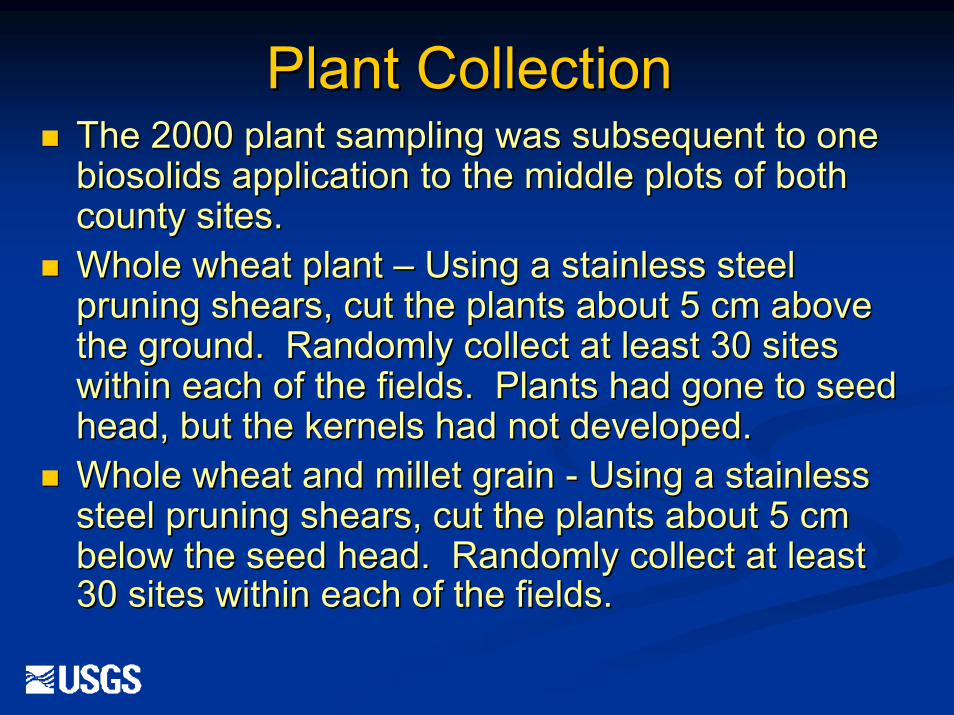
In the summer of 2000, monitoring of crops grown on the two soil-monitoring sites began. One of these sites is on Metro District property in Arapahoe County and one site is on Metro District property in Elbert County. Samples were collected from the control and biosolids-application fields. The crop samples were analyzed for the above listed nine trace elements for which biosolids are regulated in Colorado (Colorado Department of Public Health and Environment, 1998). Selected samples also were analyzed for plutonium and gross alpha and gross beta radioactivity. The study was carried out over two crop harvests, 2000 and 2002. The sampling protocol was designed to determine the average chemical composition of the grain in each of the six 20-acre fields. A variety of hard red winter wheat was planted at each site. In 2000, wheat plant samples were collected prior to crop maturity, and then mature wheat grain samples were collected about 1 month later just before harvest. In addition, millet grain was collected on the Arapahoe County site where it had been planted in the western part of the site after failure of the wheat crop. In 2002, wheat grain in the Arapahoe County fields was collected after harvest, and wheat grain in the Elbert County fields was collected during harvest. Complete details regarding dates of collection, sample collection protocols, sample preparation, and analytical methods for 1999-2003 are provided in Yager and others (2004a, c). Wheat samples also were collected from the Arapahoe County monitoring fields in 2006, and results are pending.
Discussion and Results
Biosolids
Biosolids exceeding the standards for trace elements could adversely affect the quality of soil on which the biosolids are applied and could alter Metro District plans for the application of biosolids in Arapahoe and Elbert Counties. The composition of biosolids was monitored to provide an independently determined data set against which the Metro District chemical analyses and the regulatory standards for biosolids can be compared. The data will also constitute a chemical baseline against which any future change in the concentration of constituents analyzed for in this study may be recognized, measured, and compared. The data set will also establish a “geochemical signature” for biosolids that will potentially enable scientists to recognize when biosolids have impacted soils or stream sediments.
5
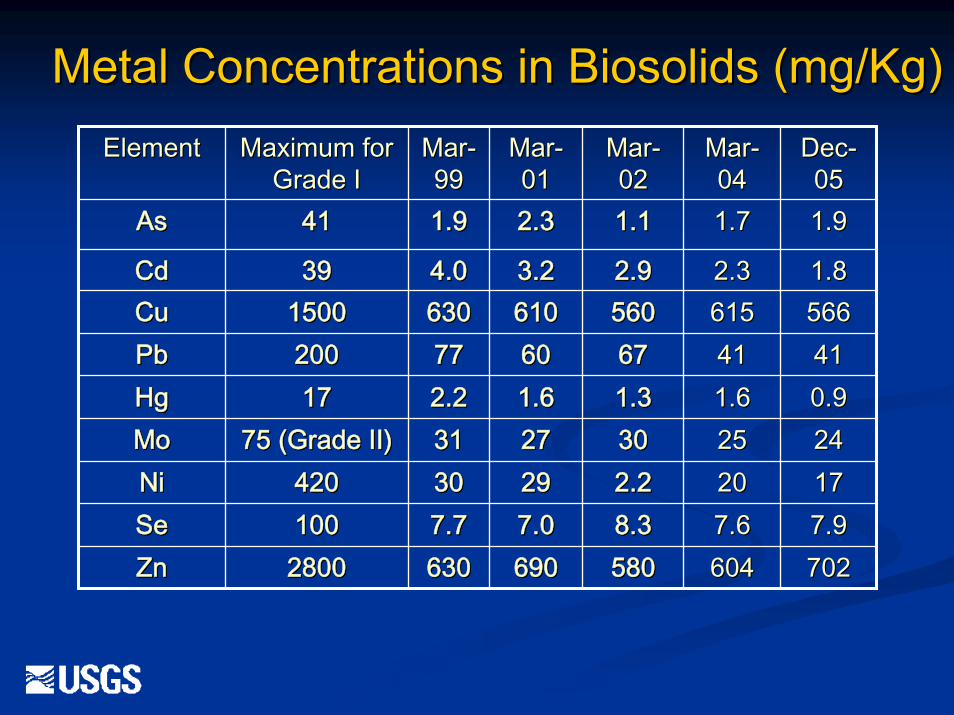
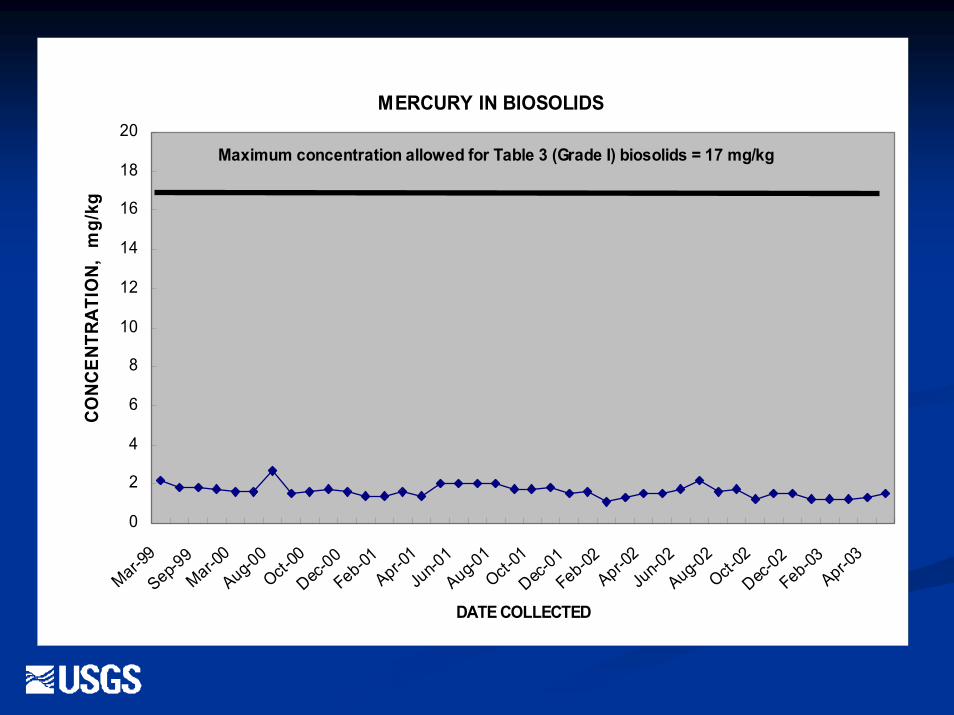
The concentration of all nine trace elements remained relatively consistent throughout the study. Arsenic showed the most variability with its high and low concentration differing by a factor of 6. The other eight elements varied by a factor of 3 or less. It is readily apparent from inspection of the data that all trace-element concentrations were less than the maximum allowable concentrations established for Table 3 (Grade I) biosolids. (Note that molybdenum does not have a maximum allowable concentration established for Table 3 biosolids. The value used is that for Table 1 biosolids.)
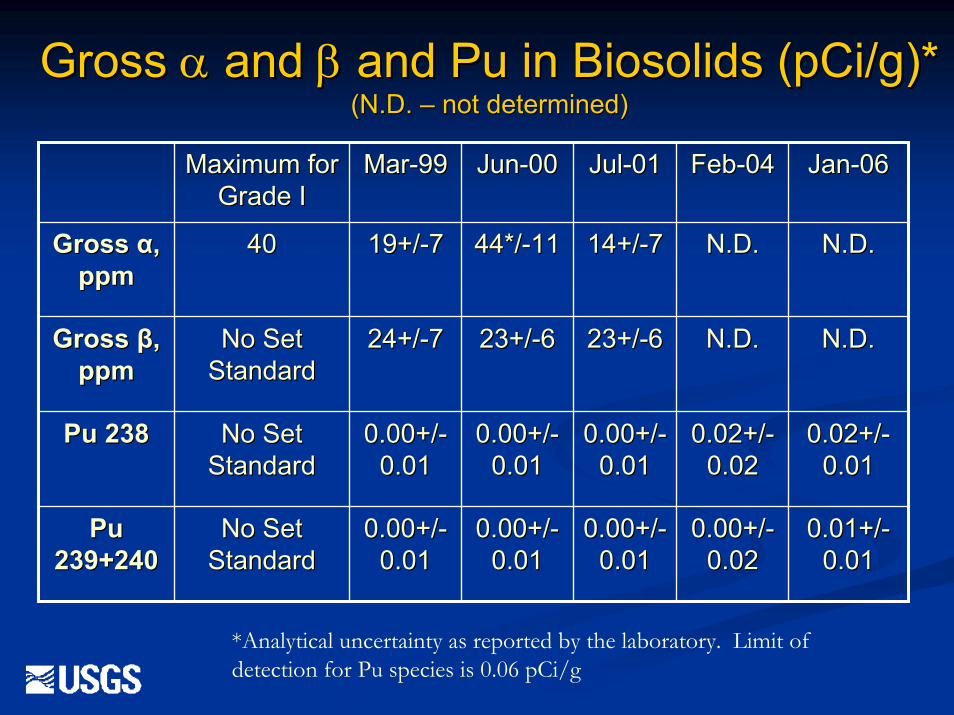
Measurements for each of these parameters exhibit a relatively high uncertainty as shown by the “error bars” or “+/- standard deviation/range” associated with each of the data. There is no regulatory value established for gross beta radioactivity. Until 2003, there was a Colorado regulatory limit for gross alpha radioactivity. However, this regulation was revised, effective June 30, 2003, to delete the previous regulation that generally restricted land application of biosolids that exceeded a gross alpha activity of 40 pCi/g (Colorado Department of Public Health and Environment, 1998). The samples collected before July 2002 have an average gross alpha activity of 37 pCi/g, whereas the samples collected from July 2002 through 2003 have an average of 18 pCi/g. The uncertainty is also different, with the samples collected prior to July 2002 having an average uncertainty of +/- 34% while the samples collected from July 2002 through 2003 have an average uncertainty of +/- 12%. The samples collected from July 2002 and later were analyzed in a different laboratory from the samples collected prior to July 2002 (Yager and others, 2004a, b, c). The USGS has no basis for determining which laboratory provided the most accurate values. A few of the gross alpha activity values may have exceeded the old regulatory limit of 40 pCi/g, but with the uncertainty in the analyses, it is difficult to draw any conclusion from this data set.
There are no published regulatory values for plutonium in biosolids. All data measured were always below the limit of determination (0.06 pCi/g). The radioactivity data for biosolids were reported in previous annual reports (Stevens and others, 2003; Yager and others, 2004a, b, c) in the uncensored data as received from the laboratory rather than censored by either the contract or calculated MDC. Relative to the censored form (data reported as less than the MDC), the uncensored form provides more information about the uncertainty, the very small concentrations of plutonium, and the gross alpha and gross beta activity.
Chemical data for biosolids samples collected from the Metro District plant over a seven-year period (1999–2005) show that all nine of the trace elements for which regulatory limits are established maintained relatively uniform concentrations and never exceeded the maximum allowable levels for Table 3 (Grade I) biosolids. Measurements of gross alpha radioactivity carry a high degree of uncertainty, but generally are below the now-outdated limit of 40 pCi/g. No regulatory limits have been established for plutonium, but all values are below the minimum detectable level.
In addition to the nine trace elements that have regulatory standards established, USGS analyzed the samples for many other elements. Of the regulated elements, mercury and copper had the highest concentrations in biosolids compared to concentrations in soil. Of the non-regulated elements, silver, phosphorous, and bismuth have the highest concentrations in biosolids compared to soils (Yager and others, 2004a, b, c). For this reason, these five elements would be the most likely “geochemical signature” to indicate that soils or stream sediments have been impacted by biosolids.
Soil
Soil samples collected in 1999 prior to any application of biosolids have established baseline elemental information for the study area. Soil data from 2000 and 2002 indicate that two
6

applications of biosolids have had no measurable effect on the concentration of the parameters monitored. Calculations indicate that about 14 applications of biosolids would be necessary to see a measurable change in copper concentration (Yager and others, 2004d). Arsenic concentrations in soil from both the control and biosolids-applied monitoring sites in both Arapahoe and Elbert County exceed the soil remediation objectives and soil cleanup value standards issued by the Colorado Department of Public Health and Environment in 1997 (Colorado Department of Public Health and Environment, 1997). This is a function of the manner in which the cleanup value standards were determined by back-calculating a soil concentration equivalent to a one-in-a-million cumulative cancer risk. Lead and mercury concentrations in soil from the study area did not exceed the soil remediation objectives and soil cleanup value standards (Colorado Department of Public Health and Environment, 1997). Cadmium concentrations in soil from the study area did not exceed the U.S. Environmental Protection Agency toxicity-derived ecological soil screening levels (U.S. Environmental Protection Agency, 2003b). Lead concentrations in soil from Arapahoe and Elbert County slightly exceed the Environmental Protection Agency toxicity-derived ecological soil screening levels for birds (U.S. Environmental Protection Agency, 2003a). This is true for those fields receiving biosolids as well as for the control fields, which never received biosolids.
Crops
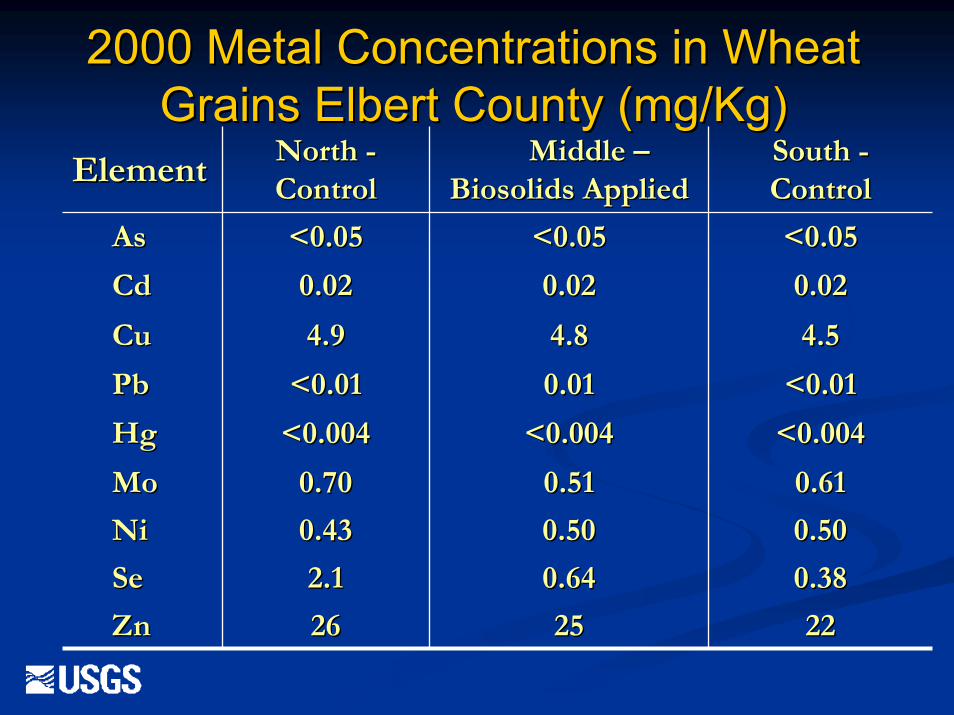
Wheat grain was sampled on the Arapahoe County and Elbert County monitoring sites after the 2000 and 2002 harvests. Comparison of these data with data for winter wheat from other parts of North America where biosolids were not applied (Erdman and Gough, 1979; Erdman and Tourtelot, 1976; Gawalko and others, 2001; Severson and others, 1991) shows that wheat from the monitoring fields has very similar concentrations of elements in common with the other localities. Nickel is the exception to this statement; the monitoring fields near Deer Trail had higher nickel concentrations in both the biosolids-applied fields and the control fields than wheat from other parts of North America.
There are no obvious differences between metal concentration of wheat grains collected in Arapahoe County and wheat grains collected in Elbert County. Fluctuations generally fall within the normal range of uncertainty associated with using a limited number of subsamples to chemically characterize a large population. The chemical differences between wheat collected from the 20-acre fields to which biosolids have been applied and wheat from the unamended control fields where no biosolids have been applied are minimal with three exceptions. Nickel concentration in the 2002 wheat grain samples from the Elbert County application field was 8.7 mg/kg as compared to the two control fields where the 2002 nickel concentrations were 1.7 and 3.6 mg/kg. Similarly, lead concentration in wheat grain samples from the Elbert County application field was 0.07 mg/kg, whereas lead concentrations in 2002 wheat samples from the two control fields were 0.01 and 0.03 mg/kg. The 1999-2005 study had only two crop cycles available for sampling. In order to draw conclusions about whether these variations are in any way related to the application of biosolids, data from several more crop cycles are required. For example, we see that selenium in the two control fields in Elbert County varies from 2.6 mg/kg to 0.36 mg/kg. If this is typical of the range we will likely see for the trace metals in the control fields where no biosolids were ever applied, then we must conclude that the differences discussed above for lead and nickel are nothing more than the normal variations caused, again, by the uncertainties arising from characterizing a large population with a limited number of subsamples.
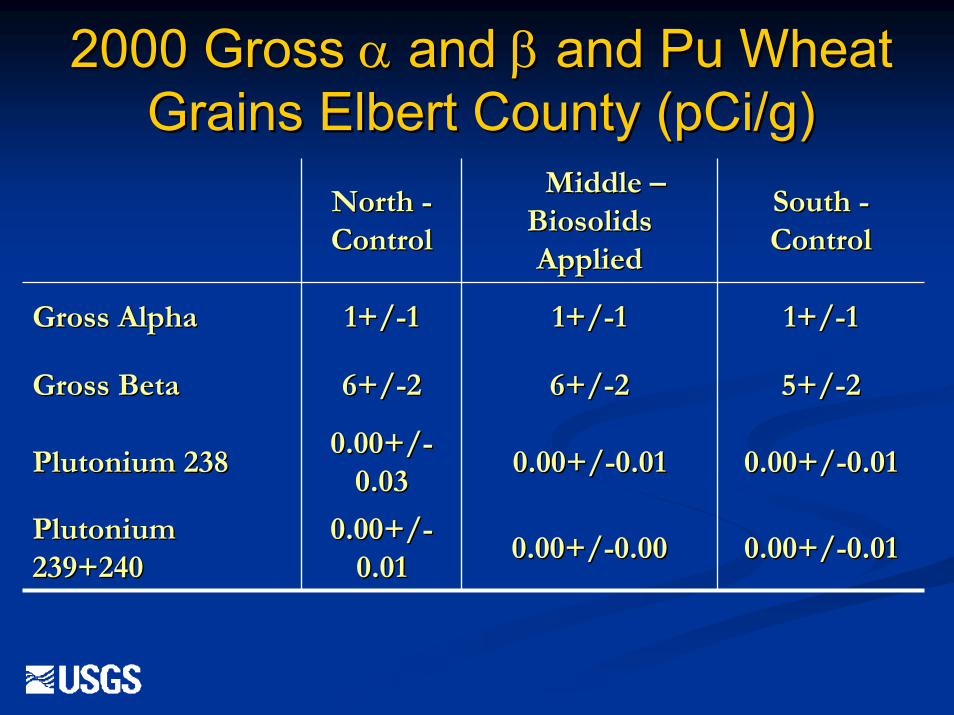
The radioactivity data are reported in the uncensored form as received from the laboratory rather than censored by either the contract or calculated MDC. Relative to the censored form (data
7

reported as less than the MDC), the uncensored form provides more information about the uncertainty, the very small concentrations of plutonium, and the gross alpha and gross beta activity.
Acknowledgements This study was done in cooperation with and funding from the Metro Wastewater
Reclamation District and the North Kiowa-Bijou Ground water Management District. The authors also thank all private landowners for allowing access to their properties for data collection. The authors also wish to thank Monique Adams, Paul Lamothe, Paul Wigton, Murray Beasley, and Zoe Ann Brown, all with the analytical chemistry laboratories of the USGS, Denver, for their efforts in the preparation and analyses of the samples for this study and to LaDonna Choate and Phillip Hageman (both of the USGS, Denver) for their very helpful review of the slides and manuscript. The authors also give a special thanks to Phillip Hageman for the leach data.
References Cited Colorado Department of Public Health and Environment, Hazardous Materials and Waste
Management Division, 1997, Soil remediation objectives: A policy outlining the process for developing site-specific soil remediation objectives, 76 p.
Colorado Department of Public Health and Environment,1998, Biosolids regulation: 5CCR 1002–
64, January 12, 1998 (and subsequent revisions), 53 p. Erdman, J.A., and Gough, L.P., 1979, Mineral composition of wheat from coal-mine spoils and
farms in the Northern Great Plains, USA, in Wali, M.K., ed., Ecology and Coal Resource Development: New York, Pergamon Press, p. 878-886.
Erdman, J.A., and Tourtelot, H.A., 1976, Denver liquid sewage sludge: Its agricultural benefits and
its effect on the metal composition of wheat grown at the Watkins test site, Adams County, Colorado: U.S. Geological Survey Open-File Report 76-810, 29 p.
Gawalko, E.J., Garrett, R.G., and Nowicki, T.W., 2001, Trace elements in western Canadian hard
red spring wheat (Triticum aestivum L.): Levels and quality assurance: Journal of Association of Official Analytical Chemists International, v. 84, no. 6, 1953-1963.
Hageman, P.L., and Briggs, P.H., 2000, A simple field leach for rapid screening and qualitative
characterization of mine-waste material on abandoned mine lands, in ICARD 2000: Proceedings from the Fifth International Conference on Acid Rock Drainage, Denver, Colorado, May 21-24, 2000: Society for Mining, Metallurgy, and Exploration Inc., p. 1463-1475.
Larsen, L.S., and Brown, J.B., 1971, Soil survey of Arapahoe County, Colorado: U.S. Department
of Agriculture Soil Conservation Service Soil Survey Series, 78 p. Larsen, L.S., Baber, T.G., Wesswick, E.L., McCoy, D.E., and Harman, J.B., 1966, Soil survey of
Elbert County, Colorado, eastern part: U.S. Department of Agriculture Soil Conservation Service Soil Survey Series 1960, no. 31, 79 p.
8

Severson, R.C., Gough, L.P., Crock, J.G., Fey, D.L., Hageman, P.L., Love, A.H., and Peacock, T.R., 1991, Uptake and physiological antagonism of selenium and sulfur in alfalfa and wheat under field conditions, San Joaquin Valley, California: U.S. Geological Survey Open-File Report 91-16, 42 p.
Stevens, M.R., Yager, T.J.B., Smith, D.B., and Crock, J.G., 2003, Biosolids, soils, ground water,
and stream bed sediment data for a biosolids-application area near Deer Trail, Colorado: U.S. Geological Survey Open-File Report 02-51, 118 p.
Taggart, J.E., Jr., (ed.), 2002, Analytical methods for chemical analysis of geological and other
materials, U.S. Geological Survey: U.S. Geological Survey Open-File Report 2002-0223. http://pubs.usgs.gov/of/2002/ofr-02-0223/.
U.S. Environmental Protection Agency, 1993, (revised July 1, 2003), Part 503—Standards for the
use or disposal of sewage sludge: Code of Federal Regulations Title 40, v. 27, 40CFR503, p. 820-852.
U.S. Environmental Protection Agency, 2003a, Ecological soil screening levels for lead, interim
final, Office of Solid Waste and Emergency Response Directive 9285.7-70, 244 p. U.S. Environmental Protection Agency, 2003b, Ecological soil screening levels for cadmium,
interim final, Office of Solid Waste and Emergency Response Directive 9285.7-65, 238 p. U.S. Geological Survey, 1980, Land use and land cover, 1975, Limon, Colorado; Kansas: U.S.
Geological Survey Land Use Series L–191, scale 1:250,000, 1 sheet. Yager, T.J.B., and Arnold, L.R., 2003, Hydrogeology of a biosolids-application site near Deer
Trail, Colorado, 1993-99: U.S. Geological Survey Water Resources Investigations Report 03-4209, 90 p.
Yager, T.J.B., Smith, D.B., Crock, J.G., and Stevens, M.R., 2004a, Biosolids, soil, crop, ground
water, and stream bed-sediment data for a biosolids-application area near Deer Trail, Colorado, 2000: U.S. Geological Survey Open-File Report 03-400, 90 p.
Yager, T.J.B., Smith, D.B., and Crock, J.G., 2004b, Biosolids, soil, crop, ground water, and stream
bed-sediment data for a biosolids-application area near Deer Trail, Colorado, 2001: U.S. Geological Survey Open-File Report 2004-1388, 69 p.
Yager, T.J.B., Smith, D.B., and Crock, J.G., 2004c, Biosolids, soil, crop, ground water, and stream
bed-sediment data for a biosolids-application area near Deer Trail, Colorado, 2002-2003: U.S. Geological Survey Open-File Report 2004-1404, 90 p.
Yager, T.J.B., Smith, D.B., and Crock, J.G., 2004d, Effects of surface applications of biosolids on
soil, crops, ground water, and stream bed sediment near Deer Trail, Colorado, 1999-2003: U.S. Geological Survey Scientific Investigations Report 2004-5289, 93 p.
9

Slides from the Presentation
10

Application of Municipal Application of Municipal Biosolids to DryBiosolids to Dry--Land Wheat Land Wheat
Fields Fields –– A Monitoring Program A Monitoring Program near Deer Trail, CO (USA)near Deer Trail, CO (USA)
By By
James G. Crock, David B. Smith, James G. Crock, David B. Smith, and Tracy J. B. Yagerand Tracy J. B. Yager
U.S. Geological Survey (Denver, COU.S. Geological Survey (Denver, CO))
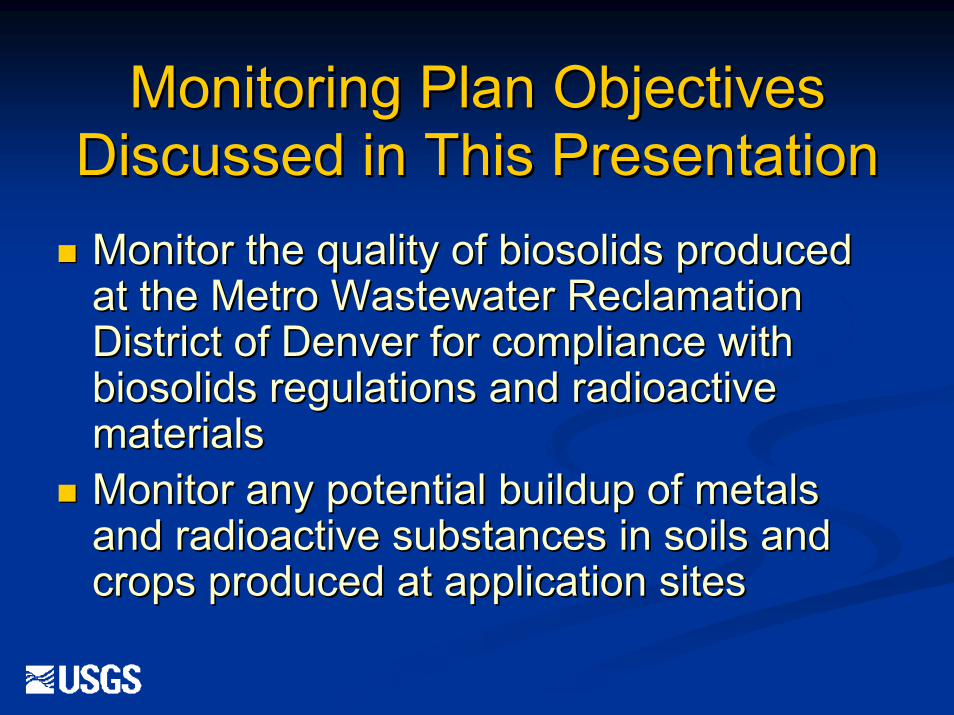
Monitoring Plan Objectives Monitoring Plan Objectives Discussed in This PresentationDiscussed in This PresentationMonitor the quality of biosolids produced Monitor the quality of biosolids produced at the Metro Wastewater Reclamation at the Metro Wastewater Reclamation District of Denver for compliance with District of Denver for compliance with biosolids regulations and radioactive biosolids regulations and radioactive materialsmaterialsMonitor any potential buildup of metals Monitor any potential buildup of metals and radioactive substances in soils and and radioactive substances in soils and crops produced at application sitescrops produced at application sites

Elements/Measurements of InterestElements/Measurements of Interest(total concentration, dry(total concentration, dry--weight basis)weight basis)
ArsenicArsenic CadmiumCadmiumCopperCopper LeadLeadMercuryMercury MolybdenumMolybdenumNickelNickel SeleniumSeleniumZincZinc Plutonium (Pu Plutonium (Pu 238,239,240238,239,240))Gross Gross αα and and ββ ActivityActivity
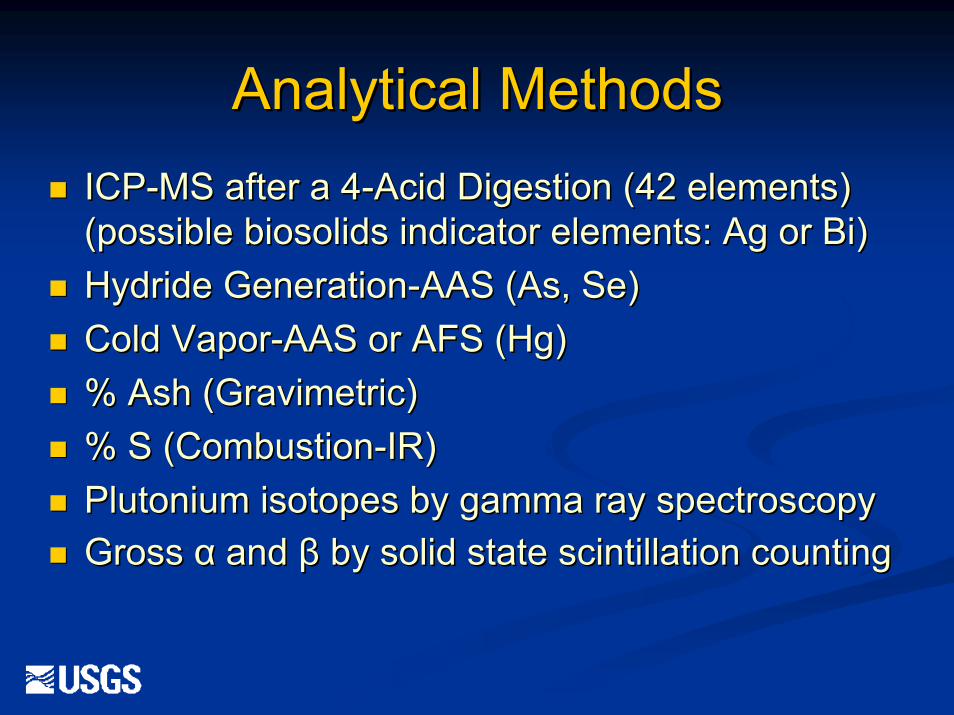
Analytical MethodsAnalytical MethodsICPICP--MS after a 4MS after a 4--Acid Digestion (42 elements)Acid Digestion (42 elements)(possible biosolids indicator elements: Ag or Bi)(possible biosolids indicator elements: Ag or Bi)Hydride GenerationHydride Generation--AAS (As, Se)AAS (As, Se)Cold VaporCold Vapor--AAS or AFS (Hg)AAS or AFS (Hg)% Ash (Gravimetric)% Ash (Gravimetric)% S (Combustion% S (Combustion--IR)IR)Plutonium isotopes by Plutonium isotopes by gammagamma ray spectroscopyray spectroscopyGross Gross αα and and ββ by solid state scintillation countingby solid state scintillation counting
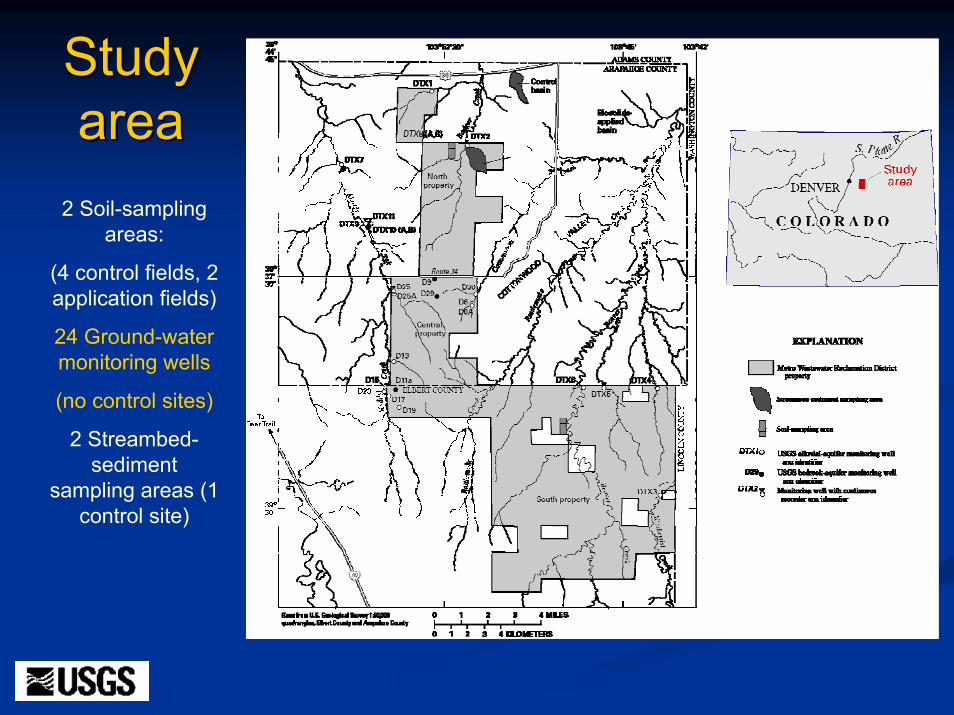
Study Study areaarea
2 Soil-sampling areas:
(4 control fields, 2 application fields)
24 Ground-water monitoring wells
(no control sites)
2 Streambed-sediment
sampling areas (1 control site)
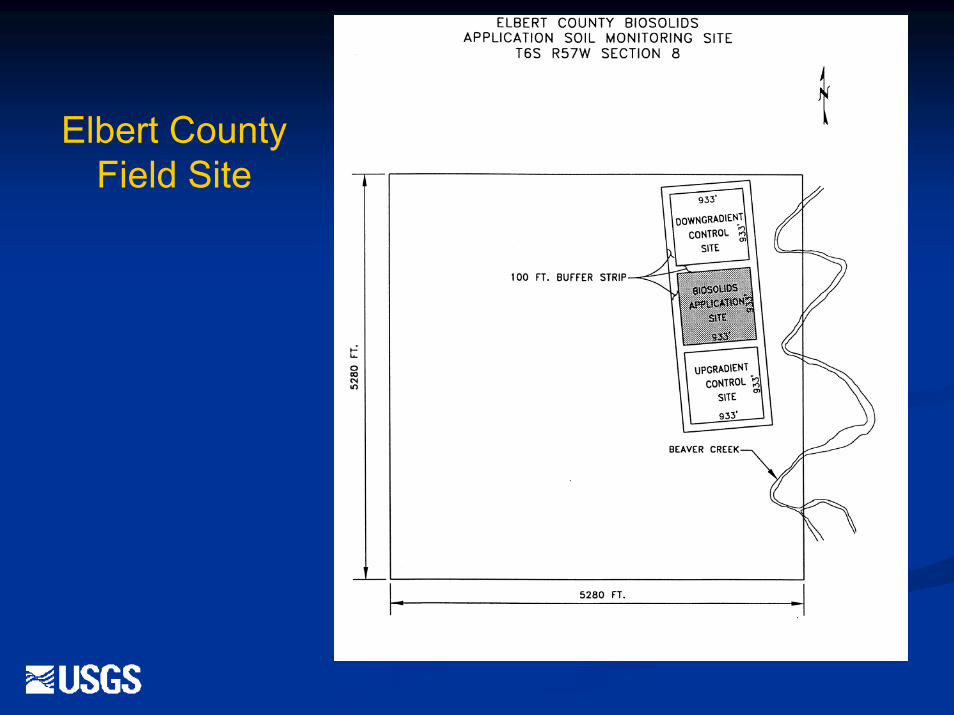
Elbert County Field Site
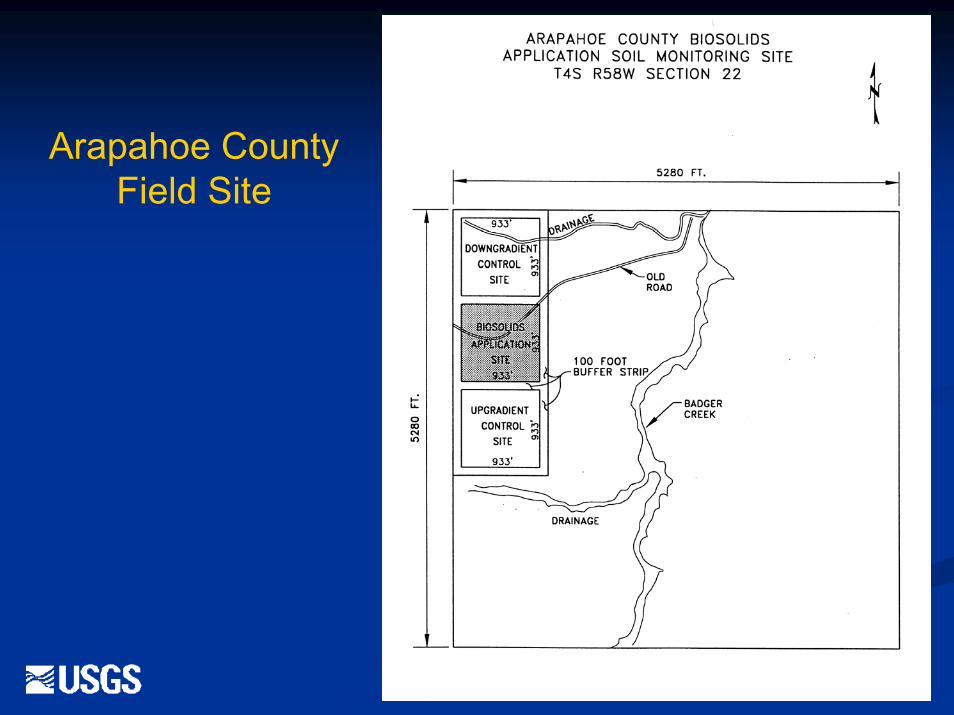
Arapahoe County Field Site
Land UseLand Use

Biosolids as delivered for applicationBiosolids as delivered for application

Terra-Gator used for the application of biosolids

Biosolids after application

Materials SampledMaterials SampledAgricultural Soils: Two control sites and one Agricultural Soils: Two control sites and one site with biosolids applied for each of two site with biosolids applied for each of two counties prior to the application of biosolids counties prior to the application of biosolids (baseline). Soil is defined as the top 12 inches (baseline). Soil is defined as the top 12 inches (30 cm) material. Control sites are up and (30 cm) material. Control sites are up and down gradient to the application field.down gradient to the application field.Whole wheat plants prior to grain maturationWhole wheat plants prior to grain maturationWhole wheat or millet grainWhole wheat or millet grainMonthly 24 hour composite samples of the Monthly 24 hour composite samples of the biosolids at the Metro Wastewater Reclamation biosolids at the Metro Wastewater Reclamation District of Denver facilityDistrict of Denver facility
Soil Collection and PreparationSoil Collection and PreparationEach field is divided into a 5 by 6 grid for 30 subEach field is divided into a 5 by 6 grid for 30 sub--sample locations. At each location a core 5 cm sample locations. At each location a core 5 cm wide by 30 cm deep is dug with a stainless steel wide by 30 cm deep is dug with a stainless steel hand bucket auger, placed into a dishpan, hand bucket auger, placed into a dishpan, disaggregated and mixed by hand, and an one kg disaggregated and mixed by hand, and an one kg split is placed into a paper bag.split is placed into a paper bag.Soils are air dried in the laboratory (USGS GD, Soils are air dried in the laboratory (USGS GD, Denver) under ambient room temperature, usually Denver) under ambient room temperature, usually for 4 days.for 4 days.Each subEach sub--sample is disaggregated using a sample is disaggregated using a mechanical mortar, sieved to 2 mm (mechanical mortar, sieved to 2 mm (--10 mesh), 10 mesh), and the <2 mm material ground with a ceramic and the <2 mm material ground with a ceramic vertical grinder to pass an 100 mesh.vertical grinder to pass an 100 mesh.

Soil Collection and Preparation Soil Collection and Preparation (continued)(continued)
Each ground subEach ground sub--sample is mixed. A 30sample is mixed. A 30--gram split from each is placed into a liter gram split from each is placed into a liter jar. This ensures equal representation jar. This ensures equal representation from each subfrom each sub--sample.sample.The 0.9 Kg composite sample is reground The 0.9 Kg composite sample is reground using a vertical plate grinder and remixed. using a vertical plate grinder and remixed. Required splits are made using a Jones Required splits are made using a Jones SplitterSplitter®®..

Soil SamplingSoil Sampling
Plant CollectionPlant CollectionThe 2000 plant sampling was subsequent to one The 2000 plant sampling was subsequent to one biosolids application to the middle plots of both biosolids application to the middle plots of both county sites.county sites.Whole wheat plant Whole wheat plant –– Using a stainless steel Using a stainless steel pruning shears, cut the plants about 5 cm above pruning shears, cut the plants about 5 cm above the ground. Randomly collect at least 30 sites the ground. Randomly collect at least 30 sites within each of the fields. Plants had gone to seed within each of the fields. Plants had gone to seed head, but the kernels had not developed.head, but the kernels had not developed.Whole wheat and millet grain Whole wheat and millet grain -- Using a stainless Using a stainless steel pruning shears, cut the plants about 5 cm steel pruning shears, cut the plants about 5 cm below the seed head. Randomly collect at least below the seed head. Randomly collect at least 30 sites within each of the fields.30 sites within each of the fields.
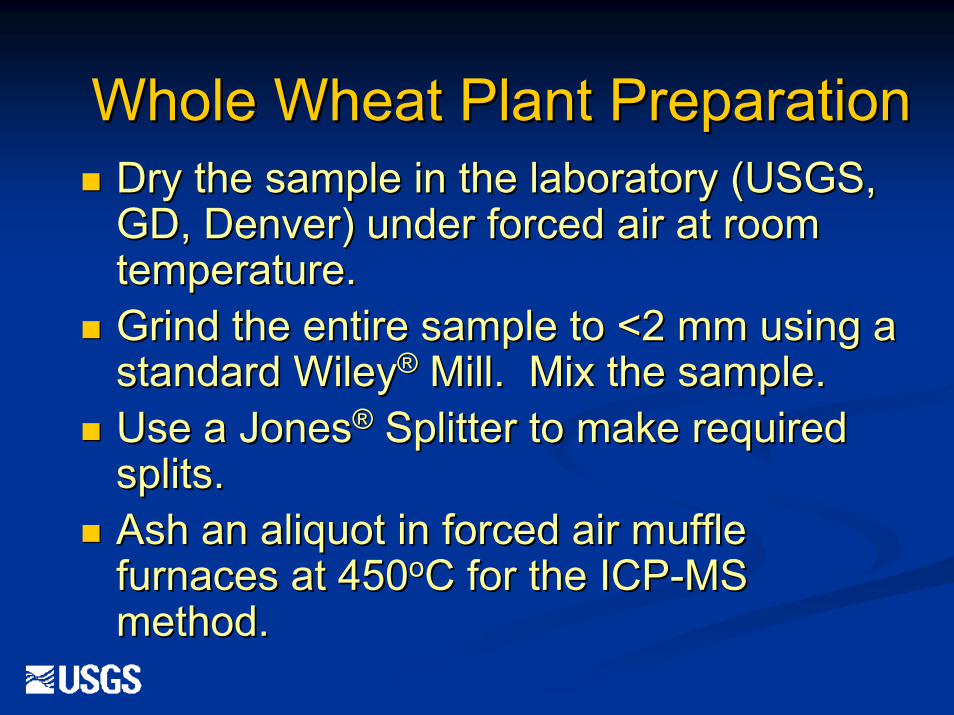
Whole Wheat Plant PreparationWhole Wheat Plant PreparationDry the sample in the laboratory (USGS, Dry the sample in the laboratory (USGS, GD, Denver) under forced air at room GD, Denver) under forced air at room temperature.temperature.Grind the entire sample to <2 mm using a Grind the entire sample to <2 mm using a standard Wileystandard Wiley®® Mill. Mix the sample.Mill. Mix the sample.Use a JonesUse a Jones®® Splitter to make required Splitter to make required splits.splits.Ash an aliquot in forced air muffle Ash an aliquot in forced air muffle furnaces at 450furnaces at 450ooC for the ICPC for the ICP--MS MS method.method.

Sampling Whole
Wheat Plant
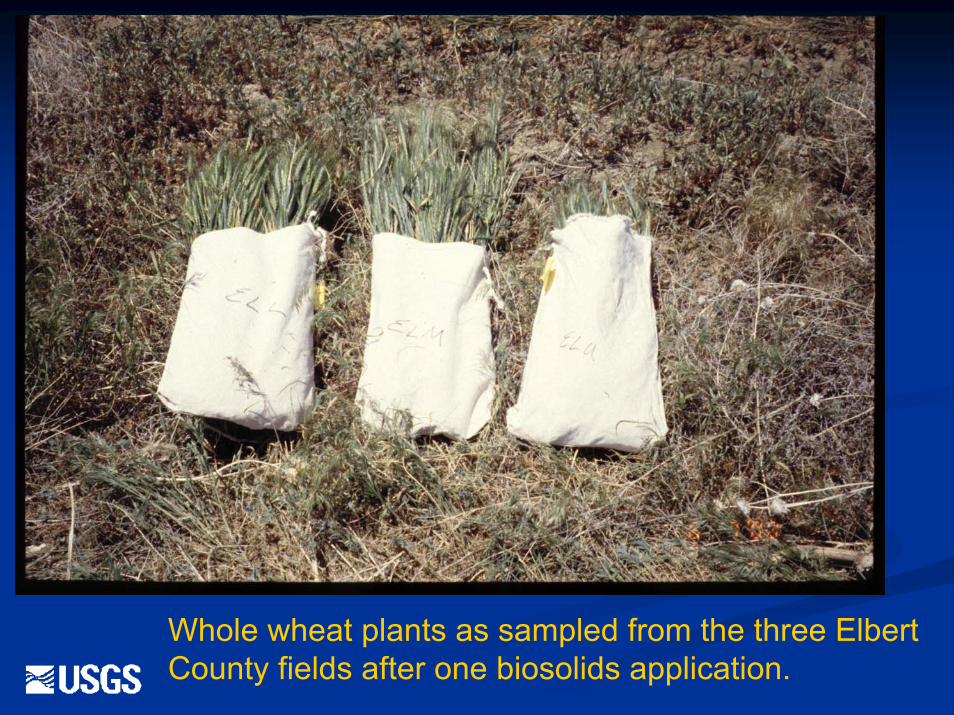
Whole wheat plants as sampled from the three Elbert County fields after one biosolids application.

Wheat grain after separation and cleaning
Wheat grain heads

Grain preparation and storage
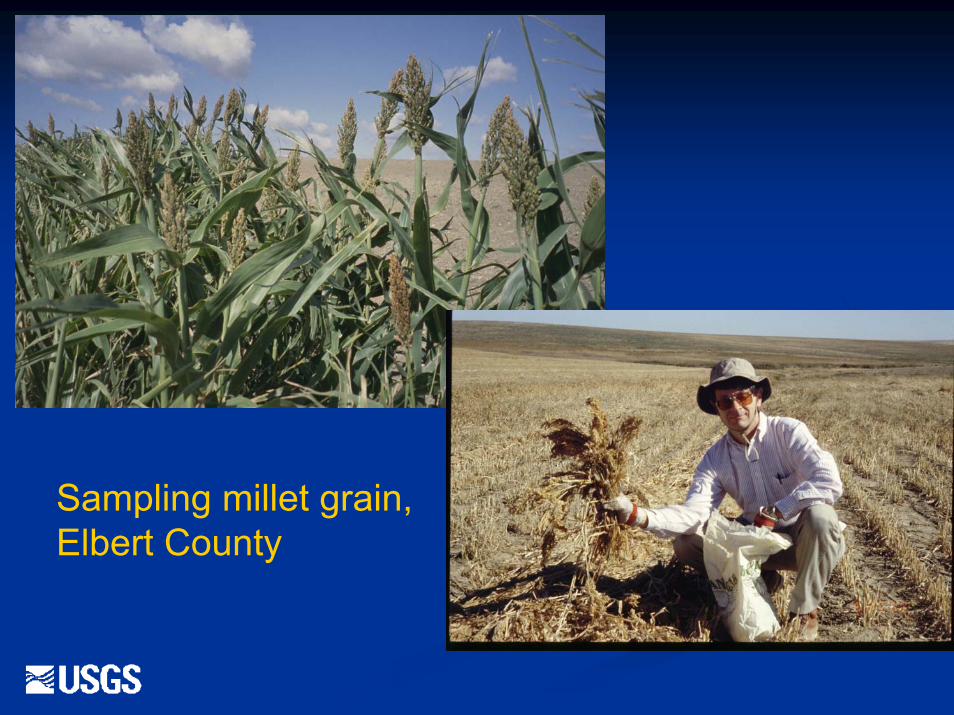
Sampling millet grain, Elbert County

Biosolids as received

Biosolids Sample PreparationBiosolids Sample PreparationAir dry at ambient room temperature at the Air dry at ambient room temperature at the laboratory (USGS, GD, Denver) in a plastic lined laboratory (USGS, GD, Denver) in a plastic lined container in a regular chemical hood. Mix often. container in a regular chemical hood. Mix often. This may take up to 8 days. The material is This may take up to 8 days. The material is reduced in volume by at least reduced in volume by at least 75%75%. Biosolids tend . Biosolids tend to be very hard and difficult to grind when dry.to be very hard and difficult to grind when dry.Jaw crush to pass 6 mm.Jaw crush to pass 6 mm.Grind to pass 150 mesh in an agate lined shatter Grind to pass 150 mesh in an agate lined shatter box.box.

1999 Metal Concentrations in Soils 1999 Metal Concentrations in Soils Arapahoe County (mg/Kg) Arapahoe County (mg/Kg) -- BaselineBaseline
ElementElement North North --ControlControl
Middle Middle ––Biosolids AppliedBiosolids Applied
South South --ControlControl
AsAs 7.07.0 6.66.6 6.46.4
CdCd 0.180.18 0.280.28 0.200.20
CuCu 1919 1717 1515
PbPb 1717 2121 1919
HgHg <0.02<0.02 <0.02<0.02 <0.02<0.02
MoMo 0.60.6 0.60.6 0.60.6
NiNi 1313 1515 1111
SeSe 0.40.4 0.40.4 0.30.3
ZnZn 6060 6363 5858

Gross Gross αα and and ββ and Puand Pu in 1999 Soils in 1999 Soils Arapahoe County (pCi/g) Arapahoe County (pCi/g) -- BaselineBaseline
North North --ControlControl
Middle Middle ––Biosolids Biosolids AppliedApplied
South South --ControlControl
Plutonium 238Plutonium 238 0.00+/0.00+/--0.010.01 0.00+/0.00+/--0.010.01 0.01+/0.01+/--0.020.02
Gross AlphaGross Alpha 16+/16+/--12*12* 15+/15+/--1616 13+/13+/--99
Gross BetaGross Beta 28+/28+/--88 27+/27+/--88 22+/22+/--77
Plutonium Plutonium 239+240239+240
0.02+/0.02+/--0.020.02 0.00+/0.00+/--0.010.01 0.00+/0.00+/--0.010.01
*Analytical uncertainty as reported by the laboratory. Limit of detection for Pu species is 0.06 pCi/g
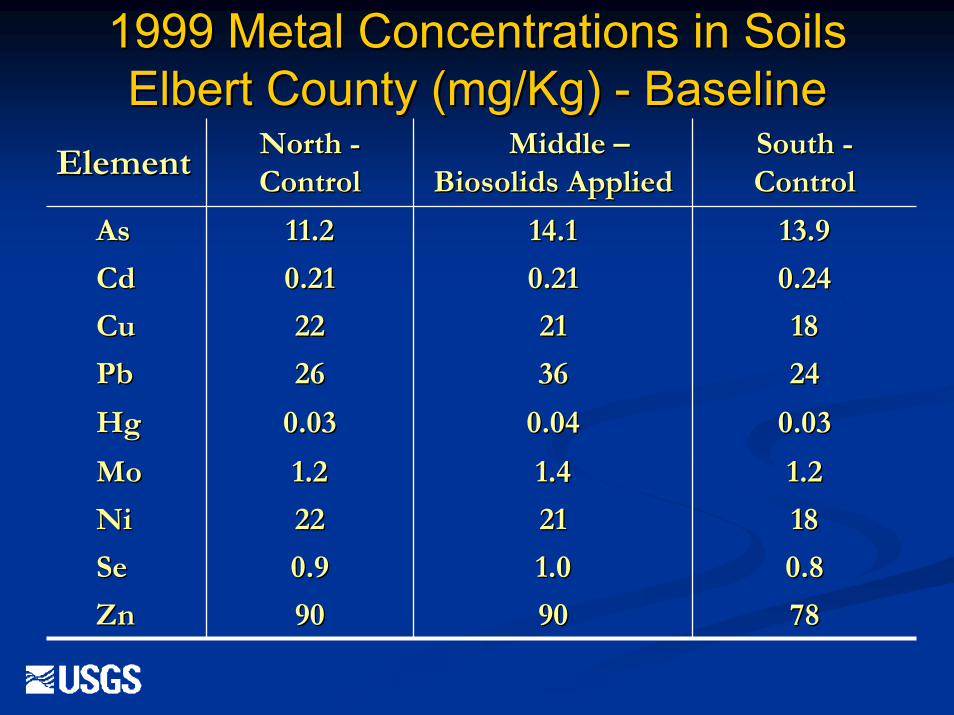
1999 Metal Concentrations in Soils 1999 Metal Concentrations in Soils Elbert County (mg/Kg) Elbert County (mg/Kg) -- BaselineBaseline
ElementElement North North --ControlControl
Middle Middle ––Biosolids AppliedBiosolids Applied
South South --ControlControl
AsAs 11.211.2 14.114.1 13.913.9
CdCd 0.210.21 0.210.21 0.240.24
CuCu 2222 2121 1818
PbPb 2626 3636 2424
HgHg 0.030.03 0.040.04 0.030.03
MoMo 1.21.2 1.41.4 1.21.2
NiNi 2222 2121 1818
SeSe 0.90.9 1.01.0 0.80.8
ZnZn 9090 9090 7878
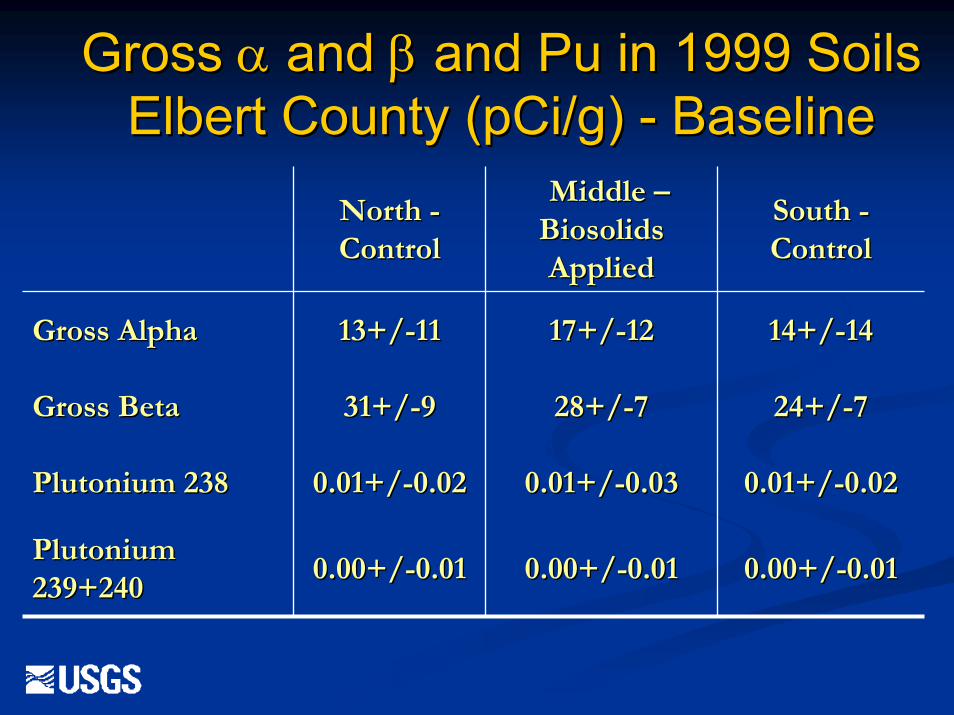
Gross Gross αα and and ββ and Puand Pu in 1999 Soils in 1999 Soils Elbert County (pCi/g) Elbert County (pCi/g) -- BaselineBaseline
North North --ControlControl
Middle Middle ––Biosolids Biosolids AppliedApplied
South South --ControlControl
Plutonium 238Plutonium 238 0.01+/0.01+/--0.020.02 0.01+/0.01+/--0.030.03 0.01+/0.01+/--0.020.02
Gross AlphaGross Alpha 13+/13+/--1111 17+/17+/--1212 14+/14+/--1414
Gross BetaGross Beta 31+/31+/--99 28+/28+/--77 24+/24+/--77
Plutonium Plutonium 239+240239+240
0.00+/0.00+/--0.010.01 0.00+/0.00+/--0.010.01 0.00+/0.00+/--0.010.01

COPPER IN SOIL, ELBERT COUNTY MONITORING SITE
0
5
10
15
20
25
30
35
1999 2000 2002
YEAR COLLECTED
CONC
ENTR
ATIO
N, IN
M
ILLI
GRA
MS
PER
KIL
OG
RAM
Biosolilds-appliedfield
North control field
South control field

MERCURY IN SOIL,ARAPAHOE COUNTY MONITORING SITE
00.0050.01
0.0150.02
0.0250.03
0.0350.04
0.045
1999 2001 2002
YEAR COLLECTED
CONC
ENT
RATI
ON,
IN
MIL
LIG
RAM
S PE
R KI
LOG
RAM
Biosolids-appliedfieldNorth control field
South control field
Note: Biosolids-applied and South-contro l fields plot on the same line.
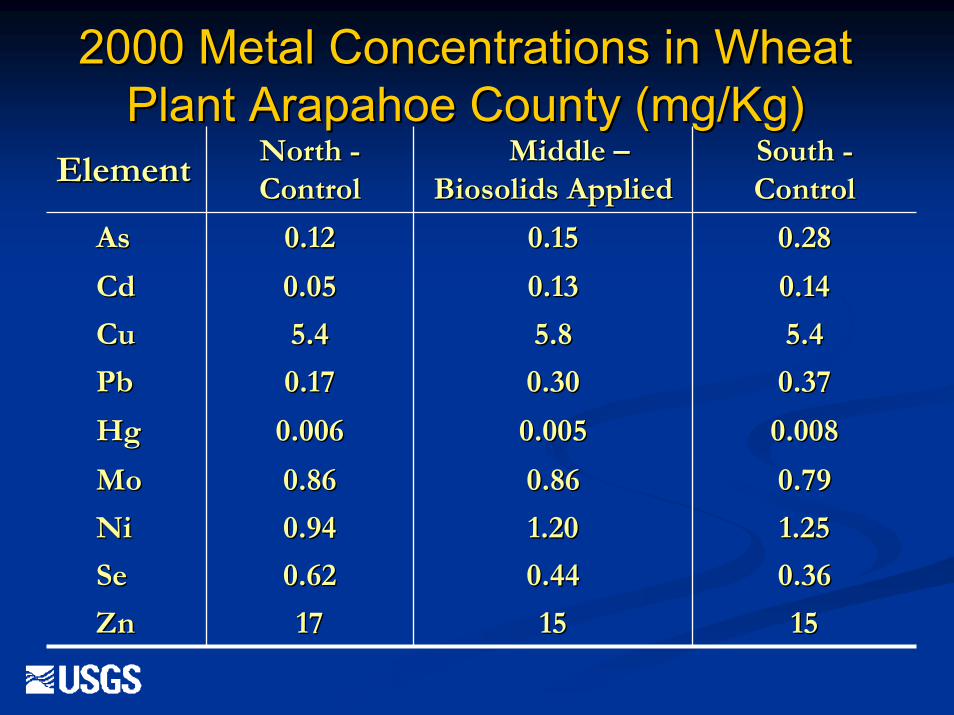
2000 Metal Concentrations in Wheat 2000 Metal Concentrations in Wheat Plant Arapahoe County (mg/Kg)Plant Arapahoe County (mg/Kg)
ElementElement North North --ControlControl
Middle Middle ––Biosolids AppliedBiosolids Applied
South South --ControlControl
AsAs 0.120.12 0.150.15 0.280.28
CdCd 0.050.05 0.130.13 0.140.14
CuCu 5.45.4 5.85.8 5.45.4
PbPb 0.170.17 0.300.30 0.370.37
HgHg 0.0060.006 0.0050.005 0.0080.008
MoMo 0.860.86 0.860.86 0.790.79
NiNi 0.940.94 1.201.20 1.251.25
SeSe 0.620.62 0.440.44 0.360.36
ZnZn 1717 1515 1515
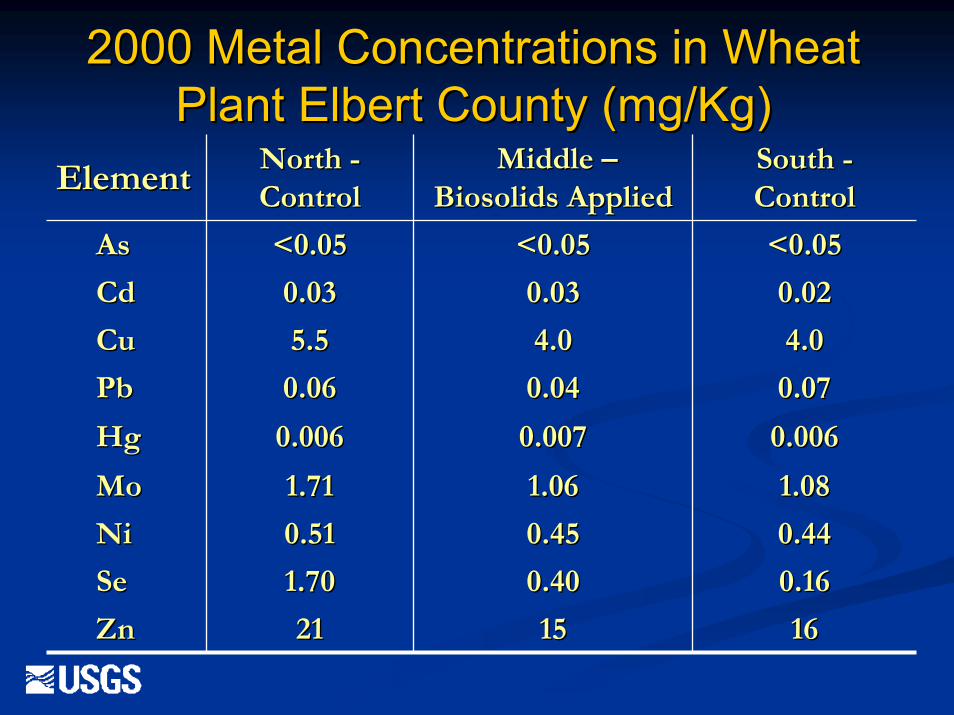
2000 Metal Concentrations in Wheat 2000 Metal Concentrations in Wheat Plant Elbert County (mg/Kg)Plant Elbert County (mg/Kg)
ElementElement North North --ControlControl
Middle Middle ––Biosolids AppliedBiosolids Applied
South South --ControlControl
AsAs <0.05<0.05 <0.05<0.05 <0.05<0.05
CdCd 0.030.03 0.030.03 0.020.02
CuCu 5.55.5 4.04.0 4.04.0
PbPb 0.060.06 0.040.04 0.070.07
HgHg 0.0060.006 0.0070.007 0.0060.006
MoMo 1.711.71 1.061.06 1.081.08
NiNi 0.510.51 0.450.45 0.440.44
SeSe 1.701.70 0.400.40 0.160.16
ZnZn 2121 1515 1616
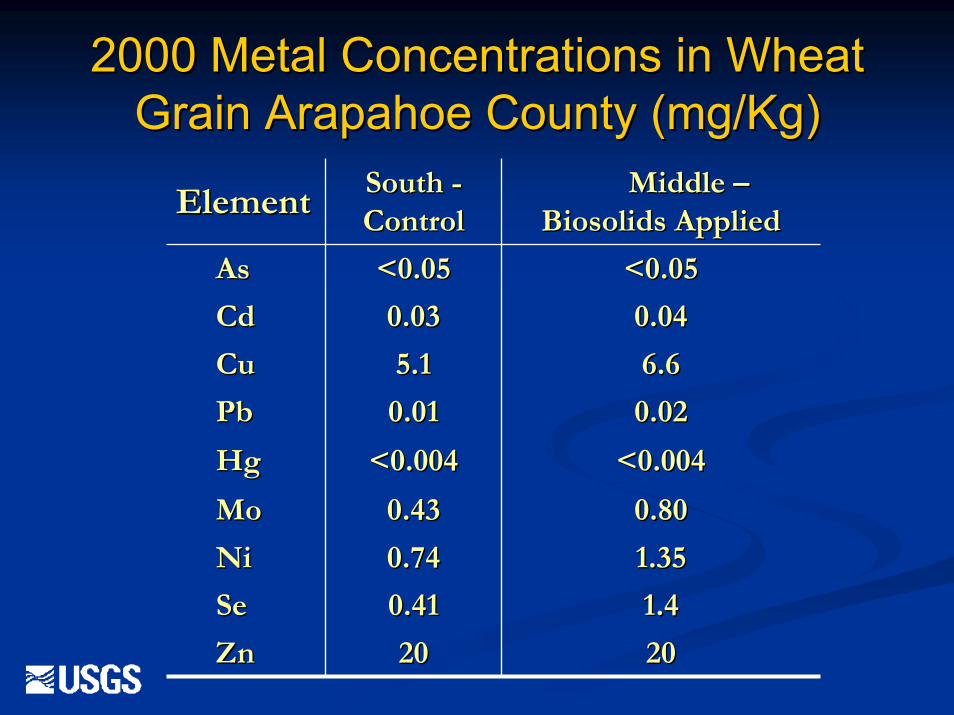
2000 Metal Concentrations in Wheat 2000 Metal Concentrations in Wheat Grain Arapahoe County (mg/Kg)Grain Arapahoe County (mg/Kg)
ElementElement South South --ControlControl
Middle Middle ––Biosolids AppliedBiosolids Applied
AsAs <0.05<0.05 <0.05<0.05
CdCd 0.030.03 0.040.04
CuCu 5.15.1 6.66.6
PbPb 0.010.01 0.020.02
HgHg <0.004<0.004 <0.004<0.004
MoMo 0.430.43 0.800.80
NiNi 0.740.74 1.351.35
SeSe 0.410.41 1.41.4
ZnZn 2020 2020
2000 Metal Concentrations in Wheat 2000 Metal Concentrations in Wheat Grains Elbert County (mg/Kg)Grains Elbert County (mg/Kg)
ElementElement North North --ControlControl
Middle Middle ––Biosolids AppliedBiosolids Applied
South South --ControlControl
AsAs <0.05<0.05 <0.05<0.05 <0.05<0.05
CdCd 0.020.02 0.020.02 0.020.02
CuCu 4.94.9 4.84.8 4.54.5
PbPb <0.01<0.01 0.010.01 <0.01<0.01
HgHg <0.004<0.004 <0.004<0.004 <0.004<0.004
MoMo 0.700.70 0.510.51 0.610.61
NiNi 0.430.43 0.500.50 0.500.50
SeSe 2.12.1 0.640.64 0.380.38
ZnZn 2626 2525 2222
2000 Gross 2000 Gross αα and and ββ and Puand Pu Wheat Wheat Grains Elbert County (pCi/g)Grains Elbert County (pCi/g)
North North --ControlControl
Middle Middle ––Biosolids Biosolids AppliedApplied
South South --ControlControl
Plutonium 238Plutonium 2380.00+/0.00+/--
0.030.030.00+/0.00+/--0.010.01 0.00+/0.00+/--0.010.01
Gross AlphaGross Alpha 1+/1+/--11 1+/1+/--11 1+/1+/--11
Gross BetaGross Beta 6+/6+/--22 6+/6+/--22 5+/5+/--22
Plutonium Plutonium 239+240239+240
0.00+/0.00+/--0.010.01
0.00+/0.00+/--0.000.00 0.00+/0.00+/--0.010.01

2000 Metal Concentrations in Millet 2000 Metal Concentrations in Millet Grain, Arapahoe County (mg/Kg)Grain, Arapahoe County (mg/Kg)
ElementElement North North --ControlControl
Middle Middle ––Biosolids AppliedBiosolids Applied
South South --ControlControl
AsAs 0.070.07 0.040.04 0.060.06
CdCd 0.050.05 0.050.05 0.060.06
CuCu 7.07.0 7.17.1 7.47.4
PbPb 0.210.21 0.020.02 0.060.06
HgHg <0.004<0.004 <0.004<0.004 <0.004<0.004
MoMo 0.730.73 0.780.78 0.650.65
NiNi 6.46.4 6.56.5 5.35.3
SeSe 0.260.26 0.240.24 0.270.27
ZnZn 2222 1919 2121
Metal Concentrations in Biosolids (mg/Kg)Metal Concentrations in Biosolids (mg/Kg)ElementElement Maximum for Maximum for
Grade IGrade IMarMar--9999
MarMar--0101
MarMar--0202
MarMar--0404
DecDec--0505
AsAs
CdCdCuCuPbPbHgHgMoMoNiNiSeSeZnZn
1.71.7 1.91.91.11.12.32.31.91.94141
3939150015002002001717
2.32.3 1.81.8
75 (Grade II)75 (Grade II)
2.92.9
420420
3.23.2
100100
4.04.06306307777
615615 566566
2.22.23131
560560
30307.77.7
61061060601.61.6
4141 4141
27272929
28002800
67671.31.33030
6306307.07.0
1.61.6 0.90.9
690690
2.22.28.38.3580580
2525 24242020 17177.67.6 7.97.9604604 702702
Gross Gross αα and and ββ and Puand Pu in Biosolids (pCi/g)*in Biosolids (pCi/g)*(N.D. (N.D. –– not determined)not determined)
Maximum for Maximum for Grade IGrade I
MarMar--9999 JunJun--0000 JulJul--0101 FebFeb--0404 JanJan--0606
Gross Gross αα, , ppmppm
Gross Gross ββ, , ppmppm
Pu 238Pu 238
Pu Pu 239+240239+240
44*/44*/--1111 14+/14+/--77 N.D.N.D. N.D.N.D.19+/19+/--774040
No Set No Set StandardStandard
23+/23+/--66 23+/23+/--66 N.D.N.D. N.D.N.D.
No Set No Set StandardStandard
24+/24+/--77
0.00+/0.00+/--0.010.01
No Set No Set StandardStandard
0.00+/0.00+/--0.010.01
0.00+/0.00+/--0.010.01
0.00+/0.00+/--0.010.01
0.02+/0.02+/--0.020.02
0.02+/0.02+/--0.010.01
0.00+/0.00+/--0.010.01
0.00+/0.00+/--0.010.01
0.00+/0.00+/--0.020.02
0.01+/0.01+/--0.010.01
*Analytical uncertainty as reported by the laboratory. Limit ofdetection for Pu species is 0.06 pCi/g

COPPER IN BIOSOLIDS
0
200
400
600
800
1000
1200
1400
1600
1800
Mar-99
Sep-99
Mar-00
Aug-00
Oct-00
Dec-00
Feb-0
1Apr-
01Ju
n-01
Aug-01
Oct-01
Dec-01
Feb-0
2Apr-
02Ju
n-02
Aug-02
Oct-02
Dec-02
Feb-0
3Apr-
03
DATE COLLECTED
CO
NCEN
TRAT
ION,
mg/
kg
Maximum concentration allowed for Table 3 (Grade I) biosolids = 1,500 mg/kg
MERCURY IN BIOSOLIDS
0
2
4
6
8
10
12
14
16
18
20
Mar-99
Sep-99Mar-0
0
Aug-00Oct-
00
Dec-00
Feb-01Apr-0
1Ju
n-01
Aug-01Oct-
01
Dec-01
Feb-02Apr-0
2Ju
n-02
Aug-02Oct-
02
Dec-02
Feb-03Apr-0
3
DATE COLLECTED
CONC
ENTR
ATIO
N, m
g/kg
Maximum concentration allowed for Table 3 (Grade I) biosolids = 17 mg/kg

When do you notice potential metal When do you notice potential metal accumulation in soils from biosolids accumulation in soils from biosolids
application? One worst case scenario application? One worst case scenario -- Copper in Arapahoe County soilsCopper in Arapahoe County soilsAssume: All the Cu introduced by the biosolids stays Assume: All the Cu introduced by the biosolids stays in the soil of the 20 acre field and that the biosolids in the soil of the 20 acre field and that the biosolids application rate remains constant at 1034 Kg/acre application rate remains constant at 1034 Kg/acre ((~ 1 yd~ 1 yd33/acre)/acre), every other year., every other year.Measurements: Top 12 inches (30 cm) of soil, Measurements: Top 12 inches (30 cm) of soil, average soil density of 1.4 gm/cmaverage soil density of 1.4 gm/cm33, baseline soil Cu , baseline soil Cu is 16 is 16 ±± 5 ppm, average biosolids Cu content is 620 5 ppm, average biosolids Cu content is 620 ppm.ppm.

One worst case scenario One worst case scenario -- Copper in Copper in Arapahoe County soils (Continued)Arapahoe County soils (Continued)
1.28 x 101.28 x 1077 mg Cu applied to the entire field per mg Cu applied to the entire field per biosolids applicationbiosolids application3.44 x 103.44 x 1077 Kg soil in the top 12 inches of the plotKg soil in the top 12 inches of the plot0.37 mg Cu/Kg or 0.37 ppm Cu increase per 0.37 mg Cu/Kg or 0.37 ppm Cu increase per application of biosolids or about 2% increaseapplication of biosolids or about 2% increase±±5 ppm Cu is the natural soil variability 5 ppm Cu is the natural soil variability –– 5 ppm 5 ppm would equal 14 applications, or 28 years, before would equal 14 applications, or 28 years, before natural variability would not account for the natural variability would not account for the increase of soil Cu contentincrease of soil Cu content
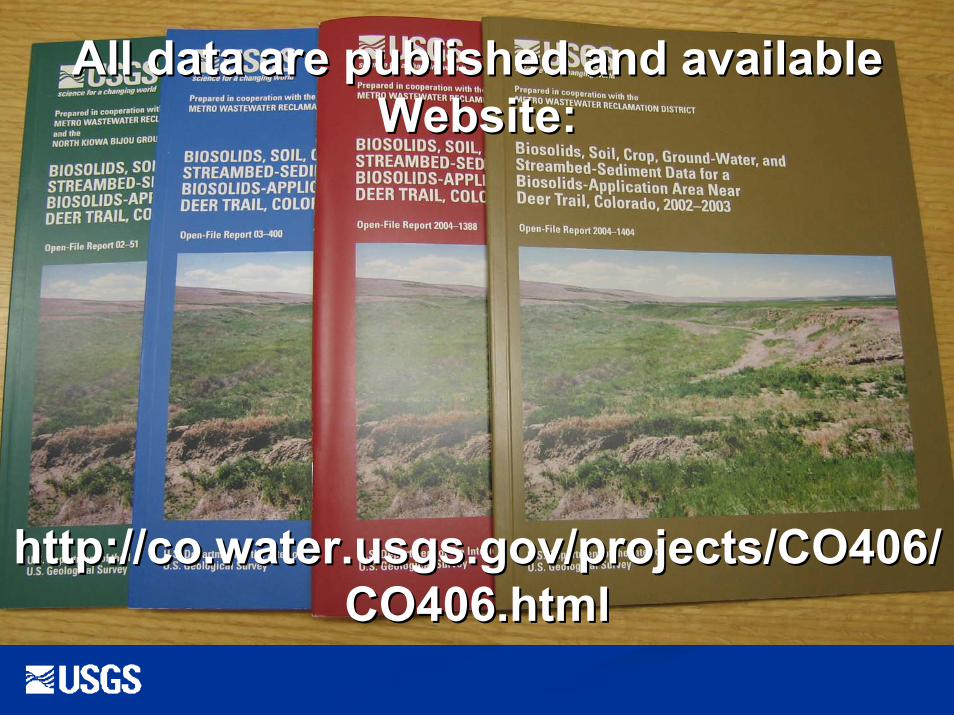
All data are published and available All data are published and available Website: Website:
http://co.water.usgs.gov/projects/CO406/http://co.water.usgs.gov/projects/CO406/CO406.htmlCO406.html
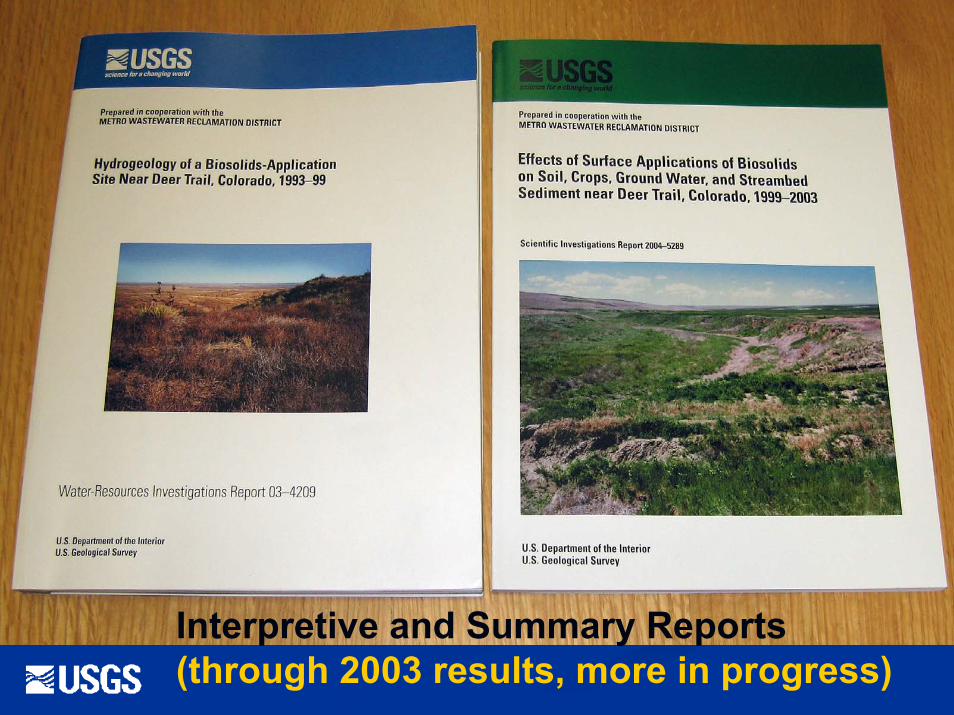
Interpretive and Summary Reports (through 2003 results, more in progress)
ConclusionsConclusionsAll the target metal total concentrations for the All the target metal total concentrations for the biosolids are consistently below the maximum biosolids are consistently below the maximum allowable values for Grade I biosolids for the state allowable values for Grade I biosolids for the state of Colorado and are consistent over time.of Colorado and are consistent over time.All isotopes of plutonium were always below the All isotopes of plutonium were always below the reported limit of detection (0.06 pCi/g).reported limit of detection (0.06 pCi/g).PrePre--application baseline information indicate the 2 application baseline information indicate the 2 fields are geochemically different fields are geochemically different –– the Elbert the Elbert County field is higher in most of the target County field is higher in most of the target elements due to the occurrence of Pierre Shale as elements due to the occurrence of Pierre Shale as the soil parent material.the soil parent material.
Conclusions (continued)Conclusions (continued)The method of compositing the soils The method of compositing the soils provided a representative sample for the provided a representative sample for the test fields.test fields.Vegetation samples tend to show similar Vegetation samples tend to show similar elemental patterns as the parent soil. As a elemental patterns as the parent soil. As a results, crops may prove to be a viable results, crops may prove to be a viable indicator of metal accumulation and bioindicator of metal accumulation and bio--availability in the biosolidsavailability in the biosolids--amended soilsamended soils
For more information:For more information:
Email: Email: [email protected]@[email protected]@[email protected]@usgs.gov
Website: Website: http://co.water.usgs.gov/projects/CO4http://co.water.usgs.gov/projects/CO406/CO406.html06/CO406.html

Thank You!!Estes Park, CO