application of nitrilotriacetic acid modified gold
TRANSCRIPT
Int. J. Electrochem. Sci., 9 (2014) 3701 - 3714
International Journal of
ELECTROCHEMICAL SCIENCE
www.electrochemsci.org
Application of Nitrilotriacetic Acid Modified Gold Electrode for
Determination of Lead in Natural Waters with Differential
Pulse Adsorptive Cathodic Stripping Voltammetry
Marina Palcic1, Stjepan Milardovic
2,*, Irena Kerekovic
2 and Zorana Grabaric
1
1Department of Chemistry and Biochemistry, Faculty of Food Technology and Biotechnology,
University of Zagreb, Pierottijeva 6, 10000 Zagreb, Croatia 2Department of General and Inorganic Chemistry, Faculty of Chemical Engineering and Technology,
University of Zagreb, Marulicev trg 19, 10000 Zagreb, Croatia *E-mail: [email protected]
Received: 20 February 2014 / Accepted: 18 March 2014 / Published: 14 April 2014
A self assembled monolayer of cysteamine (CA) was prepared on the surface of gold disc electrode
and further modified with nitrilotriacetic acid (NTA). Characterization of prepared Au/CA/NTA
electrode was done with cyclic voltammetry and electrochemical impedance spectroscopy in the
presence of potassium hexacyanoferrate(II)/(III). Thus prepared electrode was tested for determination
of lead. The response of modified electrode to Pb2+
concentration was measured by differential pulse
adsorptive cathodic stripping voltammetry. Under the optimized working conditions (accumulation
time, pH of accumulation and stripping solutions) the dependence of the stripping peak current
response on concentration of Pb2+
was linear in the range of 0.002 – 10 µM with a correlation
coefficient of 0.9839. The interference of Co2+
, Ni2+
Mg2+
, Mn2+
and Ca2+
was found to be
significantly reduced for analyte preconcentration from borate buffer pH = 7.0. Lead determination in
potable and thermal water samples confirmed practical application of prepared sensor.
Keywords: Gold electrode; Nitrilotriacetic acid; Self assembled monolayer; Lead determination;
Cathodic stripping voltammetry
1. INTRODUCTION
Global industrialization initiated high exploitation of natural resources in search for fuel and
metals that are necessary for industrial development. This leads to increased concentration of heavy
metals in the environment. Because of its abundant use in fuel industry during the past century, lead is
one of the pollutants widespread in soil, especially in vicinity of high traffic roads, which enabled its
integration into the food chain. Once ingested, heavy metals are distributed by blood to bones and soft
tissues where they tend to accumulate [1]. Toxicological effects of lead to organs that are involved in
Int. J. Electrochem. Sci., Vol. 9, 2014
3702
excretion process, such as kidneys and liver, are ascribed to oxidative stress causing various
degenerative changes in soft tissue [2]. Oxidative stress induced by lead accumulation also affects
central neural system leading to cognitive and motoric defects, as well as neurobehavioral alteration
[3]. In order to monitor lead concentration in environment and all steps of food production, sensitive
and accurate method needs to be developed. Some of the most sensitive techniques for lead
determination in environmental and biological samples are atomic absorption spectrometry,
inductively coupled plasma–atomic emission spectrometry and inductively coupled plasma–mass
spectrometry. The main disadvantage of these techniques is high cost of equipment [4].
Electrochemical techniques, such as stripping analysis, require much cheaper equipment and still allow
detection of metal traces. Dropping mercury electrode can be used to detect metal concentrations as
low as 0.1 µg/L [5]. As alternative to toxic mercury electrodes, various non-toxic materials such as
screen printed carbon [6], gold [7] or bismuth [8] are widely used. Application of metal electrodes
(most frequently gold) with functionalized surface is another alternative for lead determination by
voltammetric methods, such as square wave voltammetry, with the limit of detection as low as 0.5
µg/L [9].
Modification of metal electrode (gold, silver, copper and platinum) by self assembled
monolayers (SAMs) based on organic thiols has been extensively studied over the last 20 years, since
Nuzzo and Allara [10,11] discovered that alkenthiolate SAMs can be prepared by adsorption from
diluted solution. Thiol SAMs provide platform for design of a broad number of functionalized layers
on metal surfaces and can be easily engineered with variety of desired properties [12]. Modified SAMs
can thus be applied for sensor construction for recognition of biologically important molecules such as
glucose [13,14], dopamine [15], endotoxins [16], proteins [17], antioxidants [18], cholesterol [19],
vitamins [20] antibodies and antigens [21] and DNA [22]. SAMs containing different surface groups (-
OH, -NH2, -COOH, -PO42-
) are widely used for complexation of metal ions like Cu2+
[9,23,24], UO2
2+
[25], Zr4+
[26], F-
[27], Mg2+
, Ca2+
, Sr2+
[28] and lanthanide(III) [29]. SAMs terminated with
nitrilotriacetic acid complexed with Me2+
are used for selective immobilization of His-tagged proteins
[30].
The main purpose of this research was to prepare a sensor with cysteamine self-assembled
monolayer on gold electrode (Au/CA) functionalized with nitrilotriacetic acid (Au/CA/NTA). Due to
tendency of NTA to form tetravalent chelate with various transition metals in bulk, sensor was used to
measure lead concentration in different water samples by differential pulse adsorptive cathodic
stripping voltammetry (DPAdCSV). The sensor was characterised with cyclic voltammetry (CV) and
electrochemical impedance spectroscopy (EIS), methods recently used to study SAMs modified
electrodes, electron transfer kinetics and determination of inorganic and organic substances [9,25].
2. EXPERIMENTAL
2.1. Chemicals and solutions
Cysteamine (CA) was obtained from Fluka, N-hydroxysuccinimide (NHS), 1-ethyl-3-(3-
dimethylaminopropyl)carbodiimide hydrochloride (EDC) and nitrilotriacetic acid disodium salt (NTA)
were from Sigma-Aldrich. Disodium hydrogen phosphate dihydrate, sodium dihydrogen phosphate
Int. J. Electrochem. Sci., Vol. 9, 2014
3703
hydrate, acetic acid, sodium acetate, sodium perchlorate, disodium tetraborate decahydrate,
hydrochloric acid and sodium hydroxide used for preparation and adjusting pH values of 0.1 M
solutions of phosphate, acetate and 0.01 M borate buffer were purchased from Kemika. Ethanol for CA
preparation, potassium hexacyanoferrate(II) and lead(II) nitrate were purchased from Kemika, too.
Perchloric acid for electrochemical polishing and potassium hexacyanoferrate(III) were from Merck.
Disodium ethylenediaminetetraacetic acid salt (EDTA) obtained by Sigma was used to prepare
solution for sensor regeneration. All chemicals were of analytical grade and all solutions were prepared
with ultra pure water from Millipore-MilliQ system (USA).
2.2. Instrumentation
All electrochemical measurements were carried out in a three-electrode cell. Gold disc and
platinum wire were used as working and counter electrode, respectively. Reference electrode for CV
and EIS measurements was Hg|Hg2Cl2| KCl saturated electrode (SCE) and for DPAdCSV
measurements Ag|AgCl|3 M KCl. Solutions were deaerated with nitrogen for 10 min before
measurements. All experiments were performed at room temperature.
Potentiostat 263 A (Princeton Applied Research, USA) connected to a computer for data
collecting and analysis using EG&G-PowerSuite software was used for CV. All measurements were
carried out at 50 mV/s scan rate.
The same potentiostat connected to frequency response detector model 1025 (PAR, USA), was
used for EIS. The frequency range for impedance measurements was between 100 mHz and 100 kHz.
Small sinusoidal AC signal of ±5 mV was applied to +200 mV vs. SCE, formal potential of redox
couple [Fe(CN)6]3–/4–
. Equivalent circuit parameters were calculated by fitting the EIS data using
appropriate circuit by EG&G ZsimpWin software.
Differential pulse adsorptive cathodic stripping voltammetry measurements were carried out on
EG&G Princeton Applied Research (USA) Polarographic analyzer/stripping voltammeter Model 264
connected to computer via eDAQ e-corder model ED410 (Australia) for recording and analysis of
experimental data. All stripping measurements were taken at 20 mV/s scan rate with 25 mV pulse
amplitude.
ICP-MS Elan DRC (Perkin Elmer, USA) was used to analyse mineral content in thermal and
spring waters.
2.3. Au/CA/NTA electrode preparation
A gold electrode of 1 mm diameter was chemically cleaned by 3 min immersion in Piranha
solution (V(H2O2, 30 %):V(H2SO4, conc.) = 1:3), then polished on a flat pad to obtain mirror-like
surface with SiC powder of different mesh (240, 800 and 1200) and finally by 1 and 0.25 µm Al2O3
powder. After electrode surface treatment with each polishing powder, electrode was ultrasonically
cleaned in ultra pure water for 5 min followed by another 5 min in ethanol. Prior to next cleaning step,
electrode was rinsed with ultra pure water. Subsequently, the Au electrode was electrochemically
Int. J. Electrochem. Sci., Vol. 9, 2014
3704
polished in 0.1 M HClO4 between 0 and 1.5 V until the stable cyclic voltammogram was obtained.
Assuming 482 µC cm-2
charge density for reduction of AuO monolayer, real electrode surface was
calculated from the integration of reduction peak at 0.9 V vs. reference electrode, [31]. A roughness
factor calculated as the ratio of real and geometric surface was 1.4.
Formation of CA self assembled monolayer, performed by immersion of electrode in 18 mM
ethanolic solution of CA, was the first step in modification of a gold electrode. After approximately 24
h in dark at room temperature, electrode was removed from CA solution and thoroughly rinsed with
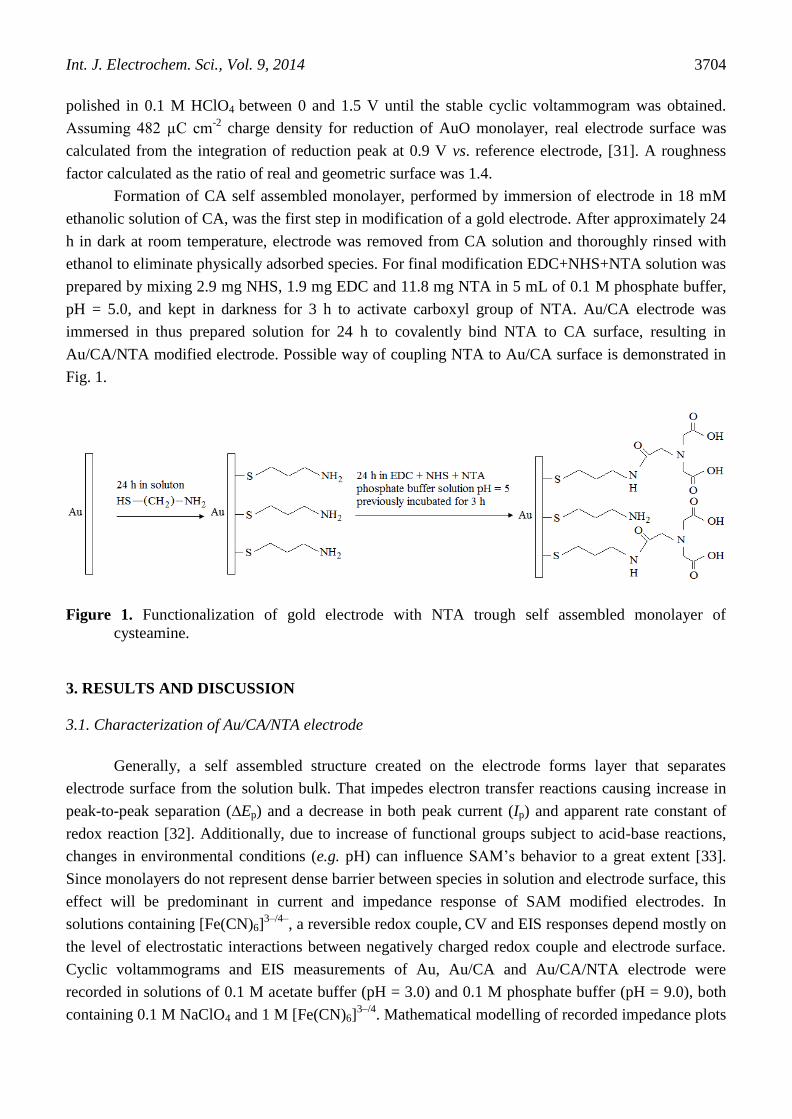
ethanol to eliminate physically adsorbed species. For final modification EDC+NHS+NTA solution was
prepared by mixing 2.9 mg NHS, 1.9 mg EDC and 11.8 mg NTA in 5 mL of 0.1 M phosphate buffer,
pH = 5.0, and kept in darkness for 3 h to activate carboxyl group of NTA. Au/CA electrode was
immersed in thus prepared solution for 24 h to covalently bind NTA to CA surface, resulting in
Au/CA/NTA modified electrode. Possible way of coupling NTA to Au/CA surface is demonstrated in
Fig. 1.
Figure 1. Functionalization of gold electrode with NTA trough self assembled monolayer of
cysteamine.
3. RESULTS AND DISCUSSION
3.1. Characterization of Au/CA/NTA electrode
Generally, a self assembled structure created on the electrode forms layer that separates
electrode surface from the solution bulk. That impedes electron transfer reactions causing increase in
peak-to-peak separation (∆Ep) and a decrease in both peak current (Ip) and apparent rate constant of
redox reaction [32]. Additionally, due to increase of functional groups subject to acid-base reactions,
changes in environmental conditions (e.g. pH) can influence SAM’s behavior to a great extent [33].
Since monolayers do not represent dense barrier between species in solution and electrode surface, this
effect will be predominant in current and impedance response of SAM modified electrodes. In
solutions containing [Fe(CN)6]3–/4–
, a reversible redox couple, CV and EIS responses depend mostly on
the level of electrostatic interactions between negatively charged redox couple and electrode surface.
Cyclic voltammograms and EIS measurements of Au, Au/CA and Au/CA/NTA electrode were
recorded in solutions of 0.1 M acetate buffer (pH = 3.0) and 0.1 M phosphate buffer (pH = 9.0), both
containing 0.1 M NaClO4 and 1 M [Fe(CN)6]3–/4
. Mathematical modelling of recorded impedance plots

Int. J. Electrochem. Sci., Vol. 9, 2014
3705
was done using Randles equivalent circuit with constant phase element, CPE (Inset in Fig. 2b–C.) [34].
All parameter values presented in this work were calculated with respect to the unit electrode surface
(1 cm2).
Figure 2. a) Cyclic voltammograms and of Au (solid), Au/CA (dash) and Au/CA/NTA (dash-dot)
electrodes in 0.1 M phosphate buffer pH = 9.0 (A) and in 0,1 M acetate buffer pH =3.0 (B),
both buffers containing 0.1 M NaClO4 and 1 mM [Fe(CN)6]3–/4–
.
3.1.1. Cyclic voltammetry
Cyclic voltammograms defined in alkaline and acidic buffers are presented in Fig. 2a. At pH =
9.0 (Fig. 2a–A.) amino group of cysteamine is not protonated, contributing to neutral surface charge of
the electrode. Thus formed CA monolayer represents physical obstacle to direct contact between redox
couple and Au electrode surface. Compaired to bare gold electrode, slight decrease in Ip, an increase in
∆Ep of approximately 10 mV, as well as absence of gold hydrous oxide reduction peak at 0.4 V [35]
can be seen when electrode surface is covered with the first SAM. Further functionalization of surface

Int. J. Electrochem. Sci., Vol. 9, 2014
3706
with NTA and formation of Au/CA/NTA SAM led to another decrease in Ip of approximately 0.4 µA
and increase in ∆Ep of approximately 20 mV. Surface carboxyl groups of NTA are deprotonated at pH
= 9.0, therefore electrostatic repulsion is blocking the approach of the negative redox couple to
negatively charged electrode surface. In acidic solution i.e. pH = 3.0 (Fig. 2a–B.) carboxyl and amino
groups are highly protonated, resulting in different behavior of chemically modified electrode than in
alkaline media With protonated amino group of cysteamine, electrode surface is positively charged
facilitating approach of a negative redox couple to electrode surface. It corresponds to increase of Ip (~
0.3 µA) along with a decrease in ∆Ep of ~30 mV for Au/CA compared to unmodified electrode.
Formation of peptide bond between NTA carboxyl and CA amino groups on the top of Au/CA
electrode significantly decreased the number of free –NH3+, leading to decrease in Ip (~ 0.2 µA) and
increase in ∆Ep.
Figure 2. b) Nyquist plots of Au (solid), Au/CA (dash) and Au/CA/NTA (dash-dot) electrodes in 0.1
M phosphate buffer pH = 9.0 (C) and 0.1 M acetate buffer pH= 3.0 (D), both buffers containing
0.1 M NaClO4 and 1 mM [Fe(CN)6]3–/4–
. Inset (C) contains scheme of Randles equivalent
circuit used for modeling of measured EIS data .
Int. J. Electrochem. Sci., Vol. 9, 2014
3707
3.1.2. Electrochemical impedance spectroscopy
Generally, EIS results confirmed those obtained with CV. Binding of SAM on the electrode
surface slows down electron transfer reactions, which is reflected in the increase of the charge transfer
resistance i.e. enlargement of semicircular diameter. Formed CA monolayer, at pH = 9.0, demonstrated
an increase in Rct (Fig. 2b–C.) from 1.64 to 3.46 kΩ, correlating with decrease in Ip since amino group
of cysteamine contributes to neutral surface charge at that pH. Further modification of surface with
NTA monolayer led to another significant increase in Rct to 11.02 kΩ, as a result of repulsion between
negatively charged electrode surface and negative redox couple. As stated before, at acidic pH amino
group of cysteamine is protonated, so electrode surface is positively charged, resulting in decrease
(Fig. 2b–D) of Rct from 3.88 to 0.79 kΩ. Formation of Au/CA/NTA led to increase in Rct up to 1.71 kΩ
as a consequence of adding another layer on top of Au/CA SAM. When comparing Rct of Au/CA/NTA
in acidic and alkaline media (about 6 times higher in alkaline), we can conclude that surface charge has
much greater influence to apparent rate of redox reaction over thickness of barrier between redox
couple in solution and Au surface. Influence of layer thickness is more evident in reduction of
capacitance for measurements performed in both acidic and alkaline solutions, which is also in good
agreement with the theory [36]. The values of n (surface roughness CPE parameter) changed from 0.85
to 0.89 in pH = 9.0 and 0.87 to 0.89 in pH = 3.0, indicating that SAM surface is ’’smoother’’ and
behaviour of Au/CA/NTA electrode is more similar to an ideal capacitor than unmodified Au electrode
[37]. Warburg impedance values are practically the same, i.e. the differences are negligible as expected
if we assume that the thickness of the SAM is extremely small and does not affect the mass transfer of
a redox couple from solution to the electrode surface.
3.2. Optimization of analytical conditions of Au/CA/NTA electrode
Lead determination in water samples is a two-step procedure. First step is adsorptive
preconcentration of lead at open circuit potential onto Au/CA/NTA electrode from buffered sample
solution. After that, cathodic differential pulse voltammograms are recorded from +600 to –400 mV in
buffered Pb2+
free solutions. Between measurements, simple sensor regeneration is performed.
3.2.1. Preconcentration of Pb2+
Adsorption of Pb2+
, from continuously stirred solutions, onto Au/CA/NTA electrode performed
at open circuit potential was optimized regarding duration of preconcentration step, as well as
composition and pH of buffer solution. Duration of preconcentration step was studied and results are
presented in Fig. 3. It can be seen that after 10 min of accumulation time signal is only slightly
increasing (i.e. plateau was not reached). That is why 10 min was chosen as optimum preconcentration
time for all further measurements.

Int. J. Electrochem. Sci., Vol. 9, 2014
3708
Figure 3. Cathodic stripping voltammograms of Au/CA/NTA electrode recorded in 0.01 M borate
buffer pH = 8.0 at scan rate 20 mV/s, pulse height 25 mV after different accumulation time at
pH = 7.0 (0.01 M borate buffer); c(Pb2+
) = 50 µM. Inset shows peak current of Au/CA/NTA
electrode cathodic stripping voltammograms after different accumulation periods.
When evaluating the influence of chemical composition and pH of buffer solution on
adsorption of Pb(II) species onto sensor surface, several parameters need to be assessed. Total negative
surface charge, due to deprotonation of NTA at high pH, increases formation of complexes with
cationic species, such as Pb2+
and Pb(OH)+ [38]. Taking into consideration the surface pK value of
NTA (6.6) bound to the electrode surface trough one of the three carboxyl groups [39], it is expected
that enhanced adsorption of Pb2+
should be achieved from solutions with pH values higher than 6.6.
Similar work was presented by Shervedani et al. [9] where EDTA was used instead of NTA for
complexation of metal ion on top of electrode surface from phosphate buffer solution. A significant
signal decrease, as low as 20 % of maximum value (measured at pH = 3.0), was reported for pH = 7.0.
The authors ascribed it to competition of OH– (from accumulation solution) and EDTA (grafted on
electrode surface) for binding of Pb2+
, disregarding at the same time the increasing influence of
phosphate buffer as solution pH rises above 7. Taking into account solubility product of lead(II)
hydroxide (pKsp = 14.70) [40], at micromolar concentrations of Pb2+
below pH 7 hydroxide will not
precipitate. On the other hand when using 0.1 M phosphate buffer, PbHPO4 (pKsp = 9.92) [40] is
expected to precipitate even from nanomolar solutions of Pb2+
as pH rises slightly above 7.0. In order
to confirm previous statement, instead of phosphate buffer, accumulation was performed from acetate
and borate buffer solutions at pH = 3.0 – 6.5 and 7.0 – 10.0, respectively. As shown in Fig. 4. no
significant signal difference can be observed when preconcentration is performed in acetate buffer pH
= 3.0 – 6.0. As pH approaches surface pK value of NTA, signal continues to increase with maximum at
pH = 8.0. At high pH values (9 – 10) equilibrium concentration of hydroxide ions was at the point
where precipitation of Pb(OH)2 starts, which is obvious from the signal decrease. Borate buffer enables
Int. J. Electrochem. Sci., Vol. 9, 2014
3709
determination of lead in alkaline solutions due to formation of stabile lead-borate complex
[PbB(OH)4]+ (formation constant β1 = 5.21) [41], i.e. B(OH)4
– competes with hydroxide ions in
binding free Pb2+
. That is why, even in pH = 7.0 – 10.0, obtained signal values were two times higher
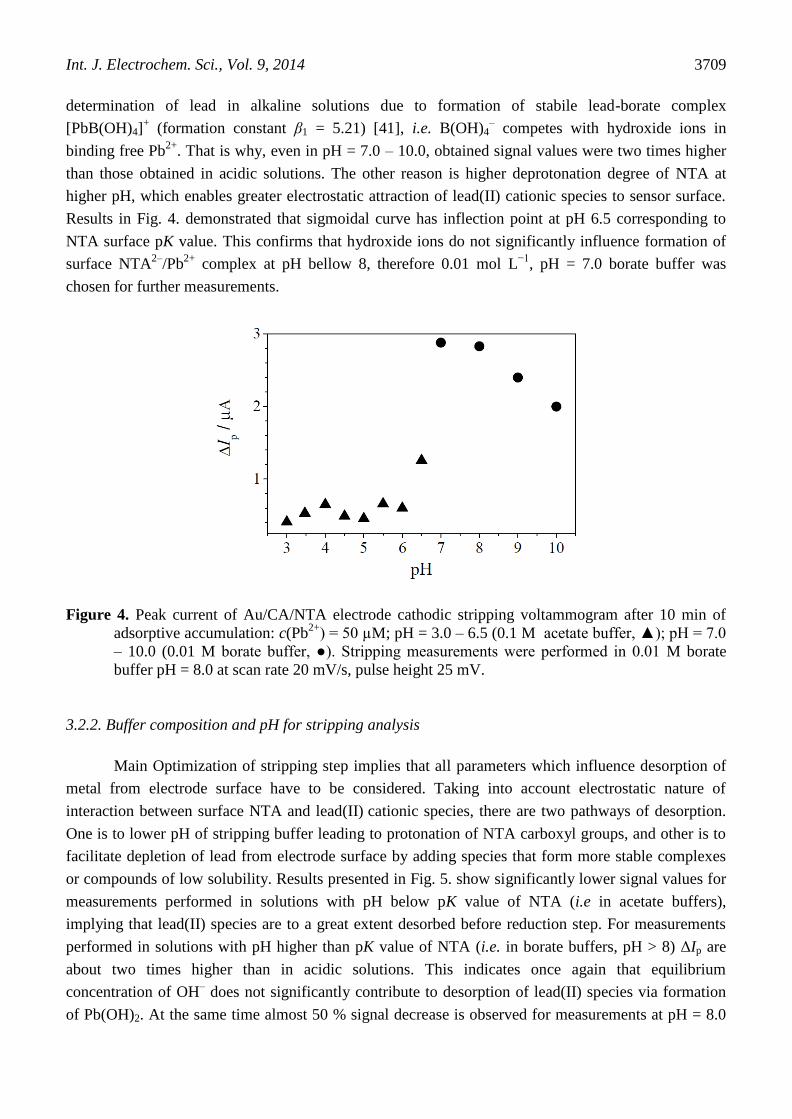
than those obtained in acidic solutions. The other reason is higher deprotonation degree of NTA at
higher pH, which enables greater electrostatic attraction of lead(II) cationic species to sensor surface.
Results in Fig. 4. demonstrated that sigmoidal curve has inflection point at pH 6.5 corresponding to
NTA surface pK value. This confirms that hydroxide ions do not significantly influence formation of
surface NTA2–
/Pb2+
complex at pH bellow 8, therefore 0.01 mol L−1
, pH = 7.0 borate buffer was
chosen for further measurements.
Figure 4. Peak current of Au/CA/NTA electrode cathodic stripping voltammogram after 10 min of
adsorptive accumulation: c(Pb2+
) = 50 µM; pH = 3.0 – 6.5 (0.1 M acetate buffer, ▲); pH = 7.0
– 10.0 (0.01 M borate buffer, ●). Stripping measurements were performed in 0.01 M borate
buffer pH = 8.0 at scan rate 20 mV/s, pulse height 25 mV.
3.2.2. Buffer composition and pH for stripping analysis
Main Optimization of stripping step implies that all parameters which influence desorption of
metal from electrode surface have to be considered. Taking into account electrostatic nature of
interaction between surface NTA and lead(II) cationic species, there are two pathways of desorption.
One is to lower pH of stripping buffer leading to protonation of NTA carboxyl groups, and other is to
facilitate depletion of lead from electrode surface by adding species that form more stable complexes
or compounds of low solubility. Results presented in Fig. 5. show significantly lower signal values for
measurements performed in solutions with pH below pK value of NTA (i.e in acetate buffers),
implying that lead(II) species are to a great extent desorbed before reduction step. For measurements
performed in solutions with pH higher than pK value of NTA (i.e. in borate buffers, pH > 8) ΔIp are
about two times higher than in acidic solutions. This indicates once again that equilibrium
concentration of OH– does not significantly contribute to desorption of lead(II) species via formation
of Pb(OH)2. At the same time almost 50 % signal decrease is observed for measurements at pH = 8.0

Int. J. Electrochem. Sci., Vol. 9, 2014
3710
when 0.1 M phosphate buffer (dashed line) was used instead of 0.01 borate buffer, confirming higher
influence of HPO42–
over OH–
equilibrium concentration on Pb2+
desorption. For stripping of lead(II),
0.01 M borate buffer pH = 8.0 was chosen as optimal.
Figure 5. Cathodic stripping voltammogram of Au/CA/NTA electrode after 10 min of adsorptive
accumulation: 0.01 M borate buffer pH = 7.0; c(Pb2+
) = 5.0 µM. Measurements were
performed in: 0.1 M acetate buffer pH = 4.0 – 6.0 (dotted line); 0.01 M borate buffer pH = 7.0
– 10.0 (solid line) and 0.1 M phosphate buffer pH = 8.0 (dashed line) at scan rate 20 mV/s,
pulse height 25 mV. Inset shows peak current for Pb2+
stripping performed in pH range 4.0 –
10.0 using acetate (▲), borate (●) and phosphate buffer (♦). ∆Ip = peak current after
background removal.
3.2.3. Sensor regeneration
Since lead was reduced on sensor surface during cathodic stripping analysis, it needed to be
electrochemically oxidized for 30 s at +600 mV after each measurement. Only after that, two
previously mentioned pathways of lead depletion from sensor surface can be used to regenerate sensor
surface between measurements. One by immersion in perchloric acid pH = 1.0 – 3.0, or the other by
chelating lead with ligand such as EDTA which forms more stable complexes than NTA (log β1(NTA)
= 11.39; log β1(EDTA) = 18.04 [40]). After 3 min soaking in stirred 50 mM EDTA solution, preceded
by applying potential of +600 mV for 30 s, lead free sensor surface was obtained. The efficiency of
cleaning was confirmed by equalize the base current before metal accumulation and after treatment in
EDTA cleaning solution.
3.2.4. Calibration
Response of Au/CA/NTA electrode, after 10 min electroless accumulation of Pb2+
from 0.01 M borate
buffer pH = 7, was tested in the concentration range 0.001 – 100 µM of Pb2+
, as presented in Fig. 6.
Approximately four orders of magnitude linear range (0.002 – 10 µM) can, to some extent, be shifted
towards lower detection limit by prolonging period of preconcentration. In that way, DPAdCSV can
Int. J. Electrochem. Sci., Vol. 9, 2014
3711
compete in analysis of trace metals with other stripping methods where electrolysis is used to
preconcentrate the target analyte on work electrode.
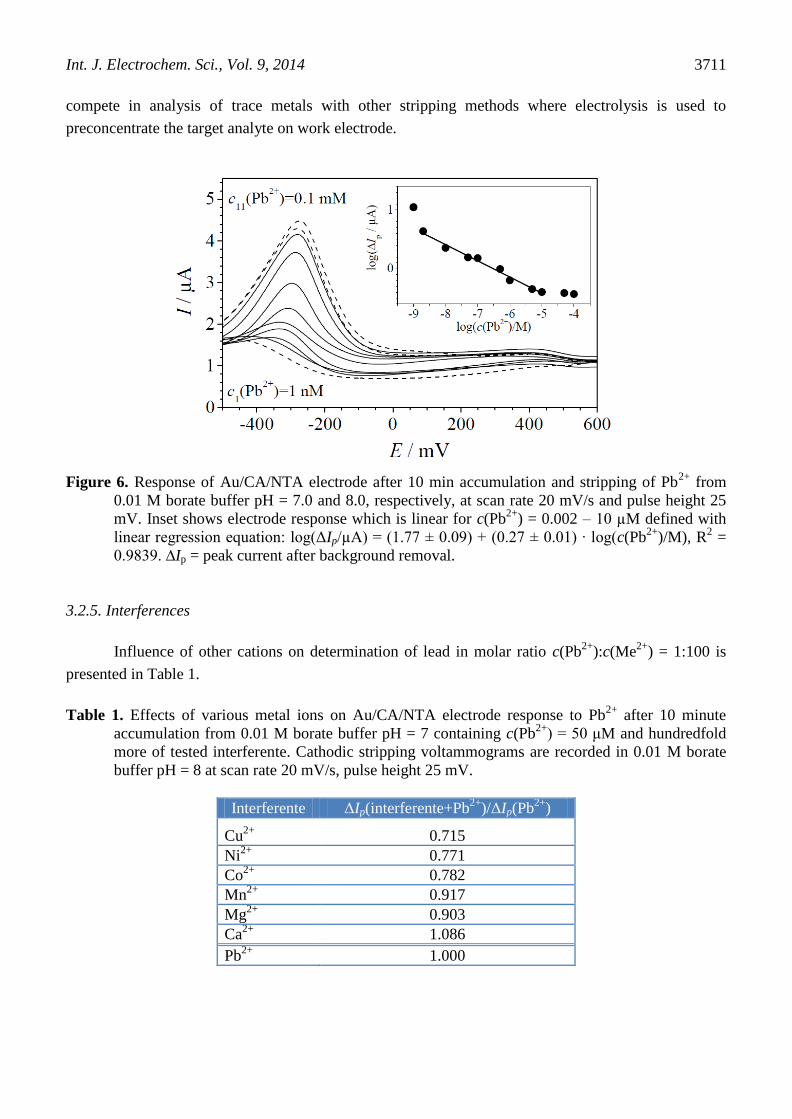
Figure 6. Response of Au/CA/NTA electrode after 10 min accumulation and stripping of Pb
2+ from
0.01 M borate buffer pH = 7.0 and 8.0, respectively, at scan rate 20 mV/s and pulse height 25
mV. Inset shows electrode response which is linear for c(Pb2+
) = 0.002 – 10 µM defined with
linear regression equation: log(ΔIp/µA) = (1.77 ± 0.09) + (0.27 ± 0.01) ∙ log(c(Pb2+
)/M), R2 =
0.9839. ∆Ip = peak current after background removal.
3.2.5. Interferences
Influence of other cations on determination of lead in molar ratio c(Pb2+
):c(Me2+
) = 1:100 is
presented in Table 1.
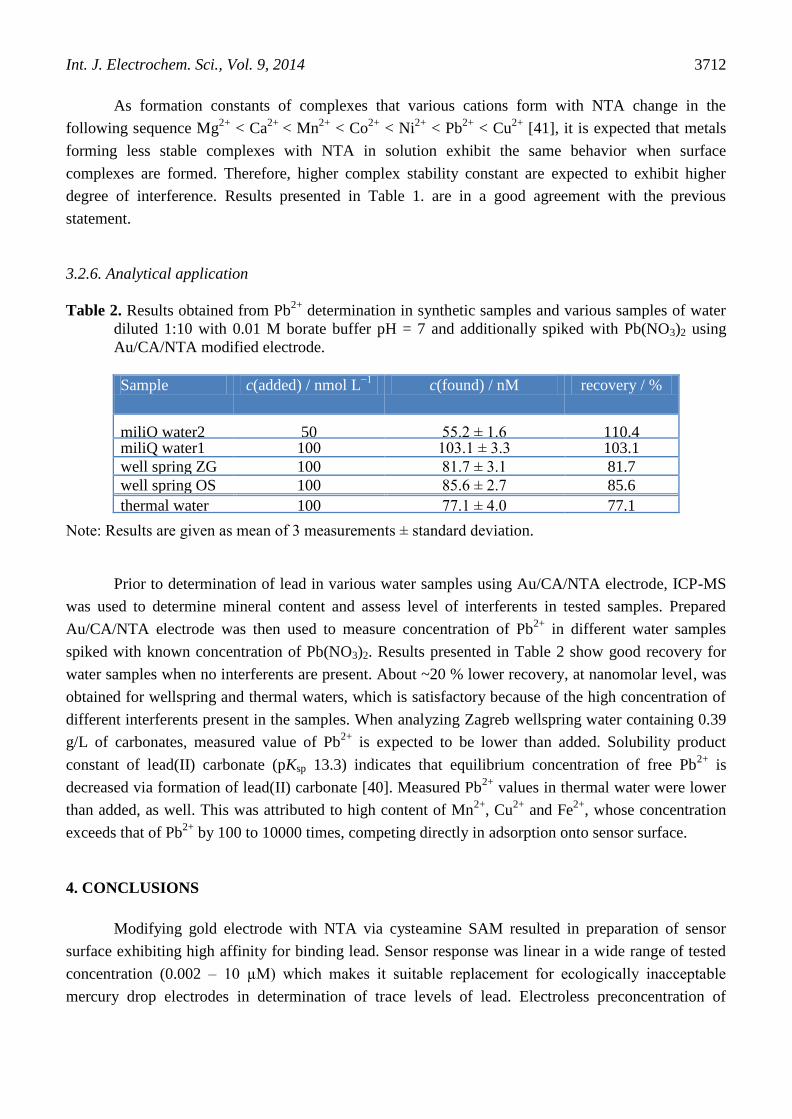
Table 1. Effects of various metal ions on Au/CA/NTA electrode response to Pb2+
after 10 minute
accumulation from 0.01 M borate buffer pH = 7 containing c(Pb2+
) = 50 μM and hundredfold
more of tested interferente. Cathodic stripping voltammograms are recorded in 0.01 M borate
buffer pH = 8 at scan rate 20 mV/s, pulse height 25 mV.
Interferente ΔIp(interferente+Pb2+
)/ΔIp(Pb2+
)
Cu2+
0.715
Ni2+
0.771
Co2+
0.782
Mn2+
0.917
Mg2+
0.903
Ca2+
1.086
Pb2+
1.000
Int. J. Electrochem. Sci., Vol. 9, 2014
3712
As formation constants of complexes that various cations form with NTA change in the
following sequence Mg2+
< Ca2+
< Mn2+
< Co2+
< Ni2+
< Pb2+
< Cu2+
[41], it is expected that metals
forming less stable complexes with NTA in solution exhibit the same behavior when surface
complexes are formed. Therefore, higher complex stability constant are expected to exhibit higher
degree of interference. Results presented in Table 1. are in a good agreement with the previous
statement.
3.2.6. Analytical application
Table 2. Results obtained from Pb2+
determination in synthetic samples and various samples of water
diluted 1:10 with 0.01 M borate buffer pH = 7 and additionally spiked with Pb(NO3)2 using
Au/CA/NTA modified electrode.
Sample c(added) / nmol L−1
c(found) / nM recovery / %
miliQ water2 50 55.2 ± 1.6 110.4 miliQ water1 100 103.1 ± 3.3 103.1
well spring ZG 100 81.7 ± 3.1 81.7
well spring OS 100 85.6 ± 2.7 85.6
thermal water 100 77.1 ± 4.0 77.1
Note: Results are given as mean of 3 measurements ± standard deviation.
Prior to determination of lead in various water samples using Au/CA/NTA electrode, ICP-MS
was used to determine mineral content and assess level of interferents in tested samples. Prepared
Au/CA/NTA electrode was then used to measure concentration of Pb2+
in different water samples
spiked with known concentration of Pb(NO3)2. Results presented in Table 2 show good recovery for
water samples when no interferents are present. About ~20 % lower recovery, at nanomolar level, was
obtained for wellspring and thermal waters, which is satisfactory because of the high concentration of
different interferents present in the samples. When analyzing Zagreb wellspring water containing 0.39
g/L of carbonates, measured value of Pb2+
is expected to be lower than added. Solubility product
constant of lead(II) carbonate (pKsp 13.3) indicates that equilibrium concentration of free Pb2+
is
decreased via formation of lead(II) carbonate [40]. Measured Pb2+
values in thermal water were lower
than added, as well. This was attributed to high content of Mn2+
, Cu2+
and Fe2+
, whose concentration
exceeds that of Pb2+
by 100 to 10000 times, competing directly in adsorption onto sensor surface.
4. CONCLUSIONS
Modifying gold electrode with NTA via cysteamine SAM resulted in preparation of sensor
surface exhibiting high affinity for binding lead. Sensor response was linear in a wide range of tested
concentration (0.002 – 10 µM) which makes it suitable replacement for ecologically inacceptable
mercury drop electrodes in determination of trace levels of lead. Electroless preconcentration of

Int. J. Electrochem. Sci., Vol. 9, 2014
3713
lead(II) from borate buffer pH = 7.0 resulted in much higher voltammetric response compared to
preconcentration from acidic solutions. Borate buffer enabled analysis of Pb2+
to be performed at pH >
7 due to formation of stabile but soluble lead-borate complex, thus preventing the precipitation of
Pb(OH)2. Nanomolar concentrations of lead were determined with acceptable recovery in various
water samples in spite of high levels of interferents (lead complexing species and metal cations)
present.
AKNOWLEDGEMENTS
We are grateful to the Croatian Ministry of Science, Education and Sports for the financial support of
projects 058-0580000-3071 and 125-0000000-3210.
References
1. E.J. O'Flaherty, Crit. Rev. Toxicol., 28 (1998) 271
2. G. Zheng, L. Tian, Y. Liang, K. Broberg, L. Lei, W. Guo, J. Nilsson, I.A. Bergdahl, S. Skerfving,
T. Jin, Neurotoxicology, 32 (2011) 374
3. P. Reckziegel, V.T. Dias, D. Benvegnú, N. Boufleur, R.C. Silva Barcelos, H.J. Segat, C.S. Pase,
C.M.M. dos Santos, T.M.M. Flores, M.E. Bürger, Toxicol. Lett., 203 (2011) 74
4. E.P. Popek, Sampling and analysis of environmental chemical pollutants: a complete guide,
Academic Press, San Diego, (2003)
5. P. Apostoli, J. Chromatogr. B, 778 (2002) 63.
6. K.C. Honeychurch, J.P. Hart, D.C. Cowell, D.W.M. Arrigan, Sensor. Actuat. B-Chem., 77 (2001)
642
7. V. Beni, H.V. Newton, D.M.W. Arrigan, Anal. Chim. Acta, 502 (2004) 195
8. R. Kadara, I.E. Tothill, Talanta, 66 (2005) 1089
9. R.K. Shervedani, A. Farahbakhsh, M. Bagherzadeh, Anal. Chim. Acta, 587 (2007) 254
10. R.G. Nuzzo, D.L. Allara, J. Am. Chem. Soc., 105 (1983) 4481
11. H.O. Finklea, Self-assembled monolayers on electrodes. Encyclopedia of Analytical Chemistry,
Applications, Theory and Instrumentation, Vol. 11, Wiley, Chichester (2000)
12. A. Ulman, Chem. Rev., 96 (1996) 1533
13. E.J. Calvo, R. Etchenique, L. Pietrasanta, A. Wolosiuk, C. Danilowicz, Anal. Chem., 73 (2001)
1161
14. V. Anandan, R. Gangadharan, G.G. Zhang, Sensors, 9 (2009) 1295
15. Q. Wang, D. Dong, N.Q. Li, Bioelectrochemistry, 54 (2001) 169
16. S.J. Ding, B.W. Chang, C.C. Wu, C.J. Chen, H.C. Chang, Electrochem. Commun., 9 (2007) 1206
17. K. Wadu-Mesthrige, N.A. Amro, G.Y. Liu, Scanning, 22 (2000) 380
18. S. Ignatov, D. Shishniashvili, B. Ge, F.W. Scheller, F. Lisdat, Biosens. Bioelectron., 191 (2002) 17
19. T. Nakaminami, S. Ito, S. Kuwabata, H. Yoneyama, Anal. Chem., 71 (1999) 1068
20. M.S. Alaejos, F.J.G. Montelongo, Chem. Rev., 104 (2004) 3239
21. E. Katz, I. Willner, J. Electroanal. Chem., 418 (1996) 67
22. F. Caruso, E. Rodda, D.F. Furlong, K. Niikura, Y. Okahata, Anal. Chem.,69 (1997) 2043
23. F. Mirkhalaf, D.J. Schiffrin, J. Chem. Soc.-Faraday Trans.,94 (1998) 1321
24. C. Fang, X.Y. Zhou, Electroanal., 15 (2003) 1632
25. R.K. Shervedani, S.A. Mozaffari, Surf. Coat. Technol., 198 (2005) 123
26. R.K. Shervedani, M. Bagherzadeh, Electrochim. Acta, 53 (2008) 6293
27. S. Zhang, C.M. Cardona, L. Echegoyen, Chem. Commun., 43 (2006) 4461
28. D. Burshtain, D. Mandler, Phys. Chem. Chem. Phys., 8 (2006) 158

Int. J. Electrochem. Sci., Vol. 9, 2014
3714
29. M. Aihara, F. Tanaka, Y. Miyazaki, K. Takehara, Anal. Lett., 35 (2002) 759
30. G.B. Sigal, C. Bamdad, A. Barberis, J. Strominger, G.M. Whitesides, Anal. Chem., 68 (1996) 490
31. U. Oesch, J. Janata, Electrochim. Acta, 28 (1983) 1237
32. E. Sabatani, I. Rubinstein, R. Maoz, J. Sagiv, J. Electroanal. Chem., 219 (1987) 365
33. C. Saby, B. Ortiz, G.Y. Champagne, D. Bélanger, Langmuir, 13 (1997) 6805
34. J.R. Macdonald, W.B. Johnson, Fundamentals of impedance spectroscopy, 2nd ed. Vol. 2, John
Wiley & Sons Inc., New Jersey (2005)
35. J.D. Burke, J.M. Moran, P.F. Nugent, J. Sold State Electrochem., 7 (2003) 529
36. E. Katz, I. Willner, Electroanal., 15 (2003) 913
37. C.M.A. Brett, S. Kresak, T. Hianik, A.M. Oliviera-Brett, Electroanal., 15 (2003) 557
38. K. J. Powell, P. L. Brown, R. H. Byrne, T. Gajda, G. Hefter, A.-K. Leuz, S. Sjöberg, H. Wanner,
Pure Appl. Chem., 81 (2009) 2425
39. T. Stora, R. Hovius, Z. Dienes, M. Pachoud, H. Vogel, Langmuir, 13 (1997) 5211
40. N. A. Lange, Lange’s handbook of chemistry, 15th ed., McGraw-Hill Inc., New York (1999)
41. S. Kotrlý, L. Šůcha, Handbook of chemical equilibria in analytical chemistry, John Wiley and
sons, New York (1985)
© 2014 The Authors. Published by ESG (www.electrochemsci.org). This article is an open access
article distributed under the terms and conditions of the Creative Commons Attribution license
(http://creativecommons.org/licenses/by/4.0/).