application of on line measurements and …844699/fulltext01.pdf · bakterierna behöver en viss...
TRANSCRIPT

TRITA-LWR Degree Project 13:41
ISSN 1651-064X
LWR-EX-13-41
APPLICATION OF ON-LINE
MEASUREMENTS AND ACTIVITY TESTS
FOR THE CONTROLLING AND
MONITORING OF
THE NITRITATION/ANAMMOX PROCESS
Kamil Małoszewski
September 2013

Kamil Maloszewski TRITA LWR Degree Project 13:41
ii
© Kamil Maloszewski 2013
Degree Project Masters Level
Department of Land and Water Resources Engineering
Royal Institute of Technology (KTH)
SE-100 44 STOCKHOLM, Sweden
Reference should be written as: Maloszewski, K (2013) “Application of on-line measure-ments and activity tests for the controlling and monitoring of the Nitritation/Anammox process” TRITA-LWR Degree Project 13:41 25 p.
Application of on-line measurements and activity tests for the Nitritation/Anammox process
iii
SUMMARY IN ENGLISH
Rigorous requirements for quality of discharged wastewater and the desire to save energy and operation costs caused constant development of wastewater treatment technologies. One of these technologies is the Anammox process which is constantly studied and developed. It has many advantages compared with conventional methods of treatment, such as for example the use a much smaller amount of oxygen and no need the use an additional source of carbon. It also has disadvantages as slow growth of biomass of bacteria and high optimal temperature. Average influent wastewater temperature is much lower. Therefore, the process is researched at low temperatures.
In this thesis, Nitritation/Anammox process was carried out in MBBR reactor at low temperature of 13°C. Additionally, in order to check the reaction of bacteria to a small food source, the concentration of ammonia in inflow was gradually reduced. The process were tested in four stages of concentrations: 500, 250, 175 and 125 mg NH4-N/l. In order to assess the activity of the bacteria, numerous tests were performed, such as Specific Anammox Activity (SAA) and Oxygen Uptake Rate (OUR). The process was continuously monitored by measuring of physical parameters. It was done to give an answer, whether on-line measurements are helpful in controlling and monitoring of the process. Efficiency of NH4-N removal obtained under the selected conditions achieved maximum 75.3%. Decreasing the concentration of ammonia in the inflow resulted in a decrease in the activity of bacteria. However, after some time it returned back to satisfactory values. This proves that the bacteria need time to adapt to new conditions.
Achieved results may give some answers about the process. However, further research should be performed. In the future it may allow use of the process in main wastewater treatment in full-scale.

Kamil Maloszewski TRITA LWR Degree Project 13:41
iv

Application of on-line measurements and activity tests for the Nitritation/Anammox process
v
SUMMARY IN SWEDISH
Rigorösa krav på kvaliteten av utsläppt avloppsvatten och viljan att spara energi och driftkostnader har orsakat kontinuerlig utveckling av avloppsreningsmetoder. En av dessa metoder är Anammoxprocessen som hela tiden studeras och utvecklas. Den har många fördelar jämfört med konventionella reningsmetoder, som att den till exempel använder mycket mindre syre och att det ej behöver tillsättas extra kol. Den har även nackdelar som svag tillväxt av bakteriers biomassa och hög optimal temperatur. Den genomsnittliga avloppsvattentemperaturen är mycket lägre. Därför görs det forskning om processen vid låga temperaturer.
I denna avhandling var Nitritation/Anammoxprocessen utförd i en MBBR-reaktor vid en låg temperatur på 13°C. Fortsättningsvis har mängden tillsatt ammoniak gradvis minskats för att kontrollera bakteriernas reaktion på en liten mängd föda. Processen var testad med 4 koncentrationessteg: 500, 250, 175 and 125 mg NH4-N/l. För att bedöma bakteriernas aktivitet har flera test, såsom SAA och OUR, utförts. Processen var kontinuerligt övervakad genom mätning av fysikaliska parametrar. Detta gjordes för att ge svar på om onlinemätningar kan vara hjälpsamma för att kontrollera processen. Den uppnådda effektiviteten av NH4-N-avskiljning under dessa förhållanden uppnådde 75.3%. Minskning av ammoniakkoncentrationen i inflödet resulterade i minskad bakterieeffektivitet. Dock så återkom aktiviteten hos bakterierna till det normala efter en viss tid, vilket visar på att bakterierna behöver en viss tid för att anpassa sig till de nya förhållandena. Resultaten kan ge vissa svar om processen. Dock så måste mer forskning på området utföras. Detta kan bidra till att processen i framtiden med fördel kan användas fullskaligt för avloppsvattenrening.

Kamil Maloszewski TRITA LWR Degree Project 13:41
vi

Application of on-line measurements and activity tests for the Nitritation/Anammox process
vii
ACKNOWLEDGEMENT
First of all I would like to thank Professor Elżbieta Płaza, who allowed me to realize this thesis. I hope, that results obtained throughout my work in Sweden, will be a valuable resource for further research on the Anammox project. I would like to thank you for all advices and invaluable help in various matters, which I received from you.
I am also grateful to PhD Józef Trela for ongoing support, motivation to keep working in moments of weakness, and for sharing his great knowledge.
Thanks also for PhD student Razia Sultana for introduction to secrets of research worker job. Thank you for your patience and contribution in my development. Acknowledgements also goes to PhD student Jingjing Yang for all the help and advices. Everything I have learned, I owe you Razia and Jingjing. Your knowledge is impressive.
Additional thanks to Swedish Environmental Research Institute (IVL) workers. Your advices was valuable, and the atmosphere, that you create in Hammarby Sjöstadsverket is really friendly. Work with you was pleasure.
Finally, I would like to thank my parents and brother for all their support, which I have received from them during my stay abroad. Without your help, my trip and lots of experiences which I got in Sweden would have been impossible. Thanks for believing in me!
Krakow, September 2013

Kamil Maloszewski TRITA LWR Degree Project 13:41
viii

Application of on-line measurements and activity tests for the Nitritation/Anammox process
ix
ABBREVIATIONS AND SYMBOLS
Anammox Anaerobic ammonium oxidation
AOB Ammonium Oxidizing Bacteria
ATU Allythiourea
COD Chemical Oxygen Demand
DO Dissolved oxygen
MBBR Moving Bed Biofilm Reactor
NOB Nitrate Oxidizing Bacteria
NUR Nitrate Uptake Rate
OUR Oxygen Uptake Rate
SAA Specific Anammox Activity
WWTP Wastewater Treatment Plant

Kamil Maloszewski TRITA LWR Degree Project 13:41
x

Application of on-line measurements and activity tests for the Nitritation/Anammox process
xi
TABLE OF CONTENT
Summary in English iii
Summary in Swedish v
Acknowledgement vii
Abbreviations and symbols ix
Table of Content xi
Abstract 1
1. Introduction 1
1.1. Nitrogen cycle processes 1
1.2. Nitrogen effect on environment 2
1.3. Requirements for nitrogen removal from wastewater 2
2. Technologies for nitrogen removal at WWTP 3
2.1. Treatment in main stream 4
2.2. Treatment of supernatant from digested sludge 4
3. Anammox process 6
3.1. Anammox process description 6
3.1.1. Beginnings of Anammox process 7
3.1.2. Experiments carried out on Anammox process at low temperatures and low nitrogen concentration 7
3.2. Comparison between Nitritation/Anammox and
Nitrification/Denitrification processes 8
3.3. Nitrogen removal systems with applications of Anammox 8
4. Aim of study 9
5. Methodology 10
5.1. Hammarby Sjöstadsverket 10
5.2. Description of pilot plant reactor 10
5.3. Batch tests 11
5.3.1. Specific Anammox Activity (SAA) 11
5.3.2. Oxygen Uptake Rate (OUR) 11
5.3.3. Nitrate Uptake Rate (NUR) 12
5.4. Chemical analysis 12
5.5. Physical parameters 12
6. Results and discussion 13
6.1. Microbial activity of different groups of bacteria 13
6.1.1. Anammox – (SAA) 13
6.1.2. Ammonia and nitrite oxidizing bacteria – (OUR) 14
6.2. Evaluation of nitrogen removal efficiency at low temperature and low
ammonium concentration – chemical analysis results 15
6.3. Analysis of physical parameters – evaluation of pilot plant operation 16
6.3.1. On-line measurements for controlling and monitoring of the Nitritation/Anammox process 17
6.3.2. Relationships between measuring parameters 19
6.3.3. Comparison between results for on-line and portable devices 20
6.4. Evaluation of Nitritation/Anammox at low nitrogen concentration 20
6.5. Uncertainty during experimental work 22
7. Conclusions 22
References 23
Appendix I – Activity tests results I
Appendix II – Chemical analysis results XVI

Kamil Maloszewski TRITA LWR Degree Project 13:41
xii

Application of on-line measurements and activity tests for the Nitritation/Anammox process
1
ABSTRACT
Anammox process is continuously tested in order to obtain knowledge about its application in the main stream of sewage. The aim of this study is to improve the controlling and monitoring of the Nitritation/Anammox process by applying on-line measurement of physical parameters and activity tests of different groups of bacteria. Additionally, the concentration of ammonia in inflow was reduced to test the reaction of bacteria to a sudden change in the conditions which may occur in wastewater treatment plants. After five months of tests, favourable results were obtained. Achieved removal of NH4-N was good. On-line measurements proved to be an effective tool to monitor the process. This may show the way for further research and ultimately leading to an effective implementation of the process for the treatment of the main stream of wastewater.
Key words: Anammox, Nitritation, Activity tests, On-line measurements, Moving Bed Biofilm Reactor, Low ammonium concentration, Low temperatures
1. INTRODUCTION
Growth of knowledge about the effect of discharged wastewater on surface water is causing development of new technologies for the removal of organic compounds from wastewater. It makes possible modernization of conventional wastewater treatment plants. The development of technologies is forced also by more and more rigorous requirements about quality of discharged sewage. Implementation of the requirements has increased interest in intensification of processes of biogenic compounds removal (Trela, 2000).
Therefore, nowadays in all over the world, tests of new technologies are carried out. They have the target to give an answer whether new solutions will can used to main wastewater stream. This can decrease energy consumption and consequently save financial resources. It is additionally motivating for continuation of planned activities.
In view of low operational costs and high efficiency, Deammonification process is increasingly used.
In this thesis, the Deammonification process in conditions of low temperature and gradually decreasing concentration of ammonium in the MBBR reactor inflow has been studied.
1.1. Nitrogen cycle processes The nitrogen cycle is one of the most complex of the mineral cycles. It is important element for sustain life on the Earth. Nitrogen is basic nutrient for microorganisms and plants in the environment. In the greatest part in the atmosphere is present in the form of N2, but also as ammonium (NH4+), nitrate (NO3-), nitrite (NO2-), nitric oxide (NO) or organic matter (Holton et al, 2007).
In its cycle, nitrogen is transform by different processes. Nitrification is the first step in nitrogen cycle. Through this process Ammonium is converted to nitrates. On the beginning NH4+ is being oxidized by Nitrosomonas bacteria. Nitrite is the product of this conversion. Subsequently bacteria from Nitrobacter species carry out the oxidation of nitrites to nitrates. In the second step, i.e. Denitrification, nitrates are reduced by Pseudomonas and Clostridium bacteria back to nitrogen gas (N2). Process is performed in anaerobic conditions. Nitrates are used by the bacteria as electron acceptor instead of oxygen for respiration (Smil, 1996).

Kamil Maloszewski TRITA LWR Degree Project 13:41
2
An important role in the nitrogen cycle has been fulfilled by Anammox bacteria. They oxidize ammonium in anoxic condition directly to nitrogen gas by using nitrite as electron acceptor (Bernhard, 2012).
Research in this thesis are based on the Anammox process, which is described in further part of thesis.
1.2. Nitrogen effect on environment Almost all the nitrogen in ecosystems on Earth comes from the atmosphere. Much of its amount gets into the soil during lightning storms or precipitation. Human activity has an significant impact on nitrogen cycle. Approximately 45% of the total amount of nitrogen produced on Earth comes from anthropogenic sources. It takes place from industrial processes, fossil fuels combustion and agriculture. More than 90% of used fertilizers contains NH4+. Nitrifying bacteria convert it to NO3-, which infiltrates into water bodies and aquifers. It leads to eutrophication of coastal waters, causing hypoxia of water zones. This is harmful to aquatic organisms (causing even death) and water quality. The increased amount of nitrogen causes water acidification. Ammonia (NH3) is toxic to fish and its discharge from wastewater treatment plant must be monitored. Likewise, waste from livestock releases large amount of ammonium to the environment. Agricultural systems represent around a quarter of global N2O emission, which goes into the atmosphere, destroys ozone in the troposphere and causes the greenhouse effect. Nitric acid is a major component of acid rain, which causes great loss in the environment (Canfield et al, 2010; Vitousek et al, 1997).
An excessive quantity of nitrogen compounds in drinking water can have harmful effect on human health. It can cause the development of methemoglobinemia, causing so-called blue baby syndrome. This is demonstrated by the bluish skin colour, especially around the eyes and mouth. The greatest risk occurs in infants under one year old and the young and pregnant animals. In neonates may cause hypoxia or internal suffocation (Killpack and Buchholz, 1993).
The main problem today is how to avoid emitting excessive amounts of nitrogen compounds into the environment and thereby reduce its effects. For this purpose, industry is improved, various solutions are searched for, and various types of experimental studies are carried out. These actions may change for the better environment condition in future.
1.3. Requirements for nitrogen removal from wastewater In various countries in Europe, norms for concentration of basic biogenic compounds are determined according to the type of receiver, size of wastewater treatment plant and sometimes temperature.
Denmark and Sweden have the most demanding requirements for nutrients removal, what is due to the protection of inland and coastal water of the Baltic Sea (Trela, 2000).
Countries belonging to the European Union are obliged to comply with the norms included in the legislation laid down by the EU. Directive which is currently in force, is Urban Water Directive (91/271/ECC). It was adopted on 21 May 1991. Requirements included in this Directive:
• all built-up areas must have their own wastewater collection systems by the end of 1998, 2000 or 2005 year;
• water entered into collection systems must undergo at least secondary treatment;

Application of on-line measurements and activity tests for the Nitritation/Anammox process
3
• treated wastewater must meet the required minimum quality;
• discharging of sewage into sensitive areas to nutrients is the objective of stringent requirements for effective treatment.
The European Union demands to abide by allowed amount of nitrogen in wastewater discharge (Table 1).
Sweden joined the EU in 1995 and pledged to implement legislation into its legislature. In 2000 it was decided to adopt the Water Framework Directive and the gradual replacement of other already existing directives. The EU directive was finally adopted in 2008. In the Swedish regulations are now, for example, rules of sampling and samples control. Nitrogen controls are carried out only for wastewater discharge that reach the marine and coastal waters between the Norwegian border to the west and Norrtälje to the east (Naturvardsverket, 2009).
Poland is also obliged to comply with the EU directives because belongs to the European Union since 2004. Decree of Environmental Ministry (Dz. U. 2009 nr 27 poz. 169), legislation about water protection is currently in force in Poland (Table 2).
2. TECHNOLOGIES FOR NITROGEN REMOVAL AT WWTP
There are many ways of removing nitrogen from wastewater. These methods can be divided into three types: physical, chemical and biological.
Biological methods are the most commonly used and the most perspec-
Table 1 Requirements of European Union directive for discharges from urban wastewater treatment plants to sensitive areas (Directive 91/271/EEC).
Parameters Concentration Minimum percentage of
reduction(1)
Total nitrogen(2)
15 mg/l N
(10 000 – 100 000 p.e.)
10 mg/l N
(more than 100 000 p.e.)(3)
70 - 80
(1) Reduction in relation to the load of the influent
(2) Total nitrogen means: the sum of total Kjeldahl-nitrogen (organic N + NH3), nitrate (NO3)-nitrogen
and nitrite (NO2)-nitrogen.
(3) Alternatively, the daily average must not exceed 20 mgN/l. This requirement refers to a water
temperature of 12°C or more during the operation of the biological reactor of the waste water treatment plant/ As a substitute for the condition concerning the temperature, it is possible to apply a limited time of operation, which takes into account the regional climatic conditions. This alternative applies if it can be shown that paragraph 1 of Annex I.D is fulfilled.
Table 2 Requirements of Polish directive for discharges from urban wastewater treatment plants to waters and ground (Dz. U. Z 2009 nr 27 poz. 169).
Parameters Unit
The highest acceptable amounts of indicators or minimal percents of pollution reduction in accordance with population equivalent
< 2 000 2 000 -
9 999
10 000 -
14 999
15 000 -
99 999 > 100 000
Total
nitrogen(1)
mg N/l
min. reduction %
30(2) 15(
2) 15(
2)
35
15
or
80
10
or
85
(1)Total nitrogen means the sum of Kjeldahl-nitrogen (organic N+NH3), nitrate (NO3) and nitrite (NO2)-
nitrogen
(2)Required values solely in wastewater discharged to lakes and its outflows and directly to artificial
lakes located on flowing water

Kamil Maloszewski TRITA LWR Degree Project 13:41
4
tive. They are used worldwide. The choice of type of nitrogen removal must be precisely analyzed in all aspects, such as for example energy requirements and chemical costs, impact on the environment, reliability.
However the most important aspect nowadays is cost-efficiency.
The concentration of nitrogen in sewage is one of the factors which determines the choice of its elimination means (Van Hulle et al, 2010).
2.1. Treatment in main stream There are several ways to remove nitrogen from wastewater. They are based mainly on biological processes - Nitrification/Denitrification, which have a place in biological reactor with activated sludge (Van Hulle et al, 2010). Nitrification/Denitrification process consists of two stages. In first - Nitrification, ammonia is oxidized to nitrite and nitrate. Process is carried out by autotrophic nitrifying bacteria. Nitrification consists of two stages i.e. oxidizing of ammonia to nitrites (Nitrosomonas bacteria take a part) and converting nitrites to nitrates (by means of Nitrobacter).
Next process - Denitrification is a process in which nitrates are reduced to nitrites and then from the nitrites to nitrogen gas. Heterotrophic denitrifying bacteria carry out process. For denitrification additional carbon source (e.g. methanol) is required (Cema, 2009).
Treatment of the main stream can be performed by a chemical method. Ammonia stripping is another means of nitrogen compounds removal from wastewater. It is based on the removal of ammonia by transformation into gaseous form by means of air or steam and then removing it in the form of solute substance in the sewage. This method is used most often in industrial wastewater treatment and landfill leachate (Cema, 2009). Next idea might be ion exchange. It is carried out by using of materials with high affinity for ammonium ions. These may be, for example, zeolites. In this process ions on a solid surface are exchanged for ammonium ions in the wastewater. This kind of nitrogen removal is usually used for low-flow (Malovanyy et al, 2013).
The Deammonification becomes one of the most popular processes for nitrogen removal. This is due to its many advantages, such as for example no need to use an additional source of carbon or a much smaller sludge production in comparison with conventional methods. This process can be carried out in a single-stage or two-stage reactors (Cao et al, 2013). Application of Deammonification to main wastewater stream is challenging on account of adverse conditions prevailing in inflow, mostly low temperature and low concentration of ammonium (Stinson et al, 2013). Nevertheless, nowadays there is more and more cases of use the process of Anammox bacteria into the mainstream.
2.2. Treatment of supernatant from digested sludge Wastewater with high concentration of nitrogen (reject water, leachate from landfills, livestock, etc.) undergo pre-treatment before discharging to the appropriate treatment at the wastewater treatment plant.
Ammonia removal from landfill leachate is possible by ex-situ nitrification and with using the landfill as anaerobic reactor for denitrification. This method is not recommended due to the presence of organic inhibitors and accumulation of hazardous compounds in the sewage. This leads to increased concentration of effluent and reduces the effectiveness of the treatment. Biological processes are not effective in view of toxic nature of the leachates. For this reason, physicochemical treatment is required. It is used as a pre-treatment or to remove specific

Application of on-line measurements and activity tests for the Nitritation/Anammox process
5
contaminants (Cema, 2009). For the removal of ammonia most commonly used process in the leachate is stripping (allows to remove up to 93%). It has some drawbacks as the release of NH3 in the air when ammonia cannot be properly absorbed by H2SO4 or HCl. Another problem is calcium carbonate scaling of the stripping tower during the pH regulation, and foaming, which results in the need of use high towers. This process can be used more effectively by the use of steam instead the air (Cema, 2009, Henze et al, 2008).
Another pre-treatment process is struvite precipitation. It is very expensive process because of chemicals. To remove ammonia is needed additional source of magnesium phosphate. It can be reduced by removing ammonium from MAP (magnesium ammonium phosphate) sludge by heat treatment. Volatized ammonia can be recovered and used again the same as magnesium phosphate (Henze et al, 2008). The efficiency of nitrogen removal by this process may exceed 98% (Cema, 2009).
Another way to remove the ammonium is ion exchange. This is a competitive method, since low temperature does not affect it (Cema, 2009). Materials that are most commonly used for ion exchange process include for example natural and synthetic zeolites, acid resin. Studies of the ion exchange process have demonstrated that strong acid cation resin has the best results for ammonium exchange (Malovanyy et al, 2011).
The most effective and cheapest way to eliminate nitrogen from leachate is biological nitrification/denitrification. However, toxic and organic substances can inhibit this process.
Not only landfill leachates are problematic. Reject water in wastewater plant can also increase the amount of nitrogen in the influent. This is created in sludge dewatering processes and contain relatively high concentration of ammonium nitrogen. This contains about 15 - 25% of all loads of nitrogen in the influent. Separate treatment allows to reduce nitrogen in wastewater plant influent.
One of the ways is ammonium precipitation in the form of magnesium ammonium phosphate MgNH4PO4 by adding phosphoric acid and magnesium oxide. This is costly process because of the chemicals and waste disposal costs are higher due to the increase of dry solids even by 50%. The process is also difficult to control (Cema, 2009).
Ammonia air or steam stripping is used to eliminate the high amount of NH4-N. Ammonium is converted to ammonia, which is easily soluble in water. It is done by increasing pH value. After contact with gaseous phase, ammonia is transformed from aqueous phase to gaseous (Janus, van der Roest, 1997). This method allows to remove up to 97% of NH3 from the supernatant. If pH and temperature is stable, process is easily controlled, which is the greatest advantage. However, a disadvantage is the release of NH3 into the air (Cema, 2009).
Biological methods are considered as the most effective to reject water treatment. However, they are difficult to use. Alkalinity of the water from digested sludge is not enough to achieve full nitrification process and additional of its source is needed. Likewise, for denitrification process additional source of carbon should be provided.
One of the ways of biological treatment is SHARON process, Single reactor system for High Activity Ammonia Removal Over Nitrite. Nitrification and denitrification take place in a single reactor with intermittent aeration. The process is simple to lead. Is carried out in high
Kamil Maloszewski TRITA LWR Degree Project 13:41
6
temperature (30 - 40°C). In SHARON ammonium is nitrified/denitrified over nitrite as an intermediate, without sludge retention. This is the first process in which this was achieved in a stable process condition. Growth and washout of sludge are in equilibrium (Mulder et al, 2001). Comparing with the removal over nitrate, SHARON uses 25% less of oxygen, 40% less of carbon source, produces 30% less sludge and emits 20% less of CO2. It can reduce the load of ammonium in the effluent from the wastewater treatment plant by 50%, resulting in up to 100% total nitrogen removal efficiency. This result was achieved in a wastewater treatment plant in Utrecht (van Kempen et al, 2005). The process is efficient and cost-effective as a pre-treatment.
The BABE process (Bio Augmentation Batch Enhanced) is subsequent way for reject water treatment. In the return sludge line, nitrifying reactor named BABE is used. Ammonium nitrification to nitrate and nitrite occurs in the reactor. It is achieved by the addition of external carbon source or through the use of carbon from active sludge. The use of internal sources of carbon allows for significant savings. Part of the active sludge from the secondary clarification is used as a feed for nitrifying bacteria growing in the BABE reactor. The high nitrogen load and increased temperature causes an increase in nitrification activity of active sludge, which is returned to the main process with a high load of nitrifying bacteria. Nitrifying bacteria reduce nitrogen load in the main treatment process. The process is flexible. It allows for adjustment the course of process depending on the wastewater conditions (Berends et al, 2005). The BABE is a system without retention, which allows its simple construction and low cost. SRT in the reactor is relatively short. Maintaining a short retention time can allow the growth of the return sludge organisms. In this way the bacteria are provided with conditions for growth, such as in the full treatment. The best effect is obtained when the wastewater treatment plant is working at about 50% of critical SRT for nitrification. In this process, nitrification can be achieved even in winter conditions. However the higher temperature in reactor, the more ammonia is oxidized. The BABE process reduces the load of total nitrogen in wastewater treatment plant and complements the existing populations of nitrifying bacteria (Salem et al, 2003).
A new alternative for sludge liquor treatment is based on Anammox. The combined SHARON and Anammox processes are a promising solution because SHARON can lead without denitrification which is particularly important in connection with Anammox. According to research, the implementation of these two processes can greatly improve wastewater quality in effluent (Cema, 2009).
3. ANAMMOX PROCESS
Nowadays there are many different technologies and processes used for wastewater treatment. Moreover, many new processes are in study phase or gradually introduced into apply in full-scale. One of the processes is Anammox, which is still studied in order to find the most effective method of its application.
3.1. Anammox process description In Anammox process ammonia is oxidized to the dinitrogen without the presence of oxygen. Nitrites are used as electrons acceptor, but also oxidized to nitrates. The end product of nitrates reduction in the Anammox process is dinitrogen gas (Fig. 1). Anammox bacteria are autotrophic. It means that they do not need additional organic matter. Anammox bacteria are present in a variety of environments such as

Application of on-line measurements and activity tests for the Nitritation/Anammox process
7
oceans, rivers, for example The Black Sea and Thames estuary. They contribute to nitrogen cycle. Depending on the organic load up to 70% of N2 in an aqueous environment is produced by Anammox (Van Hulle et al, 2010). In general nitrogen cycle almost 30 - 50% of gaseous nitrogen is produced by Anammox (Cema, 2009). Anammox biomass has a brown-reddish colour, what is caused by content of large amount of cytochrome. Stoichiometric equation of Anammox process has the form:
15.05.02232
324
066.003.226.002.1
13.0066.032.1
NOCHOHNON
HHCONONH
+++→
→+++
−
+−+
The process is characterized by a low growth of biomass. It should be conducted with suitable temperature, pH and oxygen. Precise control of reactor and inhibitors limitation is required during the process. Anammox removes approximately 90% of nitrogen in the form of ammonia/nitrite and leaves 10% of nitrogen as nitrate in the effluent (Van Hulle et al, 2010).
3.1.1. Beginnings of Anammox process
In 1977, Engelberd Broda applied thermodynamic calculations to estimate the existence of chemolitoautotrophic bacteria, which are able to oxidize ammonium using nitrite as electrons acceptor (Cema, 2009). Mulder confirmed this theory 20 years later. He noticed decrease in the concentration of nitrogen in the denitrifying fluidized bed reactors and put forward the idea that it may be caused by ANaerobic AMMonium OXidation process (Van Hulle et al, 2010). Then Van de Graaf jointly with co-workers proved that Anammox needs nitrites rather than as previously thought nitrates as electrons acceptor (Cema, 2009).
Since the discovery, the Anammox process is constantly being studied, because its application in wastewater treatment plants can bring rational benefits in the future.
3.1.2. Experiments carried out on Anammox process at low temperatures and low nitrogen concentration
Many research in lab- and pilot- scale were performed on the Anammox process. However, for improvement controlling of process this actions should be continued (Van Hulle et al, 2010).
Dosta et al (2007) performed an experiment on Anammox process on a lab-scale SBR reactor with a capacity of 1 liter. It was carried out to investigate long- and short-term effect of temperature on the process. The conclusion drawn from the experiment regarding apply the system at low temperature is a two-step process of start-up, which is caused by a very low growth of biomass. The first step is the production of biomass in a separate reactor in temperature close to optimal. The second step is
Fig. 1 Nitrogen cycle including Anammox.
Kamil Maloszewski TRITA LWR Degree Project 13:41
8
to adjust the biomass to a low temperature in the same reactor, and finally to the inoculation.
Another conclusion is that the Anammox SBR is working properly at 18°C. At a temperature of 15°C, the maximum capacity of the reactor decreased and the system began to work unstably (Dosta et al, 2007).
However, in the experiment carried out in 2012, Rajkowski reached the stable work of process at temperature of 13°C. The process was conducted in MBBR reactor with Kaldnes carriers with biofilm. The reactor was fed with steady stream of supernatant. At the beginning the process was carried out at 16°C, and next temperature was decreased to 13°C. Results showed that process is feasible in this range of tempera-tures. Maximum values of ammonia removal efficiency was respectively: for 16°C - 90% and for 13°C - 80% (Rajkowski, 2012).
3.2. Comparison between Nitritation/Anammox and Nitrifica-tion/Denitrification processes
In order to realize the advantages of the Anammox process, should be compared to the conventional process, which is most commonly used for wastewater treatment - Nitrification/Denitrification.
Process Nitritation/Anammox consumes 60% less oxygen than traditional Nitrification/Denitrification. Furthermore, in this process, additional source of carbon is not necessary. Both processes require the same buffering capacity (Van Hulle et al, 2010). Denitrifying bacteria have almost 100 times higher growth rate than Nitrifiers/Anammox bacteria. Denitrification can be performed in a pH range of 6 - 9, and in turn, the optimal pH for Anammox is around 8 (Kumar and Jih-Gaw, 2010). Production of greenhouse gases during Anammox process almost does not exist. It can be reduced by 88% compared to the Nitrification/Denitrification (Rajkowski, 2012). Operational costs of Nitrification/Denitrification are much higher than of Nitrita-tion/Anammox process. It results for need of aeration, which is necessary for nitrification and additional source of carbon required for denitrification (Bertino, 2010).
3.3. Nitrogen removal systems with applications of Anammox Practical use of Anammox process is still limited due to the very slow rate of bacterial growth and low yield of the cells, and thus a long start-up period. Anammox bacteria produce sludge granules or biofilm, which obtain a high concentration of biomass in an easy and economical way, and therefore are preferred for use in the MBBR in full-scale. However, there is often a certain value of solid materials in wastewater, that can reduce the activity of process in full-scale based on MBBR. The first reactor with Anammox process started-up in Rotterdam. It has been scaled to full-scale directly from lab scale. Purifies up to 750 kgN/d of wastewater . In the Netherland, has launched a full scale reactor of 70 m3 capacity. Start-up time lasted 3.5 year, but now is working stable. The reactor reached 9.5 kgNm-3 d-1 nitrogen removal rate (Van der Star et al, 2007).
The wastewater treatment plant in Strass in Austria used partial Nitritation/Anammox process in SBR reactor. The process has been a success and achieved the removal 300 kgN/d. Intermittent aeration was used. Process was maintained by control of time, pH and dissolved oxygen (Wett, 2006).
In Himmerfjärden WWTP in Sweden, one-stage deammonification process is used in a full scale for treatment of supernatant from digested
Application of on-line measurements and activity tests for the Nitritation/Anammox process
9
sludge. The process is carried out in MBBR reactor with Kaldnes carriers inside. It was designed for 480 kg d−1 of nitrogen load, and achieves efficiency of nitrogen removal over 80% (Plaza et al, 2011).
First and only one in the world WWTP with using the Anammox for treatment of main stream wastewater without augmentation of influent by side stream is in Singapore. Changi Water Reclamation Plant treats 800 000 m3/d of municipal sewage. Step-feed activated sludge process used there, consists of four lines. Three of four reactors remove COD and BNR (Biological Nitrogen Removal) and one only COD. The process allows to remove 100% of NH4-N and 75% of TN in main effluent. However implementation of the process is easier there, cause Singapore is in tropical climate zone with high temperatures during a year. Average temperature range of municipal wastewater is 28-32°C, which is favourable for Anammox bacteria (Cao et al, 2013).
Effective use of Anammox at low temperatures and low nitrogen concentrations is the aim of still ongoing studies. Many of processes with application of Anammox as for example OLAND (oxygen-limited autotrophic nitrification/denitrification) or DEMON (DEamMONifica-tion) is currently being studied (Al-Omari et al, 2013, De Clippeleir et al, 2013).
Experiences with processes of start-up a full-scale reactors, which are launched so far, allow for faster start-up in the future.
4. AIM OF STUDY
The main objective of this thesis is to evaluate the use of on-line measurements and activity tests to control and monitor the Nitrita-tion/Anammox process, conducted in MBBR reactor. Obtained results can help determine the direction of further research and control strategies based on these measurements. During the study, efforts were made to determine whether:
• on-line measurements are useful for monitoring the process;
• on-line measurements allow for more effective control of the process;
• control of on-line measurements and activity tests can make the process more reliable.
The process was carried out at low temperature of 13°C and supplied by diluted supernatant with gradually decreased concentration of ammo-nium. Observation and assessment of changes in removal efficiency of NH4-N in the given conditions was an additional goal of this study.
Numerous tests were performed in five months, such as SAA, OUR, NUR in order to control and assess microbial activity in time of adaptation of bacteria for decreased feed source.
During this period, various actions were carried out, such as:
• activity tests;
• chemical analysis in order to obtain knowledge about the process;
• operation, cleaning and calibration of on-line and portable devices used for measuring physical parameters;
• regulation of pumps and valves.
The knowledge gained can help control the process with greater accuracy at full scale and make it more reliable.

Kamil Maloszewski TRITA LWR Degree Project 13:41
10
5. METHODOLOGY
5.1. Hammarby Sjöstadsverket Hammarby Sjöstadsverk is a research center in Stockholm, Sweden, built in 2003. It is operated and maintained jointly by Royal Institute of Technology and Swedish Environmental Researching Institute. Lots of different experiments related to wastewater treatment takes place there. This facility is also available for students who can develop their skills and knowledge, working together with an experienced and qualified staff on the conducted research.
5.2. Description of pilot plant reactor In research place, there are two reactors for Anammox process study, each with other conditions inside (Fig. 2). Reactor for the study was operated at 13°C. The working volume of the reactor is 200 liters and was filled with 80 liters of Kaldness carriers containing biofilm (Fig. 3). As the supply source was supernatant that was diluted with tap water in a tank with capacity of 1 m3. The cooling system helps to maintain proper temperature. It is located inside the reactor. The reactor is also equipped with a stirrer which operates continuously and the aeration system. Next to the outflow of the reactor is small settler, which is used to take samples of the effluent. Inside the reactor are also devices that are used to measure and control the conditions such as pH, dissolved oxygen, conductivity, redox. The measurement results of the on-line devices were transferred to the computer, which save them once every minute on the hard disc.
Fig. 2 Nitritation/Anammox process installation on Hammarby Sjöstadsverk Research Station.
Fig. 3 Kaldnes carriers with biofilm.

Application of on-line measurements and activity tests for the Nitritation/Anammox process
11
5.3. Batch tests
5.3.1. Specific Anammox Activity (SAA)
Specific Anammox Activity (SAA) test is performed to measure the capacity of Anammox bacteria during process and to obtain the point of view of their response to temperature and feed quantity. It consists in measuring the overpressure of nitrogen gas generated by the bacteria (Dapena-Mora et al, 2006). The measurement was made three times in order to obtain the average result and make sure that the measurement error is the smallest. Test was done once a week as follows. First sampled carriers were taken from the reactor and rinsed gently in tap water and then in phosphate solution buffer (0.14 gKH2PO4/l and 0.7 gK2HPO4/l) to obtain pH of 7.8. Subsequently fifteen carriers together with the buffer were introduced into each of three bottles and filled with buffer up to 24 ml volume. Then bottles were closed with a rubber seal and purged with nitrogen for 10 minutes, in order to achieve anaerobic conditions. After the expiry of this time, each bottle was introduced for 10 minutes into a water bath at 25°C to obtain stable state of the samples. Before taking the first measurement, two substrates (0.5 ml of NH4Cl and 0.5 ml of NaNO2) were added to each bottle using a syringe with needle. This allows for initial nitrogen concentration of 70 mgN/l. Next samples were taken by the pressure meter every 30 minutes until five measurements (Yang, 2012).
5.3.2. Oxygen Uptake Rate (OUR)
In order to evaluate potential activity of different types of bacteria present on the surface of biofilm in Kaldnes rings every two weeks Oxygen Uptake Rate (OUR) test was made. This is achieved by the inhibition each of groups (Nitrobacter, Nitrosomonas) by the respective inhibitors such as NaClO3 and ATU (Surmacz-Gorska et al, 1996). Bacteria considered in this study: Heterotrophic (responsible mostly for denitrification), Nitrobacter (taking part in nitratation) and Nitrosomo-nas (responsible for nitritation). The test was done in three attempts. To carry out the test it was necessary to take 107 rings directly from the reactor, and to prepare supernatant, that was diluted with water to obtain concentration of ammonium around 100 mgN-NH4/l. Before beginning the test, the rings were gently washed in water. Process is performed in 1,56 l bottle (Fig. 4). During the test, the bottle is completely filled with the mixture of water and supernatant , and the rings. The oxygen content was tested by the oxygen sensor, which send a signal through the
Fig. 4 Set to take the SAA test (left) and OUR test (right).

Kamil Maloszewski TRITA LWR Degree Project 13:41
12
converter to the computer with specialized software. At the time of the test, the bottle was placed on magnetic stirrer in water bath at 25°C. Two inhibitors: NaClO3 (to inhibit activity of Nitrobacter) and ATU (to inhibit Nitrosomonas bacteria) were added respectively after 7 and 6 minutes. The test was finished after subsequent 5 minutes, during which the activity of heterotrophic bacteria was checked (Yang, 2012).
5.3.3. Nitrate Uptake Rate (NUR)
Nitrate Uptake Rate (NUR) is being done to see whether denitrification process occurs in the reactor. The test was carried out every two or three weeks. The first stage of preparation of the test is similar to the OUR. The supernatant was mixed with tap water, and 400 ml of carriers rings were taken from the reactor and washed gently in water. The test is carried out in 1.5 l bucket sealed from the top with parafilm and continuously supplied with nitrogen to remove air. The process was conducted in the water bath at 25°C in order to maintain a constant temperature. After reaching approximately 0.5 mgO2/l test is started. After 10 minutes, 10 ml of NaNO3 substrate were added and after a while first sample was taken. Samples were taken every hour for 5 hours. Each sample was tested for the content of NO3--N. In the first and last sample COD was checked to verify organic carbon consumption. Analysis of samples was performed using the Dr. Lange tests: LCK514 for COD and LCK340 for NO3-N (Yang, 2012).
5.4. Chemical analysis During the study, the process was conducted in four stages. In each stage, the concentration of ammonia was reduced in inflow (respectively 500, 250, 175, 125 mg NH4-N/l). Each week, a chemical analysis was done in order to evaluate the process and to improve its controlling. Samples were taken from influent once a week and twice from effluent. For this purpose Dr Lange cuvettes were used. Before the start of measurement process, the sample was filtered through two paper filters 1.6 and 0.45 µm. To measure the COD sample was not filtered.
5.5. Physical parameters Control of physical parameters is an important element that will help to obtain a more accurate knowledge of the conditions in the reactor. This enables a faster response in case of adverse events and elimination of negative factors affecting the process. On-line devices, located in the reactor, continuously measure physical parameters such as pH, DO,
Fig. 5 Manual devices used to measure respectively: pH, DO and conductivity.

Application of on-line measurements and activity tests for the Nitritation/Anammox process
13
conductivity, redox. The measurements are collected and sent to a computer that records the minutes average on the hard drive. This makes it possible to examine them at any time. In addition, almost every single day a manual measurement was performed using portable devices (Fig. 5). It aimed to compare the results of the portable and on-line devices. This resulted in better monitoring of the process. It was also used to assess reliability of devices. Each measurement was performed by specially prepared for this devices .
6. RESULTS AND DISCUSSION
This section presents and analyzes the results obtained during the study. Chemical analysis of influent and effluent was carried out and the physical parameters were measured to ensure that the process is working properly.
6.1. Microbial activity of different groups of bacteria Evaluation of activity of bacteria was assessed by Kaldnes carriers taken before each test directly from the reactor. These studies are based on three tests: SAA, OUR and NUR. The SAA and OUR tests are very important from the point of view of monitoring of the process. They allow with the support of additional less significant research to create a complete assessment of the factors affecting the process. The NUR is an additional way that helps to assess the presence of denitrification process in the reactor. The results of measurements were compiled in tables and carefully analyzed (APPENDIX I).
6.1.1. Anammox – (SAA)
Test SAA is an important test for monitoring bacterial biomass. During the study, efforts were made to do the test once a week to have a
Table 3 SAA results for different influent concentrations.
Concentration 500 mgNH4-N/l 250 mgNH4-N/l 175 mgNH4-N/l 125 mgNH4-N/l
SAA gN/m2/d
min max avg min max avg min max avg min max avg
0.33 0.48 0.40 0.28 0.49 0.38 0.29 0.39 0.35 0.25 0.40 0.32
Fig. 6 Specific Anammox Activity (SAA) test results.

Kamil Maloszewski TRITA LWR Degree Project 13:41
14
constant view of quality of the process. SAA values ranges from 0.25 to 0.49 gN/m2·d (Table 3). The best result was achieved in the initial phase of testing, after first change of inflow when the ammonia concentration there was high (250 mg NH4-N/l). The lowest result was achieved in the final, fourth phase of testing when the ammonia concentration was low (125 mg NH4-N/l). It demonstrates great impact of supplied ammonium at bacterial activity. Correlation exists between the concentrations and the results. The difference between the highest and the lowest result is 50%. The same is with the concentrations.
During the study impact of changes in the concentration at the bacterial activity is pronounced. It decreased together with the lowering the concentration and then increased (Fig. 6). Fluctuations indicate that the bacteria need time to adapt to the new conditions. The test was carried out under optimum conditions of temperature and pH, with absence of oxygen. In the reactor, the process is conducted at 13°C. The activity of the bacteria may be affected by various factors, such as low temperature of the process, changes of pH and permeation of oxygen from the air. Thus activity of bacteria can be lower.
The results demonstrate that SAA test is an excellent and reliable method for monitoring the bacteria that are actively involved in the process of ammonia removal performance.
6.1.2. Ammonia and nitrite oxidizing bacteria – (OUR)
At the time the study, a series of 12 tests was conducted , which gave a better view of the process. The bacteria compete for nutrients, which is a normal phenomenon. The most active group of bacteria indicates the conditions in the reactor, mainly oxygen conditions. NOB bacteria oxidize nitrites to nitrates. Small amount of oxygen causes the oxidation of small amounts of NO2, which can be used then by the AOB bacteria as an electron acceptor for the oxidation of ammonia directly to nitro-gen gas. This is indicated in the Nitritation/Anammox process. Heterotrophic bacteria located on the outer layer of the biofilm consume the oxygen, which helps to maintain anaerobic conditions inside. Throughout the test only once heterotrophic bacterial activity was the
Fig. 7 Oxygen Uptake Rate (OUR) test results.

Application of on-line measurements and activity tests for the Nitritation/Anammox process
15
highest (Fig. 7). This could have been caused by problems with aeration,
which resulted in high amount of oxygen in the reactor. Besides this result, Nitrosomonas bacteria are most active, which indicates good course of the process. After reducing the ammonia concentration in inflow, decrease activity of bacteria are noticeable. This may be caused by a shock due to the sudden decrease of substrate amount.
The results of the OUR test provide valuable information about the process and show competition between groups of bacteria. Nitrosomo-nas are the most active, which mean that process is well-run.
6.2. Evaluation of nitrogen removal efficiency at low temperature and low ammonium concentration – chemical analysis results
Chemical analysis was performed in order to gain knowledge about the conditions in the reactor. It also gives a view on efficiency of the process. During the study, a detailed analysis of inflow and outflow was performed (APPENDIX II). Amount of NO3-N and NO2-N in the inflow was insignificant, caused by anaerobic conditions prevailing in the tank with the mixture of supernatant and tap water. Measuring of this parameters was omitted (Table 4). Removal of ammonia, as the main inorganic nitrogen compound in the supernatant is used to assess the effectiveness of the process. The difference between NH4-N in the inflow and outflow indicates the efficiency of the process (Fig. 8).
Table 4 Schedule of chemical analysis.
Monday Wednesday Friday
Effluent:
NH4-N, NO3-N, NO2-N, TN, Alkalinity, CODf,
CODuf
Effluent:
NH4-N, NO3-N, NO2-N
Effluent:
NH4-N, NO3-N, NO2-N
Effluent:
Inflow:
NH4-N, TN, Alkalinity, CODf, CODuf
Inflow:
Fig. 8 Concentrations of nitrogen forms.

Kamil Maloszewski TRITA LWR Degree Project 13:41
16
Rajkowski (2012) showed that at low temperatures of 13°C can be achieved ammonia removal efficiencies up to 80%. However, low oxygen and constant decrease the concentration of ammonia in inflow makes ammonia removal more difficult. Therefore, the highest achieved result in this study (75.3%) is satisfying. The highest result of total nitrogen removal is 53.5% (Table 5).
In the last two inflow concentration shifts, the removal efficiency of both total nitrogen and ammonium is similar. This proves a propriety of process , because nitrites are almost fully used by the Anammox bacteria which causes lower production of nitrites in the process of nitrification. Thus, in the majority of inorganic nitrogen is ammonium, which explains the similarities between both of effectiveness. It can be concluded that the amount of nitrates in the effluent defines the course of Deam-monification process. Throughout the study period, the removal efficiency is unstable (Fig. 9). Constant fluctuations result from changes in supply conditions which do not allow full adaptation of the bacteria. The biggest drop in ammonia removal efficiency was after second change in ammonia concentration in the inflow. Then after period of regular lowering of efficiency, a sudden increase was observed. The efficiency achieved the highest value over the study. This is caused by high instability of oxygen in the reactor and with the highest jump of its value. Optimization of the ammonia concentration in inflow and process control can give satisfactory results in the future.
6.3. Analysis of physical parameters – evaluation of pilot plant operation
Physical parameters are an essential element used to control the performance of the process. In this thesis, for this reason they were
Table 5 Nitrogen removal efficiency results.
minimum maximum average
NH4-N removal efficiency 13.2 % 75.3% 40.6%
N removal efficiency 1% 53.5% 24.4%
Fig. 9 Ammonium removal efficiency.

Application of on-line measurements and activity tests for the Nitritation/Anammox process
17
taken into special attention. Controlling of the process takes place using the on-line and portable measurement of pH, DO, redox and monitoring using the conductivity.
6.3.1. On-line measurements for controlling and monitoring of the Nitrita-tion/Anammox process
Due to the large role of on-line measurement in the process control, they are very helpful in the process operation and to search solutions that will improve the quality of carrying out the process. The continuous measurement of conditions in the reactor will simplify the monitoring and shorten the reaction time during any problems.
pH
The optimal pH range for the Nitritation/Anammox process is 7.0 - 8.5 (Strous et al, 1997). Exceeding this range can have a negative impact on the process. Changes in pH are caused mainly by changes in alkalinity. During the study, there were no problems with pH. In this period its value is within acceptable limits (Fig. 10). The process is carried out under appropriate conditions and not affected by any external factors that could cause pH above the norm. The pH decreased consistently with decreasing concentration of nitrogen compounds in the inflow. It is related to the decrease of alkalinity in the tank with the supernatant mixture. The influent mixed with the wastewater contained in the reactor causes decrease of alkalinity in the reactor and reducing pH. The decrease in pH is related to the oxygen content also. Its fluctuations do not allow to stabilize the pH.
DO
Dissolved oxygen is a key operational factor in the process of Nitritation/Anammox. It has an impact on performance because can be an inhibitor of the process. Too much oxygen is adverse but must be ensured the right amount for nitritation. For this reason, care must be taken to control its value (Szatkowska, 2007). Oxygen is consumed by the bacteria present on the outer layer of Kaldnes ring. In this way Anammox bacteria that are found in the inner layer are protected from inhibition. Cema et al (2011) tested the role of the oxygen in the Nitritation/Anammox. They conducted activity tests in large and small amount of oxygen. Studies have shown that DO has a strong influence
Fig. 10 On-line values of pH.

Kamil Maloszewski TRITA LWR Degree Project 13:41
18
on the removal of nitrogen in Deammonification process. The high oxygen concentration gives higher removal but causes production of nitrates, which can inhibit the process.
During the study the oxygen concentration was continuously measured by the probe installed in the reactor. Large fluctuations in the value of oxygen were caused by changes in the concentration of ammonium in inflow (Fig. 11). After the first change (27.02) can be seen the beginning of the irregularities in the oxygen content, which escalated with further changes of inflow. There has been decrease in ammonium removal efficiency and production of nitrates and nitrites. In the period of fifteen days (from 24.03) oxygen has stabilized. This resulted in a gradual increase in performance up to the 62%. The growing fluctuations after that time caused sudden drop of effectiveness. This indicates that oxygen is a key element influencing the removal of nitrogen. It is important, therefore, the constant control and monitoring of dissolved oxygen.
Conductivity
The use of conductivity in the Nitritation/Anammox is strictly recommended. It can be used for automatic control of system, to provide information to the operator about the process. Conductivity measurement support and facilitate daily operation (Szatkowska, 2007). Conductivity changes under the influence of alkalinity, which can indicate the presence of nitrification. During the research, the conductivity decreases, which means that the removal of ammonium occurs. Graph of conductivity coincides with the graph of NH4-N in the effluent, indicating excellent correlation between these measurements (Fig. 12). This shows that the conductivity is a good parameter to monitor the progress of process and the removal of nitrogen. This parameter accurately reflects the state of ammonium in the reactor. It gives immediate results and is easy to measure. Conductivity can be measured directly in the reactor (Levlin, 2010). This is an excellent indicator of the efficiency of the process.
In carried out studies conductivity was measured by means of on-line and portable devices. It play important role in control of process course. Conductivity is measured in unit of s/cm2. Ions responsible for conduction are NH4, NO3, NO2 and HCO3. Thus together with decreasing ammonium concentration as is shown on charts in figure 10 in the influent conductivity is also decreasing. It is reflection of
Fig. 11 On-line values of dissolved oxygen.

Application of on-line measurements and activity tests for the Nitritation/Anammox process
19
ammonium amount in reactor, therefore ammonium removal efficiency can be estimated based on this parameter as good as during chemical analysis.
6.3.2. Relationships between measuring parameters
On the graphs of pH and conductivity can be seen dependence with changes of concentration in the inflow. A steady decline in the value of these parameters occurs along with a decrease in the ammonia content in inflow. After first and the biggest change it is the most visible. Then increase in the instability of dissolved oxygen content reduces the downward trend in pH and conductivity. After the biggest change in the oxygen (an increase of 0.9 mg/l which occurred 27.05) took place drastic change in pH (decrease from 7.7 to 7.3). While analyzing these changes
Fig. 12 Comparison between NH4-N in the effluent and conductivity.
Fig. 13 Comparison between on-line and portable measurements of pH.

Kamil Maloszewski TRITA LWR Degree Project 13:41
20
can be concluded that the physical parameters such as pH, DO, conductivity, depend on each other. With the increase of pH, dissolved oxygen decreases. Also concentration of nitrogen compounds in the reactor affects pH. This is shown by the similar trend of changes that has conductivity, which is an indicator of the content of NH4-N in the effluent.
6.3.3. Comparison between results for on-line and portable devices
During the study, once a day on-line and portable measurements of physical parameters were made. It was done to check the efficiency of devices, and thus more rapid response in case of failure. Therefore monitoring of the process was improved. Comparing on-line and portable measurements of pH can be concluded that the correlation between results from both devices is good (Fig. 13). However, it is wrong conclusion. Differences in pH indications are not too large, but still occur too often, and the correlation is at a low level of 0.32. The best correlation of 0.92 has the conductivity (Fig. 14). The difference between readings of devices were very small (Fig. 15). It is satisfying result, which shows no problems in controlling the indicator and reliability of both measurement devices. For oxygen differences in measurements are large (Fig. 16). It results in a very low correlation between results. This may indicate a failure of one of the devices. It can also be caused by irregularities in the supply of oxygen caused by the control valve, which may not be sufficiently precise for small oxygen set values.
6.4. Evaluation of Nitritation/Anammox at low nitrogen concentra-tion
For good evaluation of the Nitritation/Anammox process in low inflow concentrations of nitrogen, all the factors that may have an impact on the performance such as bacterial activity or efficiency of ammonia removal should be taken into consideration. The results of experiments show that the changing conditions in the inflow affect the activity of bacteria. Sudden decrease the supply of ammonia causes it to fall.
Fig. 14 Correlation between on-line and portable measurements of conductivity.

Application of on-line measurements and activity tests for the Nitritation/Anammox process
21
However after the time required to adapt, bacterial activity has an upward trend, which shows the potential to achieve satisfying process conditions and its stability in the future. It is a good prognosis for process control. The content of nitrogen compounds and their removal efficiency also shows a significant correlation from the concentration of supply. Predominant amount of bacteria Nitrosomonas throughout the entire process proves its good progress despite poor concentration of ammonia in the inflow. Further studies are carried out to obtain a minimal concentration of NH4-N supply allowing stable operation of the reactor.
Fig. 15 Comparison between on-line and portable measurements of conductivity.
Fig. 16 Comparison between on-line and portable measurements of dissolved oxygen.

Kamil Maloszewski TRITA LWR Degree Project 13:41
22
6.5. Uncertainty during experimental work During operation of the reactor, conducting the tests and measuring the parameters are exposed to a variety of uncertainties associated with the improper work of devices or systematic errors. For example, measurement of on-line and portable parameters may not always reflect the actual conditions in the reactor. It can be caused by incorrect operation of measurement devices or process control such as e.g. aeration system. In this study, there have been some problems with the dissolved oxygen. Too large fluctuations caused by difficulties with the appropriate adjustment of set value may cause interference in work of the reactor. Any action to improve, such as changing the oxygen sensor membrane and increase the frequency of calibration has been made. This should help to better control the process for a further period of research. Activity tests are very demanding and time-consuming. The smallest irregularity can significantly disrupt their course. Appropriate levels of oxygen, substrates and inhibitors during the test must be respected. Used equipment are also prone to errors. During the study, there were problems with the pressure meter, which was used to measure the overpressure in the SAA test. In case of incorrect work, measurement or even the whole test was carried out again in order to avoid errors.
7. CONCLUSIONS
Deammonification process with nitritation/anammox in MBBR reactor was carried out at 13°C. The objective of this study was to evaluate the process performance and efficiency at low concentrations of ammonium nitrogen in the inflow and assesment of on-line and portable measurement usefulness in controlling and monitoring.
It was observed that:
• process can be performed at low concentration of ammonium and low temperature of 13°C and its efficiency at the highest point achieved 53.5% of N removal (what result from chemical analysis);
• activity tests provide knowledge on activity of the bacteria, which is important for the monitoring of the process;
• physical parameters have an effect on the efficiency of nitrogen removal;
• dissolved oxygen is essential for the process and its proper adjusting can help to control the process and improve the efficiency;
• conductivity is a useful tool for monitoring the process, gives similar results as chemical analysis but is measured directly in the reactor and gives immediate results;
• at highest tested ammonium concentration of 500 mgNH4-N/l, maximum obtained value for SAA was 0.48 gN/m2·d, while at lowest tested ammonium concentration of 125 mgNH4-N/l, maximum obtained value was 0.40 gN/m2·d;
• nitrogen load varied between 0.77 and 0.24 gN/m2 ·d during the studied period. After rapid drop of nitrogen load, bacteria needs time for adaptation in new conditions.
Study of the influence of the low nitrogen inflow concentration on Anammox bacteria activity, and using on-line measurements and activity tests as tool for controlling and monitoring can create possibility to the development and application this technology in main stream condition in full-scale wastewater treatment plants.

Application of on-line measurements and activity tests for the Nitritation/Anammox process
23
REFERENCES
Al-Omari A, Wett B, Han M, De Clippeleir H, Bott C, Nopens I, Murthy S. 2013. Competition Over Nitrite in Single Sludge Mainstream Deammonification Process. In: Proceedings of the IWA Specialized Conference, Nutrient Removal and Recovery 2013: Trends in Resource Recovery and Use. 28-31 July, 2013, Vancouver, Canada.
Berends DHJG, Salem S, van der Roest HF, van Loosdrecht MCM. 2005. Boosting nitridication with the BABE technology. Water science and technology. 52(4):63-70.
Bernhard A. 2012. The Nitrogen Cycle: Processes, Players, and Human Impact. Nature Education Knowledge. 3(10):25.
Bertino A. 2010. Study on one-stage partial Nitrification-Anammox process in Moving Bed Biofilm Reactors: A sustainable nitrogen removal. TRITA-LWR Degree Project. 85 p.
Canfield DE, Glazer AN, Falkowski PG. 2010. The Evolution and Future of Earth’s Nitrogen Cycle. Science. 330(6001):192-196.
Cao Y, Kwok BH, Yong WH, Chua SC, Wah YL, Ghani YABD. 2013. Mainstream Partial Nitritation-ANAMMOX Nitrogen Removal in the Largest Full-Scale Activated Sludge Process in Singapore: process analysis. In: Proceedings of the IWA Specialized Conference, Nutrient Removal and Recovery 2013: Trends in Resource Recovery and Use. 28-31 July, 2013, Vancouver, Canada.
Cema G. 2009. Comparative study on different Anammox systems. TRITA-LWR PhD. 72 p.
Cema G, Plaza E, Trela J, Surmacz-Gorska J. 2011. Dissolved oxygen as a factor influencing nitrogen removal rates in a one stage system with partial nitritation and Anammox process. Water science and technology. 64(5):1009-1015.
Dapena-Mora A, Fernandez O, Campos JL, Mosquera-Corral A, Mendez R, Jetten MSM. 2006. Evaluation of activity and inhibition effects on Anammox process by batch tests based on thenitrogen gas production. Enzyme and Microbial Technology. Elsevier. 40:859-865.
De Clippeleir H, Vlaeminck SE, De Wilde F, Jordaens R, Courtens E, Boeckx P, Verstraete W, Boon N. 2013. Mainstream Sewage Treatment with Partial Nitritation-Anammox: Potential Role of NO Production. In: Proceedings of the IWA Specialized Conference, Nutrient Removal and Recovery 2013: Trends in Resource Recovery and Use. 28-31 July, 2013, Vancouver, Canada.
Dosta J, Fernandez I, Vazquez-Padin JR, Mosquera-Corral A, Campos JL, Mata-Alvarez J, Mendez R. 2007. Short- and long-term effect of temperature on the Anammox process. Journal of Hazardous Materials. 154:688-693.
Henze M, van Loosdrecht MCM, Ekama G, Brdjanovic D. 2008. Biological wastewater treatment. Principles, modelling and design. IWA Publishing. 511p.
Holton JR, Curry JA, Pyle JA. 2003, Encyclopedia of Atmospheric Sciences, Volumes 1-6. Elsevier. 3350p.
Janus HM, van der Roest HF. 1997. Don’t reject the idea of treating water. Water science and technology. 35(10):27-34.
Killpack SC, Buchholz D. 1993. Nitrogen Cycle. University of Missouri Extension. WQ252

Kamil Maloszewski TRITA LWR Degree Project 13:41
24
Kumar M, Jih-Gaw L. 2010. Co-existence of anammox and denitrification for simultaneous nitrogen and carbon removal – Strategies and issues. Journal of Hazardous Materials. 178:1-9.
Levlin E. 2010. Conductivity measurements for controlling municipal wastewater treatment. Research and application of new technologies in wastewater treatment and municipal solid waste disposal in Ukraine, Sweden and Poland: Proceedings of a Polish-Swedish-Ukrainian seminar. 51-62.
Malovanyy A, Plaza E, Yatchyshyn Y. 2011. Concentration of ammonium from wastewater using ion exchange materials as a preceding step to partial nitritation/Anammox process. Proceedings of international conference Environmental (Bio) Technologies. 1-17.
Malovanyy A, Sakalova H, Yatchyshyn Y, Plaza E, Malovanyy M. 2013. Concentration of ammonium from municipal wastewater using ion exchange process. Desalination. 329:127-134.
Mulder JW, van Loosdrecht MCM, Hellinga C, van Kempen R. 2001. Full-scale application of the SHARON process for treatment of rejection water of digested sludge dewatering. Water science and technology. 43(11):127-134.
Naturvårdsverket. 2009. Wastewater treatment in Sweden. Swedish environmental protection agency. 24p.
Plaza E, Stridh S, Örnmark J, Kanders L, Trela J. 2011. Swedish Experience of the Deammonification Process in a Biofilm System. Proceedings of the Water Environment Federation. Nutrient Recovery and Management 2011. 1067-1079
Rajkowski M. 2012. Evaluation of deammonification process operated at low temperatures. TRITA-LWR Degree Project 12:31. 40p.
Salem S, Berends DHJG, Heijnen JJ, van Loosdrecht MCM. 2003. Bio-augmentation by nitrification with return sludge. Water Research. 37(8):1794-1804.
Smil V. 1996. Cycles of life: civilization and the biosphere. Scientific American Library. 221p.
Stinson B, Murthy S, Bott C, Wett B, Al-Omari A, Bowden G, Mokhyerie Y, De Clippeleir H. 2013. Roadmap Toward Energy Neutrality & Chemical Optimization at Enhanced Nutrient Removal Facilities. In: Proceedings of the IWA Specialized Conference, Nutrient Removal and Recovery 2013: Trends in Resource Recovery and Use. 28-31 July, 2013, Vancouver, Canada.
Strous M, van Gerven E, Ping Z, Kuenen JG, Jetten MSM. 1997. Ammonium removal from concentrated waste streams with the anaerobic ammonium oxidation (Anammox) process in different reactor configurations. Water Research. 31(8):1955-1962
Surmacz-Gorska J, Gernaey K, Demuynck C, Vanrolleghem P, Verstraete W. 1996. Nitrification monitoring in activated sludge by oxygen uptake rate (OUR) measurements. Pergamon. 30:1228-1236.
Szatkowska B. 2007. Performance and control of biofilm systems with partial nitrification and Anammox for supernatant treatment. TRITA-LWR PhD. 77p.
Trela J. 2000. Intensyfikacja biologicznego usuwania azotu w dwufazowym procesie osadu czynnego ze wstępną denitryfikacją. TRITA-AMI REPORT 3080. 147p.
Van der Star WRL, Abma WR, Blommers D, Mulder JW, Tokutomi T, Strous M, Picioreanu C, van Loosdrecht MCM. 2007. Startup of

Application of on-line measurements and activity tests for the Nitritation/Anammox process
25
reactors for anoxic ammonium oxidation: Experiences from the first full-scale anammox reactor in Rotterdam. Water Research. 41:4149-4163.
Van Hulle SWH, Vandeweyer HJP, Meesschaert BD, Vanrolleghem PA, Dejans P, Dumoulin A. 2010. Engineering aspects and practical application of autotrophic nitrogen removal from nitrogen rich streams. Chemical Engineering Journal. 162(1):1-20.
Van Kempen R, ten Have CCR, Meijer SCF, Mulder JW, Duin JOJ, Uijterlinde CA, van Loosdrecht MCM. 2005. SHARON process evaluated for improved wastewater treatment plant nitrogen effluent quality. Water science and technology. 52(4):55-62.
Vitousek PM, Aber JD, Howarth RW, Linkens GE, Matson PA, Schindler DW, Schlesinger WH, Tilman DG. 1997. Human alternation of the global nitrogen cycle: sources and consequences. Ecological Applications. 7(3):737-750.
Wett B. 2006. Solved upscaling problems for implementing deammonification of rejection water. Water science and technology. 53(12):121-128.
Yang J. 2012. Controlling and monitoring of Deammonification process in moving bed biofilm reactor. TRITA-LWR LIC 2065. 29p.

Application of on-line measurements and activity tests for the Nitritation/Anammox process
I
APPENDIX I – ACTIVITY TESTS RESULTS
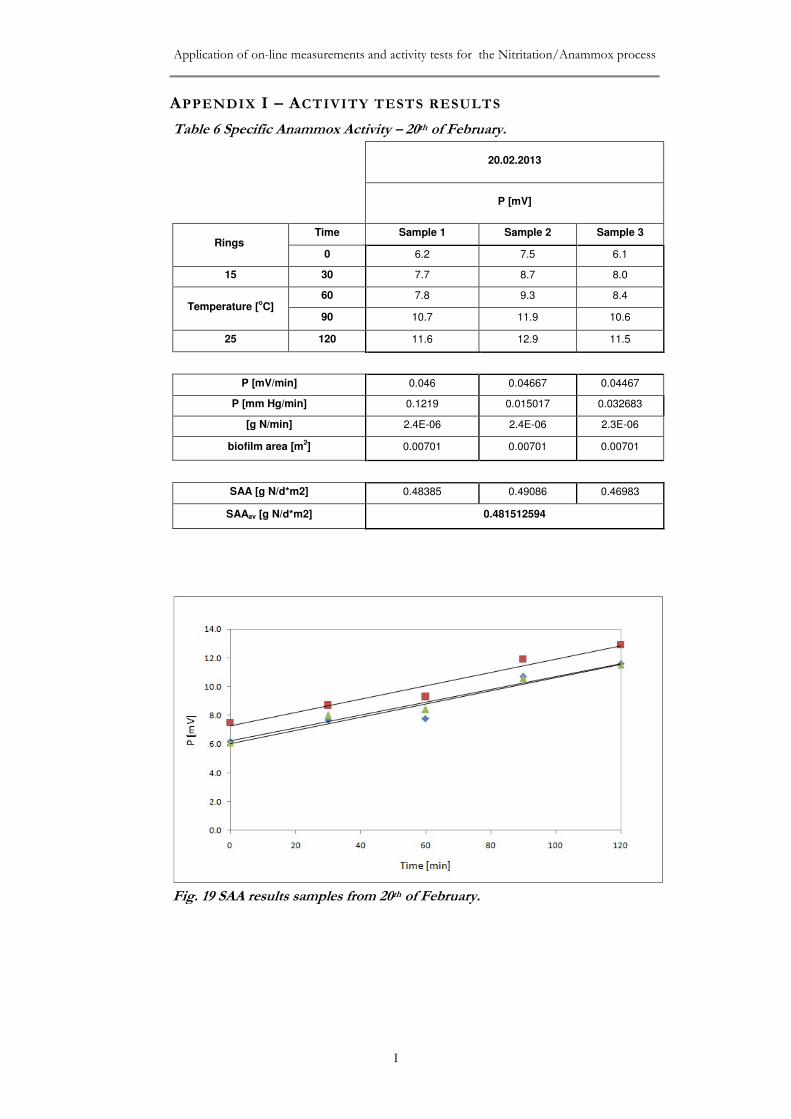
Table 6 Specific Anammox Activity – 20th of February.
20.02.2013
P [mV]
Rings Time Sample 1 Sample 2 Sample 3
0 6.2 7.5 6.1
15 30 7.7 8.7 8.0
Temperature [oC]
60 7.8 9.3 8.4
90 10.7 11.9 10.6
25 120 11.6 12.9 11.5
P [mV/min] 0.046 0.04667 0.04467
P [mm Hg/min] 0.1219 0.015017 0.032683
[g N/min] 2.4E-06 2.4E-06 2.3E-06
biofilm area [m2] 0.00701 0.00701 0.00701
SAA [g N/d*m2] 0.48385 0.49086 0.46983
SAAav [g N/d*m2] 0.481512594
Fig. 19 SAA results samples from 20th of February.
Kamil Maloszewski TRITA LWR Degree Project 13:41
II
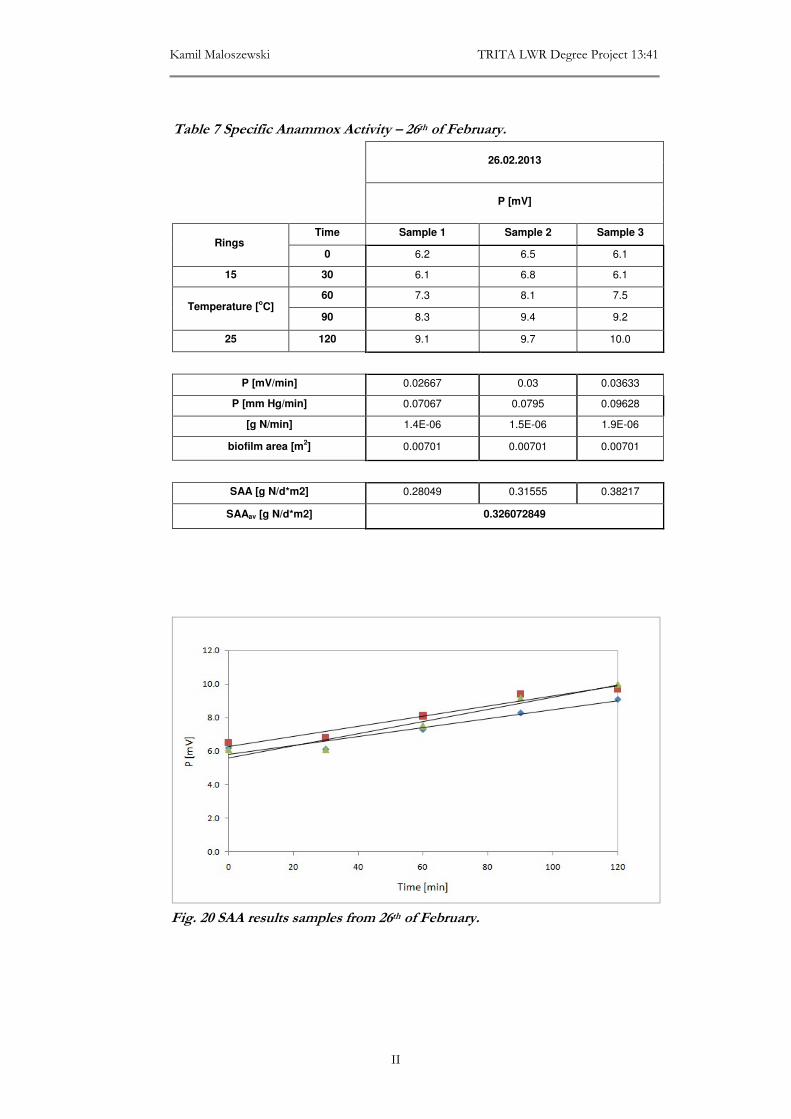
Table 7 Specific Anammox Activity – 26th of February.
26.02.2013
P [mV]
Rings Time Sample 1 Sample 2 Sample 3
0 6.2 6.5 6.1
15 30 6.1 6.8 6.1
Temperature [oC]
60 7.3 8.1 7.5
90 8.3 9.4 9.2
25 120 9.1 9.7 10.0
P [mV/min] 0.02667 0.03 0.03633
P [mm Hg/min] 0.07067 0.0795 0.09628
[g N/min] 1.4E-06 1.5E-06 1.9E-06
biofilm area [m2] 0.00701 0.00701 0.00701
SAA [g N/d*m2] 0.28049 0.31555 0.38217
SAAav [g N/d*m2] 0.326072849
Fig. 20 SAA results samples from 26th of February.

Application of on-line measurements and activity tests for the Nitritation/Anammox process
III
Table 8 Specific Anammox Activity – 6th of March.
06.03.2013
P [mV]
Rings Time Sample 1 Sample 2 Sample 3
0 6.4 5.8 6.5
15 30 7.7 6.9 8.2
Temperature [oC]
60 9.4 7.7 9.7
90 9.5 8.5 10.3
25 120 12.5 11.8 12.6
P [mV/min] 0.04667 0.04533 0.04767
P [mm Hg/min] 0.12367 0.12013 0.12632
[g N/min] 2.4E-06 2.3E-06 2.4E-06
biofilm area [m2] 0.00701 0.00701 0.00701
SAA [g N/d*m2] 0.49086 0.47684 0.50138
SAAav [g N/d*m2] 0.489693633
Fig. 21 SAA results samples from 6th of March.

Kamil Maloszewski TRITA LWR Degree Project 13:41
IV
Table 9 Specific Anammox Activity – 12th of March.
12.03.2013
P [mV]
Rings Time Sample 1 Sample 2 Sample 3
0 6.7 6.4 6.7
15 30 8.0 7.0 8.3
Temperature [oC]
60 9.1 7.6 9.4
90 10.3 8.7 10.4
25 120 12.2 9.8 11.9
P [mV/min] 0.0443333 0.02833 0.04167
P [mm Hg/min] 0.1174833 0.07508 0.11042
[g N/min] 2.27E-06 1.5E-06 2.1E-06
biofilm area [m2] 0.0070093 0.00701 0.00701
SAA [g N/d*m2] 0.4663192 0.29802 0.43827
SAAav [g N/d*m2] 0.400870921
Fig. 22 SAA results samples from 12th of March.

Application of on-line measurements and activity tests for the Nitritation/Anammox process
V
Table 10 Specific Anammox Activity – 19th of March.
19.03.2013
P [mV]
Rings Time Sample 1 Sample 2 Sample 3
0 6.5 6.6 6.6
15 30 7.5 7.7 8.1
Temperature [oC]
60 7.5 7.9 8.8
90 8.9 8.7 9.9
25 120 10.2 9.3 11.0
P [mV/min] 0.029333 0.02133 0.03533
P [mm Hg/min] 0.077733 0.05653 0.09363
[g N/min] 1.5E-06 1.1E-06 1.8E-06
biofilm area [m2] 0.007009 0.00701 0.00701
SAA [g N/d*m2] 0.308542 0.22439 0.37165
SAAav [g N/d*m2] 0.301529731
Fig. 23 SAA results samples from 19th of March.

Kamil Maloszewski TRITA LWR Degree Project 13:41
VI
Table 11 Specific Anammox Activity – 26th of March.
26.03.2013
P [mV]
Rings Time Sample 1 Sample 2 Sample 3
0 7.2 7.0 6.8
15 30 8.5 8.1 8.6
Temperature [oC]
60 9.0 8.6 9.3
90 10.0 9.7 9.7
25 120 10.0 10.1 10.6
P [mV/min] 0.02367 0.026 0.029
P [mm Hg/min] 0.06272 0.0689 0.07685
[g N/min] 1.2E-06 1.3E-06 1.5E-06
biofilm area [m2] 0.00701 0.00701 0.00701
SAA [g N/d*m2] 0.24894 0.27348 0.30504
SAAav [g N/d*m2] 0.275817893
Fig. 24 SAA results samples from 26th of March.

Application of on-line measurements and activity tests for the Nitritation/Anammox process
VII
Table 12 Specific Anammox Activity – 2nd of April.
02.04.2013
P [mV]
Rings Time Sample 1 Sample 2 Sample 3
0 7.6 7.5 7.3
15 30 9.6 9.2 9.3
Temperature [oC]
60 10.8 10.1 10.0
90 11.9 11.2 11.5
25 120 13.5 12.4 12.6
P [mV/min] 0.047 0.03933 0.04267
P [mm Hg/min] 0.12455 0.10423 0.11307
[g N/min] 2.406E-06 2E-06 2.2E-06
biofilm area [m2] 0.0070093 0.00701 0.00701
SAA [g N/d*m2] 0.4943685 0.41373 0.44879
SAAav [g N/d*m2] 0.452294596
Fig. 25 SAA results samples from 2nd of April.

Kamil Maloszewski TRITA LWR Degree Project 13:41
VIII
Table 13 Specific Anammox Activity – 16th of April.
16.04.2013
P [mV]
Rings Time Sample 1 Sample 2 Sample 3
0 6.7 6.7 6.6
15 30 7.3 8.3 8.2
Temperature [oC]
60 7.5 8.5 8.5
90 9.4 11.5 10.3
25 120 10.4 11.8 10.8
P [mV/min] 0.03167 0.04467 0.035
P [mm Hg/min] 0.08392 0.11837 0.09275
[g N/min] 1.6E-06 2.3E-06 1.8E-06
biofilm area [m2] 0.00701 0.00701 0.00701
SAA [g N/d*m2] 0.33309 0.46983 0.36815
SAAav [g N/d*m2] 0.390352442
Fig. 26 SAA results samples from 16th of April.

Application of on-line measurements and activity tests for the Nitritation/Anammox process
IX
Table 14 Specific Anammox Activity – 29th of April.
29.04.2013
P [mV]
Rings Time Sample 1 Sample 2 Sample 3
0 6.9 6.7 6.6
15 30 6.9 6.9 7.2
Temperature [oC]
60 7.0 7.3 7.2
90 7.7 8.3 9.2
25 120 9.3 10.1 11.2
P [mV/min] 0.01867 0.02733 0.03733
P [mm Hg/min] 0.04947 0.07243 0.09893
[g N/min] 9.6E-07 1.4E-06 1.9E-06
biofilm area [m2] 0.00701 0.00701 0.00701
SAA [g N/d*m2] 0.19634 0.28751 0.39269
SAAav [g N/d*m2] 0.292179972
Fig. 27 SAA results samples from 29th of April.

Kamil Maloszewski TRITA LWR Degree Project 13:41
X
Table 15 Specific Anammox Activity – 7th of May.
07.05.2013
P [mV]
Rings Time Sample 1 Sample 2 Sample 3
0 5.0 5.2 5.1
15 30 7.4 7.5 7.0
Temperature [oC]
60 7.5 7.8 7.0
90 9.1 7.8 7.9
25 120 10.2 9.5 9.8
P [mV/min] 0.04033 0.02967 0.03433
P [mm Hg/min] 0.10688 0.07862 0.09098
[g N/min] 2.1E-06 1.5E-06 1.8E-06
biofilm area [m2] 0.00701 0.00701 0.00701
SAA [g N/d*m2] 0.42425 0.31205 0.36113
SAAav [g N/d*m2] 0.365809325
Fig. 28 SAA results samples from 7th of May.

Application of on-line measurements and activity tests for the Nitritation/Anammox process
XI
Table 16 Specific Anammox Activity – 14th of May.
14.05.2013
P [mV]
Rings Time Sample 1 Sample 2 Sample 3
0 4.6 4.8 4.9
15 30 6.3 6.6 5.8
Temperature [oC]
60 6.4 6.6 6.1
90 7.9 7.3 7.3
25 120 9.6 9.3 9.0
P [mV/min] 0.03867 0.03233 0.03233
P [mm Hg/min] 0.10247 0.08568 0.08568
[g N/min] 2E-06 1.7E-06 1.7E-06
biofilm area [m2] 0.00701 0.00701 0.00701
SAA [g N/d*m2] 0.40671 0.3401 0.3401
SAAav [g N/d*m2] 0.362303165
Fig. 29 SAA results samples from 14th of May.

Kamil Maloszewski TRITA LWR Degree Project 13:41
XII
Table 17 Specific Anammox Activity – 21st of May.
21.05.2013
P [mV]
Rings Time Sample 1 Sample 2 Sample 3
0 5.3 5.0 4.9
15 30 6.2 6.4 6.7
Temperature [oC]
60 6.6 6.7 7.0
90 8.1 8.7 9.1
25 120 9.6 9.5 10.0
P [mV/min] 0.035 0.03767 0.042
P [mm Hg/min] 0.09275 0.09982 0.1113
[g N/min] 1.8E-06 1.9E-06 2.2E-06
biofilm area [m2] 0.00701 0.00701 0.00701
SAA [g N/d*m2] 0.36815 0.3962 0.44178
SAAav [g N/d*m2] 0.402039641
Fig. 30 SAA results samples from 21st of May.

Application of on-line measurements and activity tests for the Nitritation/Anammox process
XIII
Table 18 Specific Anammox Activity – 28th of May.
28.05.2013
P [mV]
Rings Time Sample 1 Sample 2 Sample 3
0 5.6 4.9 5.2
15 30 6.0 6.2 6.4
Temperature [oC]
60 6.3 6.2 6.8
90 7.8 7.3 7.9
25 120 8.5 7.5 8.1
P [mV/min] 0.02533 0.021 0.02433
P [mm Hg/min] 0.06713 0.05565 0.06448
[g N/min] 1.3E-06 1.1E-06 1.2E-06
biofilm area [m2] 0.00701 0.00701 0.00701
SAA [g N/d*m2] 0.26647 0.22089 0.25595
SAAav [g N/d*m2] 0.247768616
Fig. 31 SAA results samples from 28th of May.

Kamil Maloszewski TRITA LWR Degree Project 13:41
XIV
Table 19 Specific Anammox Activity – 4th of June.
04.06.2013
P [mV]
Rings Time Sample 1 Sample 2 Sample 3
0 4.2 4.3 4.0
15 30 5.3 5.0 5.2
Temperature [oC]
60 6.1 5.2 5.5
90 6.5 6.4 6.5
25 120 7.2 7.0 7.1
P [mV/min] 0.024 0.02267 0.025
P [mm Hg/min] 0.0636 0.06007 0.06625
[g N/min] 1.2E-06 1.2E-06 1.3E-06
biofilm area [m2] 0.00701 0.00701 0.00701
SAA [g N/d*m2] 0.25244 0.23842 0.26296
SAAav [g N/d*m2] 0.251274776
Fig. 32 SAA results samples from 4th of June.

Application of on-line measurements and activity tests for the Nitritation/Anammox process
XV
Table 20 Oxygen Uptake Rate test results.
Date Initial NH4-N (mg/l)
OUR (Nitrobacter + Nitrosomonas + Heterotrophic)
OUR (Nitrosomonas + Heterotrophic) OUR (Heterotrophic) OUR
(Nitrosomonas)
OUR (Nitrobacter)
slope average
(mgO2/l·s) (gO2/m
2/d) slope
average (mgO2/l·s)
(gO2/m2/d) slope
average (mgO2/l·s)
(gO2/m2/d) (gO2/m
2/d) (gO2/m
2/d)
24.01.2013 104
-0.001948
-0.001706 4.4207
-0.001708
-0.001618 4.1926
-0.000521
-0.000399 1.0329 3.1596 0.2281 -0.001463 -0.001527 -0.000276
15.02.2013 131.5
-0.001404
-0.001598 4.1420
-0.001612
-0.001481 3.8375
-0.000490
-0.000486 1.2584 2.5790 0.3046 -0.001792 -0.001349 -0.000481
07.03.2013 116
-0.001220
-0.001220 3.1622
-0.001172
-0.001172 3.0378
-0.000603
-0.000603 1.5630 1.4748 0.1244
14.03.2013 129
-0.001677
-0.001677 4.3468
-0.001620
-0.001620 4.1990
-0.000675
-0.000675 1.7496 2.4494 0.1477
27.03.2013 118
-0.002266
-0.001886 4.8885
-0.001625
-0.001572 4.0755
-0.000292
-0.000184 0.4778 3.5977 0.8130 -0.001628 -0.001571 -0.000187
-0.001764 -0.001521 -0.000074
05.04.2013 102
-0.002302
-0.002101 5.4458
-0.001883
-0.001818 4.7123
-0.000269
-0.000307 0.7949 3.9172 0.7335 -0.001972 -0.001814 -0.000315
-0.002029 -0.001757 -0.000336
18.04.2013 106
-0.001570
-0.001359 3.5217
-0.001389
-0.001110 2.8780
-0.000263
-0.000294 0.7612 2.1168 0.6437 -0.001094 -0.000947 -0,000268
-0.001412 -0.000995 -0.000350
26.04.2013 107 -0.002141 -0.001855 4.8082 -0.001684 -0.001585 4.1083 -0.000362 -0.000273 0.7068 3.4016 0.6998

Kamil Maloszewski TRITA LWR Degree Project 13:41
XVI
-0.001697 -0.001481 -0.000224
-0.001727 -0.001590 -0.000232
10.05.2013 98.5
-0.002245
-0.002264 5.8670
-0.001822
-0.001784 4.6228
-0.000324
-0.000298 0.7711 3.8517 1.2442 -0.002282 -0.001745 -0.000271
17.05.2013 98.5
-0.002573
-0.002291 5.9374
-0.002039
-0.001796 4.6552
-0.000318
-0.000346 0.8960 3.7593 1.2822 -0.002367 -0.001789 -0.000425
-0.001932 -0.001560 -0.000294
31.05.2013 94.5
-0.001935
-0.001858 4.8159
-0.001580
-0.001507 3.9061
-0.000293
-0.000293 0.7603 3.1458 0.9098 -0.002025 -0.001588 -0.000274
-0.001614 -0.001353 -0.000313
05.06.2013 104
-0.001885
-0.001807 4.6829
-0.001541
-0.001456 3.7740
-0.000199
-0.000114 0.2946 3.4793 0.9089 -0.001865 -0.001405 -0.000098
-0.001670 -0.001422 -0.000044
(*) Empty cells represent unreliable results related with measurement device problems or errors in execution

Application of on-line measurements and activity tests for the Nitritation/Anammox process
XVI
APPENDIX II – CHEMICAL ANALYSIS RESULTS
Table 21 Chemical analysis of Influent and Effluent of the reactor.
Date
Influent Effluent
N removal (gN/m
2/d) Flow
(ml/min) HRT
(days) Alkalinity (mmol/l)
COD (mg/l)
COD (mg/l)
unfiltered
TN (mg/l)
NH4-N (mg/l)
NH4-N load
(gN/m2/d)
Alkalinity (mmol/l)
COD (mg/l)
COD (mg/l)
unfiltered
TN (mg/l)
NH4-N (mg/l)
NO2-N (mg/l)
NO3-N (mg/l)
Ninorg
09.01.2013 43 3.23 51 305 497 897.5 472.5 0.76 - - - - 315 3.87 38.7 357.57 0.2089
11.01.2013 43 3.23 - - - - 472.5 0.73 - - - - 380 4.58 35.2 419.78 0.0816
14.01.2013 43 3.23 48.5 280 479 685 487.5 0.73 30.5 274 438 - 410 11.5 46.2 467.7 0.0074
16.01.2013 43 3.23 - - - - 487.5 0.75 - - - - 410 20.6 68.8 499.4 -
18.01.2013 43 3.23 - - - - 487.5 0.75 - - - - 342.5 13.4 87.6 443.5 0.0681
21.01.2013 43 3.23 - - - - 487.5 0.75 13 272 398 461 234 13 156 403 0.1308
23.01.2013 44 3.16 45 290 454 1068 480 0.77 - - - - 234 13 156 403 0.1338
25.01.2013 44 3.16 - - - - 480 0.76 - - - - 209.5 14.5 109 333 0.2328
28.01.2013 44 3.16 - - - - 480 0.76 16.2 260 469 505 234 18.6 128 380.6 0.1574
30.01.2013 46 3.02 51 308 509 720 452.5 0.79 - - - - 234 18.6 128 380.6 0.1646
01.02.2013 46 3.02 - - - - 452.5 0.75 - - - - 277.5 3.97 116.25 397.72 0.0907
04.02.2013 46 3.02 - - - - 452.5 0.75 26.75 270 372 687.5 295 6.15 95.25 396.4 0.0929
06.02.2013 40 3.47 49.05 387 549 1250 555 0.65 - - - - 295 6.15 95.25 396.4 0.0808
08.02.2013 38 3.65 - - - - 555 0.76 - - - - 320 6.36 87.1 413.46 0.1936
11.02.2013 38 3.65 - - - - 555 0.76 - 270 459 473 267.5 16 134 417.5 0.1881
14.02.2013 38 3.65 47.75 295 452 747.5 495 0.76 - - - - 267.5 16 134 471.5 0.1881
15.02.2013 38 3.65 - - - - 495 0.68 - - - - 255 14.5 147 416.5 0.1074
18.02.2013 42 3.31 - - - - 492.5 0.75 14.4 289 538 615 265 17 147 429 0.0998
19.02.2013 43 3.23 52 327 552 637.5 492.5 0.76 - - - - - - - - -
20.02.2013 43 3.23 - - - - 492.5 0.76 - - - - 270 14.8 126 410.8 0.1265
22.02.2013 43 3.23 - - - - 492.5 0.76 - - - - 277 16 122 415 0.1199
25.02.2013 43 3.23 - - - - 492.5 0.76 19.1 296 473 587.5 292 22.7 129 443.7 0.0755
27.02.2013 40 3.47 39.6 278 416 279 263 0.71 - - - - 302 18 127 447 0.0655

Kamil Maloszewski TRITA LWR Degree Project 13:41
XVII
28.02.2013 43 3.23 - - - - 263 0.41 - - - - - - - - -
01.03.2013 43 3.23 - - - - 263 0.41 - - - - 204 10.3 129 343.3 -
04.03.2013 43 3.23 - - - - 263 0.41 - 181 275 305 130 5.46 95.2 230.66 0.0501
06.03.2013 43 3.23 - 173 252 300 256 0.41 - - - - 118 3.29 73.6 194.89 0.1054
08.03.2013 43 3.23 - - - - 265 0.40 - - - - 129 3.35 54.4 186.75 0.1072
11.03.2013 43 3.23 - - - - 265 0.41 11.9 139 222 196 118 2.93 38.1 159.03 0.1640
13.03.2013 43 3.23 20.6 167 252 281 232 0.41 - - - - 137 3.16 34.3 174.46 0.1401
15.03.2013 43 3.23 - - - - 232 0.36 - - - - 140 3.34 28.6 171.94 0.0929
18.03.2013 43 3.23 - - - - 235 0.36 12.65 154 210 224 134.5 4.29 36.4 165.19 0.1034
20.03.2013 43 3.23 15.7 179 235 323 257 0.36 - - - - 166.5 3.6 24.1 194.2 0.0631
22.03.2013 43 3.23 - - - - 242.5 0.40 - - - - 146.5 2.9 19.7 169.1 0.1361
25.03.2013 43 3.23 - - - - 243.5 0.38 12.2 139 196 218 145.5 2.77 14.1 162.37 0.1240
27.03.2013 43 3.23 20.6 175 257 397.5 251 0.38 - - - - 158.5 3.39 14.2 176.09 0.1043
29.03.2013 43 3.23 - - - - 251 0.39 - - - - 159.5 2.61 11.3 173.41 0.1201
02.04.2013 43 3.23 - - - - 251 0.39 12.65 136 210 176.5 131.5 5.1 14.3 150.9 0.1549
04.04.2013 43 3.23 25.1 165 263 439 265 0.39 - - - - 131.5 5.1 14.3 150.9 0.1549
05.04.2013 43 3.23 - - - - 250 0.41 - - - - 160 9.85 21.4 191.25 0.1142
08.04.2013 43 3.23 - - - - 225 0.39 7.85 170 897 178 111 16.7 29.6 157.3 0.1435
10.04.2013 43 3.23 25.1 185 230 301 234 0.35 - - - - 85.5 22.5 36.5 144.5 0.1246
12.04.2013 43 3.23 - - - - 184 0.36 - - - - 119 8.43 33.6 161.03 0.1129
15.04.2013 43 3.23 - - - - 184 0.28 11.35 122 154 159 125 1.44 13.7 140.14 0.0679
17.04.2013 43 3.23 15 177 200 286.5 170 0.28 - - - - 124 0.59 6.73 131.32 0.0815
19.04.2013 43 3.23 - - - - 170 0.26 - - - - 124.5 1.29 10.7 136.49 0.0519
22.04.2013 43 3.23 - - - - 172 0.26 10.85 107 111 - 116 2.08 16.4 134.48 0.0549
24.04.2013 43 3.23 14.89 161 249 - 170 0.27 - - - - 109 2.32 4.92 116.24 0.0863
26.04.2013 43 3.23 - - - - 170 0.26 - - - - 108.5 3.12 9.65 121.27 0.0754
29.04.2013 43 3.23 - - - - 170 0.26 8.55 123 139 153.5 97.5 3.24 11.3 112.04 0.0897
02.05.2013 43 3.23 15.1 127 161 221 179.5 0.26 - - - - - - - - -
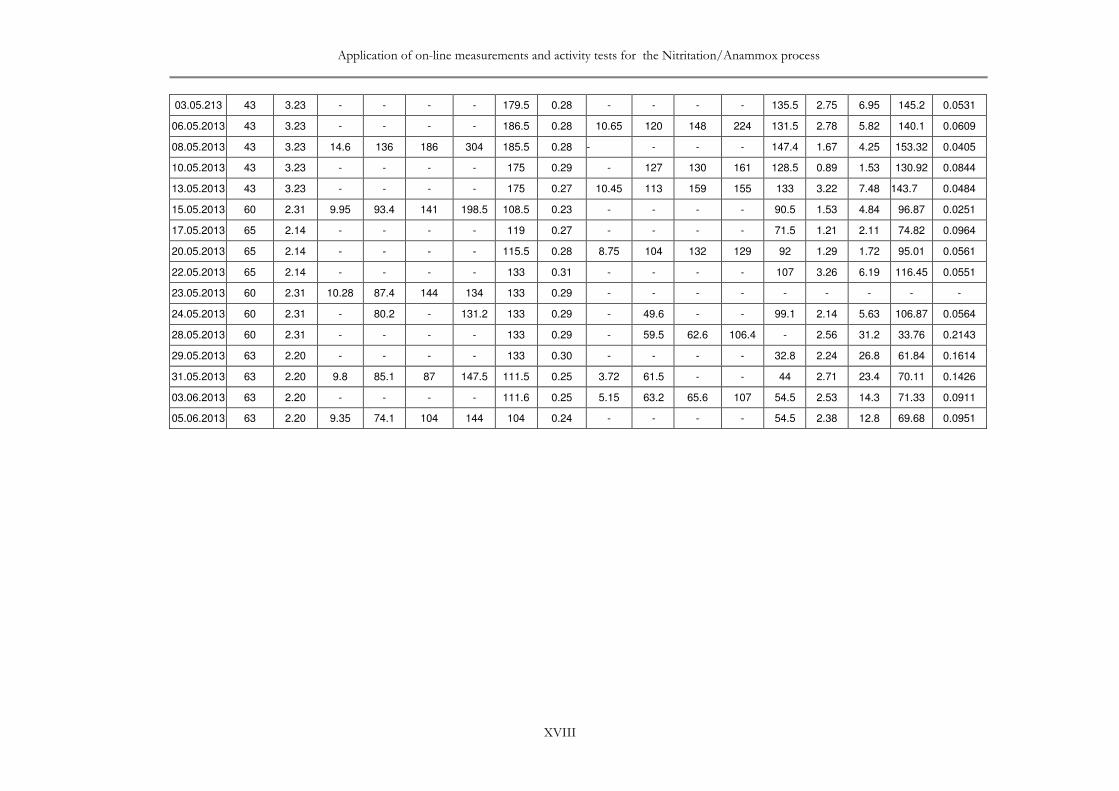
Application of on-line measurements and activity tests for the Nitritation/Anammox process
XVIII
03.05.213 43 3.23 - - - - 179.5 0.28 - - - - 135.5 2.75 6.95 145.2 0.0531
06.05.2013 43 3.23 - - - - 186.5 0.28 10.65 120 148 224 131.5 2.78 5.82 140.1 0.0609
08.05.2013 43 3.23 14.6 136 186 304 185.5 0.28 - - - - 147.4 1.67 4.25 153.32 0.0405
10.05.2013 43 3.23 - - - - 175 0.29 - 127 130 161 128.5 0.89 1.53 130.92 0.0844
13.05.2013 43 3.23 - - - - 175 0.27 10.45 113 159 155 133 3.22 7.48 143.7 0.0484
15.05.2013 60 2.31 9.95 93.4 141 198.5 108.5 0.23 - - - - 90.5 1.53 4.84 96.87 0.0251
17.05.2013 65 2.14 - - - - 119 0.27 - - - - 71.5 1.21 2.11 74.82 0.0964
20.05.2013 65 2.14 - - - - 115.5 0.28 8.75 104 132 129 92 1.29 1.72 95.01 0.0561
22.05.2013 65 2.14 - - - - 133 0.31 - - - - 107 3.26 6.19 116.45 0.0551
23.05.2013 60 2.31 10.28 87.4 144 134 133 0.29 - - - - - - - - -
24.05.2013 60 2.31 - 80.2 - 131.2 133 0.29 - 49.6 - - 99.1 2.14 5.63 106.87 0.0564
28.05.2013 60 2.31 - - - - 133 0.29 - 59.5 62.6 106.4 - 2.56 31.2 33.76 0.2143
29.05.2013 63 2.20 - - - - 133 0.30 - - - - 32.8 2.24 26.8 61.84 0.1614
31.05.2013 63 2.20 9.8 85.1 87 147.5 111.5 0.25 3.72 61.5 - - 44 2.71 23.4 70.11 0.1426
03.06.2013 63 2.20 - - - - 111.6 0.25 5.15 63.2 65.6 107 54.5 2.53 14.3 71.33 0.0911
05.06.2013 63 2.20 9.35 74.1 104 144 104 0.24 - - - - 54.5 2.38 12.8 69.68 0.0951