application of sequential quadratic programming method to
TRANSCRIPT

1. Introduction
Reactor furnaces such as a blast furnace have been play-ing vital roles in metal industries. Based on the improve-ments of furnace facilities, the size of a furnace has en-larged remarkably. As is well known, internal phenomenaof reactor furnaces are complex,1–4) and the operation of afurnace still depends on the experience and intuition ofskilled operators.
Since various mutable factors, such as gas flow, chemicalreactions, burn-through and anastomoses of iron ores andmovement of a filling in a furnace, are intricately entangled,the inner reactions of a reactor furnace remain a mystery.Meanwhile, stable, low cost furnace operation is required inthe industry. Moreover, in the future, automated furnace op-eration will be expected to cope with a decreasing numberof skilled operators and the difficulty in finding their suc-cessors.
In this research, we pursued a design method for temper-ature distribution control systems for reactor furnaces. Asdescribed above, due to the complexity of inner furnacephenomena such as chemical reactions, high pressure andhigh temperature, variables only near the furnace wall canbe measured. Therefore, we tried to estimate the inner fur-nace temperature distribution using measured data takenfrom sensors equipped near the furnace wall. In the estima-tion, the blowing condition is regulated using the sequential
quadratic programming method (SQP method) so that themeasured values match the calculated values of correspond-ing points in the furnace. In the control of inner furnacetemperature distribution, calculated distribution is com-pared with its desired one. In order to minimize the differ-ence between them, blowing condition and burden supplycondition are changed. Again, the SQP method is employedto carry out the control.
For these purposes, a simulator for inner furnace gasflow and temperature distribution was developed, whichuses boundary conditions as control variables. This simula-tor is simplified from previous studies5–7) to attain swiftcomputation preserving the principal reaction and heattransfer phenomena in a reactor furnace.
This simplified simulator is combined with the SQPmethod. That is, the temperature distribution in a reactorfurnace is estimated by SQP method using only measuredboundary values of a furnace. Here, the measured boundarydata includes temperature, pressure and gas flow near a fur-nace wall. Temperature distribution in a reactor furnace iscontrolled by regulating blowing conditions in multiple tuy-eres at the furnace bottom and supplying materials at thefurnace top.
2. Control Method of Temperature Distribution
In the following, the control method of temperature dis-
ISIJ International, Vol. 45 (2005), No. 3, pp. 347–355
347 © 2005 ISIJ
Application of Sequential Quadratic Programming Method toTemperature Distribution Control in Reactor Furnace
Kazuhito ISHIMARU, Masami KONISHI,1) Jun IMAI1) and Tatsushi NISHI1)
Graduate School of Natural Science and Technology, Okayama University, 3-1-1 Tsushimanaka, Okayama 700-8530 Japan.1) Department of Electrical and Electronic Engineering, Okayama University, 3-1-1 Tsushimanaka, Okayama 700-8530 Japan.
(Received on September. 30, 2004; accepted in final form on December 22, 2004 )
Recently, various studies have been undertaken to examine the inner furnace phenomena of a blast fur-nace. These studies are limited, however, to the evaluation of furnace performance while a designedmethod of furnace control remains unfulfilled. This paper proposes a method of estimating temperature dis-tribution in a reactor furnace using boundary data in order to control inner target furnace temperature distrib-ution. Initially, a simplified furnace simulation program for the calculation of inner furnace gas flow, pressureand temperature distribution is developed. Following that, the simulator is used to estimate and controlinner furnace temperature distribution. In the estimation, boundary data such as temperature and pressure,measured near a furnace wall, are used in the furnace simulation. Then, for the control of inner furnace tem-perature distribution, necessary values for gas blowing at the bottom of the furnace and the burden supplyat the top of the furnace are used. Both for the estimation and the control of the inner furnace temperaturedistribution, a sequential quadratic programming method, a method of the iterative optimization, is applied.In our method, an estimation of inner furnace temperature distribution is done as preparation for the deter-mination of furnace control variables. Through numerical experiments, the validity of our method is demon-strated, showing that the temperature distribution in a furnace can be regulated to the desired one after iter-ative control operations.
KEY WORDS: sequential quadratic programming method; optimization; reactor furnace; temperature distri-bution.

tribution in a reactor furnace is described. This method isshown in Fig. 1. As shown in the figure, there are two parts,the estimation of temperature distribution and the control ofit.
First, estimation part is processed. To know the tempera-ture distribution in a reactor furnace, the mathematicalmodel is applied using total gas flow, material charge con-dition and boundary conditions as its input. The mathemati-cal model is formed by reference.8) The temperatures calcu-lated by the mathematical model are compared with themeasured temperatures, gas volumes from multiple tuyeresare determined in order to reduce the error between thesetwo values. Thus, the gas volumes from multiple tuyeresare calculated. The SQP method is used to estimate temper-ature distribution. Descriptions of the mathematical modelare written in an appendix.
Next, control part is processed. Operations of a furnacein order to conform estimated temperature distribution of areactor furnace to the desired temperature distribution mustbe determined. Here, temperature distribution in a reactorfurnace is operated by gas flow from multiple tuyeres at afurnace bottom and supplying material from the top of afurnace. The SQP method is also used to control tempera-ture distribution. By SQP method, each objective functionfor the estimation and the control is minimized. These ob-jective functions are designed differently for the estimate-tion and the control of inner furnace temperature.
2.1. Estimation of Inner Furnace Temperature Distri-bution
Since the central part of a reactor furnace is at high tem-perature and pressure, it is difficult to measure the tempera-ture of central part. Actually, only the temperatures of outerside in a reactor furnace can be measured. In this research,the inner temperature distribution of a reactor furnace is es-timated by using only measured data.9) In other words, cal-culated temperature distribution in a reactor furnace willconform to the measured temperature distribution whenvalues of calculated temperature at the same positions con-form to the measured data. The SQP method is applied asthe way for conforming data.
Here, positions of the instrumentation are shown in Fig.2. Instrumentations are set up along the wall of reactor fur-nace. Thermometers and pressure meters are set up at theinner side wall of a reactor furnace, and gas flow meters are
set up at the top of a reactor furnace as shown in the figure. Here, this estimation problem is formulated in the fol-
lowing. Decision variables are gas volumes blowing frominlet zones #1 to #4. When these values are decided, tem-perature distribution in reactor furnace can be calculatedusing a simulator. In the estimation, the objective functionis defined by Eq. (1), that is the weighted sum of the differ-ences in estimated values of temperature, pressure and gasflow from its measured values. The value of f in Eq. (1) isto be minimized. In this problem, constraints are the upperand lower limit of gas volume and the equation for totalquantity of gas and are written in Eqs. (2) to (4).
...........................................(1)subject to
c1h (u)�umax�uh�0 ...........................(2)
c2h (u)�uh�umin�0 ...........................(3)
...........(4)
where, Ts, P and Vare the estimated value of solid tempera-tures, pressures and gas flows, respectively. u, umin and umax
mean gas flow, lower limit of gas flow and upper limit ofgas flow, respectively. And, Ts, P and V are the measuredvalues of solid temperature, furnace pressure and gas flowvolume, respectively. a t, ap and av are weighting factors.mt, mp and mv are number of instrumentation for tempera-
c u u C Ch
h
3
1
4
0( ) , ( :� � ��
constant)∑
f T T P Pm m m
� � � � � �α α αt s s p v
t p v
(( ˆ ) ( ˆ ) ˆ )2 2 2∑ ∑ ∑ V V
ISIJ International, Vol. 45 (2005), No. 3
© 2005 ISIJ 348
Fig. 1. Control method of temperature distribution in a reactor furnace.
Fig. 2. Instrumentations.
ture, pressure and gas flow volume, respectively. Parameterh shows number of inlet zone.
2.2. Determination of Control Variables
Temperature distribution in reactor furnace can be con-trolled by gas volume of tuyeres at the furnace bottom andsupplying materials from the furnace top.10) In this paper, atemperature control system consists of the furnace modeland the SQP method. To begin with, the estimated tempera-ture distribution in a reactor furnace at a certain time iscompared with the desired temperature distribution. Then,gas volumes and size of supplying materials in the next in-terval is decided to minimize the temperature differences.To know the differences, the furnace simulation by apply-ing the given gas volumes is executed. Iterating the proce-dure, the temperature distribution at the next interval is cal-culated. Operating conditions of a reactor furnace is deter-mined by these iterative calculations.
Here, the control problem is formulated in the following.Decision variables are gas volumes in inlet zones #1 to #4at the bottom of a furnace and supplying materials sizefrom material entrance slots #1 and #2 at the top of a fur-nace at each time interval. The objective function for thetemperature distribution control is defined by Eq. (5), thatis the sum of the squares of temperature’s differences, andthe constraint of gas volume variations. Constraints are theupper and lower limit of gas volumes, the equation for totalvolume of gases and the upper and lower limit of supplyingmaterials size. These constraints are written in Eqs. (6) to(10). Here, l in Eqs. (5) to (10) means a sampling time ofcontrol. The control interval is set at 20 h which is 100times of a time step in a furnace simulator.
.............(5)
subject to
c1h(l) (u)�umax�uh
(l) �0..........................(6)
c2h(l) (u)�uh
(l)�umin�0, (h�1, 2, 3, 4) ..............(7)
.......................(8)
c4h(l) (u)�Dsmax�Dsh
(l) �0 .......................(9)
c5h(l) (u)�Dsh
(l)�Dsmin�0, (h�1, 2) .............(10)
Td: Desired temperature distribution, w1, w2: Weightingfactor, a: Constant, Ds: Supplying materials size, Dsmax:Upper limit of materials size, Dsmin: Lower limit of mate-rials size, h : Materials entrance slot, l : Time interval
Here, values of coefficients w1, w2 and a are set at 10�4, 100and 1 which are empirically determined to equalize dimen-sions of each factor in Eq. (5).
3. Optimization Algorithm by SQP Method
In this research, the SQP method is used for the estima-tion and the control of temperature distribution. The SQP
method is one of the effective methods for nonlinear pro-gramming problems. In the following, an optimization al-gorithm using the SQP method is described.
3.1. About SQP Method
Here, computing procedures of the SQP method is de-scribed.1. The initial solution x (0), Hessian approximation B (0)
and the penalty parameter r�0 are are set up. Andk�0.
2. A quadratic programming problem is defined by theobjective function and constrained conditions. When itis solved, d (k)�x(k�1)�x (k) and Lagrange multiplieru(k�1) are determined.
..............(11)
c(x (k))�∇c (x (k))Td�0 .......................(12)
3. The penalty parameter is updated. Here, s�0.
.....(13)
4. A linear search is done, step width t (k)�0 is searchedand x (k�1)�x (k)�t (k)d (k).
5. Hessian approximation B is updated by BFGS algo-rithm.
.........................................(14)
s (k)�x(k�1)�x (k) ............................(15)
y(k)�∇(k�1)�∇L(k)...........................(16)
......(17)
y (k)�q yk�(1�q)B (k)s (k)......................(18)
Here, ∇L�∇f�S Mi�1 ui∇c.
6. When convergence conditions is fulfilled, this calcula-tion is finished. Otherwise k�k�1 and it returns to 2.
3.2. Estimation of Temperature Distribution by SQPMethod
In actual blast furnaces, it is impossible to measure tem-peratures in a reactor furnace except in the outer side ofthem. Because of the above situation, we constructed theestimation system using limited number of instrumenta-tions. The method of the estimation system is shown in Fig.3. The estimation is constructed by the measured data inlimited instrumentations.
At the beginning, the initial solution and several distribu-tions are set up as the initial conditions. Gas volumes ofeach tuyere is decided by the SQP method as the result ofthe model conforms to measured data at the same position.When sought gas volumes is applied to the model of a reac-
θ �
�
�
1 0 20 8
, ( ) . ( ). ( )
( ) ( ),
( ) ( ) ( ) ( ) ( )
( ) ( ) ( )
( ) ( ) ( ) ( ) ( )
if
else
T T
T
T T
s y s B ss B s
s B s s y
k k k k k
k k k
k k k k k
B By y
y s
B s s B
s B sk k
k k
k k
k k k k
k k k( ) ( )
( ) ( )
( ) ( )
( ) ( ) ( ) ( )
( ) ( ) ( )
˜ ( ˜ )
( ˜ )
( )
( )� � � �1
T
T
T
T
r
u i m
r u i m
r
ik
ik�
� �
� �
�max
if max
else
{| |: , , , } ,
{| |: , , , }
,
( )
( )
1 1 2
1 2
L
L
σ
∇ →f x d d B dk k( )( ) ( )T T min�1
2
c u u Clhl
h
3
1
4
0( ) ( )( )� � ��
∑
� � ��w u u ahl
hl
21 0max{| | , }( ) ( )
f w T i j T i jl l
ji
( ) ( )( ( , ) ˆ ( , ))� ���
12
1
12
1
21
d s∑∑
ISIJ International, Vol. 45 (2005), No. 3
349 © 2005 ISIJ

tor furnace, inner furnace temperature distribution is esti-mated. Then, the estimated value is compared with mea-sured data. When the value of the objective function be-comes to minimum, the iteration is finished. Otherwise, thisprocedure is iterated.
3.3. Decision of Operation Conditions by SQP Method
The SQP method is used to decide gas volumes. Here,the dynamic optimization algorithm to decide gas volumesby the SQP method is shown in Fig. 4.
To begin with, initial values of gas volume, a gas flow,each temperature distributions and a material charge condi-tion are set. Then, gas volumes and supplying materials sizefor the next interval is decided by the SQP method. Here,the time interval is defined to be plural time steps of simu-lator. Decided gas volumes and supplying materials size areapplied to a reactor furnace model. This results in thechange of the temperature distribution in a reactor furnaceand is compared with the desired temperature distribution.When the difference between calculated the temperaturedistribution and the desired one becomes smaller than tendegrees centigrade, the calculation is finished. Otherwise,this procedure is iterated. Here, the time step in a furnacesimulator is set at 12 min and the sampling time is set as100 times of the time step in a furnace simulation. Thus,the time of control interval is set at 20 h in our paper.
4. Simulation of Temperature Distribution in ReactorFurnace
4.1. Two-dimensional Model
This paper uses Macro-Model that calculates two-dimen-sional macro gas flow and temperature distribution usingcontrol factors, such as gas flow and materials size as theboundary conditions of the calculation. Nodes assignmentfor the two-dimensional model is shown in Fig. 5.
x axis of the model is the furnace width and y axis is thefurnace height respectively. In a blast furnace, the furnaceheight is about twice of the diameter. So, the number ofnodes in x direction is set 12 and that in y direction is set 21as shown in Fig. 5. Here, 1 node is equivalent to 2 m. Thereare 4 tuyeres in the bottom of this model and a high-tem-perature gas is discharged from it. Besides, a material sup-plying zone consist of 15 nodes as shown in Fig. 6. Asshown here, materials are supplied around a reactor furnacewall.
4.2. Solution Procedure for Simulation
The temperature distribution in a reactor furnace is cal-culated by solving the gas flow equation, the gas tempera-ture equation and the solid temperature equation. In thispaper, finite-difference approximation method is used tocalculate the gas flow and the temperature distribution. Theflow chart of the calculation is shown in Fig. 7.
When input values such as gas volumes of each tuyeresand supplying materials size are given, the temperature dis-tribution in a reactor furnace is calculated. These calcula-tions are continued until the convergence condition is ful-filled. The convergence condition is described in Eq. (19).Here, n is the number of time step in the furnace simulatorand set 12 min. T is the maximum value of time step.
......(19)
Here, s and t are set at 0.5 and 100 respectively.
max andi j
sn
snT i j T i j n
,| ( , ) ( , ) |� � � �1 σ τ
ISIJ International, Vol. 45 (2005), No. 3
© 2005 ISIJ 350
Fig. 3. Flow chart of estimation. Fig. 4. Flow chart of control.
Fig. 5. Two-dimensional model.
Fig. 6. Positions of supplying materials.

4.3. Numerical Simulation of Gas Flow and Tempera-ture
The temperature distribution in a reactor furnace is cal-culated by the method stated above. Gas volumes of all tuy-eres is set at 2 units and a gas temperature is set at 1 200 de-grees centigrade and supplying materials size is 0.045 m indiameter.
In the following, simulation results are shown. In Fig.8(a), the gas volume distribution is shown and in Fig. 8(b),the solid temperature distribution is shown.
The gas flows from tuyeres at the bottom to a dischargeequipment at the furnace top. The solid temperature is max-imum at the center of a reactor furnace, and is gradually de-creased toward the furnace wall.
5. Numerical Experiment of SQP Application
In Fig. 9, the flow chart of the estimation and the controlis shown. In the estimation, the furnace model is used in theloop of a SQP method. Until the temperature distribution in
a reactor furnace becomes a steady state, calculation by thefurnace model are continued. In the control, the furnacemodel is used in the loop of a SQP optimization.Calculations for one sampling time of control are carriedout by the farnace model. Using the results, the temperaturedistribution is calculated and saved for the next control in-terval.
5.1. Estimation of Temperature Distribution
The estimation of temperature distribution in a reactorfurnace is calculated by the method shown in Fig. 3 of theSec. 3.2. Measured data of actual furnace the numerical ex-periments are shown in Table 1. These data are measured atnodes shown in Fig. 2. Temperatures, pressures and gasflows are measured at ten, eight and two points around afurnace. Here, the gas flow is given by vector value. Usingthis data, the temperature distribution in a reactor furnace isestimated.
In the following, simulation results are shown. Figure10(a) shows the transition of objective function and Fig.10(b) shows the transitions of gas blow which are the con-trol variables. In Fig. 10(c), estimated the temperature dis-tribution is shown. The temperature difference of estimatedone and desired one is shown in Fig. 10(d).
As shown here, the value of the objective function de-creases with iterations. After 23 times iterations, it con-verges at 9.6. When the transition of gas flow is seen, thegas volume from tuyere #4 becomes larger than others.Herewith, the estimated temperature distribution is high inthe right of a center of a furnace. As for the difference ofthe estimated and the measured temperature, estimated oneis equated to measured one at almost all nodes. The maxi-mum difference is 7.2 degrees centigrade at the center of a
ISIJ International, Vol. 45 (2005), No. 3
351 © 2005 ISIJ
Fig. 7. Flow chart of simulation.
Fig. 8. Results of furnace simulation. Fig. 9. Flow chart of estimation and control simulation.
Table 1. Measured data of instrumentations.

reactor furnace. Temperature differences of the left side be-come larger than the right side. Near the position of instru-mentations, the temperature difference is small and as it ispulled away from instrumentations, the temperature differ-ence becomes large.
5.2. Control of Temperature Distribution
The control of temperature distribution in a reactor fur-nace is calculated by the method shown in Fig. 4. The ini-tial temperature distribution and the desired temperaturedistribution are shown in Figs. 11 and 12 respectively.
The temperature distribution in a reactor furnace is con-trolled so as to attain the desired temperature distributionby changing supply values the operation of gas volumesfrom each tuyeres and materials from top of a furnace.
In the following, simulation results are shown. The tran-sition of objective function, the transitions of gas blowwhich is control variables and the transitions of supplyingmaterial size which is control variables are shown in Figs.13(a), 13(b) and 13(c) respectively. In Fig. 13(d), the opti-mized temperature distribution is shown. In Fig. 13(e), thetemperature difference between the desired and the opti-mized temperature distribution is shown.
As for the transition of gas flow from tuyeres, gas vol-umes from tuyere #1 and #4 decrease slightly and themfrom tuyere #2 and #3 increase slightly in early time. Then,gas volumes from tuyere #1 and #4 increase slightly andthem from tuyere #2 and #3 decrease slightly. When gasvolume from tuyere #1 and them from tuyere #4 are com-pared, gas volume from tuyere #4 become more than itfrom tuyere #1. Finally, gas volumes of all tuyeres becomeabout 2 units. When the transition of supplying material
size is seen, both sides of material size become large inearly time. As time passes, the material size reduces from0.067 meters to 0.047 m at both sides. The objective func-tion decreases at every iterations. The temperature differ-ence between the desired and the optimized temperaturedistribution is 6.5 degrees centigrade at the maximum.
ISIJ International, Vol. 45 (2005), No. 3
© 2005 ISIJ 352
Fig. 12. Desired temperatures distribution.
Fig. 10. Results of estimation.
Fig. 11. Initial temperatures distribution.

Transitions in furnace solid temperatures during control atfour nodes are shown in Fig. 14. As shown in the figure,temperatures at these nodes are regulated to their desiredvalues after 40 h.
Furthermore, the result to have been controlled not tem-peratures of all nodes to be obtained by the estimated tem-perature distribution in a reactor furnace but measured tem-peratures are shown at the following. This objective func-tion is described at Eq. (20). The change of Eq. (20) fromEq. (5) is the number of positions evaluated temperature.
........(20)
In the following, simulation results are shown.
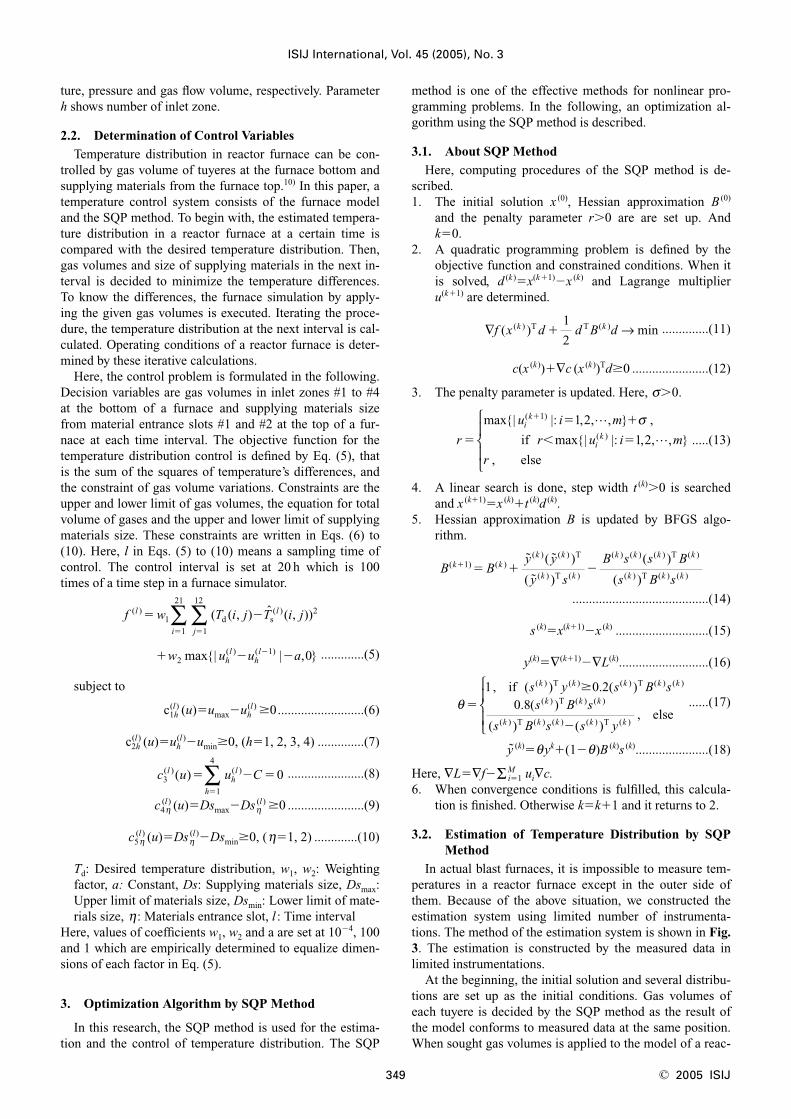
Simulation conditions are the same as the above. The tran-sition of objective function, the transitions of gas blowwhich is control variables and the transitions of supplyingmaterial size which is control variables are shown in Fig.15(a), 15(b) and 15(c) respectively. In Fig. 15(d), the opti-mized temperature distribution is shown. In Fig. 15(e), thetemperature difference between the desired and the opti-mized temperature distribution is shown.
As in Fig. 15(a) the calculation was not able to fulfillconvergence conditions until 20 times iterations. Seeingfrom Figs. 11 and 12, Temperature in a reactor furnace ishigher than the desired temperature in the early stages. Asin Fig. 15(b), gas volume from tuyere #1 and #4 set at nearinstrumentation points is reduced so as to decrease furnaceheat. As shown in Fig. 15(c), the supplying material sizebecomes large for the same purpose. After three iterations,
� � ��w u u ahl
hl
21 0max{| | , }( ) ( )
f w T i j T i jl l
m
( ) ( )( ( , ) ˆ ( , ))� �12
d s
t
∑
ISIJ International, Vol. 45 (2005), No. 3
353 © 2005 ISIJ
Fig. 13. Results of control.
Fig. 14. Transition in temperatures at 4 nodes.
the temperature difference decreases. However, because ofthe large time delay in heat transfer phenomenon, the innertemperature decreases too much. Then, gas volumes fromtuyere #1 and #4 rise and supplying materials size becomessmall in order to raise the furnace heat. In the process, gasvolumes from tuyere #2 and #3 are decreasing and the tem-perature of the central part of a reactor furnace becomessmaller than the desired temperature. Therefore, as shownin Fig. 15(e), the value of temperature difference is thelargest at the central part and is 91.4 degrees centigrade.Further, as shown in Fig. 15(d), the temperature in the cen-tral part of a furnace differs from its desired value.
As the results, it is verified that the estimation of temper-ature distribution is needed in order to control the tempera-ture distribution in wide area of a reactor furnace.
6. Conclusion
In this paper, methods for estimating the inner furnacetemperature distribution and for controlling gas blown frommultiple tuyeres and supplying material to achieve the de-sired temperature distribution are proposed. For these pur-poses, the SQP method which is an effective method insolving nonlinear programming problem is used both to es-timate the temperature distribution in a reactor furnace andto determine the control variables. Through numerical ex-periment, it has been confirmed that temperature distribu-tion in a furnace can be estimated, even if there are somegaps in measured data. Furthermore, control variables suchas gas volume and the supply of the material for achievingdesired temperature distribution can be determined. Time-optimal control of temperature distribution in a reactor fur-nace will be left for a future study.
REFERENCES
1) S. Ergun: Chem. Eng. Prog., 48 (1952), 89.2) M. Kawakami, K. Murayama, M. Shibata, T. Takenaka and H. Toda:
Tetsu-to-Hagané, 87 (2001), 45.3) S. Watakabe and K. Takeda: Tetsu-to-Hagané, 87 (2001), 467.4) A. Kasai, K. Miyagawa, T. Kamijo, J. Kiguchi and M. Shimizu:
Tetsu-to-Hagané, 83 (1997), 239.5) M. Konishi, S. Tamura, Y. Otsuka, R. Hori and R. Ono: Kobe Steel
Eng. Rep., 37 (1987), 3.6) K. Takatani, Y. Ujisawa and T. Inada: Modeling and Control of
Large-scale Complex Process with Reactions, ISIJ, Tokyo, (1996),27.
7) K. Tsumura: Modeling and Control of Large-scale Complex Processwith Reactions, ISIJ, Tokyo, (1996), 33.
8) T. Shibuta, M. Konishi, J. Imai and T. Nishi: CAMP-ISIJ, 15 (2002),925.
9) K. Ishimaru, M. Konishi, J. Imai and T. Nishi: CAMP-ISIJ, 17(2004), 174.
10) K. Ishimaru, M. Konishi, J. Imai and T. Nishi: Proc. of 46th JACC,ISCIE, Kyoto, (2003), 54.
Appendix. Mathematical Models
The following is described about the mathematical equa-tion applied to the furnace model.
Gas Flow Model
In gas flow, heat is conveyed with movement of fluid. Inother words, when fluid flow is rapid, a lot of heat is con-veyed along the direction. Since the same condition holdsfor the inside of reactor furnace, gas flow from tuyeres re-veals much effect on the dispersion of heat. Here, the math-ematical model to find the gas flow distribution is ex-plained.
Ergun equation accompanying flow stress is adopted asthe equation to find the gas flow distribution. This is de-scribed in Eq. (A-1).
ISIJ International, Vol. 45 (2005), No. 3
© 2005 ISIJ 354
Fig. 15. Results of control without estimation.

......(A-1)
Where, V is velocity of gas flow, p is pressure, Re isReynolds number, f1 and f2 are coefficients of Ergun equa-tion.
...(A-2)
e : Fractional void volume, r : Density of gas, m : Absoluteviscosity of gas, Dp: Diameter of material particle
Temperature Model
We think of gas and solid layer to find the results of innertemperature distribution in reactor furnace. Equation to findthe gas temperature distribution in reactor furnace is de-scribed by Eq. (A-3).
........(A-3)
Where, Tg is gas temperature, Ts is solid temperature, lg isgas thermal conductivity and h is heat transfer coefficientbetween gas and solid. Equation (A-3) is made or describedbased on the relation for heat conduction adding heat ad-vection in the first term of right-hand side and the heattransfer between solid and gas in the third term of right-hand side respectively.
Equation for the solid temperature distribution in reactor
furnace is described by Eq. (A-4).
.............(A-4)
Where, l s is solid thermal conductivity, Q is heat of rawmaterial by reaction and k is reactivity coefficient. Equation(A-4) is made based on equation of heat conduction, too.Moreover, Eq. (A-4) is additively made the heat of raw ma-terial in the second term of right-hand side and the heattransfer between solid and gas in the third term of right-hand side respectively.
Parameters for Equations
Generally, reaction of raw material starts with high tem-perature therefore reactivity coefficient k is enlarged in hightemperature. However, iron ores in raw material are dis-solved at about 1 300 to 1 400 degrees C and it is reduced topig-iron. This reactivity coefficient k is defined by Eq. (A-5). It is associated with material size and temperature in areactor furnace.
..............(A-5)
...............(A-6)
R: Gas constant, E: Activity energy, a, b, g : Constant
kT
��� �
1
1 1700exp g{( ) / }γ
kD
E
R TVk� � �
αβ
p g
exp⋅⋅
⋅
∂∂
⋅T
tT k Q h T Ts
s s g s� � � �λ ∆ ( )
∂∂
⋅∇T
tV T T h T Tg
g g g g s�� � � �( ) ( )λ ∆
fD
fD1
2
3 2 3150
11 75
1�
��
�( ), .
εε
µ εε
µ
p2
p
∂∂
∇V
tp f f V V V�� � � �2
11 2( | |)
Re∆
ISIJ International, Vol. 45 (2005), No. 3
355 © 2005 ISIJ