application of soft computing techniques for shallow
TRANSCRIPT

This document is downloaded from DR‑NTU (https://dr.ntu.edu.sg)Nanyang Technological University, Singapore.
Application of soft computing techniques forshallow foundation reliability in geotechnicalengineering
Ray, Rahul; Kumar, Deepak; Samui, Pijush; Roy, Lal Bahadur; Goh, Anthony Teck Chee;Zhang, Wengang
2020
Ray, R., Kumar, D., Samui, P., Roy, L. B., Goh, A. T. C. & Zhang, W. (2020). Application ofsoft computing techniques for shallow foundation reliability in geotechnical engineering.Geoscience Frontiers, 12(1), 375‑383. https://dx.doi.org/10.1016/j.gsf.2020.05.003
https://hdl.handle.net/10356/146966
https://doi.org/10.1016/j.gsf.2020.05.003
© 2020 China University of Geosciences (Beijing) and Peking University. Production andhosting by Elsevier B. V. This is an open access article under the CC BY‑NC‑ND license(http://creativecommons.org/licenses/by‑nc‑nd/4.0/).
Downloaded on 23 Jan 2022 08:13:30 SGT

Geoscience Frontiers 12 (2021) 375–383
HOSTED BY Contents lists available at ScienceDirect
Geoscience Frontiers
journal homepage: www.elsevier.com/locate/gsf
Research Paper
Application of soft computing techniques for shallow foundation reliabilityin geotechnical engineering
Rahul Ray a, Deepak Kumar a, Pijush Samui a, Lal Bahadur Roy a, A.T.C. Goh b, Wengang Zhang c,*
a Department of Civil Engineering, National Institute of Technology Patna, Patna, Bihar, Indiab School of Civil and Environmental Engineering, Nanyang Technological University, Singaporec School of Civil Engineering, Chongqing University, Chongqing, 400044, China
A R T I C L E I N F O
Keywords:Reliability analysisMPMRANN-PSOANFIS-PSOAnderson-Darling testMann-Whitney test
* Corresponding author.E-mail addresses: [email protected] (
ntu.edu.sg (A.T.C. Goh), [email protected] (W.Peer-review under responsibility of China Univ
https://doi.org/10.1016/j.gsf.2020.05.003Received 13 September 2019; Received in revisedAvailable online 19 May 20201674-9871/© 2020 China University of GeoscienceCC BY-NC-ND license (http://creativecommons.org/licenses/by-nc-nd/4.0/).
A B S T R A C T
This research focuses on the application of three soft computing techniques including Minimax Probability Ma-chine Regression (MPMR), Particle Swarm Optimization based Artificial Neural Network (ANN-PSO) and ParticleSwarm Optimization based Adaptive Network Fuzzy Inference System (ANFIS-PSO) to study the shallow foun-dation reliability based on settlement criteria. Soil is a heterogeneous medium and the involvement of its attri-butes for geotechnical behaviour in soil-foundation system makes the prediction of settlement of shallow acomplex engineering problem. This study explores the feasibility of soft computing techniques against thedeterministic approach. The settlement of shallow foundation depends on the parameters γ (unit weight), e0 (voidratio) and CC (compression index). These soil parameters are taken as input variables while the settlement ofshallow foundation as output. To assess the performance of models, different performance indices i.e. RMSE, VAF,R2, Bias Factor, MAPE, LMI, U95, RSR, NS, RPD, etc. were used. From the analysis of results, it was found thatMPMR model outperformed PSO-ANFIS and PSO-ANN. Therefore, MPMR can be used as a reliable soft computingtechnique for non-linear problems for settlement of shallow foundations on soils.
1. Introduction
Soil is a heterogeneous medium and is of a complex nature. Thevariation in its parameters of soil due to this complexity and uncertaintyis inevitable. Due to the intrinsic randomness of soil formation process,the significant inherent uncertainty in the soil properties depends uponthe site condition. Hence, to construct any structure on the soil, all thevariations in its properties need to be considered. Shallow foundationsare common structures that are constructed on the ground surface andthrough which the load of structures is transmitted to the ground. Thedesign process of shallow foundations mainly depends upon the foun-dation settlement and soil bearing capacity. Besides, shallow foundationdesign is more controlled by settlement rather than by the bearing ca-pacity (Schmertmann, 1970).
In the conventional design of shallow foundation constructed oncohesive soil, empirical formulae based on settlement criteria andallowable bearing capacity are commonly used. To find the allowablebearing capacity of the shallow foundation, the ultimate bearing capacity
R. Ray), [email protected] (Zhang).ersity of Geosciences (Beijing).
form 1 March 2020; Accepted 6 M
s (Beijing) and Peking University.
is to be divided by factor of safety. Moreover, to calculate the settlementof the footing, the factor of safety approach is widely used as it is simpleand direct to relate with the settlement. However, it does not take intoconsideration the uncertainties of the parameters affecting the soilproperties (Duncan, 2000; Whitman and Robert, 2000; Schweiger et al.,2001; Zhang and Goh, 2012; Wang et al., 2020a). Phoon (2002) showedthat the error in testing and the variation in soil deposits lead to thevariability in the test data. Reliability analysis has been carried out totake into account the variations in soil properties where input parametersare taken as random variables, and the effects of the input parameters onoutputs are analyzed by different models. Various researchers have donetheir research work using the probabilistic approach, using either stan-dard penetration test data or consolidation test data to develop modelsusing probabilistic concepts for the prediction of the total settlement(Krizek et al., 1977). The use of an effective frictional angle solution waslater proposed for the ultimate bearing capacity for a shallow foundationfooting on the cohesionless soil using a probabilistic approach (Cher-ubini, 1990, 2000). Easa (1992) used two variables (effective frictional
D. Kumar), [email protected] (P. Samui), [email protected] (L.B. Roy), ctcgoh@
ay 2020
Production and hosting by Elsevier B.V. This is an open access article under the

Fig. 1. A typical Artificial Neural Network (ANN) architecture.
R. Ray et al. Geoscience Frontiers 12 (2021) 375–383
angle and soil unit weight) to give a probabilistic solution to calculatebearing capacity of shallow foundation placed on cohesionless soil andshowed that unit weight variation also has a significant effect on thebearing capacity of shallow foundation.
Many researchers conducted reliability analysis using differentmethods. Babu and Srivastava (2007) used the response surface method(RSM) to form an approximate polynomial function using a valid range ofsoil parameters as an input for the calculation of settlement and thebearing capacity. Shahin et al. (2003) described two types of modelling(multi-layer perceptron (MLPs) and B-spline Neuro-fuzzy networks) andapplied for shallow foundation settlement prediction on granular soil.Karimi (2003) used the Neuro-fuzzy models ANFIS and FAM to study theresponse of a valley filled with sediment. Hasanipanah et al. (2016)predicted the maximum surface settlement using the PSO-ANN modelcaused by tunneling, which showed that ANN optimized by PSO couldpredict maximum surface settlement with high accuracy compared toANN. Tarawneh (2016) found that ANN is of high accuracy (R2 ¼ 0.95,MAE ¼ 2.88) in the prediction of N60- value by utilization CPT data viaback–propagation neural network (BPNN). Chen et al. (2018) usedPSO-ANN modeling technique to predict the shear strength of RCC wallsand the model showed high prediction accuracy. Singh (2017) forecastedthe Indian summer monsoon rainfall (ISMR) on a monthly basis usingthree techniques i.e., fuzzy rules, entropy and ANN. Artificial neuralnetwork–analytic hierarchy process (ANN–AHP) model was used by Jenaet al. (2019) to do the mapping of earthquake risk assessment (ERA) inAceh province, Indonesia which shows that ANN is very useful in theprobabilistic assessment of earthquake with very low value of RMSE.Kong et al. (2009) had done wireless traffic forecasting using MPMRmodel, showing that MPMR is of higher accuracy and less error incomparison to the SVM model. Shahnazar et al. (2017) developed anapproach to predict the ground vibration by the use of the PSO-ANFISmodel, results showing that PSO-ANFIS is of high accuracy in compari-son with ANFIS model. Other machine learning techniques as well as thereliability analysis performed can be referred to recent literatures (Gohand Zhang, 2014; Zhang et al., 2015, 2018, 2019a; Goh et al., 2017,2018, 2019; Zhang and Goh, 2018; Chen et al., 2019; Wang et al., 2019,2020b; Shahrour and Zhang, 2020). After extensive critical literaturereview, the authors found that in either conventional deterministic orprobabilistic analysis, the variations in the soil parameters are not welltaken into consideration. Therefore, the main purpose of the presentstudy is to perform a reliability analysis of shallow foundation based onsettlement criteria using three soft computing models MPMR, PSO-ANNand PSO-ANFIS. Besides, all three models MPMR, PSO-ANN, andPSO-ANFIS are also tested for reliability analysis of shallow foundation.
2. Theoretical background of models
2.1. Minimax Probability Machine Regression (MPMR)
MPMR (Strohmann and Grudic, 2002) is a regressive modelingtechnique that is based on Minimax Probability Machine RegressionClassification (MPMC) (Lanckriet et al., 2002). MPMC is firstly used forlinear classification to maximize the minimum probability of correctclassification of the future data with minimum probability, and it isfurther used as a non-linear classifier by the use of Mercer kernels.
In this paper, MPMR is used for the estimation of the shallow foun-dation settlement on cohesive soil. To perform the regression analysis,MPMR is used in the following structure:
z¼XNi¼1
αiKðxi; xÞ þ b (1)
Where z is output, x is input, N is number of datasets, Kðxi; xÞ is kernelfunction, αi and b are output of MPMR algorithm. In this study, γ, e, CC isused as input of MPMR and shallow foundation settlement on cohesivesoil is used as output of MPMR. So, x ¼ [γ, e, CC] and z ¼ [settlement].
376
By constructing a dichotomy classifier, MPMR is developed byStrohmann and Grudic (2002). The constructed classifier separates twosets of points: one of the dataset is taken by shift of all the regression dataþε along the axis of output variable and the other dataset is obtained bythe shift of all of the regression data þε along the output variable axis.The separating surface between these two classes is defined as theregression surface. MPMR model is developed for prediction of the set-tlement of shallow foundation on cohesive soil, dividing the dataset intotwo parts i.e., training and testing datasets. The training dataset is used todevelop MPMR model (it contains 70 dataset) and the testing dataset (itcontains 30 dataset) is used for verifying MPMR model. The data-setdatasets are normalized to be used in model development. MPMRmodel is developed by using MATLAB 2015.
2.2. PSO-ANN hybridization
2.2.1. Particle Swarm Optimization (PSO)PSO is a computational method, which is based on a population
search algorithm. In this algorithm, particles are grouped into swarms,and each particle represents a candidate solution to the optimizationproblem in the swarm. In the PSO algorithm, search space withincandidate particles for the solution to the N-dimensional problem isallocated with random velocities and positions. By this, the objectivefunction of each particle is calculated. Based on estimation results withthe best level, each particle is called the individually best position (Pbest),and among all the particles, the best level called the globally best position(Gbest) is evaluated. Now in the search space of the problem, movement ofparticles and each particle next position can be found by the combinationof individual best position (Pbest) and best position globally (Gbest). By aseries number of iterations, the particles become closer to the optimumfitness function.
The starting population of size M and dimension S is denoted as Y ¼[Y1, Y2, …, YM]T, where T is the transpose operator. Each particle Yn isrepresented as Yp ¼ [Yp,1, Yp,2,…, Yp,S]. The initial velocity of populationis V ¼ [V1, V2, V3, …, Vp] and each velocity is represented as Vp ¼ [Vp,1,Vp,2, …, Vp,S], where p varies from 1 to M.
Vlþ1p;q ¼w�Vl
p;q þ c1r1�Pbest
lp;q � Yl
p;q
�þ c2r2
�Gbest
lq � Yl
p;q
�(2)
Ylþ1p;q ¼Yl
p;q þ Vlþ1p;q (3)
In the equation above, Pbestlp;q denotes the personal best of the qth part
of pth individually, whereas Gbestlq denotes qth part of the best individual
of population up to iteration l. The Pbest and Gbest for each particle arecalculated and updated as:
At iteration l

R. Ray et al. Geoscience Frontiers 12 (2021) 375–383
If f Ylþ1p < f Pbest
lþ1p then Pbest
lþ1p ¼ Ylþ1
p else Pbestlþ1p ¼Pbest
lp (4)
� � � �
If f�Ylþ1p
�< f
�Gbest
l�then Gbest
lþ1 ¼Ylþ1p else Gbest
lþ1 ¼ Gbestl (5)
PSO has been explained in many literatures (Eberhart and Kennedy,1995; Clerc and Kennedy, 2002; Alam et al., 2015; Wang and Ma, 2017).
2.2.2. Artificial neural network (ANN)ANN is like a black box model relating the output to the influential
input factors. An ANN consists of neurons that are connected throughweights and biases. A conventional ANN network consists of three layers,which are input, hidden and output layers. The input layer is free fromneurons while the hidden layer and output layers are associated withneurons. The outline of the ANNmodel is shown in Fig. 1, showing that mno. of inputs is used to produce a single output. wij denotes the weights ofneuron connection of ith input node and jth neuron in the hidden layers,whereas bj is the bias associated with jth neuron in the hidden layers, wjis the weights of neuron connecting jth neuron in hidden with a singleneuron in the output.
ANN model is trained with known input sets and the correspondingoutput sets utilized to get the weights and biases of the neurons.Training of the network is done to get the best suitable values of variousweights and biases. Various techniques are available to find the opti-mum values of weights and biases (Zhang and Goh, 2013, 2016; Zhanget al., 2019b, 2020a, b). In this study, optimum training of the networkhas been done through PSO using MATLAB. Once the network is trainedproperly using a training dataset, the testing dataset is used to test thenetwork.
2.3. Adaptive Neuro-fuzzy inference system (ANFIS)
Conventional methods for solving various problems related to civilengineering are not suitable for solving uncertainty and also not clearlydefined. For these types of systems machine learning is very helpful inanalysis. Machine learning technique consists of various systems ofmethods which are grouped as Fuzzy logic, network-based and geneticalgorithm. Fuzzy logic has the advantage of taking into account thevarious uncertainties of real-world systems by using the if-then fuzzyrule, while the advantages of neural network include its self-adaptabilitynature and learning ability. Fuzzy systems and neural networks arecombined in order to take advantage of both the systems and form ahybrid system, called the Adaptive Network-based Fuzzy Inference Sys-tem (ANFIS) (Jang, 1993).
2.3.1. Fuzzy If-Then rulesFuzzy rules operate in the form of “IF M THEN N00, where M and N are
called as labels which are amalgamated with membership function(Zadeh, 1965). Fuzzy rules play a very important rule in decision makingwhen a system consists of uncertainties and ill-defined systems.
Example: If the temperature is high, then pressure is high.wheretemperature and pressure are linguistic variables (Zadeh, 1973), lin-guistic value or labels that are associated with membership functions ishigh.
Fig. 2. A sketch diagram
377
2.3.2. Adaptive networksAn adaptive network is a network structure formed by nodes and
directional links used to connect these nodes (Fig. 2). These nodes areadaptive, i.e., their outputs are dependent on the parameter linked withthese nodes. The learning rule (Werbos, 1974) of the network minimizeserrors by making changes to these parameters.
3. Model development
In this study, the settlement of a shallow foundation is calculatedbased on the primary consolidation settlement equation (Eq. (6)) (Arora,2004).
ΔH¼Ho�Cc ��
11þ eo
�� log10
�σ0 þ Δσ
σ0
�(6)
where
ΔH ¼ settlement of the foundationHo ¼ initial thickness of compressible layerCc ¼ compression indexe0 ¼ void ratioσ0 ¼ initial effective overburden pressureΔσ ¼ increase in effective stress at the center of compressible layer
The settlement of shallow foundation depends on the parameters γ(unit weight), e0 (void ratio) and Cc (compression index). These soilparameters are taken as input variables and settlement of shallow foun-dation as output. From the permissible ranges of γ, e0 and Cc, 100 datasets are generated and the corresponding 100 data sets for settlement aredetermined. These data set values are normalized by using Eq. (7).
Xnor ¼ X � Xmin:
Xmax: � Xmin:(7)
where
Xnor ¼ normalized value.X ¼ particular value of that parameter.Xmin: ¼ minimum value.Xmax: ¼ maximum value.
The normalized values of data set are divided into 70% and 30%observations which are taken as inputs to the models (MPMR, PSO-ANNand PSO-ANFIS) and the corresponding normalized outputs are given bythese models using MATLAB R2015a. These normalized output resultsare converted to predicted values. The actual and predicted values of thesettlement obtained using the three models are used to find values ofvarious fitness parameters, which are used to analyze and compare themodels based on their prediction capability.
4. Performance assessment
Performance assessment of models ANFIS and functional network aredone by using the indices. Nash-Sutcliffe efficiency (NS) (Jain and
of adaptive network.

Table 1RPD values for evaluation of models.
RPD Model type
<1 Very poor models1.0‒1.4 Poor models1.4‒1.8 Fair models1.8‒2.0 Good models2.0‒2.5 Very good models>2.5 Excellent models
R. Ray et al. Geoscience Frontiers 12 (2021) 375–383
Sudheer, 2008) indicates the predictive power of the models. The morethe NS value closer to 1, the more the predictive capacity is.
NS¼ 1�Pn
i¼1ðdi � yiÞ2Pni¼1ðdi � dmeanÞ2
(8)
Root Mean Square Error (RMSE) (Kisi et al., 2013) value closer orequal to 0 indicates that the error in prediction is marginal.
RMSE¼ffiffiffiffiffiffiffiffiffiffiffiffiffiffiffiffiffiffiffiffiffiffiffiffiffiffiffiffiffiffiffi1N
Xn
i¼1
ðdi � yiÞ2s
(9)
Variance Account Factor (VAF) (Alvarez Grima and Babu�ska, 1999;Gokceoglu, 2002; Yılmaz and Yuksek, 2008) value equal to 100% showsmodel performance gives a reasonable result.
VAF¼�1� varðdi � yiÞ
varðdiÞ�� 100 (10)
R2 (Coefficient of determination) and Adj.R2 (adjusted determinationcoefficient) (Babu and Srivastava, 2007) values should be closer to 1, andthe two closer to each other shows that the model reflected most of thevariability in soil parameters.
R2 ¼Pn
i¼1ðdi � dmeanÞ2 �Pn
i¼1ðdi � yiÞ2Pni¼1ðdi � dmeanÞ2
(11)
Adj:R2 ¼ 1� ðn� 1Þðn� p� 1Þ
�1�R2
�(12)
Performance Index (PI) (Kung et al., 2007) indicates the compre-hensive performance of the models.
PI¼Adj:R2 þ 0:01VAF� RMSE (13)
Bias Factor is a factor whose value more than unity represents theoverestimated model, while the value of less than unity represents anunderestimation model. The value of unity indicates an unbiased pre-diction (Prasomphan and Mase, 2013).
Bias Factor ¼ 1N
Xn
i¼1
yidi
(14)
Root mean square error to observation’s Standard Deviation Ratio(RSR) (Moriasi et al., 2007) has the benefit of error index statistics. Themore the value closer to 0, the more accurate the predictive is.
RSR¼ RMSEffiffiffiffiffiffiffiffiffiffiffiffiffiffiffiffiffiffiffiffiffiffiffiffiffiffiffiffiffiffiffiffiffiffiffiffiffi1N
Pni¼1ðdi � dmeanÞ2
q (15)
Normalized Mean Bias Error (NMBE) measures the model’s ability topredict a value which is away from the mean value. NMBE equal to0 indicates a perfect model (Srinivasulu and Jain, 2006).
NMBE ð%Þ¼1N
Pni¼1ðyi � diÞ1N
Pni¼1di
� 100 (16)
Mean Absolute Percentage Error (MAPE) (Armstrong and Collopy,1992) value closer to 0 shows high prediction accuracy.
MAPE¼ 1N
Xn
i¼1
di � yidi
(17)
Relative Percentage Difference (RPD) (Viscarra Rossel et al., 2006) isgiven in Eq. (18) while RPD values for evaluation of models are providedin Table 1.
RPD¼ SDRMSE
(18)
Willmott’s Index of agreement (WI) shows the degree of model
378
prediction error. WI ranges from 0 to 1 while WI ¼ 1 indicates a perfectmodel (Willmott, 1981, 1982, 1984).
WI¼ 1�" PN
i¼1ðdi � yiÞ2PNi¼1ðjyi � dmeanj þ jdi � dmeanjÞ2
#(19)
Mean Bias Error (MBE) and Mean Absolute Error (MAE) values closerto 0 shows lesser error in prediction (Raventos-Duran et al., 2010).
MBE¼ 1N
Xn
i¼1
ðyi � diÞ (20)
MAE¼ 1N
Xn
i¼1
jðyi � diÞj (21)
The Range of Legate and McCabe’s Index (LMI) is (‒∞, 1) (Legatesand Davis, 1997; Legates and Mccabe, 1999, 2013). The model isregarded to be perfect if the value is closer to 1. The divergence betweenthe observed and predicted values is more when the value is smaller.
LMI¼ 1�" PN
i¼1jdi � yijPNi¼1jdi � dmeanj
#(22)
Expanded uncertainty (U95) indicates the short-term performance ofthe model. The smaller this value is, the higher the model performance is(Gueymard, 2014; Behar et al., 2015).
U95 ¼ 1:96�SD2 þ RMSE2
�1=2 (23)
A smaller tstat value indicates the superior performance of the model(Stone, 1993).
tstat ¼ffiffiffiffiffiffiffiffiffiffiffiffiffiffiffiffiffiffiffiffiffiffiffiffiffiffiffiffiffiffiffiffiffiðN � 1ÞMBE2
RMSE2 �MBE2
s(24a)
Global Performance Indicator (GPI) uses all the parameters to analyzethe model in a single parameter (Viscarra Rossel et al., 2006). The higherthe GPI value is, the higher the model predictive is.
GPI ¼ MBE� RMSE� U95 � tstat ��1� R2
�(24b)
Reliability Index (β) is a parameter to quantify the reliability of themodels. The reliability index between 3 and 4 indicates the good per-formance of the model (USACE, 1997).
β¼ C � Dffiffiffiffiffiffiffiffiffiffiffiffiffiffiffiffiσ2C þ σ2D
p (26)
Here di is ith value (observed) and yi is ith predicted value, dmean is theavg. of value (observed), the standard deviation is denoted by SD, σD isstandard deviations of demand (D), while σC is standard deviations ofcapacity (C).
5. Results and discussion
For the reliability analysis, a shallow foundation of dimension (1.5 m� 3m) resting at a depthDf (¼ 1.0m) on soil having hard strata at a depthof 5 m is considered. The range of soil parameters is normalized and
R. Ray et al. Geoscience Frontiers 12 (2021) 375–383
taken as input for the reliability analysis using MPMR, PSO-ANN andPSO-ANFIS.
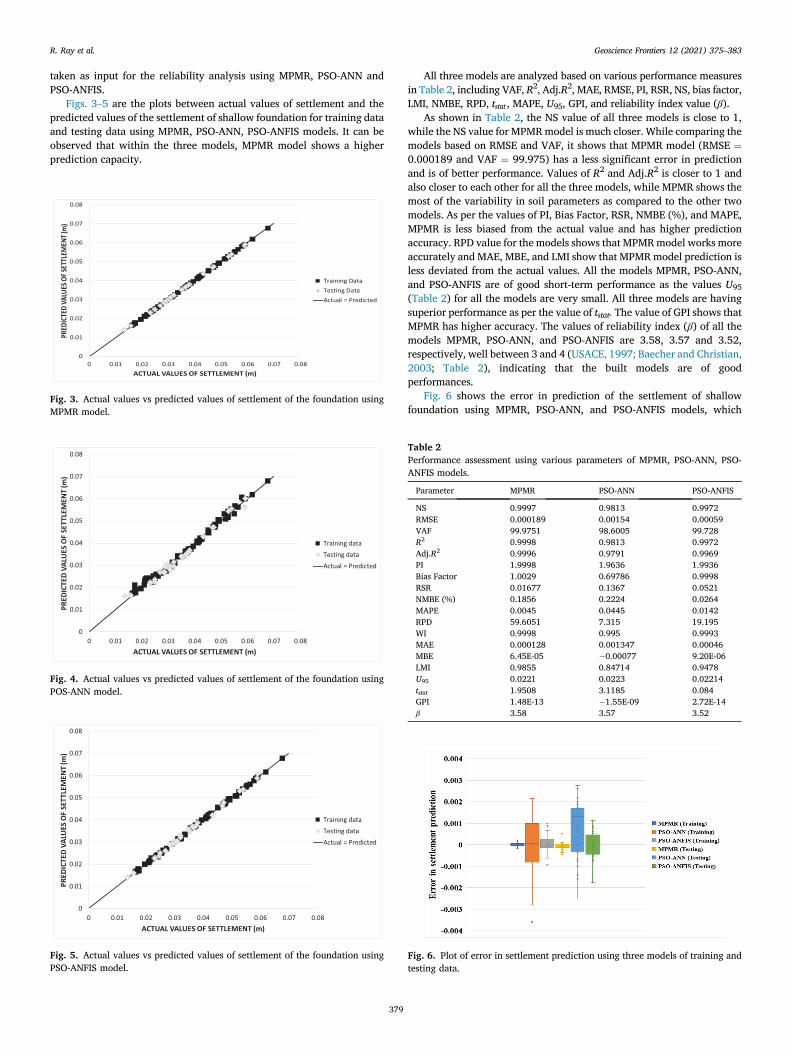
Figs. 3–5 are the plots between actual values of settlement and thepredicted values of the settlement of shallow foundation for training dataand testing data using MPMR, PSO-ANN, PSO-ANFIS models. It can beobserved that within the three models, MPMR model shows a higherprediction capacity.
Fig. 3. Actual values vs predicted values of settlement of the foundation usingMPMR model.
Fig. 4. Actual values vs predicted values of settlement of the foundation usingPOS-ANN model.
Fig. 5. Actual values vs predicted values of settlement of the foundation usingPSO-ANFIS model.
379
All three models are analyzed based on various performance measuresin Table 2, including VAF, R2, Adj.R2, MAE, RMSE, PI, RSR, NS, bias factor,LMI, NMBE, RPD, tstat , MAPE, U95, GPI, and reliability index value (β).
As shown in Table 2, the NS value of all three models is close to 1,while the NS value for MPMRmodel is much closer. While comparing themodels based on RMSE and VAF, it shows that MPMR model (RMSE ¼0.000189 and VAF ¼ 99.975) has a less significant error in predictionand is of better performance. Values of R2 and Adj.R2 is closer to 1 andalso closer to each other for all the three models, while MPMR shows themost of the variability in soil parameters as compared to the other twomodels. As per the values of PI, Bias Factor, RSR, NMBE (%), and MAPE,MPMR is less biased from the actual value and has higher predictionaccuracy. RPD value for the models shows that MPMRmodel works moreaccurately and MAE, MBE, and LMI show that MPMRmodel prediction isless deviated from the actual values. All the models MPMR, PSO-ANN,and PSO-ANFIS are of good short-term performance as the values U95(Table 2) for all the models are very small. All three models are havingsuperior performance as per the value of tstat. The value of GPI shows thatMPMR has higher accuracy. The values of reliability index (β) of all themodels MPMR, PSO-ANN, and PSO-ANFIS are 3.58, 3.57 and 3.52,respectively, well between 3 and 4 (USACE, 1997; Baecher and Christian,2003; Table 2), indicating that the built models are of goodperformances.
Fig. 6 shows the error in prediction of the settlement of shallowfoundation using MPMR, PSO-ANN, and PSO-ANFIS models, which
Table 2Performance assessment using various parameters of MPMR, PSO-ANN, PSO-ANFIS models.
Parameter MPMR PSO-ANN PSO-ANFIS
NS 0.9997 0.9813 0.9972RMSE 0.000189 0.00154 0.00059VAF 99.9751 98.6005 99.728R2 0.9998 0.9813 0.9972Adj.R2 0.9996 0.9791 0.9969PI 1.9998 1.9636 1.9936Bias Factor 1.0029 0.69786 0.9998RSR 0.01677 0.1367 0.0521NMBE (%) 0.1856 0.2224 0.0264MAPE 0.0045 0.0445 0.0142RPD 59.6051 7.315 19.195WI 0.9998 0.995 0.9993MAE 0.000128 0.001347 0.00046MBE 6.45E-05 �0.00077 9.20E-06LMI 0.9855 0.84714 0.9478U95 0.0221 0.0223 0.02214tstat 1.9508 3.1185 0.084GPI 1.48E-13 �1.55E-09 2.72E-14β 3.58 3.57 3.52
Fig. 6. Plot of error in settlement prediction using three models of training andtesting data.
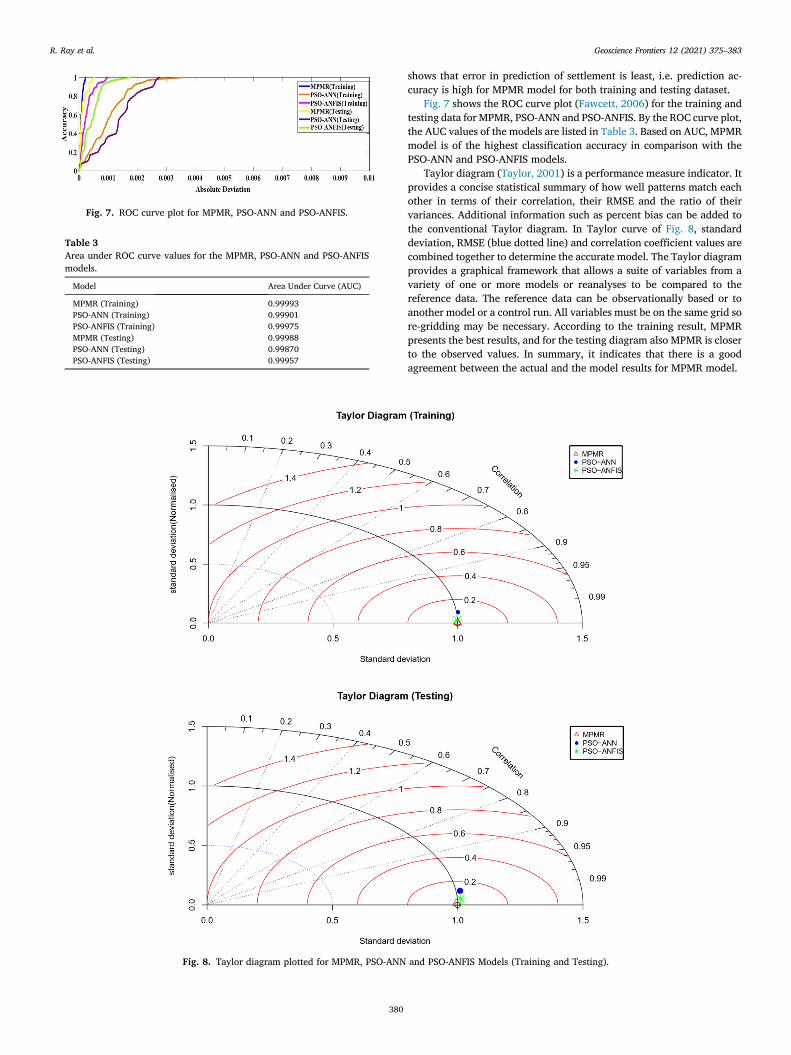
Fig. 7. ROC curve plot for MPMR, PSO-ANN and PSO-ANFIS.
Table 3Area under ROC curve values for the MPMR, PSO-ANN and PSO-ANFISmodels.
Model Area Under Curve (AUC)
MPMR (Training) 0.99993PSO-ANN (Training) 0.99901PSO-ANFIS (Training) 0.99975MPMR (Testing) 0.99988PSO-ANN (Testing) 0.99870PSO-ANFIS (Testing) 0.99957
Fig. 8. Taylor diagram plotted for MPMR, PSO-ANN
R. Ray et al. Geoscience Frontiers 12 (2021) 375–383
380
shows that error in prediction of settlement is least, i.e. prediction ac-curacy is high for MPMR model for both training and testing dataset.
Fig. 7 shows the ROC curve plot (Fawcett, 2006) for the training andtesting data for MPMR, PSO-ANN and PSO-ANFIS. By the ROC curve plot,the AUC values of the models are listed in Table 3. Based on AUC, MPMRmodel is of the highest classification accuracy in comparison with thePSO-ANN and PSO-ANFIS models.
Taylor diagram (Taylor, 2001) is a performance measure indicator. Itprovides a concise statistical summary of how well patterns match eachother in terms of their correlation, their RMSE and the ratio of theirvariances. Additional information such as percent bias can be added tothe conventional Taylor diagram. In Taylor curve of Fig. 8, standarddeviation, RMSE (blue dotted line) and correlation coefficient values arecombined together to determine the accurate model. The Taylor diagramprovides a graphical framework that allows a suite of variables from avariety of one or more models or reanalyses to be compared to thereference data. The reference data can be observationally based or toanother model or a control run. All variables must be on the same grid sore-gridding may be necessary. According to the training result, MPMRpresents the best results, and for the testing diagram also MPMR is closerto the observed values. In summary, it indicates that there is a goodagreement between the actual and the model results for MPMR model.
and PSO-ANFIS Models (Training and Testing).

Table 5Anderson-Darling k-sample test of MPMR, PSO-ANN, PSO-ANFIS models fortraining and testing periods.
Anderson-Darling k-sample test
MPMR PSO-ANN PSO-ANFIS
Training Testing Training Testing Training Testing
AD 0.06882 0.09394 0.2185 0.3595 0.07601 0.1217P 1 1 0.9884 0.9054 1 1
Table 6Performance assessment using various parameters of MPMR, PSO-ANN, PSO-ANFIS models for 10 dataset.
Parameter MPMR PSO-ANN PSO-ANFIS
NS 0.9995 0.9849 0.9907RMSE 0.000177 0.00107 0.00084VAF 99.9720 98.9630 99.4819R2 0.9996 0.9849 0.9907Adj.R2 0.99938 0.9774 0.986PI 1.9989 1.9660 1.9800Bias Factor 1.0035 0.9815 0.9829RSR 0.0203 0.1226 0.96308NMBE (%) 0.2973 ‒1.7250 �1.6160MAPE 0.0043 0.02894 0.01868RPD 49.2769 8.1560 10.3835WI 0.9998 0.9960 0.9977MAE 0.00014 0.000932 0.000631MBE 0.000103 �0.0006 �0.00056LMI 0.9805 0.8700 0.9121U95 0.0171 0.0172 0.0172tstat 2.1346 2.0117 2.6670GPI 2.74E-13 �3.30E-10 �2.00E-10
Fig. 9. Comparison of models on the basis of Reliability Index (β).
R. Ray et al. Geoscience Frontiers 12 (2021) 375–383
In addition, the homogeneity of the models is also tested based on theMann–Whitney U (M�W) test (Mann and Whitney, 1947) to assureacceptance. As the P-values obtained by M�W test for all the models areP > 0.05 shows that all models null-hypothesis are accepted, whichmeans that all the models are normally distributed. Among all threemodels, MPMR shows better performance. M�W statistics of MPMR,PSO-ANN, PSO-ANFIS models for testing and training data are providedin Table 4.
Anderson-Darling (AD) statistical normality test (Anderson andDarling, 1952) is being performed to examine whether the given data isobtained from the same probability distribution or not. In Table 5 theP-value obtained from Anderson-Darling (AD) test shows that P > 0.05for all the three models signifies that all models follow the normal dis-tribution. According to these results, MPMR model follows the normaldistribution best.
As all the three models are trained and tested, to check whether themodels can be used in the future for assessment of the shallow foundationsettlement, coefficient of variation (COV) are taken for γ (unit weight) ¼5%, Cc (compression index)¼ 30% and e0 (void ratio)¼ 3% (Jones et al.,2002; Griffiths, 2007) and 10 data sets are generated for all the soil pa-rameters. Then, for these 10 data set reliability analyses are performedusing MPMR, PSO-ANN, and PSO-ANFIS models. As shown in Table 6 theparameters for analysis shows similar behaviour as obtained during thedevelopment of the models, implying that the model’s predictive poweris high.
Fig. 9 shows the reliability index value for FOSM (first-order second-moment), FOSM (MPMR), FOSM (PSO-ANN) and FOSM (PSO-ANFIS).The reliability index values for all three models are closer to the reli-ability index value for the actual values obtained, indicating that themodels are reliable for shallow foundation settlement prediction.
6. Conclusion
In this paper, reliability analysis based on settlement criteria ofshallow foundation on clay was studied using MPMR, PSO-ANN, andPSO-ANFIS. These models were comprehensively compared based onvarious fitness parameters. All three models based on the reliability indexshows that the models have good prediction capability. Besides, it wasfound that MPMR outperformed in predicting the settlement of shallowfoundation based on various fitness parameters. It can be used as a reli-able soft computing technique for the prediction of shallow foundationssettlement on clay. Further, this study can be used for the prediction ofthe settlement of other types of foundation. Also, the generalizationcapability of developed models was checked by new 10 datasets. Thedeveloped models show good generalization capability. Therefore, it canbe concluded that developed models can be used for the prediction ofreliability index of the settlement of shallow foundation.
Declaration of competing interest
The authors declare that they have no known competing financialinterests or personal relationships that could have appeared to influencethe work reported in this paper.
Table 4M�W statistics of MPMR, PSO-ANN, PSO-ANFIS models for testing and training data.
M�W test statistics MPMR PSO-ANN PSO-ANFIS
Training Testing Training Testing Training Testing
Mann–Whitney U 2449 443 2459 484 2455 449P 0.9983 0.924 0.9717 0.6228 0.985 0.9641
381
R. Ray et al. Geoscience Frontiers 12 (2021) 375–383
Acknowledgment
This work was financially supported by High-end Foreign Expertprogram (G20190022002), Science and Technology Research Program ofChongqing Municipal Education Commission (Grant No. KJZD-K201900102) and Chongqing Construction Science and Technology PlanProject (2019-0045), that are gratefully acknowledged.
References
Alam, M.N., Das, B., Pant, V., 2015. A comparative study of metaheuristic optimizationapproaches for directional overcurrent relays coordination. J. Electr. Power Syst. Res.128, 39–52.
Alvarez Grima, M., Babu�ska, R., 1999. Fuzzy model for the prediction of unconfinedcompressive strength of rock samples. Int. J. Rock Mech. Min. Sci. 36, 339–349.
Anderson, T.W., Darling, D.A., 1952. Asymptotic theory of certain "goodness of fit"criteria based on stochastic processes. Ann. Math. Stat. 23, 193–212.
Armstrong, J.S., Collopy, F., 1992. Error measures for generalizing about forecastingmethods: empirical comparisons. Int. J. Forecast. 8, 69–80.
Arora, K.R., 2004. Soil Mechanics and Foundation Engineering in S.I. Units. StandardPublishers Distributors.
Babu, G.L.S., Srivastava, A., 2007. Reliability analysis of allowable pressure on shallowfoundation using response surface method. Comput. Geotech. 34 (3), 187–194.
Baecher, G.B., Christian, J.T., 2003. Reliability and Statistics in Geotechnical Engineering.Wiley, 618 pp.
Behar, O., Khellaf, A., Mohammedi, K., 2015. Comparison of solar radiation models andtheir validation under Algerian climate – the case of direct irradiance. J. EnergyConvers. Manag. 98, 236–251.
Chen, X.L., Fu, J.P., Yao, J.L., Gan, J.F., 2018. Prediction of shear strength for squat RCwalls using a hybrid ANN–PSO model. Eng. Comput. 34, 367–383.
Chen, F.Y., Wang, L., Zhang, W.G., 2019. Reliability assessment on stability of tunnelingperpendicularly beneath an existing tunnel considering spatial variabilities of rockmass properties. Tunn. Undergr. Space Technol. 88, 276–289.
Cherubini, C., 1990. A closed-form probabilistic solution for evaluating the bearingcapacity of shallow foundations. Can. Geotech. J. 27, 526–529.
Cherubini, C., 2000. Reliability evaluation of shallow foundation bearing capacity on c’ φ’soils. Can. Geotech. J. 37, 264–269.
Clerc, M., Kennedy, J., 2002. The particle swarm-explosion, stability, and convergence ina multidimensional complex space. Available at: http://citeseerx.ist.psu.edu/viewdoc/download?doi¼10.1.1.460.6608&rep¼rep1&type¼pdf. (Accessed26 March 2019).
Duncan, J.M., 2000. Factors of safety and reliability in geotechnical engineering.J. Geotech. Geoenviron. Eng. 126, 307–316.
Easa, S., 1992. Exact probabilistic solution of two-parameter bearing capacity for shallowfoundations. Can. Geotech. J. 30 (5), 884–885.
Eberhart, R., Kennedy, J., 1995. A new optimizer using particle swarm theory. In:MHS’95. Proceedings of the Sixth International Symposium on Micro Machine andHuman Science. IEEE, pp. 39–43.
Fawcett, T., 2006. An introduction to ROC analysis. Pattern Recogn. Lett. 27, 861–874.Goh, A.T.C., Zhang, W.G., 2014. An improvement to MLR model for predicting
liquefaction-induced lateral spread using multivariate adaptive regression splines.Eng. Geol. 170, 1–10.
Goh, A.T.C., Zhang, Y.M., Zhang, R.H., Zhang, W.G., Xiao, Y., 2017. Evaluating stability ofunderground entry-type excavations using multivariate adaptive regression splinesand logistic regression. Tunn. Undergr. Space Technol. 70, 148–154.
Goh, A.T.C., Zhang, W.G., Zhang, Y.M., Xiao, Y., Xiang, Y.Z., 2018. Determination of EPBtunnel-related maximum surface settlement: a Multivariate adaptive regressionsplines approach. Bull. Eng. Geol. Environ. 77, 489–500.
Goh, A.T.C., Zhang, W.G., Wong, K.S., 2019. Deterministic and reliability analysis of basalheave stability for excavation in spatial variable soils. Comput. Geotech. 108,152–160.
Gokceoglu, C., 2002. A fuzzy triangular chart to predict the uniaxial compressive strengthof Ankara agglomerates from their petrographic composition. Eng. Geol. 66, 39–51.
Griffiths, D.V.G.A.F., 2007. Probabilistic Methods in Geotechnical Engineering. SpringerVienna. https://doi.org/10.1007/978-3-211-73366-0.
Gueymard, C., 2014. A review of validation methodologies and statistical performanceindicators for modeled solar radiation data: towards a better bankability of solarprojects. Renew. Sustain. Energy Rev. 39, 1024–1034.
Hasanipanah, M., Noorian-Bidgoli, M., Jahed, A.D., Khamesi, H., 2016. Feasibility of PSO-ANN model for predicting surface settlement caused by tunneling. Eng. Comput. 32(4), 705–715.
Jain, S.K., Sudheer, K.P., 2008. Fitting of hydrologic models: a close look at thenash–sutcliffe index. J. Hydrol. Eng. 13, 613–634.
Jang, Jyh-Shing, 1993. ANFIS adaptive-network-based fuzzy inference system. IEEETrans. Syst. Man Cybern. 23, 665–685.
Jena, R., Pradhan, B., Beydoun, G., Nizamuddin, Ardiansyah, Sofyan, H., Affan, M., 2019.Integrated model for earthquake risk assessment using neural network and analytichierarchy process: Aceh province, Indonesia. Geosci. Front. 11 (2), 613–634. https://doi.org/10.1016/J.GSF.2019.07.006.
Jones, A.L., Kramer, S.L., Aduino, P., 2002. Estimation of Uncertainty in GeotechnicalProperties for Performance-Based Earthquake Engineering. PEER Report 2002/16,Pacific Earthquake Engineering Research Center, College of Engineering University ofCalifornia, Berkeley.
382
Karimi, I., 2003. Application of Neuro-Fuzzy Systems in Estimating the Response ofSediment-Filled Valleys. In: International Fuzzy Systems Association Congress.
Kisi, O., Shiri, J., Tombul, M., 2013. Modeling rainfall-runoff process using softcomputing techniques. Comput. Geosci. 51, 108–117.
Kong, Y., Liu, X., Zhang, S., 2009. Minimax probability machine regression for wirelesstraffic short term forecasting. In: UK-India International Workshop on CognitiveWireless Systems. IEEE, pp. 1–5.
Krizek, R.J., Corotis, R.B., El-Moursi, H.H., 1977. Probabilistic analysis of predicted andmeasured settlements. Can. Geotech. J. 14 (1), 17–33.
Kung, G.T., Juang, C.H., Hsiao, E.C., Hashash, Y.M., 2007. Simplified model for walldeflection and ground-surface settlement caused by braced excavation in clays.J. Geotech. Geoenviron. Eng. 133 (6), 731–747.
Lanckriet, G.R.G., El Ghaoui, L., Bhattacharyya, C., Jordan, M.I., 2002. A robust minimaxapproach to classification. J. Mach. Learn. Res. 3 (3), 555–582. https://doi.org/10.1162/153244303321897726.
Legates, D.R., Davis, R.E., 1997. The continuing search for an anthropogenic climatechange signal: limitations of correlation-based approaches. Geophys. Res. Lett. 24(18), 2319–2322.
Legates, D.R., Mccabe, G.J., 1999. Evaluating the use of “goodness-of-fit” measures inhydrologic and hydroclimatic model validation. Water Resour. Res. 35 (1), 233–241.
Legates, D.R., Mccabe, G.J., 2013. A refined index of model performance: a rejoinder. Int.J. Climatol. 33 (4), 1053–1056. https://doi.org/10.1002/joc.3487.
Mann, H.B., Whitney, D.R., 1947. On a test of whether one of two random variables isstochastically larger than the other. Ann. Math. Stat. 18 (1), 50–60.
Moriasi, D.N., Arnold, J.G., Van Liew, M.W., Bingner, R.L., Harmel, R.D., Veith, T.L.,2007. Model evaluation guidelines for systematic quantification of accuracy inwatershed simulations. J. Trans. ASABE 50, 885–900. https://doi.org/10.13031/2013.23153.
Phoon, K.K., 2002. Potential application of reliability-based design to geotechnicalengineering. In: Proceedings of 4th Colombian Geotechnical Seminar. Medellin,pp. 1–22.
Prasomphan, S., Mase, S., 2013. Generating prediction map for geostatistical data basedon an adaptive neural network using only nearest neighbors. Int. J. Mach. Learn.Comput. 3 (1), 98–102.
Raventos-Duran, T., Camredon, M., Valorso, R., Mouchel-Vallon, C., Aumont, B., 2010.Structure-activity relationships to estimate the effective Henry’s law constants oforganics of atmospheric interest. Atmos. Chem. Phys. 10 (16), 7643–7654.
Rossel, R.A.V., Mcglynn, R.N., Mcbratney, A.B., 2006. Determining the composition ofmineral-organic mixes using UV-vis-NIR diffuse reflectance spectroscopy. Geoderma137 (1), 70–82.
Schmertmann, J.H., 1970. Static cone to compute static settlement over sand. Proc. ASCE96, 1011–1043.
Schweiger, H.F., Thurner, R., P€ottler, R., 2001. Reliability analysis in geotechnics withdeterministic finite elements — theoretical concepts and practical application. Int. J.GeoMech. 1 (4), 389–413.
Shahin, M.A., Maier, H.R., Jaksa, M.B., 2003. Neural and Neurofuzzy Techniques Appliedto Modelling Settlement of Shallow Foundations on Granular Soils. In: Int. Congresson Modelling and Simulation, Townsville, Australia, pp. 1886–1891.
Shahnazar, A., Nikafshan Rad, H., Hasanipanah, M., Tahir, M.M., Jahed Armaghani, D.,Ghoroqi, M., 2017. A new developed approach for the prediction of ground vibrationusing a hybrid PSO-optimized ANFIS-based model. Environ. Earth Sci. 76 (15), 527.https://doi.org/10.1007/s12665-017-6864-6.
Shahrour, I., Zhang, W.G., 2020. Use of the Soft Computing techniques for TBMtunnelling optimization. Undergr. Space, in press. https://doi.org/10.1016/j.undsp.2019.12.001.
Singh, P., 2017. Indian summer monsoon rainfall (ISMR) forecasting using time seriesdata: a fuzzy-entropy-neuro based expert system. Geosci. Front. 9 (4), 1243–1254.https://doi.org/10.1016/j.gsf.2017.07.011.
Srinivasulu, S., Jain, A., 2006. A comparative analysis of training methods for artificialneural network rainfall–runoff models. Appl. Soft Comput. 6 (3), 295–306.
Stone, R.J., 1993. Improved statistical procedure for the evaluation of solar radiationestimation models. Sol. Energy 51 (4), 289–291.
Strohmann, T., Grudic, G.Z., 2002. A formulation for minimax probability machineregression. Adv. Neural Inf. Process. Syst. 769–776.
Tarawneh, B., 2016. Predicting standard penetration test N-value from cone penetrationtest data using artificial neural networks. Geosci. Front. 8 (1), 199–204.
Taylor, E.K., 2001. Summarizing multiple aspects of model performance in a singlediagram. J. Geophys. Res. 106 (D7), 7183. https://doi.org/10.1029/2000JD900719.
USACE, 1997. Risk-based Analysis in Geotechnical Engineering for Support of PlanningStudies, Engineering and Design. Dept. Army, USACE Washington, DC.
Wang, G., Ma, Z., 2017. Hybrid particle swarm optimization for first-order reliabilitymethod. Comput. Geotech. 81, 49–58. https://doi.org/10.1016/j.compgeo.2016.07.013.
Wang, L., Wu, C.Z., Li, Y.Q., Liu, H.L., Zhang, W.G., Chen, X., 2019. Probabilistic riskassessment of unsaturated slope failure considering spatial variability of hydraulicparameters. KSCE J. Civ. Eng. 23, 5032–5040. https://doi.org/10.1007/s12205-019-0884-6.
Wang, L., Wu, C.Z., Gu, X., Liu, H.L., Mei, G.X., Zhang, W.G., 2020a. Probabilistic stabilityanalysis of earth dam slope under transient seepage using multivariate adaptiveregression splines. Bull. Eng. Geol. Environ. 79, 2763–2775. https://doi.org/10.1007/s10064-020-01730-0.
Wang, L., Tang, L.B., Wang, Z.Y., Liu, H.L., Zhang, W.G., 2020b. Probabilisticcharacterization of the soil-water retention curve and hydraulic conductivity and itsapplication to slope reliability analysis. Comput. Geotech. Comput. Geotech. 121,103460.

R. Ray et al. Geoscience Frontiers 12 (2021) 375–383
Werbos, P., 1974. Beyond Regression: New Tools for Prediction and Analysis in theBehavioral Sciences.. Ph.D. thesis Harvard University, Cambridge.
Whitman, Robert, V., 2000. Organizing and evaluating uncertainty in geotechnicalengineering. J. Geotech. Geoenviron. Eng. 126 (7), 583–593.
Willmott, C.J., 1981. On the validation of model. Phys. Geogr. 2 (2), 219–232.Willmott, C.J., 1982. Some comments on the evaluation of model performance. Bull. Am.
Meteorol. Soc. 63, 1309–1313.Willmott, C.J., 1984. On the Evaluation of Model Performance in Physical Geography.
Springer, Dordrecht, pp. 443–460.Yılmaz, I., Yuksek, A.G., 2008. An example of artificial neural network (ANN) application
for indirect estimation of rock parameters. Rock Mech. Rock Eng. 41, 781–795.Zadeh, L.A., 1965. Fuzzy sets. Inf. Control 8, 338–353. https://doi.org/10.1016/S0019-
9958(65)90241-X.Zadeh, L.A., 1973. Outline of a new approach to the analysis of complex systems and
decision processes. IEEE Trans. Syst. Man. Cybern. SMC- 3 (1), 28–44.Zhang, W.G., Goh, A.T.C., 2012. Reliability assessment on ultimate and serviceability
limit states and determination of critical factor of safety for underground rockcaverns. Tunn. Undergr. Space Technol. 32, 221–230.
Zhang, W.G., Goh, A.T.C., 2013. Multivariate adaptive regression splines for analysis ofgeotechnical engineering systems. Comput. Geotech. 48, 82–95.
Zhang, W.G., Goh, A.T.C., 2016. Multivariate adaptive regression splines and neuralnetwork models for prediction of pile drivability. Geosci. Front. 7, 45–52.
383
Zhang, W.G., Goh, A.T.C., 2018. Reliability analysis of geotechnical infrastructures:introduction. Geosci. Front. 9 (6), 1595–1596.
Zhang, W.G., Goh, A.T.C., Zhang, Y.M., Chen, Y.M., Xiao, Y., 2015. Assessment of soilliquefaction based on capacity energy concept and multivariate adaptive regressionsplines. Eng. Geol. 188, 29–37.
Zhang, W.G., Wang, W., Zhou, D., Goh, A.T.C., Zhang, R.H., 2018. Influence ofgroundwater drawdown on excavation responses – a case history in Bukit Timahgranitic residual soils. J. Rock Mech. Geotech. Eng. 10, 856–864.
Zhang, W.G., Zhang, R.H., Wang, W., Zhang, F., Goh, A.T.C., 2019a. A MultivariateAdaptive Regression Splines model for determining horizontal wall deflectionenvelope for braced excavations in clays. Tunn. Undergr. Space Technol. 84,461–471.
Zhang, W.G., Wu, C.Z., Li, Y.Q., Wang, L., Samui, P., 2020b. Assessment of pile drivabilityusing random forest regression and multivariate adaptive regression splines. Georiskin press. https://doi.org/10.1080/17499518.2019.1674340.
Zhang, W.G., Zhang, R.H., Wu, C.Z., Goh, A.T.C., Lacasse, S., Liu, Z.Q., Liu, H.L., 2020a.State-of-the-art review of soft computing applications in underground excavations.Geosci. Front. 11 (4), 1095–1106.
Zhang, W.G., Li, H.R., Wu, C.Z., Li, Y.Q., Liu, Z.Q., Liu, H.L., 2020b. Soft computingapproach for prediction of surface settlement induced by earth pressure balanceshield tunneling. Undergr. Space, in press. https://doi.org/10.1016/j.undsp.2019.12.003.