application of statistical indicators for digital image
TRANSCRIPT
Tehnički vjesnik 25, 6(2018), 1739-1745 1739
ISSN 1330-3651 (Print), ISSN 1848-6339 (Online) https://doi.org/10.17559/TV-20171129091703 Original scientific paper
Application of Statistical Indicators for Digital Image Analysis and Segmentation in Sorting of Agriculture Products
Ivana MARKOVIC, Dragan MARKOVIC, Jelena ILIC, Vojislav SIMONOVIC, Emil VEG, Goran ŠINIKOVIĆ, Nenad GUBELJAK
Abstract: Food processing industry is moving forward to a full automation of all processes, especially in technological line segments which represent critical control points of food safety. One of these points is color sorting by using machine vision, where inappropriate products are removed. Most important product appearance attributes are color and texture. During food processing, the product is captured by optical devices, mostly color cameras and lasers. The aim of this paper is to investigate new eligibility criteria for digital image segmentation by using only image from the camera. The goal is to describe the texture of the product, based on chosen mathematical measures, and to allow for recognition and then classification according to the predefined range of values in an appropriate class. Images of frozen raspberry were used. Image analysis of color parameters in RGB color space and statistical tests to examine normality of data were carried out. Thereafter, one-way Anova and correlation analysis was performed. Statistically significant difference was found for the values of two indicators: entropy and new criteria were derived from standard deviation, as well as mean values of pixels for every channel, and marked as L. After determining the range of these criteria, a new algorithm was developed for image segmentation written in Matlab. One of the results of applying this algorithm is that more than 80% of good products were recognized.
Keywords: color; fruits; segmentation; sorting
1 INTRODUCTION
Head of accurate grading and sorting of fruits and food products arises because of increased expectations in quality food and safety standards. External quality is the most important and direct sensory quality attribute of agricultural products. In general terms, the external quality of fruits and vegetables is evaluated by considering their color, texture, size, shape and visual defects [1-3]. Several review papers have been published, some of them are only focused on traditional computer vision system in external quality inspection [4-8], while others are focused on NIR, hyperspectral and multispectral imaging in quality evaluation and use different methods and color models [9-12].
The cameras detect defects based on color, while the lasers detect insects and animal parts as well as sticks, rocks, cardboard, plastic, metal, and glass, even if they are the same color as the good product, based on the object’s structural properties. Some sorters rely on cameras, others on lasers, and some combine cameras and lasers to view product from the top only or both top and bottom. Some sorters inspect only an object’s color, others inspect an object’s color, size, and shape. There are some sortings based on the object’s structural properties, including differing levels of chlorophyll.
As color attribute, texture is another significant sensory quality attribute that has been frequently used in the external quality inspecting and grading systems for the agricultural product quality evaluation. Texture analysis can also play an important role in defect recognition and segmentation in grading systems due to its powerful discriminating ability [8]. Also, it is closely related to some internal quality of fruits and vegetables, such as maturity and sugar content [13]. Therefore, it can be said that texture is one of the widely used indicators the consumer uses for quality assessment of fruits and vegetables.
Many researchers in their papers suggested different approaches and methods for digital image processing, including detection, segmentation and solved problems [14-19]. Various statistical measures are used in a wide
range of scientific and social research. The main purpose in image processing is to highlight the application of these measures in various fields such as image enhancement, image restoration, image denoising, edge detection, etc. Entropy is one of them. Entropy is best known from thermodynamics, but also is well known as information entropy theory. There is also state entropy model proposed by [20] for supplier evaluation and selection. The use of image entropy as a criterion for threshold selection has a long tradition and numeros methods have been proposed [21-23]. A practical system used for inspecting potato chips applies entropy, contrast, energy and homogeneity features to various color channels in the CIELAB and HSV scale in order to determine the quality class of a chip [24]. In [12] authors used mean and entropy for predicting color and moisture content during drying process of soybean.
The aim of this work is to find new criteria for segmentation based just on digital images from one camera, using classical statistical indicators and methods. The idea emerged when browsing literature on the application of fractal and multifractal analysis in digital imaging processing to recognize textures of different materials. Multifractal analysis is most commonly used in medicine for the discovery of changes in tissues [25]. Two basic indicators are fractal dimension used in grayscale images and lacunarity used in binary images to determine gaps in the fractal image. Lacunarity is calculated as the squared coefficient of variation, Eq. (1).
2( )Stdv AvgΛ = (1)
Two calculation procedures are most frequently applied: box counting and gliding box. The application of multifractal analysis to color images is predominantly reduced to the conversion into binary images, but there are different approaches to calculating values in the RGB color space [26-28]. The main idea was to check whether the values obtained by the lacunarity equation can be implemented as criteria for segmentation of agricultural
Ivana MARKOVIC et al.: Application of Statistical Indicators for Digital Image Analysis and Segmentation in Sorting of Agriculture Products
1740 Technical Gazette 25, 6(2018), 1739-1745
products’ images. Further, a gliding box algorithm was developed using the Matlab®program. 2 MATERIALS AND METHODS
Initial research of potential criterion included the original images of raspberry (Rubus idaeus L.) obtained during the process of sorting fruits with a color sorter Optyx, manufacturer Key Technology (http://www.key.net/products/optyx). The system provides images of 1024×1024 pixels. The frame grabber digitised and decoded the composite video signal from the camera into three user-defined buffers in red, green and blue color
coordinates (RGB). The vision system was part of the robotic system for automatic inspection, handling and packing.
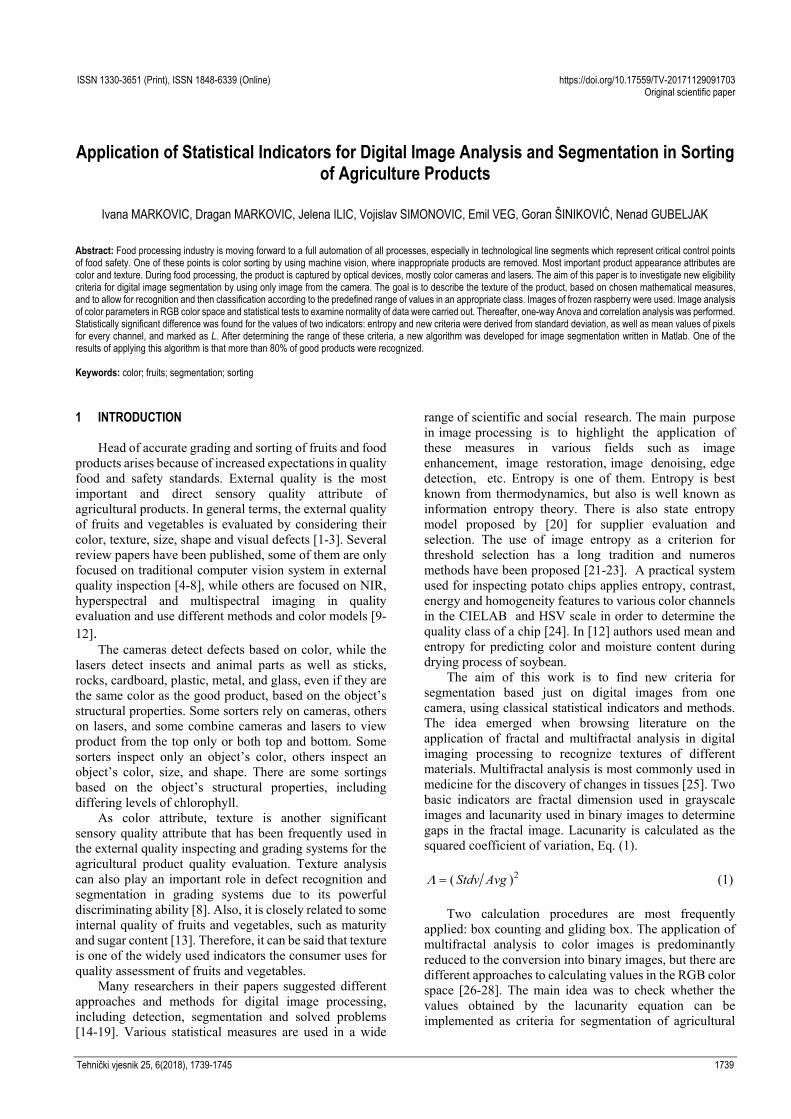
A representative sample was taken from images of 84 fruits in total. Evaluation of sensory quality parameters was conducted using a point-type system of analytical descriptive tests [29]. Three trained panelists performed evaluation by visual inspection. Evaluated samples were ranked into three categories: acceptable raspberries, unacceptable raspberries, and impurities. Fig. 1 shows part of analyzed images for each category.
Figure 1 Part of analysed images: a) acceptable raspberry, b) unacceptable raspberry, c) impurities age setup
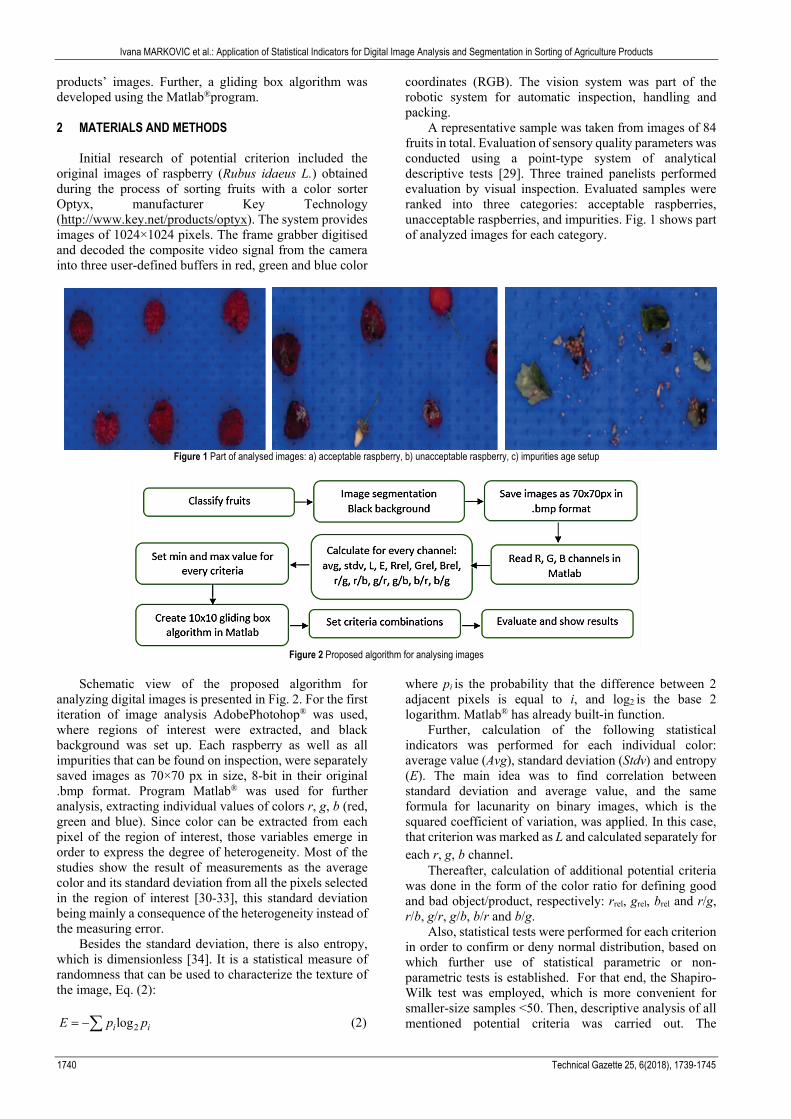
Figure 2 Proposed algorithm for analysing images
Schematic view of the proposed algorithm for
analyzing digital images is presented in Fig. 2. For the first iteration of image analysis AdobePhotohop® was used, where regions of interest were extracted, and black background was set up. Each raspberry as well as all impurities that can be found on inspection, were separately saved images as 70×70 px in size, 8-bit in their original .bmp format. Program Matlab® was used for further analysis, extracting individual values of colors r, g, b (red, green and blue). Since color can be extracted from each pixel of the region of interest, those variables emerge in order to express the degree of heterogeneity. Most of the studies show the result of measurements as the average color and its standard deviation from all the pixels selected in the region of interest [30-33], this standard deviation being mainly a consequence of the heterogeneity instead of the measuring error.
Besides the standard deviation, there is also entropy, which is dimensionless [34]. It is a statistical measure of randomness that can be used to characterize the texture of the image, Eq. (2):
2logi iE p p= −∑ (2)
where pi is the probability that the difference between 2 adjacent pixels is equal to i, and log2 is the base 2 logarithm. Matlab® has already built-in function.
Further, calculation of the following statistical indicators was performed for each individual color: average value (Avg), standard deviation (Stdv) and entropy (E). The main idea was to find correlation between standard deviation and average value, and the same formula for lacunarity on binary images, which is the squared coefficient of variation, was applied. In this case, that criterion was marked as L and calculated separately for each r, g, b channel.
Thereafter, calculation of additional potential criteria was done in the form of the color ratio for defining good and bad object/product, respectively: rrel, grel, brel and r/g, r/b, g/r, g/b, b/r and b/g.
Also, statistical tests were performed for each criterion in order to confirm or deny normal distribution, based on which further use of statistical parametric or non-parametric tests is established. For that end, the Shapiro-Wilk test was employed, which is more convenient for smaller-size samples <50. Then, descriptive analysis of all mentioned potential criteria was carried out. The
Ivana MARKOVIC et al.: Application of Statistical Indicators for Digital Image Analysis and Segmentation in Sorting of Agriculture Products
Tehnički vjesnik 25, 6(2018), 1739-1745 1741
significance of difference of the examined criteria among samples was checked using one-way Anova method at a significance level of α = 0.05. Also, we wanted to know if any correlation between these criteria exists. For that purpose, we used bivariate correlation analysis and Pearson’s coefficient. Statistical analysis of the results was performed in the computer program IBM SPSS® 21.0 and MSExcel® 2013. After obtained results were checked and analyzed, we made a hypothesis that appropriate image segmentation can be done according to the criteria L and E. Further, the range of values (min to max) was defined for the first category of acceptable products. Also, results were tested by combination of other proposed criteria.
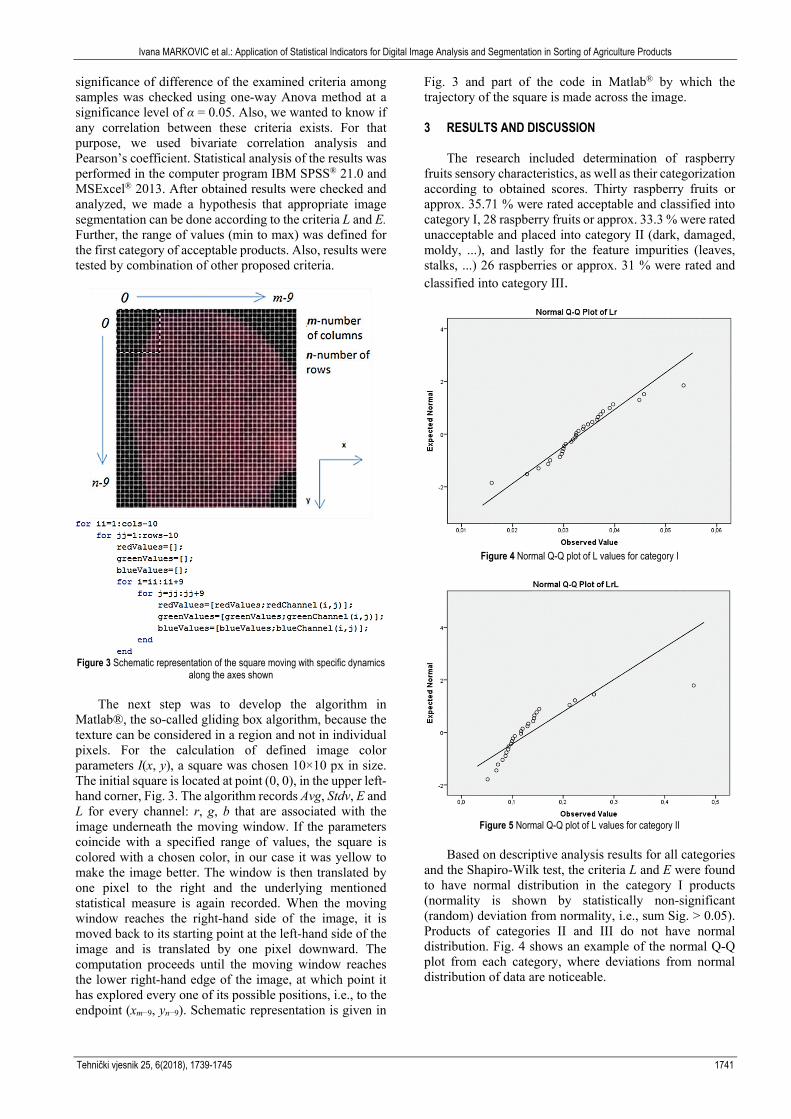
Figure 3 Schematic representation of the square moving with specific dynamics
along the axes shown The next step was to develop the algorithm in
Matlab®, the so-called gliding box algorithm, because the texture can be considered in a region and not in individual pixels. For the calculation of defined image color parameters I(x, y), a square was chosen 10×10 px in size. The initial square is located at point (0, 0), in the upper left-hand corner, Fig. 3. The algorithm records Avg, Stdv, E and L for every channel: r, g, b that are associated with the image underneath the moving window. If the parameters coincide with a specified range of values, the square is colored with a chosen color, in our case it was yellow to make the image better. The window is then translated by one pixel to the right and the underlying mentioned statistical measure is again recorded. When the moving window reaches the right-hand side of the image, it is moved back to its starting point at the left-hand side of the image and is translated by one pixel downward. The computation proceeds until the moving window reaches the lower right-hand edge of the image, at which point it has explored every one of its possible positions, i.e., to the endpoint (xm−9, yn−9). Schematic representation is given in
Fig. 3 and part of the code in Matlab® by which the trajectory of the square is made across the image. 3 RESULTS AND DISCUSSION
The research included determination of raspberry fruits sensory characteristics, as well as their categorization according to obtained scores. Thirty raspberry fruits or approx. 35.71 % were rated acceptable and classified into category I, 28 raspberry fruits or approx. 33.3 % were rated unacceptable and placed into category II (dark, damaged, moldy, ...), and lastly for the feature impurities (leaves, stalks, ...) 26 raspberries or approx. 31 % were rated and classified into category III.
Figure 4 Normal Q-Q plot of L values for category I
Figure 5 Normal Q-Q plot of L values for category II
Based on descriptive analysis results for all categories
and the Shapiro-Wilk test, the criteria L and E were found to have normal distribution in the category I products (normality is shown by statistically non-significant (random) deviation from normality, i.e., sum Sig. > 0.05). Products of categories II and III do not have normal distribution. Fig. 4 shows an example of the normal Q-Q plot from each category, where deviations from normal distribution of data are noticeable.

Ivana MARKOVIC et al.: Application of Statistical Indicators for Digital Image Analysis and Segmentation in Sorting of Agriculture Products
1742 Technical Gazette 25, 6(2018), 1739-1745
Figure 6 Normal Q-Q plot of L values for category III
Figure 7 L values for all three categories (I-acceptable, II-unacceptable, III-
impurities) for red channel (r). After the results for parameters are summerized: the
color ratio does not differ significantly but there was a statistically significant difference of parameter L between categories as determined by one-way ANOVA for R channel (F(2,81) = 33,2088, p = 2,93×10⁻¹¹), for G channel ((F(2,81) = 14,208, p = 5,1×10−06) and for B channel ((F(2,81) = 14,56, p = 4×10⁻⁶). It is also niticeable from the diagram in Figs. 7, 8 and 9 that there is not a significant
overlap of values for all three categories. Entropy also shows significant difference between categories for R channel (F(2,81) = 118,243, p = 9,4×10⁻²⁵), for G channel ((F(2,81) = 92,9628, p = 1,1×10⁻²¹) and for B channel (F(2,81) = 102,397, p = 6,7×10⁻²³).
Figure 8 L values for all three categories (I-acceptable, II-unacceptable, III-
impurities) for green channel (g).
Figure 9 L values for all three categories (I-acceptable, II-unacceptable, III-
impurities) for blue channel (b);
Pearson correlation coefficient was computed to assess the relationship between the average color, L and entropy. There was a positive moderate correlation between the two variables L and E for all three channels, r = 0,323. A scatter plot matrix summarizes the results (Fig. 10).
Figure 10 Scatter plot matrix of parameters Avg, L and E for red, green and blue channel
Based on these conclusions, the following criteria are
proposed: min and max values of L, Avg and E from r, g, b parameters obtained from images of raspberries that belong to category I of acceptable products, Tab. 1.
For the first check, criterion L was applied alone. For the second check, combination of L and E was chosen, whereas for the third check, combination of L and Avg was selected, the min - max ranges of values for the proposed criteria being taken from Tab. 1. The algorithm was not
checked for criteria Avg and Stdv each, because the previous work confirmed that they do not yield the appropriate result [35].
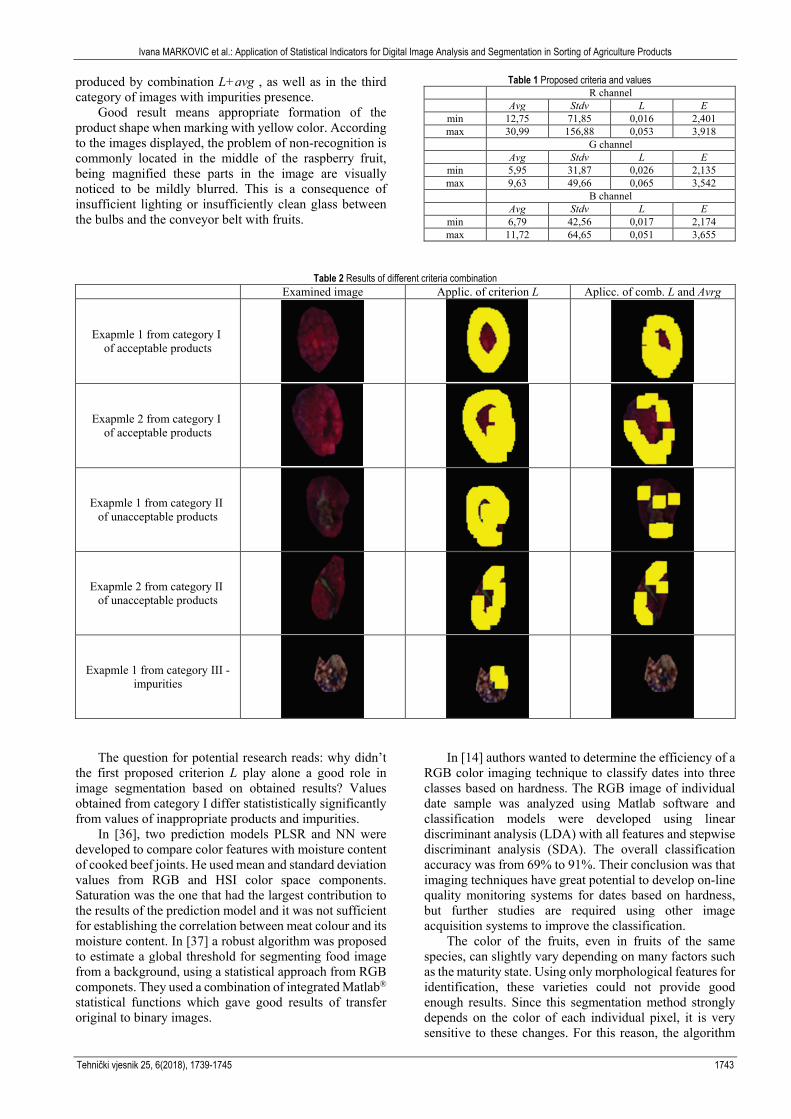
The application of criterion L alone to the images resulted in recognition of 72-91% of good quality product, whereas the application of combination L and Avg varied a lot, from 30 to 87%. In the application to the second group of images, with damaged fruits, better results were
Ivana MARKOVIC et al.: Application of Statistical Indicators for Digital Image Analysis and Segmentation in Sorting of Agriculture Products
Tehnički vjesnik 25, 6(2018), 1739-1745 1743
produced by combination L+avg , as well as in the third category of images with impurities presence.
Good result means appropriate formation of the product shape when marking with yellow color. According to the images displayed, the problem of non-recognition is commonly located in the middle of the raspberry fruit, being magnified these parts in the image are visually noticed to be mildly blurred. This is a consequence of insufficient lighting or insufficiently clean glass between the bulbs and the conveyor belt with fruits.
Table 1 Proposed criteria and values R channel Avg Stdv L E
min 12,75 71,85 0,016 2,401 max 30,99 156,88 0,053 3,918
G channel Avg Stdv L E
min 5,95 31,87 0,026 2,135 max 9,63 49,66 0,065 3,542
B channel Avg Stdv L E
min 6,79 42,56 0,017 2,174 max 11,72 64,65 0,051 3,655
Table 2 Results of different criteria combination Examined image Applic. of criterion L Aplicc. of comb. L and Avrg
Exapmle 1 from category I of acceptable products
Exapmle 2 from category I of acceptable products
Exapmle 1 from category II of unacceptable products
Exapmle 2 from category II of unacceptable products
Exapmle 1 from category III - impurities
The question for potential research reads: why didn’t the first proposed criterion L play alone a good role in image segmentation based on obtained results? Values obtained from category I differ statististically significantly from values of inappropriate products and impurities.
In [36], two prediction models PLSR and NN were developed to compare color features with moisture content of cooked beef joints. He used mean and standard deviation values from RGB and HSI color space components. Saturation was the one that had the largest contribution to the results of the prediction model and it was not sufficient for establishing the correlation between meat colour and its moisture content. In [37] a robust algorithm was proposed to estimate a global threshold for segmenting food image from a background, using a statistical approach from RGB componets. They used a combination of integrated Matlab® statistical functions which gave good results of transfer original to binary images.
In [14] authors wanted to determine the efficiency of a RGB color imaging technique to classify dates into three classes based on hardness. The RGB image of individual date sample was analyzed using Matlab software and classification models were developed using linear discriminant analysis (LDA) with all features and stepwise discriminant analysis (SDA). The overall classification accuracy was from 69% to 91%. Their conclusion was that imaging techniques have great potential to develop on-line quality monitoring systems for dates based on hardness, but further studies are required using other image acquisition systems to improve the classification.
The color of the fruits, even in fruits of the same species, can slightly vary depending on many factors such as the maturity state. Using only morphological features for identification, these varieties could not provide good enough results. Since this segmentation method strongly depends on the color of each individual pixel, it is very sensitive to these changes. For this reason, the algorithm
Ivana MARKOVIC et al.: Application of Statistical Indicators for Digital Image Analysis and Segmentation in Sorting of Agriculture Products
1744 Technical Gazette 25, 6(2018), 1739-1745
needed to be trained and a new table created for every test session.
4 CONCLUSION
This paper presents the first results of the initial hypothesis that only based on color camera images it is possible to perform appropriate segmentation and recognition of the object in the image. The proposed idea and algorithm have a range of advantages and disadvantages, which gives room for further research and improvement. The results showed that the color and morphological feature, as entropy, alone were not able to recognize good from bad product with high accuracy. However, the combination of these two features certainly can show acceptable results. For future research, it is necessary to carry out more experiments using a larger number of samples and different storage conditions to achieve a more complete study. Plans for future research include peas, broad beans, sweet corn, with additional studies on how to accelerate the recognition process itself as well as its implementation in ready application. One of the questions that could be of interest for future research is whether based on L criterion combined with one morphological trait more, it is possible to make a range of values for various agricultural products, and based on them, the machine can probably automatically recognize the product underneath the camera. Acknowledgements
This paper is the result of research project ‘Research and development of equipment and systems for industrial production, storage and processing of fruits and vegetables’ partially funded by the Ministry of Science and Technological Development, Republic of Serbia. Project No TR35043, for the period 2011-2017. 5 REFERENCES [1] Costa, C., Antonucci, F., Pallottino, F., Aguzzi, J., Sun, D.
W., & Menesatti, P. (2011). Shape analysis of agricultural products: A review of recent research advances and potential application to computer vision. Food and Bioprocess Technology, 4(5), 673-692, https://doi.org/10.1007/s11947-011-0556-0
[2] Teena, M., Manickavasagan, A., Mothershaw, A., El Hadi, S., Jayas, D. S. (2013). Potential of machine vision techniques for detecting fecal and microbial contamination of food products: A review. Food and Bioprocess Technology, 6(7), 1621-1634, https://doi.org/10.1007/s11947-013-1079-7
[3] Markovic, D., Mladenovic, N., Simonovic, V., Markovic, I., & Stevanovic, M. S. (2014). Fruit flow calculation on the rotating sizing machines, Technical Gazette, 21(3), 645-650.
[4] Brosnan, T. & Sun, D. W. (2002). Inspection and grading of agricultural and food products by computer vision systems – a review. Computers and Electronics in Agriculture, 36, 193-213. https://doi.org/10.1016/S0168-1699(02)00101-1
[5] Du C. J. & Sun, D. W. (2004). Recent developments in the applications of image processing techniques for food quality evaluation. Trends in Food Science & Technology, 15, 230-249. https://doi.org/10.1016/j.tifs.2003.10.006
[6] Moreda, G. P., Ortiz-Cañavate, J., García-Ramos, F. J., & Ruiz-Altisent, M. (2009). Non-destructive technologies for fruit and vegetable size determination – a review. Journal of Food Engineering, 92, 119-136. https://doi.org/10.1016/j.jfoodeng.2008.11.004
[7] Patel, K., Kar, A., Jha, S., & Khan, M. (2012). Machine vision system: A tool for quality inspection of food and agricultural products. J Food Sci Technol, 49(2), 123-141. https://doi.org/ 10.1007/s13197-011-0321-4
[8] Zhang, B., Huang, W., Li, J., Zhao, C., Fan, S., Wu, J., & Liu, C. (2014). Principles, developments and applications of computer vision for external quality inspection of fruits and vegetables: A review. Food Research International, 62, 326-343. https://doi.org/10.1016/j.foodres.2014.03.012
[9] Nicolai, B. M., Beullensa, K., Bobelyna, E., Peirs, A., Saeysa, W., Theronb, I. K., & Lammertyna, J. (2007). Nondestructive measurement of fruit and vegetable quality by means of NIR spectroscopy: A review. Postharvest Biology and Technology, 46, 99-118. https://doi.org/10.1016/j.postharvbio.2007.06.024
[10] Vibhute, A. & Bothe, S. K. (2012). Applications of Image Processing in Agriculture: A Survey. International Journal of Computer Applications, 52(2), 34-40. https://doi.org/10.5120/8176-1495
[11] Qin, J. W., Chao, K. L., Kim, M. S., Lu, R. F., & Burks, T. F. (2013). Hyperspectral and multispectral imaging for evaluating food safety and quality. Journal of Food Engineering, 118(2), 157-171. https://doi.org/10.1016/j.jfoodeng.2013.04.001
[12] Huang M., Wang Q., Zhang M., & Zhu Q. (2014). Prediction of color and moisture content for vegetable soybean during drying using hyperspectral imaging technology. Journal of Food Engineering, 128, 24-30, https://doi.org/10.1016/j.jfoodeng.2013.12.008
[13] Yap, M., Warnakulasuriya, M. A. D. B. F., Brennan, S. C., Jayasena, V., & Coorey, R. (2017). The effects of banana ripeness on quality indices for puree production. LWT - Food Science and Technology, 80, 10-18. https://doi.org/10.1016/j.lwt.2017.01.073
[14] Manickavasagan, A., Al-Mezeini, N., & Al-Shekaili, H. (2014). RGB color imaging technique for grading of dates. Scientia Horticulturae, 175, 87-94. https://doi.org/10.1016/j.scienta.2014.06.003
[15] Francisco, J. R. P., Gordillo, M., Lourdes G. M., & Francisco J. H. (2013). Analysis of food appearance properties by computer vision applying ellipsoids to colour data. Computers and Electronics in Agriculture, 99, 108-115. https://doi.org/10.1016/j.compag.2013.08.027
[16] Hasankhani, R. & Navid, H. (2012). Qualitative Sorting of Potatoes by Color Analysis in Machine Vision System. Journal of Agricultural Science, 4(4), 129-134. https://doi.org/10.5539/jas.v4n4p129
[17] López-García, F., Andreu-García, G., Blasco, J., Aleixos, N., & Valiente, J. (2010). Automatic detection of skin defects in citrus fruits using a multivariate image analysis approach. Computers and Electronics in Agriculture, 71(2), 189-197. https://doi.org/10.1016/j.compag.2010.02.001
[18] Liming, X. & Yanchao, Z. (2009). Automated strawberry grading system based on image processing. Computers and Electronics in Agriculture, 71, 32-39. https://doi.org/10.1016/j.compag.2009.09.013
[19] Steenoek, L., Misra, M., Hurburgh, J., & Bern, C. (2001). Implementing a computer vision system for corn kernel damage evaluation, Applied Engineering in Agriculture, 17(2), 235-240. https://doi.org/10.13031/2013.5448
[20] Pan, R., Zhang, W., Yang, S., & Xiao, Y. (2014). A state entropy integrated with BSC and ANP for supplier evaluation and selection. International Journal of Simulation Modeling, 13(3), 348-363. https://doi.org/ 10.2507/IJSIMM13(3)CO13
Ivana MARKOVIC et al.: Application of Statistical Indicators for Digital Image Analysis and Segmentation in Sorting of Agriculture Products
Tehnički vjesnik 25, 6(2018), 1739-1745 1745
[21] Kapur, J., Sahoo, P., & Wong, A. (1985). A New Method for Gray-Level Picture Thresholding Using the Entropy of the Histogram. Computer vision, graphics, and image processing, 29, 273-285. https://doi.org/ 10.1016/0734-189X(85)90125-2
[22] Hannah, I., Patel, D., & Davies, R. (1995). The use of variance and entropic thresholding methods for image segmentation. Pattern Recognition, 28(8), 1135-1143. https://doi.org/10.1016/0031-3203(94)00180-T
[23] Chang, C., Du, Y., Wang, J., Guo, S., & Thouin, P. (2006). Survey and comparative analysis of entropy and relative entropy thresholding techniques. IEE Proc.-Vis. Image Signal Process., 153(6), 837-850. https://doi.org/10.1049/ip-vis:20050032
[24] Mendoza, F., Dejmek, P., & Aguilera, J. (2007). Colour and image texture analysis in classification of commercial potato chips. Food Research International, 40, 1146-1154. https://doi.org/10.1016/j.foodres.2007.06.014
[25] Przystalski, K. & Ogorzałek, J. M. (2017). Multispectral skin patterns analysis using fractal methods. Expert Systems with Applications, 88, 318-326. https://doi.org/10.1016/j.eswa.2017.07.011
[26] Backes, A. R., Casanova, D., & Bruno, M. O. (2012). Color texture analysis based on fractal descriptors. Pattern Recognition, 45, 1984-1992. https://doi.org/10.1016/j.patcog.2011.11.009
[27] Nayaka, R. S. & Mishr, J. (2016). An improved method to estimate the fractal dimension of colour images. Perspectives in Science, 8, 412-416. https://doi.org/10.1016/j.pisc.2016.04.092
[28] Piechaczek, M. & Mianowski, A. (2017). Coke optical texture as the fractal object. Fuel, 196, 59-68. https://doi.org/10.1016/j.fuel.2017.01.081
[29] Radovanovic, R. & Popov-Raljić J. (2000). Sensory analysis of foodstuffs, University of Belgrade, Belgrade.
[30] Yam, K. & Papadakis S. (2004). A simple digital imaging method for measuring and analyzing color of food surfaces. Journal of Food Engineering, 61, 137-142. https://doi.org/10.1016/S0260-8774(03)00195-X
[31] Mendoza, F., Dejmek, P., & Aguilera, J. (2006). Calibrated color measurements of agricultural foods using image analysis. Postharvest Biology and Technology, 41, 285-295. https://doi.org/10.1016/j.postharvbio.2006.04.004
[32] Kumar, V. & Gupta, P. (2012). Importance of Statistical Measures in Digital Image Processing. International Journal of Emerging Technology and Advanced Engineering, 2(8), 56-62. https://doi.org/10.1.1.366.2595
[33] Girolami, A., Napolitano, F., Faraone, D., & Braghieri, A. (2013). Measurement of meat color using a computer vision system. Meat Science, 93, 111-118. https://doi.org/10.1016/j.meatsci.2012.08.010
[34] Arzate-Vázquez, I., Chanona-Pérez, J. J., Perea-Flores, M. J., Calderón-Domínguez, G., Moreno-Armendáriz, M. A., Calvo, H., Godoy-Calderón, S., Quevedo, R., & Gutiérrez-López, G. (2011). Image Processing Applied to Classification of Avocado Variety Hass (Persea americana Mill.) During the Ripening Process. Food Bioprocess Technologies, 4, 1307-1313. https://doi.org/10.1007/s11947-011-0595-6
[35] Markovic, I., Ilic, J., Markovic, D., Simonovic, V., & Kosanic, N. (2013). Color measurement of food products using CIE L*a*b* and RGB color space. Journal of Hygienic Engineering and Design, 4, 50-53.
[36] Zheng, C., Sun, D. W., & Zheng, L. (2006). Correlating colour to moisture content of large cooked beef joints by computer vision. Journal of Food Engineering, 77, 853-863. https://doi.org/10.1016/j.jfoodeng.2005.08.013
[37] Mery, D. & Pedreschi, F. (2005) Segmentation of color food images using a robust algorithm. Journal of Food Engineering, 66, 353-360. https://doi.org/10.1016/j.jfoodeng.2004.04.001
Contact information: Ivana MARKOVIC, MSc, Teaching Assistant (Corresponding author) Faculty of Mechanical Engineering Kraljcie Marije 16, 11000 Belgrade, Serbia [email protected] dr Dragan MARKOVIC, PhD, Full Professor Faculty of Mechanical Engineering Kraljcie Marije 16, 11000 Belgrade, Serbia [email protected] dr Jelena ILIC, PhD, Full Professor Faculty of Mechanical Engineering Kraljcie Marije 16, 11000 Belgrade, Serbia [email protected] dr Vojislav SIMONOVIC, PhD, Assistant Professor Faculty of Mechanical Engineering Kraljcie Marije 16, 11000 Belgrade, Serbia [email protected] dr Emil VEG, PhD, Assistant Professor Faculty of Mechanical Engineering Kraljcie Marije 16, 11000 Belgrade, Serbia [email protected] dr Goran ŠINIKOVIĆ, PhD, Assistant Professor Faculty of Mechanical Engineering Kraljcie Marije 16, 11000 Belgrade, Serbia [email protected] dr Nenad GUBELJAK, PhD, Full Professor University of Maribor, Facutly of Mechanical Engineering Smetanova 17, 2000 Maribor, Slovenia