application of the electrical resistivity … · application of the electrical resistivity method...
TRANSCRIPT

Acta Geodyn. Geomater., Vol. 14, No. 2 (186), 221–234, 2017
DOI: 10.13168/AGG.2017.0005
journal homepage: https://www.irsm.cas.cz/acta
ORIGINAL PAPER
APPLICATION OF THE ELECTRICAL RESISTIVITY METHOD IN ASSESSING SOIL FOR THE FOUNDATION OF BRIDGE STRUCTURES: A CASE STUDY FROM THE
WARSAW ENVIRONS, POLAND
Sebastian KOWALCZYK 1) *, Piotr ZAWRZYKRAJ 1), and Maciej MAŚLAKOWSKI 2)
1) Faculty of Geology, University of Warsaw, ul. Żwirki i Wigury 93, 02-089 Warszawa, Poland
2) Faculty of Civil Engineering, Warsaw University of Technology, ul. Armii Ludowej 16, 00-637 Warszawa, Poland
*Corresponding author‘s e-mail: [email protected]
ABSTRACT
The paper presents an application of the geoelectrical method in organic soils occurring in thearea of a designed investment. Two techniques have been applied: electrical resistivity imaging(ERI) and measurements with a resistivity cone penetration test (RCPT). ERI measurementsmade using Schlumberger and gradient arrays have allowed to obtain a two-dimensional imageof resistivity variability in the soil medium. RCPT measurements have enabled an accurateobservation of vertical changes in electrical resistivity (or conductivity) in the soil medium inselected measurement points. Electrical resistivity is a physical parameter that may reflect thevariability of the geological medium with regard to lithology if the range of conductivity ofwater filling the pore space is narrow. When it is properly calibrated with borehole data, ERIinterpretation allows to determine the boundaries between different soil layers. Adaptation of the“cumulative resistivity” method to RCPT data enabled to distinguish layers characterized bydifferent physical properties and corresponding to boundaries of geological-engineering layers.ERI and RCPT measurements conducted during expressway construction have contributed to therecognition of soils of low bearing capacity such as organic soils (peats, gyttja and aggradatemuds).
ARTICLE INFO
Article history:
Received 21 October 2016 Accepted 13 February 2017 Available online 9 March 2017
Keywords: Electrical resistivity imaging (ERI) Resistivity cone penetration test (RCPT) Engineering geological and geotechnicalmethods Peat Gyttja Organic soils Civil-engineering application
2004; Kowalczyk and Mieszkowski, 2011; Comas etal., 2015; Walter et al., 2016) and at present morefrequently for recognizing the extent of organic soilsin the foundations of designed investments(Maślakowski et al., 2014a; Pasierb and Nawrocki,2015). Electrical resistivity imaging (ERI) is oftenused in the recognition of complex geologicalconditions in investigations of the foundations ofroads and motorways (Ganerød et al., 2006;Maślakowski et al., 2014a; Ngan-Tillard et al., 2010;Osinowo et al., 2011; Wisén et al., 2008; Kowalczyket al., 2017).
The investigations presented in this paper werefocused on an attempt to identify and characterize thelateral extent of organic soils occurring withina designed road investment using the electricalresistivity method. This aim was accomplished byapplying electrical resistivity imaging (ERI) indifferent measurement arrays (Schlumberger (Dahlinand Zhou, 2004; Loke et al., 2013), gradient withmultiple current-electrode combinations (Dahlin andZhou, 2004, 2006; Loke et al., 2013)) and a resistivitycone penetration test (RCPT) (Daniel et al., 1999;Dahlin et al., 2004; Cai et al., 2016). Theinterpretation of geoelectrical measurements wasbased on geological data collected from boreholes.
INTRODUCTION
The selection of appropriate research methods isparticularly important in the recognition of areas witha complex geological structure. In such areas, theapplication of a multidisciplinary approach usinggeophysical methods is recommended by Ercoli et al.(2012) and Zini et al. (2015). The application oftraditional geotechnical and geological-engineeringresearch methods (boreholes, dynamic and staticprobing, etc.) supplying point data, coupled withgeophysical methods (ground-penetrating radar,electrical resistivity imaging) allowing for a quasi-continuous record of physical changes in the soilmedium, enables obtaining complementary results forthe correct recognition of the soil-water conditions(Kowalczyk and Mieszkowski, 2011; Pierwoła et al.,2011; Maślakowski et al., 2014a; Kowalczyk et al.,2017).
The investigations presented in this paper havebeen conducted in the Raszynka River valley, whichhas adapted melt-out hollows and a glacial water flowfor its course. The depressions were successivelyfilled with organic sediments, becoming muchshallower and currently represent peat plains.Geoelectrical methods are used in the studies ofpeatlands (Slater and Reeve, 2002; Comas et al.,
Cite this article as Kowalczyk S, Zawrzykraj P, Maślakowski M: Application of the electrical resistivity method in assessing soil for thefoundation of bridge structures: a case study from the Warsaw environs, Poland. Acta Geodyn. Geomater., 14, No. 2(186), 221–234, 2017. DOI: 10.13168/AGG.2017.0005

S. Kowalczyk et al.
222
ECW variation was observed. Samples of water havean ECW range between 1.3 – 1.5 mS/cm, which isa high range of conductivity for fresh water. Thepresence of aggressive carbon dioxide in thegroundwater sample has been indicated. Other wateraggressiveness (such as acidic, magnesium,ammonium, sulphate and leaching) has been notfound.
SURVEY METHOD
Two techniques using geoelectrical methodswere applied to characterize the ground. Electricalresistivity is a physical property of the medium thatdepends on several factors, such as the mineralcomposition (e.g. presence of clay minerals),structural and textural features (porosity, graincementation, compaction), water content. The amountof water in the medium and the water’s conductivityhas the strongest impact on the resistivity value.Although a large number of variables affect theresistivity values, such parameter may reflects verywell the lithological variability of the geologicalmedium. The theoretical basics of the geoelectricalmethod and its development have been described forexample by Loke (2011), Loke et al. (2013), andSamouëlian et al. (2005).
Electrical resistivity imaging (ERI) known alsoas electrical resistivity tomography (ERT) orcontinuous vertical electrical sounding (CVES),described in detail by Dahlin (1996) and Loke (2011),has been used in the investigations. ERI is a methodbased on the flow of direct current through a soil/rockmedium. The studied object is the space of thegeological medium between the most distantelectrodes used in the measurement. Measurementsare taken along the measurement line, with electrodesdistributed at the same distances with regard to eachother. In each survey, the current is introduced into thesoil by two electrodes (AB, also referred to as C1C2).Potential difference registered by the other electrodes(their number depends on the measurement array andthe number of channels supported by the equipment)is proportional to the electrical resistivity of themedium. Electrical resistivity determined from suchmeasurement is known as “apparent resistivity” andexpressed by the following formula:
a
Vk
I
Δρ = ⋅
where: aρ = apparent resistivity; k = geometric factor
for the array; VΔ = potential difference, in volts; and
I = current magnitude, in amperes. The value of apparent resistivity obtained from
such measurement does not strictly determine theelectrical resistivity of the studied medium, but wellreflects its variability. ERI measurements allow fordetermining both vertical and horizontal changes ofelectrical resistivity of the medium, with resolutionthat generally decrease with depth and depending onthe electrodes spacing, array configuration (Loke,2001).
SITE CHARACTERISTICS
The investigations were conducted in an area ofa designed section of the S8 expressway (presentlyexploited) being the access route to Warsaw from thesouth (Fig. 1a). The Raszynka River valley (righttributary of Utrata River), where the measurementswere made, incises into a denuded post-glacialplateau, characterized by the presence of outwashplains, kames, plateaux and local ice-dammed lakesfrom the Middle-Polish Glaciations (Sarnacka, 1976,1978) (Fig. 1b-c). Lake sediments from the EemianInterglacial occur in the basement of the Raszynkavalley; they represent sediments of a landlocked basinfilled with gyttja. These sediments were covered byHolocene peats, aggradate muds and fluvial sands.
The study site was restricted to an area where theMA-15 bridge construction was founded across theRaszynka valley (Fig. 1d), with a topography rangingbetween 96.7 and 99.7 MASL. According to archivaldata (Fig. 1d, black circles), the sediments of theRaszynka valley include fluvial sands and gravels,overlain by humus sands, aggradate muds and peats(Sarnacka, 1976, 1978; Wysokiński, 2004). Localpeats and aggradate muds occur also in the landlockeddepressions filled with clay. The thickness ofaggradate muds and peats is from 0.5 to 2 m, andlocally exceeds even 4.5 m (Wysokiński, 2004). Theconducted geological-engineering investigations(Fig. 1d, red circles and triangles) have confirmed thepresence of complex soil-water conditions occurringin direct vicinity of the designed investment. Theground of the designed bridge construction MA-15 iscomposed of organic soils such as peats, aggradatemuds and gyttja, reaching down even to 12 m belowthe surface (Fig. 2).
Organic soils in the study area are represented bypeats, gyttja and aggradate muds. Their base isstrongly inclined towards the south-east, i.e.perpendicularly to the road axis. The ground of theMA-15 bridge construction across the Raszynka Riverrequired reinforcement along about 200 m of thedesigned expressway (km 2+150 ÷ 2+350) due to thethickness, geological setting, and type of organic soilsoccurring in the ground. At first, partial soil exchangewas planned, with removal of the remaining part oforganic soils from the ground by a loadingembankment. Eventually, the application of controlledmodulus columns (CMC) was carried out(Maślakowski et al., 2014b; Mahdavi et al., 2016).The application of this method allows for reducingground compressibility by semi-rigid soilreinforcement columns. This choice was influenced bysuch factors as large thickness and type of organicsoils (peats and gyttja), by the local geological setting,but also due to a fast construction, lack of excavatedmaterial and low settlement (Maślakowski et al.,2014b).
In general in the study area, groundwaterstabilizes at about 88.0 MASL and is confined by theoverlying peat and/or aggradate muds. Electricalconductivity of water (ECW) was estimated and the

APPLICATION OF THE ELECTRICAL RESISTIVITY METHOD IN ASSESSING SOIL FOR … .
223
Fig. 2 Geological profiles of: a) archival boreholes and results from CPT, b) boreholes drilled
during this investigation.

S. Kowalczyk et al.
224
(Bq) reflected as a dimensionless index from thefollowing formula:
2 0
o
qt
u uB
qνσ−
−=
where: 2u = pore pressure measured just behind the
cone tip; 0u = equilibrium pore pressure
(consequently, 2 0u u− = excess pore pressure, Δ )u ;
σv0 = total overburden stress. Lithology can also be estimated from resistivity
ranges of the geological medium (Stenzel andSzymanko, 1973; Palacky, 1987; Seidel and Lange,2007; Everett, 2013). The range of resistivity valuesproposed by Stenzel and Szymanko (1973) has beenused in this paper, because it refers to the mostcommon resistivity values for particular soil types inPoland (Table 2).
PHYSICAL PROPERTIES OF ORGANIC SOILS
Geological-engineering properties of soils aredependent upon: grain size composition, mineralcomposition, porosity and moisture content. In thecase of organic soils, a significant role is played bythe percentage content of organic matter, mineral partsand calcium carbonate, as well as the degree of peatdecomposition. Factors influencing the strength anddeformability of soils are their origin and geologicalhistory. Therefore, recognition of organic soilsrequires determination of their origin, followed by the
ERI measurements were conducted usinga Terrameter LS apparatus of the Swedish companyABEM equipped with 21 electrodes 1 m spaced,distributed along 4 cables. The measurements weremade along two lines on both banks of the RaszynkaRiver. On the northern bank of the river the surveyfollowed the Schlumberger and gradient arrays,whereas on the southern bank only the Schlumbergerarray was used. The apparent resistivity data from thefield investigations were processed in Res2DInv toobtain a two-dimensional (2D) model for resistivity ofthe geological medium subsurface (Loke, 1996–2002,2001; Loke and Barker, 1996; Loke et al., 2003). Thefirst step was to remove bad data points. The next stepwas to carry out an inversion procedure in order toobtain a model for a spatially varying distribution ofresistivity. Both methods available in the program (thesmooth (L2 norm) or the robust/blocky (L1 norm)inversion method) were used. The results obtainedusing the smoothness-constrained least-squaresmethod with the smoothing of model resistivity valueswere chosen for the final interpretation. The root-mean-square (RMS) error shows the adjustment of themeasured and calculated values of resistivity. Themeasured and calculated apparent resistivitypseudosections together with the model obtained bythe inversion process are shown in Figure 3. Theacquisition and processing parameters are shown inTable 1.
Measurements of soil resistivity conducted witha resistivity cone penetration test (RCPT) give high-resolution results thanks to copper ring electrodesdistributed on the electrical module of the cone,spaced 3 cm (Wenner array). During soil penetrationby the cone at a steady rate of 2 cm/s, the followingparameters were measured in relation to the depth:cone resistance qc, friction sleeve fs, pore waterpressure u2 and soil resistivity ρa. The measured qc istypically corrected for pore pressure effects (qt).Based on the friction ratio Rf, which is the ratio ofa unitary fs to qc and the measured ρa referred torelevant classifications, the lithology can be assessed(Schmertmann, 1975; Robertson et al., 1986;Młynarek et al., 1997; Robertson, 2010; Robertsonand Cabal, 2012). The index of drainage conditionsand indirectly of the type of soils occurring along thecone penetration route is the pore pressure parameter
Table 1 Summary of ERI measurements acquisition and processing parameters. Line ERI_1 ERI_2
Array type Multiple gradient Schlumberger Schlumberger Profile length [m] 80 80 60 Electrode spacing [m] 1 Number of electrodes 81 81 61 Number of measurement points 1072 1200 815 Number of points after removal of bad data points
1050 1174 806
Number of iterations 6 4 4 The RMS error [%] 2.9 2.9 2.2
Table 2 Most common resistivity values forparticular soil types in Poland (Stenzel andSzymanko, 1973).
Soil type Resistivity values most common
in Poland [Ωm] Sands of the aeration zone 250 10000 Sands of the saturation zone 80 350 Silts and loams 35 80 Clays and clayey aggradate muds below 30 Peat 8 50

APPLICATION OF THE ELECTRICAL RESISTIVITY METHOD IN ASSESSING SOIL FOR … .
225
particles, significant contribution of pores filled withwater and fine organic particles, and in the case ofcarbonate sediments (gyttja, lake chalk), a specificreaction between phytoclasts, calcium carbonate andwater (Dobak and Wyrwicki, 2000), influencing waterpermeability. Therefore recognition of the range oforganic soils is crucial. It can be aided by geophysicalprospection (Kowalczyk and Mieszkowski, 2011;Maślakowski et al., 2014a). Due to the assets of ERI,this method was included by Instruction No. 58(General Director for National Roads and Motorways,2015) to standard geological-engineering investi-gations in the recognition of foundation structure fordual carriageways. The measurements presented inthis paper have been carried out in 2014, thus prior toInstruction No. 58.
Resistivity images obtained from measurementswith gradient (Fig. 3c) and Schlumberger arrays(Fig. 3f) along the measurement line on the northernRaszynka River bank seem to be different. However,correlation of these images with geological data fromboreholes and adaptation of resistivity ranges forparticular types of soils occurring in the ground hasresulted in coinciding information from both ERImeasurements, although characterized by differentresolution.
Generally, as revealed by measurements alongline ERI_1, organic soils on saturated sands occurbelow the surface. The Schlumberger arraymeasurements allowed to obtain a deeper prospection.Such measurements indicate that a layer of cohesivesoils occurs below the saturated sands (Fig. 3f). Thisinterpretation confirms previous studies ofWysokiński (2004), according to which the top of ice-dammed soils developed as soft silty medium clay(siMCl) appears at the depth of 17.7-18.5 m (Fig. 2a –Borehole MA-15.2). The basal part of the saturatedsands most probably contains a significantcontribution of the silt fraction, which influenceslower resistivity values.
When comparing the properties of measurementarrays (Zonge et al., 2005), it becomes evident that thegradient array is characterized by a much higherlateral resolution than the Schlumberger array. TheSchlumberger array is applied to determine thevertical variation whereas the gradient array is suitablerather for mapping of geologic structures. This isconfirmed by measurements made using these arraysalong line ERI_1 (Fig. 3c and 3f). In the image fromthe gradient array, a 1 m thick layer with resistivitybetween 20 and 40 Ωm is visible directly below thesurface. This layer is correlated with peat. In theWNW part of the profile, this layer overlies a layerwith resistivity at 80 to 150 Ωm, corresponding tosaturated sands. Next, between the 22 and 44 m of themeasurement line, the peat layer lies on soilsidentified as organic sands or sands interbedded withorganic soils, such as gyttja and aggradate muds. Thislayer is characterized by resistivity at 60-80 Ωm.A further part of the measurement line shows thepresence of a layer with resistivity at 40-60 Ωm,
subdivision of each genetic group with regard to theorganic matter content. Physical and mechanicalparameters, significant for foundation structures onorganic soils, vary not only with regard to the organicmatter content but also to the properties reflectingdepositional conditions and later postdepositionalprocesses (Myślińska, 1999, 2003).
A detailed review of the engineering propertiesof peat, including physical and mechanical parametersand also the permeability has been presented byHobbs (1986). Peats are soils with highcompressibility. Studies of these soils from differentparts of Poland indicate that peats are characterized bythe compression modulus in the range of 0.1-3.5 MPa,most commonly 0.5-0.9 MPa (Myślińska, 2001). Thecompression modulus for peats from Wisconsin(USA) and north-eastern China, referred to by Yangand Liu (2016), are in the range of 0.8-1.1 MPa and1.0-5.0 MPa, respectively, and usually attain values at1.0-3.0 MPa. In comparison to peats, thecompressibility of gyttja is much higher, and thecompression modulus for different parts of Poland arein the range of 0.1-2.5 MPa, usually at 0.2-0.7 MPa(Myślińska, 2001). The mechanical parameters oforganic soils may increase with time. Oldersediments, in effect of early diagenetic changes, mayreveal larger stiffness, exceeding 5 MPa(Pietrzykowski, 2011). However, these soils infoundation structures are treated as soils of lowbearing capacity and require reinforcement orreplacement (Ulusay et al., 2010; Lechowicz andSzymański, 2002a and b; Madaschi and Gajo, 2015).
As mentioned above, the foundation of the studyarea includes Eemian gyttja, and Holocene peats andaggradate muds. Basic determinations of the physicalproperties have been conducted for these soils. Thecollected peat samples had an amorphous structure.The values of organic matter content (9.1 to 28.9 %)indicate that some soils (samples) should be classifiedas aggradate muds. The studied samples of these soilshad CaCO3 content from 5.5 to 10.0 % and naturalmoisture content from 62 to 145 %. Samples ofcarbonate gyttja were characterized by organic mattercontent from 6.4 to 11.9 %, CaCO3 from 43.3 to75.2 % and natural moisture content from 80 to121 %. Moisture content of gyttja increased with theorganic matter content. This relationship is not linear,because the moisture content value is influenced byother components of gyttja.
RESULTS AND DISCUSSION
Borehole logs (Fig. 2) indicate that the studyarea is characterized by complex soil conditions. Thesoil layers are discontinuous, origin variable andinclude organic soils with considerable thicknesses(e.g. 11.7 m – Borehole MA-15/1). Organic soilsrepresent particularly unfavourable foundation forconstruction objects. They are characterized by highcompressibility and usually low bearing capacity.Their specific properties include low bulk density, soilskeleton containing both mineral and organic

S. Kowalczyk et al.
226
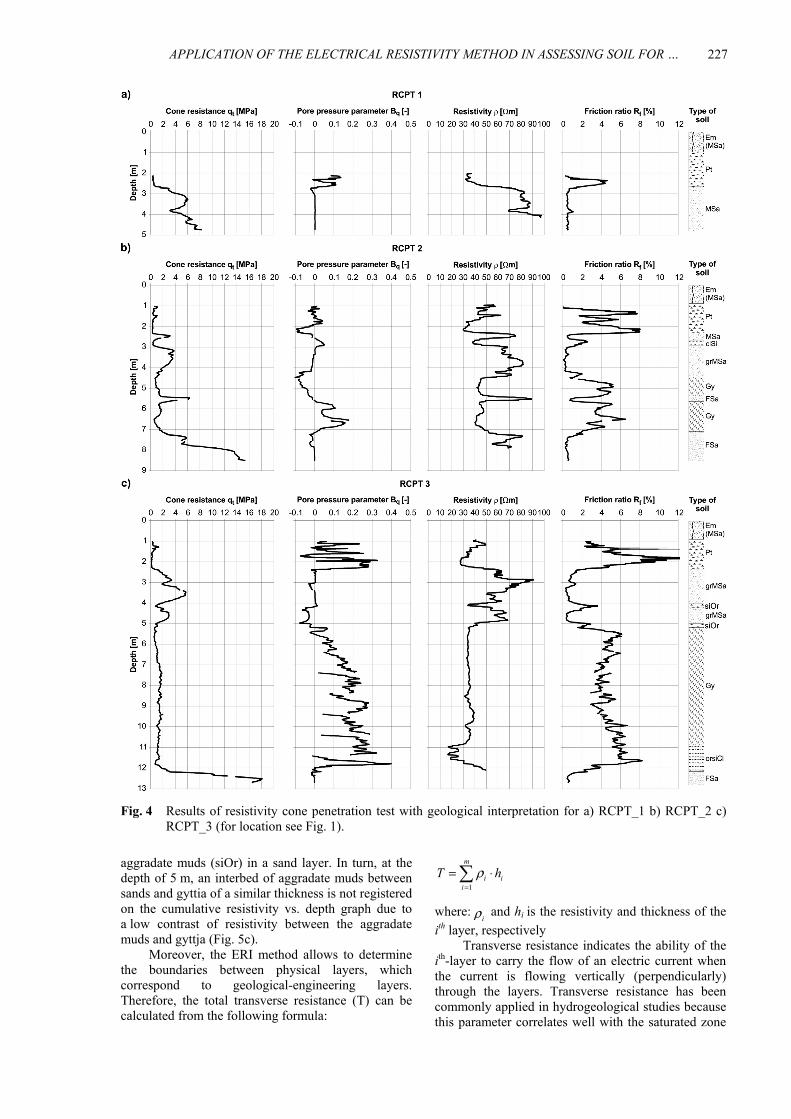
RCPT surveys allowed to assess the verticalvariability of the soil medium in selectedmeasurement points (Fig. 4, location in Fig. 1). Thevertical variability of strength and physical parameterscan be estimated based on the registered parameters.For example, ρ values registered during conepenetration and the calculated Rf allow for an accurateidentification of the subsurface zone of the geologicalmedium. Resistivity variability obtained in theinvestigations corresponds with the variability in qc,u2, and Rf. This interdependence was already observedby Dahlin et al. (2004).
Organic soils are characterized by the values ofRf above 3 %, low values of qt (usually below 1 MPa,although gyttja in RCPT_3 between 6 and 11 mattains qt values between 1 and 2 MPa), and ρ valuesbetween 30-50 Ωm. It should be pointed out that ρvalues increase with higher sand content in organicsoils and the resistivity of organic silty clay (or siCl)is lower than 30 Ωm due to the high content of clayminerals in this soil. Electrical resistivity of gyttja invertical section undergoes insignificant fluctuations,whereas peats show a high variability in verticalsection. Electrical resistivity for gyttja in RCPT_2 isat 40-50 Ωm, and in RCPT_3 at 30-40 Ωm. Thesevalues correspond to the results obtained byPietrzykowski (2008) using an resistivity cone onEemian gyttja in Warsaw, in which ρ variability wasin the range of 24-40 Ωm.
Low variability of electrical resistivity in verticalsection would indicate low variability of physicalproperties and mineralogical-lithological compositionfor gyttja, and high variability of these features in peatlayers. However, laboratory tests indicate thevariability of particular factors from several percent(organic matter content) to several tens of percent(CaCO3 content or moisture content). It should bementioned that the CPT and CPTU surveys conductedby Pietrzykowski (2011) on gyttja of the same ageoccurring within the Żoliborz subglacial tunnel valleyin Warsaw reveal high uniformity and low dispersionof results in vertical profile, whereas laboratory testshave indicated a variability of particular soilcomponents.
Electrical resistivity measured in RCPT ora different resistivity cone may be used for precisedetermination of the depth of the boundaries betweenlayers characterized by different physical properties,and usually corresponding to boundaries ofgeological-engineering layers. In this case the“cumulative resistivity” method, described by Herman(2001) can be applied. This method employs a plot ofthe sum of the apparent resistivities (Σρa) versusdepth. Change of the angle of the curve on thecumulative resistivity vs. depth graph points to thepresence of a boundary between two layers (Fig. 5).Application of this method in RCPT measurementsmay allow for distinguishing even very thin layers ifthere is significant contrast of physical properties attheir boundary. Accordingly, RCPT_3 sounding at thedepth of 4 m has revealed a 0.2 m thick layer of
corresponding to gyttja or aggradate muds. In the ESEpart of the measurement line occurs a lens of saturatedsand within the organic soils. Based on measurementswith the gradient array, it can be concluded that alongthis line, organic soils occur to the depth of about 5 m,and a layer of saturated sands is present below.Measurements made with the Schlumberger arrayalong line ERI_1 show a more generalized image ofthe occurrence of organic soils, in which lenses ofsaturated sand do not occur. These measurementsconfirm that in the ESE part of the measurement line,the thickness of organic soils is higher and there arepremises on the presence of a layer of cohesive soilsunderlying the layer of saturated sands.
On the southern bank of the Raszynka River,measurements were made only with the Schlumbergerarray. In the image of resistivity distribution (Fig. 3i),a layer of organic soils is visible directly below thesurface. Up to 40 m of the measurement line, thislayer if characterized by resistivity values at 25-40 Ωm and corresponds to peats. Between 40 and60 m of the measurement line, resistivity rangesbetween 40-60 Ωm and the layer is identified at gyttjaand/or aggradate muds. Saturated sands withresistivity at 80-100 Ωm occur below the layeridentified as peats in the WNW part of themeasurement line, whereas in the central part, thegeological medium is characterized by resistivity in aninterval of 60-80 Ωm; it is referred to sandsinterbedded with organic soils. The gyttja andaggradate mud layer in the ESE part of themeasurement line reaches a much larger thickness(over 6 m). Geological information obtained frommeasurements along line ERI_2 corresponds to thedata from the boreholes (MA-15/5 and MA-15/1 –Fig. 2a).
Summarising, the investigations by electricalresistivity imaging coupled with borehole data haveallowed for the assessment of the distribution oforganic soils located directly below the surface alongthe measurement lines. However, the method does notsupply unambiguous results for the distribution oforganic soils occurring below low-resistivity soils(Kowalczyk et al., 2015).
Surveys with application of resistivity cone ina soil medium supply detailed data on its structure(Antoniuk and Mościcki, Daniel et al., 1999; 1994;Antoniuk and Mościcki, 2001; Dahlin et al., 2004;Yoon et al., 2011; Kowalczyk et al., 2015), therelation between electrical resistivity and the claycontent (Zawrzykraj, 2005; Long et al., 2012), therelationships between electrical resistivity and soilbehavior type index Ic, relative density (Cai et al.,2016), or detect contaminated soil layers (Antoniukand Mościcki, 2001; Fukue et al., 2001; Mondelli etal., 2007; Kim et al., 2009). Moreover, the results ofsuch measurements are extremely valuable in theinterpretation of standard, surface geoelectricalsurveys, restricting the natural ambiguity of thesemethods (Antoniuk and Mościcki, 1994; Dahlin et al.,2004; Kowalczyk et al., 2015).
APPLICATION OF THE ELECTRICAL RESISTIVITY METHOD IN ASSESSING SOIL FOR … .
227
Fig. 4 Results of resistivity cone penetration test with geological interpretation for a) RCPT_1 b) RCPT_2 c)RCPT_3 (for location see Fig. 1).
1
m
i ii
T hρ=
= ⋅
where:iρ and hi is the resistivity and thickness of the
ith layer, respectively Transverse resistance indicates the ability of the
ith-layer to carry the flow of an electric current whenthe current is flowing vertically (perpendicularly)through the layers. Transverse resistance has beencommonly applied in hydrogeological studies becausethis parameter correlates well with the saturated zone
aggradate muds (siOr) in a sand layer. In turn, at thedepth of 5 m, an interbed of aggradate muds betweensands and gyttia of a similar thickness is not registeredon the cumulative resistivity vs. depth graph due toa low contrast of resistivity between the aggradatemuds and gyttja (Fig. 5c).
Moreover, the ERI method allows to determinethe boundaries between physical layers, whichcorrespond to geological-engineering layers.Therefore, the total transverse resistance (T) can becalculated from the following formula:

S. Kowalczyk et al.
228
Fig. 6 Determination of boundaries between physical layers, which correspond to the engineering geological layers based on the relationship of total transverse resistancevs. depth. Analysis based on data from electrical resistivity imaging measurements a) 40m of cross-section I-I in a Schlumberger array b) 40m of cross-section I-I in agradient array c) 70m of cross-section I-I in a gradient array.

APPLICATION OF THE ELECTRICAL RESISTIVITY METHOD IN ASSESSING SOIL FOR … .
229
engineering model. The presented analyses indicatethat RCPT should be commonly used in therecognition of the ground characterized by complexsoil conditions.
In the study area, the resistivity of organic soilsis in the range of 20-60 Ωm. In RCPT measurements,ρ was in the range of 30-50 Ωm, whereas in ERIchanged in the range of 20 to 60 Ωm. Interbeds ofsand and gyttja have averaged resistivity values forthese soils in the range of 60 to 80 Ωm. Based on thepresented data it was possible to determine the mostsignificant boundary for the foundation of the bridgeconstruction between the packet of organic soils andthe underlying fluvial sands.
ACKNOWLEDGEMENTS
The Terrameter LS apparatus, produced by theSwedish company ABEM, was purchased as part ofthe Regional Operational Program project entitled:“Modernization and equipment of the laboratories ofthe Faculty of Geology, University of Warsaw, toconduct research essential for Mazovia in the field ofenvironment geoengineering - STAGE I, No.RPMA.01.01.00-14-011/10”.
The authors express their thanks to the twoanonymous Reviewers for their valuable commentsand suggestions which contributed to improve thequality of the manuscript.
REFERENCES
Antoniuk, J. and Mościcki, J.: 1994, A method ofpenetrometer-based electrical resistivity logging -examples of applications. Przegląd Geologiczny, 42,No. 10, 857–862, (in Polish with English summary).
Antoniuk, J. and Mościcki, W.J.: 2001, Application ofgeoelectric methods into studying and protecting ofgeological environment influenced by human activity(vicinity of municipal and industrial waste dumps,settling reservoirs etc.. Geophysics in environmentalengineering and protection for needs of local self-government, Dębe near Warsaw, S. 9–31, Marzec2001, (in Polish with English summary).
Cai, G., Chu, Y., Liu, S. and Puppala, A.J.: 2016, Evaluationof subsurface spatial variability in site characterizationbased on RCPTU data. Bulletin of EngineeringGeology and the Environment, 75, No. 1, 401–412. DOI: 10.1007/s10064-015-0727-8
Comas, X., Slater, L. and Reeve, A.: 2004, Geophysicalevidence for peat basin morphology and stratigraphiccontrols on vegetation observed in a NorthernPeatland. Journal of Hydrology, 295, 173–184. DOI: 10.1016/j.hydrol.2004.03.008
Comas, X., Terry, N., Slater, L., Warren, M., Kolka, R.,Kristiyono, A., Sudiana, N., Nurjaman, D. andDarusman, T.: 2015, Imaging tropical peatlands inIndonesia using ground-penetrating radar (GPR) andelectrical resistivity imaging (ERI): implications forcarbon stock estimates and peat soil characterization.Biogeosciences, 12, 2995–3007. DOI: 10.5194/bg-12-2995-2015
Dahlin, T.: 1996, 2D resistivity surveying for environmentaland engineering applications. First Break, 14, 275–283. DOI: 10.3997/1365-2397.1996014
Dahlin, T. and Zhou, B.: 2004, A numerical comparison o2D resistivity imaging with ten electrode arrays.
of the aquifer (e.g. Salem, 1999; Singh and Singh,2016). Total transverse resistance vs. depth ispresented on the graph and change of the angle of thecurve on the graph will allow to determine the depthsof boundaries between layers characterized bydifferent physical properties (Fig. 6). Obviously, dueto measurement resolution, the layers distinguished byERI will be much less accurate than those recognizedby RCPT.
Interpretation of measurements from resistivityimaging results in some ambiguity, which increaseswith a more complex geological structure. The way toreduce this ambiguity of interpretation is integrationwith additional geophysical datasets and geologicaldata to tie the ERI sections. The integration ofresistivity from RCPT projected on the inverse modelresistivity section for ERI_2 is shown in Figure 7a.This integration provides information at differentscales and different accuracy. Nevertheless, a highconcordance may be observed for the subsurface zone,to the first boundary between layers characterized byhighly different physical properties. Boundariesbetween layers with different physical propertiesinterpreted from ERI and lithological logs interpretedfrom RCPT have been correlated with projectedboreholes and shown in Figure 7b. The boundariesinterpreted from ERI are concordant with the datafrom boreholes and RCPT interpretation. Based on thecompiled data, the boundary which is most significantfor the foundation of the bridge construction wasdetermined between the packet of organic soils andthe underlying fluvial sands.
CONCLUSIONS
The conducted surveys have allowed to confirmthe effectiveness of electrical resistivity imaging todetermine the distribution of organic soils occurringdirectly below the surface. Application of the ERImethod helps to assess the range of organic soils,providing that variability exists in the physicalproperties of organic and surrounding soils. Theresolution of the obtained distribution of resistivityimages is influenced by the applied arraymeasurements. The image of resistivity obtained fromthe measurements with a gradient array ischaracterized by a much higher lateral resolution anda shallower depth of prospection than theSchlumberger array (Fig. 3).
Surveys using the geoelectrical method haveallowed to characterize the spatial variability of thefoundation structure for a bridge. Information on thevariability of the soil foundation obtained from ERIsurveys can be correlated with point data fromboreholes. RCPT soundings enable an accuratedetermination of vertical variability in the soilmedium. Application of the “cumulative resistivity”method to RCPT allows for determining theboundaries between layers having different physicalproperties, usually corresponding to boundaries ofgeological-engineering layers. The results of RCPTmeasurements have turned out to be very useful in theinterpretation of ERI measurements and the geological

S. Kowalczyk et al.
230
subsoil. Part I. Testing methods. WydawnictwoSGGW, Warszawa, (in Polish with English summary).
Lechowicz, Z. and Szymański, A.: 2002b, Deformation andstability of embankment constructed on organicsubsoil. Part II. Calculation methods). WydawnictwoSGGW, Warszawa, (in Polish with English summary).
Loke, M.H.: 1996–2002, Tutorial: 2-D and 3-D electricalimaging surveys. Geotomo Software.
Loke, M.H.: 2001, Electrical imaging surveys forenvironmental and engineering studies. A PracticalGuide to 2-D and 3-D Surveys: RES2DINV Manual,Geotomo Software, Malaysia.
Loke, M.H. and Barker, R.D.: 1996, Rapid least squaresinversion of apparent resistivity pseudosections by aquasi-Newton method. Geophysical Prospecting, 44,131–152. DOI: 10.1071/j.1365-2478.1996.tb00142.x
Loke, M.H., Acworth, I. and Dahlin, T.: 2003, A com-parison of smooth and blocky inversion methods in2D electrical imaging surveys. ExplorationGeophysics, 34, 182–187.
Loke, M.H.: 2011, Electrical resistivity surveys and datainterpretation. In: Gupta, H. (ed.), Solid EarthGeophysics Encyclopaedia (2nd Edition) “Electricaland Electromagnetic”, Springer-Verlag, 276-283.
Loke, M.H., Chambers, J.E., Rucker, D.F., Kuras, O. andWilkinson, P.B.: 2013, Recent developments in thedirect-current geoelectrical imaging method. Journalof Applied Geophysics, 95, 135–156. DOI: 10.1016/j.japppgeo.2013.02.017
Long, M., Donohue, S., L’Heureux, J.S., Solberg, I.L.,Rønning, J.S., Limacher, R. and Lecomte, I.: 2012,Relationship between electrical resistivity and basicgeotechnical parameters for marine clays. CanadianGeotechnical Journal, 49, No. 10, 1158–1168. DOI: 10.1139/t2012-080
Madaschi, A. and Gajo, A.: 2015, One-dimensionalresponse of peaty soils subjected to a wide range ofoedometric conditions. Géotechnique, 65, No. 4, 274–286. DOI: 10.1680/geot.14.P.144
Mahdavi, H., Fatahi, B., Khabbaz, H., Vincent, P. andKelly, R.: 2016, Comparison of coupled flow-deformation and drained analyses for roadembankments on CMC improved ground. ProcediaEngineering, 143, 462–469. DOI: 10.1016/j.proeng.2016.06.058
Maślakowski, M., Kowalczyk, S., Mieszkowski, R. andJózefiak, K.: 2014a, Using Electrical ResistivityTomography (ERT) as a tool in geotechnicalinvestigation of the substrate of a highway. StudiaQuaternaria, 31, 83–89. DOI: 10.2478/squa-2014-0008
Maślakowski, M., Michalczyk, R., Józefiak, K. andSuperczyńska, M.: 2014b, The use of ControlledModulus Columns (CMC) to improve the subsoilcharacteristics -expressway S8 case study.Czasopismo Logistyka 6/2014 - DVD No. 3, 7130–7137, (in Polish with English summary).
Młynarek, Z., Tschuschke, W. and Wierzbicki, J.: 1997, Soilclassification by means of CPTU). Proc. of XI PolishConference on Soils Mechanics and FoundationEngineering, Gdańsk, 119–126, (in Polish).
Mondelli, G., Giacheti, H.L., Boscov, M.E.G., Elis, V.R.and Hamada, J.: 2007, Geoenvironmental siteinvestigation using different techniques in a municipalsolid waste disposal site in Brazil. EnvironmentalGeology, 52 (5), 871–887. DOI: 10.1007/s00254-006-0529-1
Myślińska, E.: 1999, Physical properties of peats andevaluation of methods of their determination. PrzeglądGeologiczny, 47, No. 7, 676–682, (in Polish withEnglish summary).
Geophysical Prospecting, 52, No. 5, 379–398. DOI: 10.1111/1365-2478.2004.00423.x
Dahlin, T., Garin, H. and Palm, M.: 2004, Combinedresistivity imaging and RCPT for geotechnical pre-investigation. Proc. Nordic Geotechnical Meeting(14th NGM), Ystad Sweden, C81-C88.
Dahlin, T. and Zhou, B.: 2006, Multiple-gradient arraymeasurements for multichannel 2D resistivityimaging. Near Surface Geophysics, 4, No. 2, 113–123.DOI: 10.3997/1873-0604.2005037
Daniel, C.R., Giacheti, H.L., Howie, J.A. and Campanella,R.G.: 1999, Resistivity piezocone (RCPTU) datainterpretation and potential applications. Proc. XI Pan-American Conference on Geotechnical Engineering,Igusau Falls, Brazil 1–8.
Dobak, P. and Wyrwicki, R.: 2000, Impermeable propertiesof lacustrine chalk. Przegląd Geologiczny, 48, No. 5,412–415, (in Polish with English summary).
Ercoli, M., Pauselli, C., Forte, E., Di Matteo, L., Mazzocca,M., Frigeri, A. and Federico, C.: 2012, Amultidisciplinary geological and geophysical approachto define structural and hydrogeological implicationsof the Molinaccio spring (Spello, Italy). Journal ofApplied Geophysics, 77, 72–82. DOI: 10.1016/j.jappgeo.2011.11.011
Everett, M.E.: 2013, Near-Surface Applied Geophysics.Cambridge University Press, New York, 441 pp.
Fukue, M., Minato, T., Matsumoto, M., Horibe, H. andTaya, N.: 2001, Use of a resistivity cone for detectingcontaminated soil layers. Engineering Geology, 60,361–369. DOI: 10.1016/Soo13-7952(00)00116-2
Ganerød, G.V., Rønning, J.S., Dalsegg, E., Elvebakk, H.,Holmøy, K., Nilsen, B. and Braathen, A.: 2006,Comparison of geophysical methods for sub-surfacemapping of faults and fracture zones in a section ofthe Viggja road tunnel, Norway. Bulletin ofEngineering Geology and the Environment, 65, 231–243. DOI: 10.1007/s10064-006-0041-6
General Director for National Roads and Motorways: 2015,Zarządzenie, nr 58, Generalnego Dyrektora DrógKrajowych i Autostrad z dnia 23 listopada 2015 r. wsprawie dokumentacji do realizacji inwestycji, (inPolish).
Herman, R.: 2001, An introduction to electrical resistivity ingeophysics. American Journal of Physics, 69 (9), 943–952, DOI: 10.1119/1.1378013
Hobbs, N.B.: 1986, Mire morphology and the properties andbehaviour of some foreign peats. Quarterly Journal ofEngineering Geology and Hydrogeology, 19, 7–80.DOI: 10.1144/GSL.QJEG.1986.019.01.02
Kim, Y., Oh, M. and Park, J.: 2009, Analysis of resistivitydata obtained from cone penetrometer in contaminatedsoil layers. Environmental Geology, 58, 1309–1317.DOI: 10.1007/s00254-008-1634-0
Kowalczyk, S. and Mieszkowski, R.: 2011, Determinationof a bottom layer of organic soil using geophysicalmethods at two sites on the Polish Lowland. BiuletynPaństwowego Instytutu Geologicznego, 446, 191–198,(in Polish with English summary).
Kowalczyk, S., Zawrzykraj, P. and Mieszkowski, R.: 2015,Application of electrical resistivity tomography inassessing complex soil conditions. GeologicalQuarterly, 59, No. 2, 367–372. DOI: 10.7306/gq.1172
Kowalczyk, S., Cabalski, K. and Radzikowski, M.: 2017,Application of geophysical methods in the evaluationof anthropogenic transformation of the ground: ACase study of the Warsaw environs, Poland.Engineering Geology, 216, 42–55. DOI: 10.1016/j.enggeo.2016.11.008
Lechowicz, Z. and Szymański, A.: 2002a, Deformation andstability of embankment constructed on organic

APPLICATION OF THE ELECTRICAL RESISTIVITY METHOD IN ASSESSING SOIL FOR … .
231
Schmertmann, J.H.: 1975, Measurement of in situ shearstrength. Proc., Specialty Conference on In SituMeasurement of Soil Properties: ASCE. 2. ASCE,USA, 57–138.
Seidel, K. and Lange, G.: 2007, Direct Current ResistivityMethods. In Knödel K., Lange G., Voigt H.-J. (Eds.),Environmental Geology. Springer-Verlag BerlinHeidelberg, 205–237. DOI: 10.1007/978-3-540-74671-3_8
Singh, S. and Singh, V.S.: 2016, Estimation of hydrauliccharacteristics from electrical resistivity data incoastal aquifers of southern India. Journal of theGeological Society of India, 88, No. 1, 77–86. DOI: 10.1007/s12594-016-0460-3
Slater, L.D. and Reeve, A.: 2002, Investigating peatlandstratigraphy and hydrogeology using integratedelectrical geophysics. Geophysics, 67, 365–378. DOI: 10.1190/1.1468597
Stenzel P. and Szymanko J.: 1973, Geophysical methods inhydrological and geological-engineeringinvestigations. Wydawnictwa Geologiczne,Warszawa, (in Polish).
Ulusay, R., Tuncay, E. and Hasancebi, N.: 2010, Geo-engineering properties and settlement of peaty soils atan industrial site (Turkey). Bulletin of EngineeringGeology and the Environment, 69, No. 3, 397–410.DOI: 10.1007/s10064-010-0290-2
Walter, J., Hamann, G., Lück, E., Klingenfuss, C. and Zeitz,J.: 2016, Stratigraphy and soil properties of fens:Geophysical case studies from northeastern Germany.Catena, 142, 112–125. DOI: 10.1016/j.catena.2016.02.028
Wisén, R., Christiansen, A., Dahlin, T. and Auken, E.: 2008,Experience from two resistivity inversion techniquesapplied in three cases of geotechnical siteinvestigation. Journal of Geotechnical andGeoenvironmental Engineering, 134, 1730–1742.DOI: 10.1061/(ASCE)1090-0241(2008)134:12(1730)
Wysokiński, L. (team leader): 2004, Geological andengineering documentation as part of a study of theconstruction project of construction of the expresswayon the section Salomea - Wolica linking with thenational road No. 7. Instytut Techniki Budowlanej(Building Research Institute), (unpublished, in Polish).
Yang, M. and Liu, K.: 2016, Deformation behaviors of peatwith influence of organic matter. SpringerPlus, 5, 1–18. DOI: 10.1186/s40064-016-2232-3
Yoon, H.K., Jung, S.H. and Lee, J.S.: 2011, Characterisationof subsurface spatial variability using a coneresistivity penetrometer. Soil Dynamics andEarthquake Engineering, 31, No. 7, 1064–1071. DOI: 10.1016/j.soildyn.2011.03.012
Zawrzykraj, P.: 2005, Practicability of new geoelectricalequipment for the lithological characteristic of varvedclays from Plecewice near Sochaczew (centralPoland). Przegląd Geologiczny, 53, No. 8, 677–681,(in Polish with English summary).
Zini, L., Calligaris, C., Forte, E., Petronio, L., Zavagno, E.,Boccali, C. and Cucchi, F.: 2015, A multidisciplinaryapproach in sinkhole analysis: The Quinis village casestudy (NE-Italy). Engineering Geology, 197, 132–144.DOI: 10.1016/j.enggeo.2015.07.004
Zonge, K., Wynn, J. and Urquhart, S.: 2005, Resistivity,induced polarization, and complex resistivity. In:Butler, D.K., (Ed.) Near-surface geophysics.Investigation in geophysics. No. 13, Society ofExploration Geophysicists, 265–300.
Myślińska, E.: 2001, Organic soils and laboratory methodsfor their testing. Wydawnictwo Naukowe PWN,Warszawa, (in Polish).
Myślińska, E.: 2003, Classification of organic soils forengineering geology. Geological Quarterly, 47, No. 1,39–42.
Ngan-Tillard, D., Venmans, A., Slob, E. and Mulder, A.:2010, Total engineering geology approach applied tomotorway construction and widening in theNetherlands: Part II: Pilot site in tidal deposits.Engineering Geology, 114, 171–180. DOI: 10.1016/j.enggeo.2010.04.015
Osinowo, O.O., Akanji, A.O. and Akinmosin, A.: 2011,Integrated geophysical and geotechnical investigationof the failed portion of a road in Basement Complexterrain, southwestern Nigeria, RMZ. Materials andGeoenvironment, 58, 143–162.
Palacky, G.J.: 1987, Clay mapping using electromagneticmethods. First Break, 5, 295–306. DOI: 10.3997/1365-2397.1987015
Pasierb, B. and Nawrocki, W.: 2015, A study of bedrockgeological structure of the ARENA object in Kraków-Czyżyny using geophysical methods to detect thepresence of organic soil. Przegląd Geologiczny, 63,No. 5, 289–294, (in Polish with English summary).
Pierwoła, J., Badera, J. and Mirkowski, Z.: 2011,Identification of geotechnical conditions in areas offormer shallow mining activity using geoelectricalmethods. In: Idziak, A.F. and Dubiel R. (Eds.):Geophysics in Mining and Environmental Protection,Springer Berlin Heidelberg, 91–100. DOI: 10.1007/978-3-642-19097-1_9
Pietrzykowski, P.: 2008, Electrical methods in geologicaland engineering investigations of interglacialcalcareous and organic sediments from Warsaw.Geologija, 50 (Supplement), S95–S100. DOI: 10.2478/v10056-008-0032-3
Pietrzykowski, P.: 2011, Eemian gyttja and lacustrine chalkfrom Warsaw as an example of ”hard” organic soils.Biuletyn Państwowego Instytutu Geologicznego, 446,No. 2, 385–396, (in Polish with English summary).
Robertson, P.K.: 2010, Soil behaviour type from the CPT:an update. 2nd International Symposium on ConePenetration Testing, CPT'10, Huntington Beach, CA,USA.
Robertson, P.K., Campanella, R.G., Gillespie, D. and Greig,J.: 1986, Use of piezometer cone data. Use of In SituTests in Geotechnical Engineering. Proceedings of InSitu '86, Blacksburg, Specialty Publication, 1263–1280.
Robertson, P.K. and Cabal K.L.: 2012, Guide to ConePenetration Testing for Geotechnical Engineering.Gregg Drilling and Testing, Inc, Signal Hill,California, US., 5th Edition.
Salem, H.S.: 1999, Determination of fluid transmissivityand electric transverse resistance for shallow aquifersand deep reservoirs from surface and well-log electricmeasurements. Hydrology and Earth System Sciences,3, 421–427.
Samouëlian, A., Cousin, I., Tabbagh, A., Bruand, A. andRichard, G.: 2005, Electrical resistivity survey in soilscience: a review. Soil and Tillage Research, 83, 173–193. DOI: 10.1016/j.still.2004.10.004
Sarnacka, Z: 1976, Detailed geological map of Poland1:50,000. Sheet Raszyn (559). WydawnictwaGeologiczne, Warszawa, (in Polish).
Sarnacka, Z.: 1978, Explanation to detailed geological mapof Poland 1:50, 000. Sheet Raszyn (559).Wydawnictwa Geologiczne, Warszawa, (in Polish).

S. Kowalczyk et al.: APPLICATION OF THE ELECTRICAL RESISTIVITY METHOD IN …
Fig. 1 Study area a) satellite image with study area marked (www.maps.google.com; adopted), b) position ofthe study area on the map of Poland, c) fragment of geomorphological map (after Sarnacka, 1976), d)location of the survey.

S. Kowalczyk et al.: APPLICATION OF THE ELECTRICAL RESISTIVITY METHOD IN …
Fig. 3 Results of ERI survey. Measured [a), d), g)] and calculated [b), e), h)] apparent resistivity pseudosections and inversemodel resistivity sections with interpretation [c), f), i)] of cross-section I-I in a gradient array, in a Schlumberger array andcross-section II-II in a Schlumberger array, respectively; j) resistivity scale (for location see Fig. 1).

S. Kowalczyk et al.: APPLICATION OF THE ELECTRICAL RESISTIVITY METHOD IN …
Fig. 7 Interpretation of obtained data. a) Resistivity from RCPT projected on an inverse model resistivitysection for ERI_2. b) Block diagram showing the generalized geological model.