application of the hines value chain model by the kenya
TRANSCRIPT

APPLICATION OF THE HINES VALUE CHAIN MODEL BY THE KENYA MEDICAL SUPPLIES AGENCY
Marete Phyllis Kinanu
A Management Research Project Submitted In Partial Fulfilment of The Requirements of The Master of Business Administration Degree,
Department of Business Administration, University Of Nairobi
2010
DECLARATION
This management research project is my original work and has not been presented to this
or any other University for an academic award.
Signature..?: Date... (.6.1.!!. I.SrP.i.O
Marete Phyllis Kinanu
This management research project has been submitted for examination with my approval
as the University supervisor.
Lecturer, Department of Business Administration
School of Business
University of Nairobi
Datel £ _ i i _ i o
11

DEDICATIONThis work is dedicated to my lovely husband Mr. Muchiri for your support and to my
dear son Avidan for your patience and understanding while I was not available when you
needed me most.
m

ACKNOWLEGMENTS
I would like to thank the almighty God for his continued strength, guidance and
sufficient grace throughout the entire course. My appreciation and gratitude to my
supervisor Mr. Eliud O. Mududa for his assistance support on project supervision,
guidance, time and his valuable ideas for this study.
To my family, parents, friends and classmates who have given me intellectual and
emotional support. My most gratitude goes to my lovely husband and dear son for their
consistent support, inspiration and encouragement throughout the course programme.
Finally my sincere thanks goes to the KEMSA employees who graciously gave their time
to fill the research instrument and also to all those who directly or indirectly contributed
to this work.
IV

TABLE OF CONTENTSDECLARATION.................................................................................................................ii
DEDICATION....................................................................................................................iii
ACKNOWLEGMENTS.....................................................................................................iv
LIST OF TABLES........................................................................................................... viii
LIST OF FIGURES............................................................................................................ix
LIST OF ABBREVIATIONS..............................................................................................x
ABSTRACT.......................................................................................................................xi
CHAPTER ONE: INTRODUCTION........................................................ 1
1.1 Background of the Study.......................................................................................... 1
1.1.1 Value Chain Models..........................................................................................3
1.1.2 Public Health Facilities (PHFs) /Institutions in Kenya.....................................5
1.1.3 The Kenya Medical Supplies Agency (KEMSA).............................................6
1.2 Problem Statement...................................................................................................9
1.2 Research Objectives............................................................................................... 12
1.4 Importance of the Study.......................................................................................... 12
CHAPTER TWO: LITERATURE REVIEW......................................... 13
2.1 The Concept of Value Chain.................................................................................. 13
2.2 Michael Porter’s Value Chain Model................................................................... 15
2.2.1 Primary Activities.......................................................................................... 17
2.2.2 Support Activities........................................................................................... 19
2.3 Hines’s Value Chain Model...................................................................................20
2.3.1 Hines’s Micro Integrated Materials Value Pipeline........................................21
v

2.3.2 Hines’s Macro Ten Force Partnership Model.................................................24
2.3.3 Important Features of Hines Model................................................................25
2.4 Value Chain Analysis............................................................................................26
2.4.1 Cost Strategies.................................................................................................27
2.4.2 Differentiation Strategies................................................................................29
2.4.3 The Main Steps in Value Chain Analysis.......................................................30
2.5 The Value Chain and Competitive Advantage......................................................30
2.6 Theoretical Framework..........................................................................................31
2.7 The Conceptual Framework..................................................................................33
CHAPTER THREE: RESEARCH METHODOLOGY......................... 34
3.1 Research Design....................................................................................................34
3.2 Data Collection......................................................................................................34
3.3 Operationalizing Value Chain Model Parameters................................................35
3.4 Data analysis..........................................................................................................35
CHAPTER FOUR: DATA ANALYSIS, RESULTS AND DISCUSSION
.............................................................................................................36
4.1 Introduction...........................................................................................................36
4.2 Extent of Adoption of the Hines’s Chain Model by KEMSA.............................. 36
4.2.1 System of Supply Process.............................................................................. 36
4.2.2 Structure and Direction..................................................................................37
4.2.3 Primary Activities..........................................................................................38
4.2.4 Secondary Activities.......................................................................................38
4.3 Challenges Associated with the Adoption of the Hines’s Value Chain Model......39
vi

4.4 Benefits of Adopting the Hines’s Value Chain Model over the Porters Model......40
4.4.1 Drawbacks of the Porter’s Value Chain Model..............................................40
CHAPTER FIVE: SUMMARY, CONCLUSION AND
RECOMMENDATIONS............................................................................ 42
5.1 Introduction...........................................................................................................42
5.2 Summary...............................................................................................................42
5.3 Conclusion............................................................................................................45
5.4 Recommendations..................................................................................................47
5.5 Limitations of the Study.......................................................................................50
5.6 Suggestions for Further Research.........................................................................50
REFERENCES............................................................................................ 51
APPENDICES............................................................................................. 55
APPENDIX I: LETTER OF INTRODUCTION...............................................................55
APPENDIX II: INTERVIEW GUIDE..............................................................................56
APPENDIX III: OPERATIONALIZATION OF THE ADOPTION OF THE HINES’S
VALUE CHAIN MODEL.................................................................................................60
APPENDIX IV: PUBLIC HEALTH FACILITIES SUPPLIED BY KEMSA................ 62
APPENDIX V: ESSENTIAL MEDICINES LIST............................................................63
vii

LIST OF TABLES
Table 2.1: Porters and Hines model contrasted 26
vm

LIST OF FIGURES
Figure 2.1: Michael Porter’s value chain model......................................................... 16
Figure 2.2: Hines’s micro integrated materials value pipeline.....................................22
Figure 2.3: Hines’s macro ten force partnership model...............................................24
Figure 2.4: The Conceptual framework.......................................................................33
IX
LIST OF ABBREVIATIONS
k e m sa - Kenya Medical Supplies Agency
SCM - Supply Chain Management
MOH - Ministry of Health
NGO - Non Governmental Organization
KNH - Kenyatta National Hospital
NHSSP - National Health sector Strategic Plan
PHF - Public Health Facility
PPDA - Public Procurement and Disposal Act
PPDR - Public Procurement and Disposal Regulations
RHF - Rural Health Facility
FIRM - Human Resource Management
ABC - Activity Based Costing
TQM - Total Quality management
EDI - Electronic Data Manufacturer
OEM - Original Equipment manufacturer
SA Supplier Association
MOMS- Ministry of Medical Services
MOPHS- Ministry of Public Health and Sanitation
EML - Essential Medicines List
MEDS- Missions for Essential Drugs Supply
x
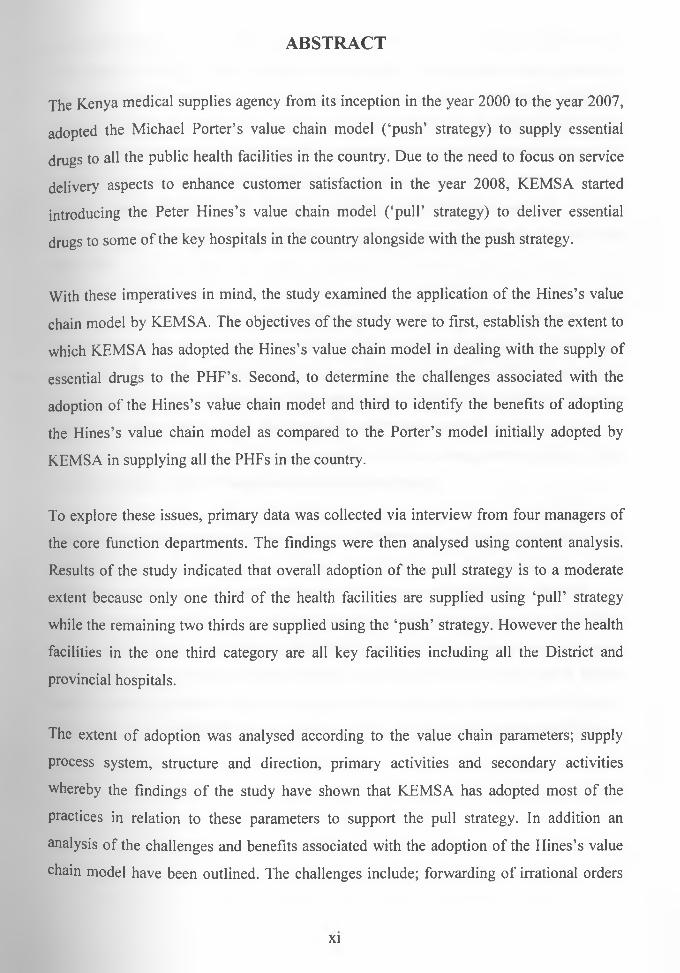
ABSTRACT
The Kenya medical supplies agency from its inception in the year 2000 to the year 2007,
adopted the Michael Porter’s value chain model (‘push’ strategy) to supply essential
drugs to all the public health facilities in the country. Due to the need to focus on service
delivery aspects to enhance customer satisfaction in the year 2008, KEMSA started
introducing the Peter Hines’s value chain model (‘pull’ strategy) to deliver essential
drugs to some of the key hospitals in the country alongside with the push strategy.
With these imperatives in mind, the study examined the application of the Hines’s value
chain model by KEMSA. The objectives of the study were to first, establish the extent to
which KEMSA has adopted the Hines’s value chain model in dealing with the supply of
essential drugs to the PHF’s. Second, to determine the challenges associated with the
adoption of the Hines’s value chain model and third to identify the benefits of adopting
the Hines’s value chain model as compared to the Porter’s model initially adopted by
KEMSA in supplying all the PHFs in the country.
To explore these issues, primary data was collected via interview from four managers of
the core function departments. The findings were then analysed using content analysis.
Results of the study indicated that overall adoption of the pull strategy is to a moderate
extent because only one third of the health facilities are supplied using ‘pull’ strategy
while the remaining two thirds are supplied using the ‘push’ strategy. However the health
facilities in the one third category are all key facilities including all the District and
provincial hospitals.
The extent of adoption was analysed according to the value chain parameters; supply
process system, structure and direction, primary activities and secondary activities
whereby the findings of the study have shown that KEMSA has adopted most of the
practices in relation to these parameters to support the pull strategy. In addition an
analysis of the challenges and benefits associated with the adoption of the Hines’s value
chain model have been outlined. The challenges include; forwarding of irrational orders
xi

by overburdened health workers and occasional training of the health facilities due to
staff turnover. Benefits include solving of undersupply and oversupply issues, solving of
the accountability problems and enhancement of customer satisfaction objective.
However, despite the challenges associated with the adoption of the Hines’s value chain
model, it is the preferred strategy by the respondents as they confirmed that the right
decision was made in choosing to introduce this strategy and believe that the strategy
would be more effective in all players i.e. KEMSA, health facilities, and the ministries
(ministry of medical services and ministry of public service and sanitation) played their
roles well.
On the basis of the study several recommendations were deemed appropriate. The
findings seem to point to the need to focus on a few issues in support of the value chain
parameters. These are: reduction of lead time, revise the essential medicines list in order
to meet and exceed the performance expectations of all levels of the health facilities, the
ministries under health to play their roles effectively and enable KEMSA to effect the
quantification role and the final issue of concern is for the management to expound their
role of enhancing employee participation and empowerment.
The limitation of this study related to the scope of the study. The study only focused on
one organization that supplies drugs hence the results may not be generalized to other
organizations that supply drugs like the missions for essential drugs supply (MEDS).
Further research could be carried out in the public health facilities supplied by KEMSA
with an aim of determining customer satisfaction levels with the supply process strategy
that KEMSA has adopted. In addition further research could also be carried out in MEDS
with the aim of establishing the extent to which the organization has adopted the Hines’s
value chain model in dealing with the supply of drugs to the mission hospitals in Kenya.
Xll
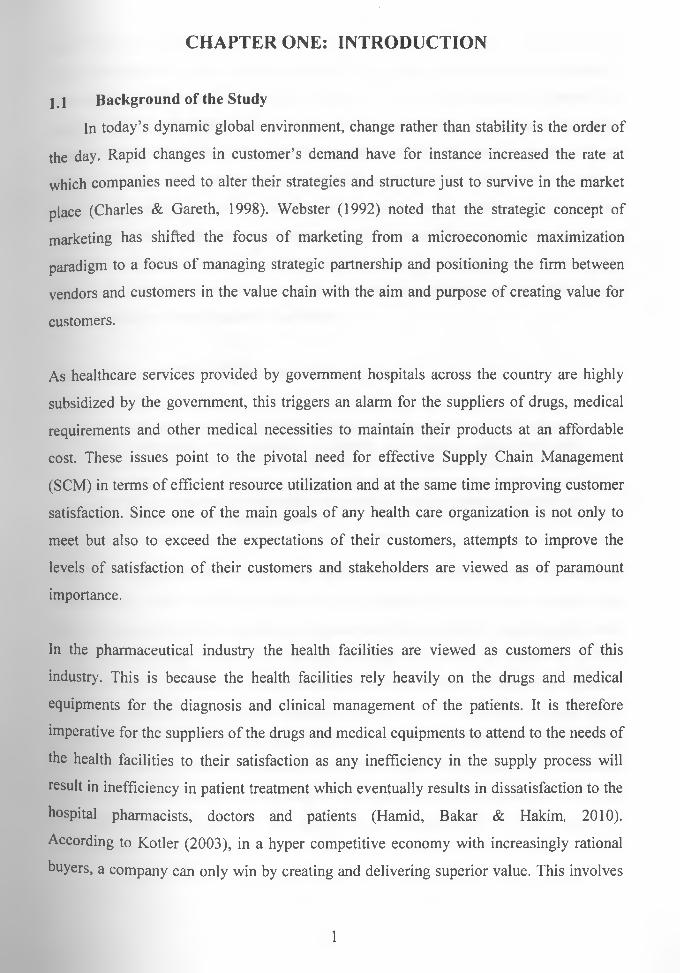
CHAPTER ONE: INTRODUCTION
1.1 Background of the Study
In today’s dynamic global environment, change rather than stability is the order of
the day. Rapid changes in customer’s demand have for instance increased the rate at
which companies need to alter their strategies and structure just to survive in the market
place (Charles & Gareth, 1998). Webster (1992) noted that the strategic concept of
marketing has shifted the focus of marketing from a microeconomic maximization
paradigm to a focus of managing strategic partnership and positioning the firm between
vendors and customers in the value chain with the aim and purpose of creating value for
customers.
As healthcare services provided by government hospitals across the country are highly
subsidized by the government, this triggers an alarm for the suppliers of drugs, medical
requirements and other medical necessities to maintain their products at an affordable
cost. These issues point to the pivotal need for effective Supply Chain Management
(SCM) in terms of efficient resource utilization and at the same time improving customer
satisfaction. Since one of the main goals of any health care organization is not only to
meet but also to exceed the expectations of their customers, attempts to improve the
levels of satisfaction of their customers and stakeholders are viewed as of paramount
importance.
In the pharmaceutical industry the health facilities are viewed as customers of this
industry. This is because the health facilities rely heavily on the drugs and medical
equipments for the diagnosis and clinical management of the patients. It is therefore
imperative for the suppliers of the drugs and medical equipments to attend to the needs of
the health facilities to their satisfaction as any inefficiency in the supply process will
result in inefficiency in patient treatment which eventually results in dissatisfaction to the
hospital pharmacists, doctors and patients (Hamid, Bakar & Hakim, 2010).
According to Kotler (2003), in a hyper competitive economy with increasingly rational
buyers, a company can only win by creating and delivering superior value. This involves
1

the following five capabilities; understanding customer value; creating customer value;
delivering customer value; capturing customer value and sustaining customer value. To
succeed a company needs to use the concepts of a value chain and a value-delivery
network...To be successful a firm needs to look for competitive advantages, beyond its
operations into the value chains of its suppliers distributors and customers. Many
companies today have partnered with specific suppliers and distributors to create a
superior value-delivery network (also called a supply chain). Despite much theoretical
discussion around improvement of supply chain competitiveness through delivering
enhanced consumer value, there is little enhancement and alignment of customer value.
As a result, there is a dreath of tools and techniques that academics and practitioners can
use to create ever more effective value chains.
However Hines and Rich (1998) contend that:
“... in order to achieve the delivery of excellent products and services to end -consumers it is necessary to harness the expertise, enthusiasm and dynamism of all the firms that contribute to the final consumable. In order to do this, it is necessary to view each of the value adding processes in each of the companies responsible as a part of a value stream dedicated to the final consumer’s requirements”.
It has been reported that the supply chain of the health care industry is different from the
manufacturing sector in terms of the level of customization of services provided, the
degree of participation of a partner or consumer and the uncertainty underlying the basic
process (Pitta & Laric 2004). As such, the healthcare providers are unable to predict
patient mix and the demand for a particular item. This explains why they are unable to
control or project their projection schedules (Jarrett, 1998). This is true enough in the
current context where doctors request services from clinical laboratories or request drugs
from the hospital pharmacy according to the current needs of the patients. All these make
the healthcare value chain more dynamic and complex (Evans and Berman, 2001) and
this significantly impacts on the performance measurement of the healthcare
organizations.
2

1.1.1 Value Chain Models
Based on the seminal work of Porter (1985), the value chain came to be understood in the
context of the internal activities of a company that create value for its customers. The
value chain took a holistic approach and induced management of each of the company’s
elements. That view led to further refinement in the value delivery system (Bower &
Garda, 1985; Evans & Berman, 2001). This approach shifted emphasis from an internal
company focus on functions and activities to an external consumer oriented view of the
value that company products and services delivered. Thus, the value delivery system
looks at the company from the consumer’s perspective.
As researchers refined the value delivery system concept, it becomes clear that the
system, including its suppliers, partners, manufacturers and customers was the important
focus. This approach unveiled the role of multiple stakeholders in helping to create value
and set the stage for relationship marketing and a more network view (Norman &
Ramirez, 1994). The value chain for any firm in any business is the linked set of value
creating activities all the way from basic raw material sources for component suppliers
through to the ultimate end -use product delivered to the customer (Johnson & Scholes,
2002). The focus of value chain analysis is to examine the corporation in the context of
the overall chain of value creating activities of which the firm may be only a small part
(Wheelen & Hunger, 2008).
Kotler (2003) adds that every firm is viewed (disaggregated) as a collection of value
activities that are performed to design, produce market, deliver and support its product.
The purpose of value chain is to attain full and seamless interaction among stakeholders
to create a win-win situation. This has great potential in unlocking value (Ayers, 1999).
It involves identification of value chain in business processes, communicating them,
analyzing them, and continuously improving them. According to Johnson and Scholes
(2003), it is the cost of the activities, described as key internal factors by Pierce and
Robinson (2002) and the value they deliver that determines the amount of value created.
3

The key assumptions of value chain are that organizations are much more than a random
compilation of machines, money and people (Johnson & Scholes, 2003). These resources
are of no value unless they are deployed into activities and organized into routines and
subsystems that ensure products or services are produced and are valued by the customer.
Optimization of the strategic capacity of an organization entails identification of separate
value activities and analyzing value contributed by each activity.
According to Thompson, Strickland and Gamble (2007), access to all the capabilities in a
value chain is required in order to compete over the long term in that business. However
an organization can gain this access in a variety of ways. One of the fundamental issues
in developing operations strategy, i.e. competitive strategy is which activities should be
performed internally and which should be left to others such as suppliers, customers or
partners. The main goals of value chain are; to measure the value attributes and
appreciate how various functions or activities within supply chain adds value. Secondly,
to identify value attributes in services and products and lastly, to understand the customer
requirements and communicate them to suppliers.
According to Lysons and Farrington (2006), important value chain models have been
developed by Professor Michael Porter and Professor Peter Hines. Value chain analysis is
concerned with a detailed examination of each subsystem in a supply chain and every
activity within these subsystems with a view to delivering maximum value at least
possible total cost, enhancing value and synergy though out the entire chain. The main
differences between the two approaches are on the principal objectives, on the process
followed, on the structure and direction, on classification of primary activities and finally
on the classification of secondary (support activities). The porters approach is driven
principally by a profitability objective while the Hines’s approach is guided by customer
satisfaction objective. It’s a ‘push’ system for porter’s approach while Hines’s approach
is a ‘pull’ system.
4
1 1.2 Public Health Facilities (PHFs) /Institutions in Kenya
The Kenya government through the ministry of health (MOH) strives to provide quality
healthcare for all citizens so that they may lead economically and socially productive
lives. The provision of health services in Kenya is liberalized. There are public/
government hospitals and private hospitals. The provision of healthcare services in
government hospitals is either free or subsidized on cost sharing basis.
The ministry of health is vested with the overall mandate for health services promotion
under the public health Act Cap 242 of the laws of Kenya and under various subsidiary
legislations dealing with the specific areas of health services provision. It is therefore
responsible for the creation of an enabling environment for the provision of sustainable
quality health care that is affordable and accessible to all Kenyans. The health sector
comprises of the public health system with major players being the ministry of health and
the ministry of Local Authority. Other players are the Non -governmental Organizations
(NGOs), missions and the private sector. Kenya’s public health infrastructure has grown
rapidly since independence and presently the ministry of health has built an impressive
pyramidal health referral system. (This was made possible with considerable support
from harambee efforts).
At the apex are Kenyatta National Hospital (KNH) and Moi Referral Hospital which are
the national referral hospitals. Below KNH are 7 provincial hospital; 70 district hospitals;
96 sub district hospitals; 642 health centres; 3170 dispensaries; 10 rural health
demonstration centres and 5 Rural health training centres. The dispensaries provide basic
consultation services and drugs. Health centres generally have a pharmacy and a
laboratory as well as a few beds for delivery or transit. The sub districts range from a
little more than health centres to large district type facilities presently all provincial and
district hospitals have separate private wings known as Amenity wards. The MOH
management structure is therefore in four levels; central, provincial, district and facility.
KNH operates as a state corporation under the MOH (Collins et al 1995). Despite these
maj°r gains, population growth outstrips the capacity of the MOH to cater for the
demands of services.
5

The government remains the major financier of health care services, meeting nearly half
of the national health recurrent expenditure (MOH 42 per cent and ministry of Local
Authority 5 per cent). The private market (insurance and out of pocket modes) meets 42
per cent, while the missions and NGOs meet 7 per cent of the expenditure (NHSSP: 1999
- 2004). The Kenya Health Care Policy Framework states that there is a general lack of
the essential inputs required for effective patient care in public hospitals. None of these
augers well for providing quality healthcare in MOH facilities and with the existence
unable to provide adequate levels of quality care in its institutions.
1.1.3 The Kenya Medical Supplies Agency (KEMSA)
The Kenya Medical Supplies Agency (KEMSA) is a specialized medical logistics
provider for Ministries of Medical Services/Public Health and Sanitation-supported
health facilities and programmes. KEMSA works to support the National Health Strategic
Plan and the Kenya Health Package for Health in providing public health facilities with
the “right quantity and quality of drugs and medical supplies” at the best market value.
KEMSA’s overall mandate is to procure, warehouse and distribute medical commodities
to public health facilities operated by the Ministry of Medical Services.
The Agency was formed on 11th February 2000 as a result of recommendations of a
health stakeholders’ forum dubbed “Strategies for Reforming the Drug and Medical
Supplies Systems in Kenya” held between June 7 and 10, 1998. A State Corporation
established by a legal notice issued under CAP 466 of the Laws of Kenya, KEMSA
replaced successive medical stores administrations that had existed since 1901 under
various names. KEMSA works to support the National Health Strategic Plan and the
Kenya Health Package for Health in providing public health facilities with the “right
quantity and quality of drugs and medical supplies” at the best market value”.
6

Public health facilities (PHFs) have over the years experienced erratic and sometimes
non-supply of essential drug and medical commodities. Recurrent stock-outs, expires and
unreliable delivery schedules forced Kenyans to avoid seeking health services from
government-run health institutions. As a result, diseases burden snowballed, even as
expenditure on health sector increased and as a country acquired more qualified
personnel in all medical disciplines. Meanwhile, the country was falling back on its own
deadline for eradication of public enemy number one diseases.
Recognizing that access to drugs and other medical supplies was the missing link
between availability of skilled services providers and successful health care outcomes,
health stakeholders met at Kenya College of communication Technology, Mbagathi, from
June 7 to 10,1998 to brainstorm on the matter. One of the key recommendations was to
set up an autonomous corporate entity...."To plan, procure and distribute drugs to PHFs."
Accordingly KEMSA was created purposely to provide a central institutional framework
for planning and sourcing medical supplies. As envisioned in the National Health
Strategic Plan and Kenya Health Package for Health, KEMSA ensures the right quantity
and quality of drugs and medical supplies are available to PHFs at affordable prices
(http://www.kemsa.co.ke)
1.1.2.1 KEMSA’s Core Functions
KEMSA’s core functions include procurement, warehousing and distribution of medical
supplies (http://www.kemsa.co.ke). First, KEMSA’s procurement is governed by the
Public Procurement and Disposal Act (PPDA) and Public Procurement and Disposal
Regulations (PPDR) and has as such set up a Tender committee, Procurement committee,
Evaluation committee and Receiving and Acceptance committee to foster transparency
and accountability in procurement processes.
KEMSA’s procurement process demonstrates a significant degree of efficiency and
effectiveness and in compliance with the provisions in procurements legislations,
particularly the Public Procurement and Disposal Act. Besides, the process is open and
transparent. Further KEMSA offers a more competitive procurement price for medical
7
commodities compared to those of other procurement agencies. A mainstay function,
procurement’s task is to source efficacious drugs and medical commodities at verifiable
value-for-money prices for the tax-paying public. Our procurement procedures are guided
by the Public Procurement Regulations. KEMSA was created purposely to provide
institutional framework for sourcing medical supplies centrally in order to ensure quality
and economies of scale.
Second core function is warehousing; Integrity of medical commodities requires more
than just a roof over an open space in a four-wall enclosure. The specialized nature of
drugs and medical commodities call for state-of-the-art racking schemes that facilitate
ease of storage and stock retrieval procedures. Storage conditions for drugs and
medicines vary from product to product in terms of lighting, temperatures and humidity,
conditions that KEMSA warehouses throughout the country fulfill. Warehousing
activities are also conducted to ensure the highest health and safety standards.
The third core function is distribution and customer service; Customer Service Centers
are conveniently located in Nairobi, Mombasa, Kisumu, Nakuru, Eldoret, Kakamega,
Nyeri, Meru and Garissa. Manned by competent Regional Liaison Officers, the regional
customer service teams work closely with health Institutions to identify, quantify and
make requisitions for essential drugs and medical commodities on behalf of our clients.
Over and above ensuring sustainable stock levels of essential drugs and medical
commodities, the regional liaison teams are also responsible for sensitizing health
practitioners and the public on rational drug use.
1.1.2.2 KEMSA’s Current Strategy for Delivering Essential Drugs to the PHFs
According to the MOH health facility list issued in April (2008), KEMSA supplies drugs
to 4,002 health facilities country wide which include; Referral hospitals for special cases
(mental and spinal injuries), provincial hospitals, district hospitals, sub district hospitals,
health centres and Rural Health Facilities (RHFs) (appendix IV). The Referral,
provincial, district and sub district hospitals are supplied every two months while the
8

dispensaries and the health centres and RHFs are supplied on quarterly basis. According
to KEMSA’s standard operating procedures manual issued in August (2009), Currently
KEMSA uses both the ‘Push’ and ‘pull’ strategies to deliver or distribute drugs to the
PHF’s. The ‘puli’ strategy is purely applied to all health facilities in some specified major
regions which include; Nairobi, coast, North Eastern, Thika, Nyeri, machakos, Kitui and
Mwingi. All other regions in the country excluded in the list, both ‘pull’ and ‘push’
strategies are applied where by, for the provincial, district and sub district hospitals, ‘pull’
strategy is used while the dispensaries, health centres and RHFs use the ‘push’ strategy.
The government through the Ministry of Medical Services procures the drugs and
distributes to the Health facilities. The government maintains a booklet that lists the
essential drugs that the facilities should have (appendix V). Those facilities that apply
the ‘Push’ system are therefore provided with a standard kit that contains various drugs.
This kit contains some drugs irrespective of the geographical location. Yet through
experience some diseases are only unique to certain geographical areas. With the
standard kit, some areas receive drugs they have no use for them while other receive an
under supply of some drugs.
1.2 Problem Statement
Environment is constantly changing and each time it changes it presents new challenges
for the management by causing threats and weaknesses. The change in the environment
triggers strategic responses by firm’s causing them to change their strategies to match
with the environment. Firms should be able to shift their strategies with changes in the
environment and match their capabilities to the selected strategies in order to survive,
succeed and remain relevant (Porter, 1985). The responses to challenges in the firm’s
environment point to the increasing focus on satisfying customers (Palmer, 2001).
The scope of this study will therefore focus on the two value chain models by Michael
Porter and Peter Hines. The Porter’s approach is driven principally by a profitability
objective while the Hines’s approach is guided by customer satisfaction objective. It’s a
‘push’ system for Porter’s approach while Hines’s approach is a ‘pull’ system.
9

Organizations have adopted either Porter’s or Hines’s model in their operations and this
has affected them in one way or another. However as stated by Ghalayini and Noble
(1996), organizations have to realign their processes to environmental changes in order to
enable them compete effectively. Value should be the driving force behind such
processes and readjustments since global market considers value rather than the cost as
the primary success driver.
Since KEMSA started its operations of delivering drugs to the PHFs in the year 2000,
they adopted the Michael Porter model approach (‘Push’ system), but with effect from
January 2008, Peter Hines model approach (‘Pull’ system) was introduced. Currently
KEMSA applies the two approaches to supply the essential drugs to the various health
facilities in the country. The application of either strategy is judged by the region and the
facility category but in all the major health facilities the model adopted is the Hines
model as it enhances customer satisfaction. The health facilities rely heavily on the drugs
and medical equipments for the diagnosis and clinical management of the patients. It is
therefore imperative for the suppliers of the drugs and medical equipments like KEMSA
to attend to the needs of the health facilities to their satisfaction as any inefficiency in the
supply process will result in inefficiency in patient treatment which eventually results in
dissatisfaction to both the customers and the consumers (Hamid, Bakar & Hakim, 2010).
The customers of KEMSA in this study are the PHFs which include; Referral Hospitals,
Provincial Hospitals, District Hospitals, Sub- District Hospitals and RHFs while we refer
to the patients as the end users or consumers of the drugs. The main objective why
KEMSA changed from the initial ‘push’ system and adopted the ‘pull’ system two years
ago in most of the major health facilities in the country was to enhance customer
satisfaction an objective which could not be met while operating under the ‘push’ system
only.
10

This study is therefore geared towards assessing the application of the value chain models
by KEMSA by establishing the extent to which KEMSA has adopted the Hines’s model
in its operations of supplying essential drugs to most PHFs in the country , challenges
faced by the management as a result of adopting the model in supplying most PHFs in the
country and the benefits of adopting the Hines’s model as compared to the Porter’s model
which KEMSA had initially adopted in supplying all the PHFs in the country.
Among other studies carried out in the area of value chain are Musau (2000); The
researcher carried out a survey on value chain management practices of large
manufacturing firms in Kenya focusing on the extent of adoption of the concept and the
challenges faced in adopting the concept. Odero (2006) made an investigation into the
value chain and competitive advantage in the corporate banking industry in Kenya.
Ikundo (2007) carried out a survey on the perceptions of pharmaceutical producers and
end users towards the role played by pharmaceutical distributors using the value chain
concept in Kenya.
From the studies carried out, it appears that value chain activities and how they are
performed do create value to customers who are the main focus of any business. However
these studies made earlier on the value chain may not be expected to provide insight to
the adoption of the value chain models by a firm and the challenges and benefits
associated with the adoption of a particular model hence the need for the current study.
This study will aim at answering the following questions: To what extent has KEMSA
adopted the Hines’s value chain model in dealing with the supply of essential drugs to the
PHFs? What are the challenges associated with the adoption of the Hines’s value chain
model in supplying essential drugs to most PHFs in the country and what are the benefits
of adopting the model as compared to the Porter’s model initially adopted by KEMSA in
supplying all the PHFs in the country?
UNIVERSITY OF NAIROB. LOWER KABFTSUBRAPv
11

1.2 Research Objectives
This study addresses the following three objectives;
i. To establish the extent to which KEMSA has adopted the Hines’s value chain
model in dealing with the supply of essential drugs to the PHFs;
ii. To determine the challenges associated with the adoption of the Hines’s value
chain model in supplying essential drugs to most PHFs in the country;
iii. To identify the benefits of adopting the model as compared to the Porter’s model
initially adopted by KEMSA in supplying all the PHFs in the country.
1.4 Importance of the Study
The findings of this study are expected to provide the managers and other decision
makers of KEMSA with insight into the benefits of adopting the Hines’s value chain
model in dealing with the supply of essential drugs to the PHFs. In addition the value
chain adoption criteria used by KEMSA shall help other companies in designing or
redesigning their value chain model adoption procedures.
The study will also provide an insight that will be useful to firms aiming at creating a
competitive advantage over its rivalries. The firms can examine the different strategies
that are available to them in trying to establish competitiveness. Therefore it will be
helpful in planning strategies to apply in attacking the market. Finally the study is also
important to scholars wishing to carry out further studies in the Agency and in the PHFs.
12

CHAPTER TWO: LITERATURE REVIEW
2.1 The Concept of Value Chain
To better understand the activities through which a firm develops a competitive
advantage and creates shareholder value, it is useful to separate the business system into a
series of value generating activities referred to as the value chain. Every firm is a
collection of activities that are performed to design, produce, market, deliver and support
its product. All these activities can be represented using a value chain. A firm’s value
chain and the way it performs individual activities are a reflector of its history, its
strategy, its approach to implementing its strategy and the underlying economies of the
activities themselves (Porter 1985)
The term value chain was therefore used by Porter (1985) to describe the activities on
organization performance and links them to its competitive position. Drury (2000) sees
value chain from an economist point of view as a change in management behaviour and
an organizational strategy for increasing customer satisfaction and managing costs more
effectively. Close to Drury’s point of view is Thompson and Strickland (2003) who views
it as a tool of strategic cost analyses identifying the separate activities, functions, and
business process that are performed in designing, producing marketing, delivering and
supporting a product or service. Johnson and Scholes (2002) states that the value chain
for any firm in any business is the linked set of value creating activities all the way from
basic raw material sources for component suppliers through to the ultimate end-use
product delivered to the customer.
Chase, Jacobs and Acquilano (2004) sees value chain as a tool systems approach from
raw material, Suppliers through production to final customer aimed at reducing defects,
maintaining optimal inventory levels, shorts production lead time, and improved
customer satisfaction in terms of cost efficiency, quality and delivery. Lysons and
Farrington (2006) view a value chain as a linear map of the way in which value is added
by means of a process from raw materials to finished delivered product (including service
13

after delivery). Ayers (1999) has given a summary point of view by stating that value
chain includes all business processes that put the product in the hands of end users.
The purpose of business organizations is to create and deliver value to customers and
profit to shareholders (Ansoff & Macdonnel, 1994). Johnson and Scholes (2002) views
value Chain analysis as a valuable tool for understanding how value is lost or created in a
business. Much of cost and value creation occur in the supply and distribution chain. An
understanding of the life value creation process is important in helping managers identify
where and how value may be created within the organization and in the wider value
network. Johnson and Scholes further states that the ability of an organization to
influence the performance of other organizations in the supply chain may be crucially
important competence and a source of competitive advantage.
As regarded by Thomas and Hunger (2008), the focus of value chain analysis is to
examine the corporation in the context of the overall chain of value-creating activities of
which the firm may be only a small part. Johnson and Scholes (2002) asserts that value
chain analysis describes the activities within and around an organization and relates them
to an analysis of the competitive strength of an organization (or its ability to provide
value- for- money products or services). Value analysis was originally introduced as an
accounting analysis to shed light on the ‘value-added’ by separate steps in complex
manufacturing processes in order to determine where cost improvements could be made
or value creation improved or both. These two basic steps of identifying separate
activities and assessing the value added by each were linked to an analysis of an
organizations’ competitive advantage by Porter (1985).
Competitive advantage is critical to the success of a business. According to Johnson and
Scholes (2002), value creation centres on the amount that buyers are willing to pay for a
product or service. In his article “where is The Real Value”, Maclean (2003) adds that a
business is profitable and this competitive if the value it creates exceeds the costs of
performing the “value activities”. Value chain analysis therefore enables the firm to
identify and concentrate on its core competences and outsource those functions and
14

resource where it has no distinctive competencies (Porter, 1985). Johnson and Scholes
has defined distinctive competencies as those resources organizations possess that are
relatively unique, provide a valuable service to customers and are difficult to copy.
Research has revealed that the main goals of value chain are; to measure the value
attributes and appreciate how various functions or activities within how various functions
or activities within supply chain adds value. Secondly it is to identify value attributes in
services and products and thirdly to understand the customer requirement and
communicate them to suppliers. Important value chain models have been developed by
professor. Michael Porter and Professor Peter Hines of the Havard school of Business
(Lysons & Farrington, 2006).
2.2 Michael Porter’s Value Chain Model
The concept of value chain has been popularized by Professor Michael Porter and has
proved very useful in business process re-engineering as a strategy for increasing
customer value and shareholders value at the same time (Porter, 1985).
As developed by Porter , this approach of value chain is one way to disaggregate the firm
for purposes of internal analysis and systematically viewing the series of activities a firm
performs to provide its customers with a product.
According to Pearce and Robinson (1997), the value chain disaggregates a firm into its
strategically important activities in order to understand the behaviour of the firm’s cost
and the firms’ existing of potential sources of differentiation. A firm gains competitive
advantage by performing these strategically important activities that include key internal
factors, more cheaply or better than its competitors. The diagram of a typical value chain
model by Porter is shown in figure 2.1.
15

Figure 2.1: Michael P o rte r’s value chain model.
r
r. «O .ti a. >
>■
S
Firm infrastructure (General management,accounting,finance,strategic planning, IT systems
Human resource management (Recruiting, training, development
Technology development(Research and development, product and process improvement)
Procurement(Purchasing of raw materials, machines, suppliers)
Inbound Operatio Outbound Marketing Servicelogistics ns logistics and sales (Installati(Raw (Machini (Warehousi (Advertisin on,materials, ng ng and g repairs,handling assemblin distribution promotion, spares)and g testing) of finished pricing,warehousin products) relationshiprr\
DownstreamUpstream
Source: Porter, M. E (1985), Competitive Advantage: Creating and sustaining a superior performance. New York: Free
press, pg 37.
Pearce and Robinson (1997) further adds that value chain analysis is based on the
assumption that a business’s basic purpose is to create value for users of its products and
services. In value chain analysis managers divide the activities of their firm into sets of
separate activities that add value. Their firm is viewed as a chain of value- creating
activities starting with providing raw materials or inputs and continuing through design.
Component production, manufacturing and assembly, distribution, sales delivery and
support of the ultimate user of its products or services. Porter (1985), describes that each
of these activities can add value and each can be a source of competitive advantage.
Pearce and Robinson noted that by identifying and examining these activities, managers
often acquire an in-depth understanding of their firm’s capabilities, its cost structure, and
how these create competitive advantage or disadvantage.
16
Porter (1985) states that the activities of a business can be classified into two major
categories, five primary activities and four support activities, each of which will
potentially contribute to competitive advantage. Pearce and Robinson (1997) further
clarifies that primary activities are those involved in the physical creation of the product,
marketing and transfer to the buyer and after-sale support. Support activities assist the
primary activities by providing infrastructure or inputs that allow them to take place on
an ongoing basis. The goal of these activities is to offer the customer a level of value that
exceeds the cost of the activities thereby resulting in a profit margin. Thompson and
Strickland (2003) have also added that the value chain includes a profit margin because a
mark up over the cost of performing the firms value creating activities is customarily part
of the price (or total cost) paid by buyers -creating value that exceeds the cost so as to
generate a return for the effort. The literature below shows the primary and the support
activities of the value chain model by Professor Michael Porter.
2.2.1 Primary Activities
Porter (1985) identifies five primary activities that add value to the logistics and final
output of a company. These are: inbound logistics, outbound logistics, marketing and
sales and services. First is the inbound logistics; these activities involve managing the
flow of products into the company. Recent attention to just-in-time manufacturing has
shown how important this can be the efficient operation of a company and how by
management of its suppliers and their quality a company can add to the quality of its final
products (Hooley et al, 2008). Johnson and Scholes (2002);Lysons and Farrington, 2006;
Pearce and Robinson (1997) and Porter (1985) have described the inbound logistics as all
activities linked to receiving, handling and storing inputs into the production system,
including warehousing transport and stock control.
The second primary activity is operations; Hooley et al (2008) argue that operations have
long been seen as the central activity of businesses. These comprise the processes
whereby the inbound items are changed in form, packaged and tested for suitability for
use. Traditionally this has been seen as the area where value is added to a company’s
products. At this stage, value can be added beyond the normal capital and manpower
17

inputs by the maintenance of high quality, flexibility and design. Therefore Johnson and
Scholes (2002); Lysons and Farrington (2006); Pearce and Robinson (1997) and Porter
(1985) provides the description of operations as all activities involved in the
transformation of inputs to outputs as the final product(s). They have clarified that in a
manufacturing enterprise, these would include production, assembly, quality control and
packaging. While in a service industry, these include all activities involved in providing
the service, such as advice, correspondence and preparation of documents by a legal firm.
The third primary activity is outbound logistics. According to Johnson and Scholes
(2002); Lysons and Farrington (2006); Pearce and Robinson, (1997) and Porter
(1985),outbound logistics carry the product from the point of operations to the end user,
including finished goods warehousing, order processing, order picking and packing,
shipping, transport and maintenance of a dealer or distribution network. Hooley et al
(2008) adds that at this stage value can be added through quick and timely delivery, low
damage rates and the formulation or delivery mechanisms that fit the operations of the
user.
Marketing and sales is the fourth primary activity and Johnson and Scholes (2002);
Lysons and Farrington (2006); Pearce and Robinson, (1997) and Porter (1985) have
explained these as activities involved in informing potential customers about the product,
persuading them to buy and enabling them to do so; including advertising, promotion
market research and dealer distributor support. Hooley et al (2008) further explains that
marketing and sales can concern feedback, which allows the user company to user
requirements or by helping customers understand the economic value of products that are
available.
The fifth primary activity is Service activities; They are involved in the provision of
services to buyers offered as part of the purchase agreement, including installation, spare
parts delivery, maintenance and repair technical assistance, buyers’ enquiries and
complaints (Johnson & Scholes, 2002; Lysons & Farrington, 2006; Pearce & Robinson,
1997 and Porter, (1985). Therefore these activities are required to keep the product or
18

service working effectively for the buyer, after it is sold and delivered. Since customer
satisfaction is central to achieving repeat sales and word-of-mouth communication from
satisfied customers, after -sales service a clearly a major part of added value (Hooley et
a l , 2008).
2.2.2 Support Activities
In support of the primary activities of the value chain, Porter (1985) also identified
support activities. These are procurement, human resource management technology
development and infrastructure. These of course feed into each stage of the primary
activities of the value chain. Johnson and Scholes, (2002); Lysons and Farrington (2006);
Pearce and Robinson (1997) and Porter (1985) gives a description to each of them.
Procurement refers to all activities involved in acquiring resource inputs to the primary
activities, including the purchase of fuel, energy, raw materials, components, sub
assemblies, merchandise and consumable items from external vendors. According to
Porter (1985), a given procurement activity can normally be associated with a specific
value activity or activities which it supports, though often a purchasing department serves
many value activities and purchasing policies apply firm wide.
Technology development is the second activity; every value activity embodies
technology, be it know-how, procedures, or technology embodied in process equipment.
Technology development consists of a range of activities relating processes and resource
utilization including research and development. Process design improvement, computer
software, computer aided design and engineering and development of computerized
support system. Porter (1985) noted that Technology development that is related to the
product and its features support the entire chain, while other technology development is
associated with particular primary or support activities.
19
Human resource management (HRM) which is the third activity consist of activities,
costs and assets involved in the recruiting, hiring, training, development and
compensation of all types of personnel; labour relations activities, development of
knowledge - based skills. As clarified by Porter (1985), HRM supports both individual
primary and support activities and the entire value chain. Therefore HRM activities occur
in different parts of a firm, as do other support activities and the dispersion of these
activities can lead to inconsistent policies. Moreover, the cumulative costs of HRM are
rarely well understood nor are the tradeoffs in different HRM costs, such as salary
compared to the cost of recruiting and training due to turn-over.
Firm infrastructure/General administration is the fourth support activity and it consists of
a number of activities, costs and assets relating to general management, planning,
finance, accounting, legal and regulatory affairs safety and security, quality management,
management information systems, formation of strategic alliances and other “overhead
functions”. Porter (1985) noted that infrastructure, unlike other support activities, usually
supports the entire chain and not individual activities. He further adds that depending on
whether a firm is diversified or not, firm infrastructure may be self - contained or divided
between a business unit and the parent corporation. In diversified firms, infrastructure
activities are typically split between the business unit and corporate levels (e.g. financing
is often done at the corporate level while quality management is done at the business unit
and corporate level).
2.3 Hines’s Value Chain Model
In his Journal ‘The value chain redefined’, Hines (1993) recognized that Porter made two
valuable contributions to the understanding of value chain systems. First, Porter places a
major emphasis on the materials management value- adding mechanism, raising the
subject to a strategic level in the minds of serious executives and second he places the
customer in an important position in the supply chain.
20

However Hines (1993) presents a critique of Porter’s model identifying three major
problems. Neither Porter nor the firms discussed concede that consumer satisfaction not
company profit should be their primary objective. The focus of Porter’s model is on the
profit margin of each enterprise, not the consumer’s satisfaction. Secondly, although
Porter acknowledges the importance of integration, his model shows a rather advised
network, both within the company and between the different organizations in the supply
chain and lastly. Hines believes that the wrong functions are highlighted as being
important in Porter’s primary and support activities.
According to Lysons and Farrington (2006), the three criticisms highlighted above result
from the fact that Porter’s model is based solely on American cases without referencing
to more innovative Japanese enterprises’ Porter’s conclusions may therefore prove
inappropriate for companies facing the challenges of the 21st century with the prospect of
an array of more developed competitors. He pointed out that in some cases close
adherence to Porter’s methodology may prevent firms from further continual
development.
Hines (1993) therefore proposed customer focused value chain approach that differs with
Porters profit based approach. He therefore offered alternative models to support his
customer focused approach. According to Lysons and Farrington (2006) Hines offered
two models to correct the problems earlier highlighted about Porters model. The models
offered are: a micro integrated materials value pipeline and a macro ten forces
partnership model.
2.3.1 Hines’s Micro Integrated Materials Value Pipeline
The micro integrated materials value pipeline model is shown in figure 2.2.
21

Figure 2.2: Hines M icro Integrated M aterials Value Pipeline
Raw Suppliermaterials chain
Inbound Operations Outbound Customer Consumerlogistics logistics chain
Jointly Marketing teamvalue at Materials teameach stage Engineering team
Quality teamR &D team *Design team
Defined product value and volume
Activity -Based Costing (ARCX
£>♦->ocO
kE
£>%->oCO
T JCoo«C/3
HRM/training/education
Total Quality Management (TQM)
Electronic .data interchange (EDI) Profit
Source: Lysons, K. & Farrington, B (2008), Purchasing and supply chain management .7th Ed. Pearson Education Limited, Prentice Hall., pg 104.
As portrayed in figure 2.2 above, Hines’s primary activities concentrate strongly on
focused value of the product or service in its different stages, suggesting that the main
objective of the value chain is to add value for consumer and customer. As a result of
this, the consumer and primary activities are based strongly on different team: marketing
team; materials team; engineering team; Quality team, Research and development team
and design team all working together jointly to define product value at each stage and the
value chain has been turned around to face the opposite direction to that in Porters model
(Lysons and Farrington, 2006). Hines model emphasizes that the primary functions in
each of the separate firms in the value chain must be integrated all external barriers and
internal divisions must be broken down, and there should be collaboration rather than just
competition (Hines, 1994).
2 2

Moreover in the secondary activities, Hines emphasizes utilization of concepts like
transparent costing system (ABC), knowledge creation (HRM/ training/education),
Quality (TQM) and quick response to customers (EDI). According to Lysons and
Farrington (2006), the significance of each of the secondary activities has been identified
by Hines. Activity based costing (ABC) is a cost attribution to cost units on the basis of
benefits received from indirect activities e.g. ordering, setting up and assuring quality
thus it is a tool for assessing a company’s cost competitiveness (Thompson, Strickland &
Gamble, 2007). Thompson et al. (2007) further explains that once a company has
identified its major value chain activities, the next step in evaluating its cost
competitiveness involves determining the cost of performing specific value chain
activities using ABC.
ABC enables the exact cost of products and the benefits of activities such as Kaizen and
value analysis to be ascertained. By allocating costs to activities rather than functions,
true costs involved in delivering the product can be identified. A simple method of the
value chain analysis is to call the price charged to the customer at the end of each supply
chain 100 per cent and by working backwards, ascertain the cost of each supply activity.
ABC therefore enables the most serious non - value- adding problems to be identified
first and addressed promptly.
Human Resource Management involves activities like employee training and education
which facilitates effectiveness efficiency and pro active thinking. Total Quality
management provides a culture for all network members. Electronic data interchange
together with intranets and Extranets and so on facilitate quick response to customer
requirements and draw network members closer together. Lastly, Profit should be
roughly equalized between network members and result from reducing total production
and consumption costs to below what consumers are willing to pay for products meeting
their specifications.
23
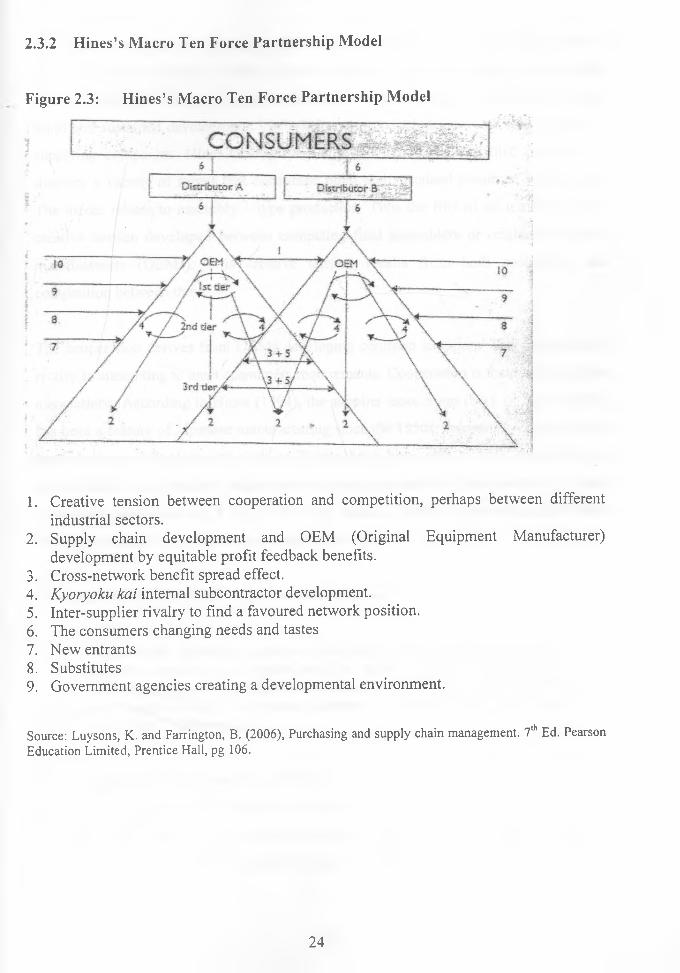
2.3.2 H ines’s M acro Ten Force Partnership Model
Figure 2.3: Hines’s Macro Ten Force Partnership Model
1. Creative tension between cooperation and competition, perhaps between different industrial sectors.
2. Supply chain development and OEM (Original Equipment Manufacturer) development by equitable profit feedback benefits.
3. Cross-network benefit spread effect.4. Kyoryoku kai internal subcontractor development.5. Inter-supplier rivalry to find a favoured network position.6. The consumers changing needs and tastes7. New entrants8. Substitutes9. Government agencies creating a developmental environment.
Source: Luysons, K. and Farrington, B. (2006), Purchasing and supply chain management. 7th Ed. Pearson Education Limited, Prentice Hall, pg 106.
24

According to Lysons and Farrington (2006), the macro ten forces partnership model as
shown in figure 2.3 above, widens the analysis from that of a company with a single
source to the whole range of supply pipelines and identifies the forces that encourage
rapid and sustained development. The whole network includes several tiers or layers of
supplying companies. Hines (1993) states that the ten forces identified in figure 2.3
describe a variety of forces that encourage rapid and sustained continual development.
The model relates to assembly - type production. Thus the first of all ten forces is the
creative tension developed between competing final assemblers or original equipment
manufacturers (OEMs). This creative tension results from both cooperation and
competition between them.
The cooperation derives from OEMs developing common suppliers. The competition is
rivalry in attempting to meet consumers requirements. Cooperation is fostered by supplier
associations. According to Hines (1994), the supplier association (SA), or Kyoryoku kai,
has been a feature of Japanese manufacturing since the 1950s. Assisted by Kyoryoku kai,
large Japanese manufacturers such as Toyota have been able to both coordinate and
develop their sub contractors in such ways as the dissemination of best practice, provision
of technical assistance and, in some instances, training. Supplier associations also help to
develop a climate of trust between the parties involved.
Hines and Rich (1998) define a supplier association as:
“A mutually benefiting group of company’s most important suppliers brought together on a regular basis in order to achieve strategic and operational alignment through the development of awareness, education and implementation programmes designed to achieve both radical and incremental improvements”.
2.3.3 Important Features of Hines Model
Lysons and Farrington (2006), point out the four important features of the Hines model.
The value chain points in the opposite direction to that in Porter’s model, emphasizing
differences in both objectives and processes. Secondly, Demand is determined by
25

collective customer defined price levels. Thirdly, primary functions in each of the
separate firms in the value chain must be integrated and traditional arms length external
barriers and internal divisions broken. The emphasis is on collaboration rather than
competition. Lastly, the key primary functions and secondary activities differ as shown in
table 2.1 below and there is significance of each of the secondary activities identified by
Hines as explain earlier. Table 2.1 therefore gives a summary of the main contrasts
between the Porter and Hines model.
Table 2.1: Porter’s and Hines’s Models Contrasted.
parameters Porter’s model Hines’s model
Principal objectives profitability Consumer satisfactionprocesses ‘Push’ system ‘Pull’ systemStructureanddirection Series of chains linking firms
pointing from raw materials source to customer
One large flow pointing from consumer to raw materials source.
Primary activities Inbound logistics, operations, outbound logistics, marketing& sales and service
Teams concerned with marketing,materials,engineering, quality, R&D and design.
Secondary (support) Activities
Firm infrastructure HRM, technology development, and procurement
Activity-based costing (ABC), HRM/Training/Education, TQM, EDI, Profit
Source: Lysons, K. & Farrington, B. (2006), Purchasing and supply chain management. 7th Ed. Pearson Education Limited, Prentice Hall, pg. 105.
2.4 Value Chain AnalysisValue chain analysis is concerned with a detailed examination of each subsystem in a
supply chain and every activity within these subsystems with a view of delivering
maximum value at the least possible total cost, therefore enhancing value and synergy
throughout the entire chains (Lysons and Farrington, 2006). Pearce and Robinson (1997)
indicate that value chain analysis is based on the assumption that a business’s basic
purpose is to create value for users of its products or services. Therefore in value chain
analysis, managers divide the activities of their firm into sets of separate activities that
add value. Their firm is viewed as a chain of value- creating activities starting with
procuring, raw materials or inputs and continuing through design, component production,
26

manufacturing and assembly, distribution, sales, delivery and support of the ultimate user
of its products or services.
According to Johnson and Scholes (2002) value chain analysis describes the activities
within and around an organization and relates them to an analysis of the competitive
strength of the organization. Pearce and Robinson (1997) further adds that each of these
activities can add value and each can be a source of competitive advantage. Porter (1985)
states that there are two ways in which an enterprise can obtain a sustained competitive
advantage: first cost and second differentiation.
2.4.1 Cost Strategies
According to Lysons and Farrington (2006), cost analysis with regard to value chains is
performed by assigning costs to the value chain activities. The approach of activity-
based costing is as of particular relevance in this, context. Thompson et al (2007) regards
ABC as a tool for assessing a company’s cost competitiveness. He asserts that once a
company has developed good estimates for each of the major activities in its value chain
and perhaps has cost estimate for each of the major activities in its value chain, sub
activities within each primary /secondary value chain activity, then it is ready to see how
its costs for these activities compare with the costs of rival firms. Porter identifies ten
major cost drivers that determine the value or cost of activities.
Economies or diseconomies of scale; the bigger the size of firm’s operations, the less it
costs the firm to produce as long as the firm operates within an optimal level of
production capacity. If the firm utilizes its capacity better than its competitors it will
benefit by having a lower per unit cost of production as it spreads its fixed cost over a
wide or larger number of output. The results can be translated into higher margins or
cheaper products.
27
Learning & Spillover; there is a cost in learning of new processes and training new staff.
A firm that has a steep learning curve compared with the competition will have a lower
cost related to learning than its competitors. These will mean that the firm with a shorter
learning curve will attain higher efficiency levels faster than the competition. High
efficiency results to better product quality and reduced wastage. These have a direct
implication on cost reduction.
Capacity Utilization; changes in production capacity have the impact of either contracting
or expanding costs. Idle capacity has its own cost due to the unabsorbed fixed cost that go
to waste. A firm that can effectively utilize its idle capacity will benefit from increased
output and a reduced per unit production cost. This is directly related to the economies of
scale discussed above. Linkages between activities; activities within a firm are
interrelated, the stronger and relevant the linkages between different activities the better
for the firm. This is because of the synergies that are realized. If a firm can interlink its
various activities much better than its competitors the firm will have reduced cost per
activity and a higher benefit per activity.
Interrelationships among Business Units; a firm with different business units will benefit
from a closer relationship among the units as opposed to the firm with a less tight
relation. This is as a result of the synergies that such a close relationship will bring to the
firm. Good interrelationships will reduce duplication of tasks and afford specialization of
duties. This will result to reduced cost and if a firm does this better than its competition
then it will gain strategic advantage.
Degree of Vertical Integration; a firm’s ability to integrate vertically with its suppliers of
inputs such as raw materials and control and manipulate these integrations towards its
advantages will afford the firm a strategic advantage over its competitors. Timing of
Market Entry; a firm that plans its market entry strategies to be at the most opportune
time will reap a competitive advantage than firms that don’t have such plans. Firm’s
policy of cost or differentiation; the policies followed by a firm will also affect the costs
incurred by the organization in running its operations. A firm may either choose to follow
a cost strategy or chose to use a differentiation strategy. The choice a firm makes is
28

usually a trade-off between the two strategies. Geographic Location; a firm that is located
near its market, near its suppliers of inputs and near other support services has a
competitive advantage compared to firms that are located far from all the above.
Institutional factors; these include government regulations, taxation, unionization tariffs
and levies which constitute major cost drivers
Lysons and Farrington (2006) states that, an enterprise that controls the above drivers
better than its rivals will secure a competitive advantage over them. Porter (1985)
continues to state that a cost advantage can also be gained by reconfiguring the value
chain so that it is significantly different from those of competitors. Such reconfigured
chains can derive from differing production processes, automation, direct instead of
indirect sales, new raw materials or distribution channels and shifting the location of
facilities relative to supplier and customers.
2.4.2 Differentiation Strategies
Porter (1985) states that a firm differentiates itself from its competitors when it provides
something unique that is valuable to buyers beyond simply offering a new price. A
differentiation advantage can be obtained either by enhancing the sources of uniqueness
or reconfiguring the value chain. The drivers of uniqueness are often similar to the cost
drivers listed in the earlier section. Policy choices; policy choices about activities to
perform and how to perform them, such as what product features to include, services to
provide, technology to employ or quality of outputs. Linkages between activities;
Linkages between activities such as delivery time, which is often influenced not only by
outbound logistics but also by the speed of order processing. Timing; Being the first to
adopt a product image may pre-empt others doing so. Location; convenience of use of
customers and other such factors. Interrelationships: This involves the sharing of
technologies or sales effort.
29

Learning and spill over; Learning how to perform an activity better. Porter observes that
only proprietary learning leads to sustainable differentiation. Integration; providing a
service in-house instead of leaving it to supplier may mean that the organization is the
only one to offer the service or provide the service in a unique way. Scale; Large-scale
operations can allow an activity to be performed in a unique way not possible at a smaller
volume. Institutional factors; Good union relationships may avoid losses in production
time due to strikes and so on. Lastly, reconfiguring a value to create uniqueness can
involve devising a new distribution chain or selling approach, forward integration to
eliminate channels of distribution, backward integration to enhance quality and the
adoption of new production technologies (Lysons & Farrington, 2006).
2.4.3 The Main Steps in Value Chain Analysis
Porter (1985) provides a list of the main steps in strategic cost analysis and differentiation
analysis. Identification of the appropriate value chain activities and assigning costs and
assets to them; diagnosing the cost drivers of each value activity and how they interact;
identification of the competitor’s value chains and determination the relative costs to
competitors and the sources of cost difference; development of a strategy to lower your
relative cost position by controlling cost -divers of reconfiguring the value chain and /or
down stream value; ensuring that cost reduction efforts do not erode differentiation or
make a conscious choice to do so and testing the cost reduction strategy for sustainability.
2.5 The Value Chain and Competitive Advantage
According to Porter (1985), Competitive advantage stems from many discrete activities
that a firm performs. Each of these activities can contribute to a firm’s relative cost
position and create a basis for differentiation. The firms’ margin or profit depends on its
effectiveness in performing activities effectively, so that the amount that the, customer is
willing to pay for the products excess the cost of activities in the value chain. It is in these
activities that a firm has the opportunity to generate superior value. A competitive
advantage may be achieved by reconfiguring the value chain to provide lower costs or
better differentiation.
30

Odero (2006) captures the idea that a firm is a series of functions and that analyzing how
each is performed relative to competitors can provide useful insights. The value chain
model can be used to define a firm’s core competency and the activities in which it can
pursue a competitive advantage through cost advantage and differentiation. What a
business undertakes is directly linked to achieving competitive advantage. For instance, a
business which wishes to outperform its competitors through differentiating itself through
higher quality will have to perform its value chain activities better than the opposition.
By contrast, a strategy based on seeking cost leadership will require a reduction in the
costs associated with the value chain activities or a reduction in the total amount of
resources used.
2.6 Theoretical Framework
Adoption of the Hines’s value chain model is guided by variables according to the value
chain parameters, system of the supply process applied, structure and direction being
guided by the model, primary activities and secondary activities which should determine
the principal objective of the model as the key parameter. The system of the supply
process of the Hines’s value chain model should show a ‘pull’ system where by the
customer is the determinant of what should be offered therefore the supply is on need
basis of the customer. The structure and direction of the Hines’s value chain model
should be one large flow pointing from consumer to raw materials sources. In this case
the definition of the product value and volume starts from the customer so that the
product is made according to the customers’ specification and thus the direction of the
model starts from consumer, customer chain, outbound logistics, supplier chain and ends
with the raw materials source.
The primary activities of the Hines model should be based strongly on different teams
such as marketing team, materials team, engineering team, research and development
team and design team. All these teams are supposed to work together jointly to define
product value at each stage. In addition the primary functions must be integrated. All
external barriers and internal divisions must be broken down and there should be
collaboration rather than just competition among these teams.
31

Lastly in the secondary activities the Hines’s value chain emphasizes on the utilization of
concepts like activity based costing system which enables the non value adding problems
to be identified first and addressed promptly by allocating costs to activities rather than
functions: knowledge creation through human resource management, training or
education to the employees which facilitates effectiveness, efficiency and proactive
thinking; Total quality management to provide a culture for all the network members;
electronic data interchange to facilitate quick response to customer requirements and
lastly profit should be equalized between network members which should result from
reducing total production and consumption costs to below what consumers are willing to
pay for product meeting their specifications. When an organization practices are
according to the Hines value chain specification defining the various parameters then the
principal objective which is consumer satisfaction is achieved. However the level of this
satisfaction is dependent on the extent to which these practices relating to the parameters
have been implemented
32

2.7 The Conceptual Framework
The figure of the conceptual framework is as shown in figure 2.4.
Fig: 2.4 The Conceptual Framework
33

CHAPTER THREE: RESEARCH METHODOLOGY
3.1 Research DesignThis research adopts a descriptive case study design intended to establish the extent to
which KEMSA has adopted the Hines’s value chain model, outline challenges associated
with adopting the model in supplying essential drugs to most PHFs in the country and
also identify benefits of adopting the model as compared to the Porter’s model initially
adopted by KEMSA in supplying all the PHFs in the country.
According to Cooper and Schindler (2003), a study concerned with finding out who,
which, when, where, and how of a phenomenon is a descriptive design. This study is thus
mapped on a similar concern. The case study method was chosen because it gives an in-
depth understanding of the behaviour pattern of firms. By using case studies, researchers
are also able to collect data and explain phenomenon more exhaustively. Previous studies
that have adopted this design successfully include: Karoney (2008), Odero (2006) and
Koigi (2002).
3.2 Data Collection
The primary data was collected using an interview guide (appendix II). Self introduction
to the respondents on the issue of concern was made through an introductory letter
(appendix I). The respondents were persons who make strategic decisions at KEMSA
from the core function departments. The interview guide was divided into three parts:
Part I has questions aimed at establishing the extent to which Hines value chain model
has been adopted by KEMSA in respect to the value chain parameters that constitute the
model which are: supply process, structure and direction, primary activities and
secondary activities. Part II has questions focusing on the challenges associated with the
adoption of the Hines ‘s value chain model and also identify the benefits of adopting the
model as compared to the Porter’s model which KEMSA had initially adopted in
supplying all the PHFs in the country. Finally, part III contains questions about the
general information of the respondent.
34

Secondary data was also collected from various sources including standard operating
procedures manual from KEMSA, National Health Sector Strategic Plan and KEMSA’s
website. The secondary data on value chain was collected from the two main scholars
given, Michael Porter and Peter Hines only.
3.3 Operationalizing Value Chain Model Parameters
The operationalization of the key constructs adopted for the study is as shown in
Appendix III. The in-depth interview guide used unstructured questions to find out the
extent to which KEMSA has adopted the Hines’s value chain model in dealing with the
supply of essential drugs to the public health facilities in Kenya
3.4 Data analysis
Primary data from all the sections of the interview guide was analyzed using content
analysis. The content analysis is suitable for analyzing this qualitative data received
because it helps in obtaining detailed and in-depth information from the qualitative data
received.
35

CHAPTER FOUR: DATA ANALYSIS, RESULTS AND DISCUSSION
4.1 IntroductionThis chapter sets out to analyze and discuss the primary data that was gathered from
respondents. The chapter is divided into three parts according to the objectives that
guided the study. The first part focused on the extent to which KEMSA has adopted the
Hines’s value chain model in dealing with the supply of essential drugs to the PHFs; the
second part has focused on the challenges associated with the adoption of the Hines’s
value chain model and the third part is on the benefits of adopting the model as compared
to the Porter’s model initially adopted by KEMSA in supplying all the PHFs in the
country.
The primary data was collected from three key managers of the core function
departments at KEMSA who are involved in the strategic management decisions of the
organization. The respondents have worked for KEMSA for two to over five years.
Because of their varied nature of responsibilities and the years of service, they have a
thorough knowledge about the adoption of the Hines’s value chain model because it was
implemented two years ago. Each response from the respondents was analysed for
content; that is relevance, strategic impact and confirmation by at least one other
respondent.
4.2 Extent of Adoption of the Hines’s Chain Model by KEMSA
To determine the extent to which KEMSA has adopted the Hines value chain model
(‘pull’ strategy) in dealing with the supply of essential drugs to the PHFs, the respondents
were asked to describe the practices adopted by KEMSA in support of the ‘pull’ strategy
according to the following value chain parameters.
4.2.1 System of Supply Process
The findings indicate that, the hospitals are supplied with the essential drugs on a Bi
monthly basis i.e. six times in a year while the rural health facilities are supplies four
times in a year. The facilities are therefore supposed to order the quantities they require
36

according to this delivery schedule. However this system for placing orders is flexible on
conditions when there are emergency orders following disease outbreaks, accidents and
other related emergencies whereby urgent orders made on special requests are supplied to
the requesting facilities as soon as the orders are received.
The lead time (the time between when you place an order and when it is served) was also
a major issue for consideration in the supply process of KEMSA. Orders from all
facilities are received at KEMSA at the beginning of the inventory cycle (time between
two consecutive inbound deliveries). Therefore depending on the KEMSA’s distribution
schedule, the lead time per facility is not fixed because it depends on when the orders are
received; however it takes a minimum of two weeks and at most a month.
Occasionally the customers (public health facilities) have presented complaints about
drugs arriving in unsatisfactory conditions. However some measures taken by KEMSA to
prevent reoccurrence of this fault include: thorough checking before loading, using
forklifts when stacking and un stacking from the warehouse and at minimal times
charging of transporters on all items delivered in unsatisfactory condition because this
makes them follow the standard operating procedures effectively and efficiently.
4.2.2 Structure and Direction
From the findings, KEMSA is concerned with gathering information about customer
needs and wants; they seek to understand customer responses to the style and mode of
service delivery by carrying out customer satisfaction surveys annually (every financial
year). The drugs provided by KEMSA consistently meet the health facility requirements
and performance expectations to some extent but it depends on the level of the health
care of the facilities. For instance, the rural health facilities can depend on KEMSA alone
as the only supplier and even the hospitals that fully rely on the essential medicines list
however most hospitals normally supplement what KEMSA does not supply by buying
from the private pharmaceutical companies despite the fact that the drugs are priced
higher than at KEMSA or other drug supplying organisations like Missions for Essential
drugs supply (MEDS).
37

4.2.3 Primary Activities
The responses indicate that some of the primary activities that KEMSA has practiced in
support of the ‘pull strategy’ include: procurement of drugs that are in good and safe
packaging; KEMSA has a quality assurance department that is dedicated to ensuring
safety and efficacy. In addition KEMSA does its purchases after a competitive tender
process where various suppliers are required to tender their products openly.
Procurement of drugs which have reasonable expiry duration; KEMSA only receives
commodities with at least 75% of their shelf-life left. Therefore this gives a long
allowance to supply the drugs to the PHFs before their shelf life elapses if KEMSA is
efficient in doing so .Supply of drugs at affordable prices to the public health facilities;
KEMSA has been proven to have the best prices based on price surveys conducted by
independent bodies e.g. United States Agency for international development (USAID). In
addition at tendering KEMSA awards the lowest bidder with the best quality therefore
ensuring affordable prices for the facilities. However KEMSA’s role in procuring drugs
in satisfactory quantities is limited because it depends on the ministry funding. In
addition KEMSA doesn’t concentrate on procuring drugs with new molecules in the
market because KEMSA drugs are procured based on the Essential Medicines List
(EML) and not based on the new molecules in the market.
4.2.4 Secondary Activities
Some of the secondary activities that KEMSA has practiced in support of the pull
strategy according to responses include: involvement is training its employees on the
‘pull’ strategy. This training is not consistent because it is based on program of ministry
of medical services (MOMS) charged on the activity. In order to enhance service delivery
KEMSA has been empowering its employees through; in-house trainings on customer
service on need basis ,comfortable remuneration, implementation of an efficient data
base, taking responsive measures to ensure prompt responses to customer needs are
handled by the efficient and reliable customer service department. Through this
department customers may present their complaints online by filling an online customer
complaints form. This information on arrival to the customer service department is
38

responded to immediately and the customers can log in to check their feedback. In
addition, in case of any inquiry the other modes of contact are, telephone, email and also
physical contact through field visits. It takes approximately 48 hours to respond to the
customer complaints presented.
Assurance of addressing the customer complaints effectively and by the right customer
personnel is ensured because KEMSA is ISO certified and use the standard operating
procedures in closing customer complaints. In addition the National customer service
manager ensures that the customer complaints are addressed effectively by doing a follow
up. Measures taken by KEMSA to upgrade its procurement and supplies procedures on
the basis of advancing technology include; adoption of the new enterprise resource
planning (ERP) which is a computer system used to manage all company resources in the
receipt completion and delivery of customer orders. This system has enabled KEMSA
customers to place electronic orders.
KEMSA ensures that there is overall accuracy and security through monitoring and
evaluating the procedures followed to deliver drugs to the public health facilities to some
extent. This is ensured partly due to the fact that the vehicle transporting the drugs to the
health facilities is fitted with a tracking device that can monitor a driver up to the facility.
In addition the facility is required to sign a delivery note after the drugs have been off
loaded. Finally, KEMSA reviews the performance levels of the ‘puli’ strategy at the end
of every cycle and quarter to determine the areas of improvement.
4.3 Challenges Associated with the Adoption of the Hines’s Value Chain Model
Since KEMSA adopted the Hines’s value chain model two years ago. The adoption
process has been faced with a number of challenges. The main challenges indicated by
the respondents includes: due to staff turn-over at the facilities, KEMSA is required to
keep training the new staff on the adopted strategy; Periodically the health workers are
overburdened and as a result they submit irrational orders. For instance some health
facilities order for too much than required hence having so many items expiring in their
stocks before usage. Other facilities order for less than their daily patient capacity thus
39
having many emergency requests before the end of the inventory cycle. Other facilities
fill the standard order form incorrectly thus at times resulting to ordering items that the
facilities do not require.
4.4 Benefits of Adopting the Hines’s Value Chain Model over the Porters Model
Since KEMSA adopts the Hines’s value chain model (‘pull’ strategy) to deliver to the key
health facilities in the country which constitute a third of the total health facilities, the
responses indicate the major benefits associated with the adoption of this strategy as;
First when the health facilities forward rational orders then they are able to order the
required amounts thus reducing any wastage because no drugs are supplied in excess or
under supplied. Secondly, the ‘pull’ strategy has solved the accountability problems of
the ‘push’ strategy where by health facilities are responsible for the drugs that expire due
to excess supply because they are responsible for ordering the quantities required at any
given time. Lastly, the Hines’s value chain model is geared towards enhancing customer
satisfaction, an objective which could not be met while operating under the ‘push’
strategy (Porter’s model).
4.4.1 Drawbacks of the Porter’s Value Chain Model
Initially, KEMSA adopted the Porter’s value chain model (‘push’ strategy) to supply all
the health facilities in the country. However two years ago, KEMSA found the need to
adopt the Hines’s value chain model (‘puli’ strategy) because of the following drawbacks
of the ‘push’ strategy revealed by the findings of this study; The push strategy results to
over supply or under supply of drugs to the health facilities because under this strategy all
the facilities are supplied with similar quantities of drugs where by a standard kit is
provided to the facilities irrespective of their geographical location. For instance, some
diseases are unique to certain geographical zones and therefore when all regions receive
this standard kit to some facilities this leads to the expiry of the drugs before their usage
which is total wastage or it may cause a shortage of the drugs due to inadequate supply.
On the other hand, some facilities receive oversupply or under supply of drugs due to
population distribution factors. The fact that some facilities will receive more patients
40

than others. Those facilities receiving a large number of patients suffer a shortage of the
drugs thus causing a great dissatisfaction to the health providers and eventually the
patients. Those facilities receiving a smaller number of patients experience wastage of the
drugs due to excess supply. In addition the ‘push’ strategy has brought accountability
problems of the drugs because once the health facilities are supplied with what they do
not need they are not accountable for the losses incurred after the excess drugs have
expired since they were not responsible for ordering the quantities supplied in excess.
41

CHAPTER FIVE: SUMMARY, CONCLUSION AND
RECOMMENDATIONS
5.1 Introduction
The objectives of this study were first, to establish the extent to which KEMSA has
adopted the Hines’s value chain model in dealing with the supply of essential drugs to the
PHFs; secondly, to determine the challenges associated with the adoption of the Hines’s
value chain model and lastly to identify the benefits of adopting the Hines’s value chain
model as compared to the Porter’s model that was initially adopted by KEMSA in
supplying all the PHFs in the country. To address these objectives this chapter discusses
the findings based on the analysis of data in chapter four and in addition possible
recommendations and conclusions about the study.
5.2 Summary
This section provides a summary of the major findings of the study. As discussed under
the research problem, this study sought to fill gaps in previous studies which entailed
providing an insight to the adoption of the value chain models by a given firm by
establishing the extent to which the firm has adopted the value chain model and the
challenges and benefits associated with the adoption of a particular value chain model.
By identifying and outlining gaps in previous study, this study departed from previous
studies by introducing the concepts of practices relating to the value chain parameters
that differentiates the two major models referred to in this study i.e. the Hines’s and
Porter’s value chain model and thus explain the extent to which the organization has
adopted the Hines’s value chain model in relation to the parameters i.e. system of the
supply process, structure and direction, primary activities, secondary activities and the
principal objective.
For the supply process parameter, the overall responses indicates that KEMSA’s practices
in supplying drugs indicating a pull system are: The availability of a well coded standard
order form which is issued to all the public health facilities scheduled to be supplied
42

under the pull strategy so that it can guide these facilities in placing the orders; The
flexibility of the ordering system whereby besides the schedule that indicates hospitals
should order six times in a year and rural health facilities four times in a year, in case of
emergencies the Health facilities can place special orders and measures have been taken
to address the complaints about drugs arriving the health facilities in unsatisfactory
conditions. Apart from these practices describing the supply process, a final practice
which is determination of lead time was a point of concern because according to
responses, the lead time per facility is not fixed because it depends on when the orders
are received however it takes a minimum of two weeks and at most a month.
The structure and direction of the Hines’s value chain model is ought to be one large flow
pointing from consumer to raw materials source. In this case the definition of the product
value and volume starts from the customer so that the product is made according to the
customer’s specifications thus directing the model to start from consumer and end with
the raw materials. According to the findings, customer satisfaction surveys are conducted
annually by KEMSA that help the organization to determine the satisfaction levels of the
health facilities and also find out the current needs of the customers. In addition, the
performance expectations of some health facilities are met. For instance, the rural health
facilities due to the level of health care provision, they can fully depend on KEMSA as
the main supplier however district and provincial hospitals offer a more advanced level of
health care and in some instances some drugs needed may have to be sourced from
private pharmaceutical companies or MEDS in addition to those supplied by KEMSA.
Responses have also shown that the primary activities practiced by KEMSA in support of
this strategy include: procurement of drugs that are in good and safe packaging;,
procurement of drugs that have a reasonable expiry duration i.e. they are procured with at
least 75% of their shelf life left however from the respondents, there was no specification
to the shelf life period left to the drugs being supplied to the public health facilities.
KEMSA has been proven to have the best prices based on price surveys. Lastly,
KEMSA’s role in procuring drugs in satisfactory quantities is limited because it depends
on the ministry funding.
43

The respondents indicated that KEMSA also practices some secondary activities in
support of the pull strategy like: training of employees on the pull strategy though its not
consistent because it is dependent on the program of MOMS charged on the activity,
empowerment of its employees to enhance service delivery; implementing measures to
ensure prompt responses to customer needs and also ensuring that the customer
complaints are addressed effectively and by the right personnel. KEMSA is also keen to
upgrade its procurement and supplies procedures on the basis of advancing technology
e.g. adopting of the new enterprise resource planning system that has helped in
management of organization resources in the receipt, completion and delivery of
customer orders. In addition KEMSA has also fitted their vehicles for transporting the
drugs to the facility with tracking device to assist in security purposes and also
monitoring and evaluation process of the deliveries being made to the health facilities.
The process of adopting the ‘puli’ strategy at KEMSA commenced two years ago. Some
of the challenges associated with its adoption include: due to staff turnover at the health
facilities, KEMSA keeps training the new staff on the adopted strategy; some health
workers are over burdened and as a result end up submitting irrational orders. However,
the ‘puli’ strategy has been beneficial to KEMSA in that; since the facilities order for
drugs that they require there is reduction of wastage caused by overstocking and also
problems of shortages are solved because of reduced instances of under stocking, the
facilities are therefore held accountable of what they order. As a result of these issues
then there is enhanced customer satisfaction, an objective which could not be met under
the ‘push’ strategy that was initially used in supplying all the PHFs. Therefore there was
need to adopt the ‘pull’ strategy because of the following drawbacks of the ‘push’
strategy. The overstocking or under stocking the public health facilities because drugs are
not supplied on need basis and in addition in case of any wastage due to excess supplies
made, the health facilities are not accountable for them since they are supplied without
ordering. All these problems trickle down the patients by increasing dissatisfaction thus
the strategy does not enhance customer satisfaction.
44

5.3 Conclusion
As indicated in chapter one, in the pharmaceutical industry the health facilities are
viewed as customers of this industry. This is because the health facilities rely heavily on
the drugs and medical equipments for the diagnosis and clinical management of the
patients. It is therefore imperative for the suppliers of the drugs and medical equipments
to attend to the needs of the health facilities to their satisfaction as any inefficiency in the
supply process will result in inefficiency in patient treatment which eventually results in
dissatisfaction to the hospital pharmacists, doctors and patients (Hamid, Bakar & Hakim,
2010). Conclusions drawn from the study of the application of the Hines’s value chain
model by KEMSA may point at the key areas that require management’s attention
because the process of adopting the Hines’s value chain (‘pull’ strategy) is on going.
Results of the study suggest that overall adoption of the ‘pull’ strategy is to a moderate
extent. This is because out of the public health facilities that are supplied by KEMSA,
one third of these health facilities are supplied using the ‘pull’ strategy but they mainly
consist of the key health facilities because all district and provincial hospitals are in this
category. The remaining portion which is two third mainly consists of the rural health
facilities that are still being supplied using the ‘push’ strategy (Porter’s value chain
model).
The one third portion of the health facilities where the adoption of the ‘pull’ strategy has
taken place, responses shown that KEMSA has effected the strategy in all the significant
parameters these are; system of supply process which clearly indicates that it’s a pull
system as shown by the practices. However in this parameter the researcher was
concerned about the lead time (The time between when you place an order and when it is
served) results shown that it takes a minimum of two weeks and at most one month.
About the structure and direction, the findings suggest that KEMSA has also
implemented some measures of ensuring that the direction points from consumer to the
organization. However, in this parameter as revealed by the study some performance
expectations of some health facilities are not met exhaustively because some of the
45
facilities cannot rely on KEMSA as the only supplier of the drugs and therefore may have
to supplement the orders by ordering some drugs from private pharmaceutical companies
which price their drugs at a higher price than KEMSA or MEDS.
The primary activities supporting the ‘puli’ strategy have also been adopted by KEMSA
however the study revealed that KEMSA has not put conditions of drugs being supplied
to have a specific percentage of shelf life left. Though the specification made on
procuring drugs with a 75% shelf life left is reasonable if the drugs are dispatched
effectively. In addition the role of quantification is limited because KEMSA relies on the
ministry for funding thus this affects the effectiveness in ensuring product availability.
Most of the practices supporting the secondary activities of the ‘puli’ strategy have been
adopted effectively by KEMSA. However the study also shown that the management
could expound on their role of ensuring employee participation and empowerment in
order to enhance service delivery.
The study also sought to find out the comments about a report in citizen TV reported on
Sunday 28th March 2010 during 1.00pm news where Malindi hospital which is among the
public health facilities supplied by KEMSA was faced with a severe lack of essential
drugs .In response to this, the respondents said there had been a drug shortage at KEMSA
due to lack of finances to procure the drugs. KEMSA put the blame on the ministry of
health because it is their role to provide funding.
The responses also shown that despite the fact that the ‘pull’ strategy has not been
adopted fully to the organization, it was the preferred strategy because of enhancing
customer satisfaction and they also pointed out that the right decision was made by
adopting the ‘pull’ strategy instead of continuing with the initial ‘push’ strategy and that
the organization has future plans for adopting the pull strategy to the health facilities that
are still being supplied using the ‘push’ strategy.
46

Lastly, the respondents also pointed out that the effectiveness of this preferred strategy
‘puli’ will be enhanced by having all the players in this process playing their role
effectively i.e. the public health facilities, KEMSA and the ministries (ministry of
medical service and ministry of public health and sanitation). However, according to Pitta
and Laric (2004), the supply chain of the health care industry is different from the
manufacturing sector in terms of the level of customization of services provided, the
degree of participation of a partner or consumer and the uncertainty underlying the basic
process. As such, the healthcare providers are unable to predict patient mix and the
demand for a particular item. This explains why they are unable to control or project their
projection schedules (Jarrett, 1998). This is true enough in the current context where
doctors request services from clinical laboratories or request drugs from the hospital
pharmacy according to the current needs of the patients and therefore it may be expected
by KEMSA for the pull strategy to continue facing the challenges of receiving irrational
orders from the public health facilities from time to time because according to Evans and
Berman (2001) the healthcare value chain is more dynamic and complex and this
significantly impacts on the performance measurement of the healthcare organizations.
5.4 Recommendations
This study has revealed the extent to which KEMSA has adopted the Hines’s value chain
model (‘puli’ strategy) in dealing with the supply of drugs to the public health facilities.
As the study focused on the various parameters of the value chain model; system of
supply process, structure and direction, primary activities and secondary activities; from
the responses the practices in relation to these parameters supporting the pull strategy
have been effected but the analysis of the specific practices under each parameter
revealed a number of possible value chain aspects that may be improved.
First, in respect to the system of supply process the study suggest that the lead time (time
between when you place an order and when it is served) is dependent on the distribution
schedule whereby the lead time per facility is not fixed but depends on when the orders
are received. However it takes a minimum of two weeks and at most a month. The
researcher recommends measures to reduce the lead time can be adopted by KEMSA
47

since lead time is the production or service time (value added activity) + Non-value
added time. According to Lysons and Farrington (2006) supply process activities fall into
four categories which are first, production or service time (value added activity).
Secondly, inspection time that is performing quality control (non-value added activity),
thirdly transfer time, that is movement of products or components (non-value added
activity) and fourth is idle time, that is storage time or time wasting during production
process (non-value added activity). Therefore as KEMSA work towards reducing the lead
time, concentration should be focused to illustrate any activities categorized in second,
third or fourth category because elimination of a non-value adding activity leads to
enhanced service delivery.
Secondly, in respect to structure and direction, the findings of the study suggest that the
drugs provided by KEMSA consistently meet the health facility requirements and
performance expectations to some extent whereby it depends on the level of the
healthcare of the facilities. The rural health facilities due to their level of health care, they
can depend on KEMSA as the only supplier of the drugs. However some district and
provincial hospitals due to the higher level of healthcare provision than the rural health
facilities they may have to order some drugs from the private pharmaceutical companies
or even MEDS in order to run effectively.
The researcher recommends that since the procuring of drugs by KEMSA is based on the
Essential Medicines List (EML) then KEMSA may have to revise the EML list in order
to include all drugs that meet the performance expectations of all the health facilities fully
despite their level of health care provision. In respect to customer expectations, Ferrel
and Michael (2008), clarifies that in order to maintain and manage customer satisfaction
from a strategic point of view, managers must understand customer expectations and the
differences between satisfaction, quality and value. They must also make customer
satisfaction measurement a long-term, continuous commitment of the entire organization.
48
Ferrell and Michael further adds that, although customer satisfaction can be conceived in
a number of ways, it is typically defined as the degree to which a product meets or
exceeds the customer’s expectations about that product. Therefore the key to this
definition lies in understanding customer expectations and how they are formed.
Marketing researchers have discovered that customers can hold many different types of
expectations like; ideal expectations, normative expectations, experienced based
expectations and minimum tolerance expectations.
Thirdly, in respect to the primary activities the findings indicate that KEMSA’s role in
quantification, that is ensuring product availability in the required quantities at all times is
limited because it is dependent on the ministries funding. The research recommends that
in order for the pull strategy to be effective as suggested from the findings, then all the
players in this process ought to play their role effectively and in this case the ministries of
medical services/public health and sanitation is one of the major players besides KEMSA
and the health facilities.
Finally in respect to the secondary activities, most of the practices by KEMSA in support
of the pull strategy have been adopted effectively however the researcher recommends
that the management may expound on their role of ensuring employee participation and
empowerment in order to enhance service delivery. According to Aswathappa (2008), an
important reason for encouraging greater employee participation in decision making is
that it can lead to improved efficiency and effectiveness in delivering of goods and
services to the customers, it enhances the ability of the employees to make important
operational decisions, it leads to increased employee commitment and motivation and
enhanced customer satisfaction.
Aswathappa (2008) identifies some empowerment techniques as being employee
consultation during decision making, employee job enrichment by giving them greater
discretion over immediate work decisions since this adds to their motivation by
increasing their responsibility for their work output of increasing job interests,
empowerment through delegation because a participative management style that
49

encourages delegation of authority implies that all employees will be encouraged to play
a part in the decisions affecting their work, work councils whereby essential joint bodies
of managers and employees are established to consider and agree on key matters
affecting employment within the organization and appointment of employees to non
executive directorships on the company’s board is another indication of employee
participation.
5.5 Limitations of the Study
Like many studies, the current study results were interpreted in light of certain
limitations. A key limitation relates to the scope of the study. The study was limited to
one drug supplier and this may mean that the study results may not be generalised to
other suppliers like missions for essential drugs supply (MEDS) which is a faith based
organization that supplies the mission hospitals in the country.
5.6 Suggestions for Further Research
Further research could be carried out in the public health facilities supplied by KEMSA
with an aim of determining customer satisfaction levels with the supply process strategy
that KEMSA has adopted. For instance it may be informative to conduct a wider
customer satisfaction survey in the health facilities supplied using the ‘puli’ strategy.
Such a study may provide more input into the supply process policy by KEMSA as well
as provide insight to KEMSA into the aspects of service delivery that need improvement
from the health facilities point of view. In addition further research could be carried out
in MEDS with the aim of establishing the extent to which the organization has adopted
the Hines’s value chain model in dealing with the supply of essential drugs to the mission
hospitals in Kenya.
50
REFERENCES
Ansoff, H. & McDonnell (1994), Implanting Strategic Management. 2nd Ed. Prentice Hall.
Aswathappa, K. (2008), Human resource management: Texts and cases. 5th Ed. McGraw-Hill
Ayers, J. (1999) Supply Chain Strategies. [On-line]Available http://www.ayers consulting.com/scm-books.htm.
Bower, M & Garda, R. A. (1985), “The role o f Marketing in Management”, Mickinsey Quarterly Autumn, pp. 34 -46.
Charles W. L. H. & Gareth, R. J. (1998), Strategic Management Theory: An Integrated Approach, Mifflin Company, 4th Edition.
Charles, W. L. H. & Gareth, R. J. (2001), Strategic Management Theory: An Integrated Approach, Houghton Mifflin Company, 5th Edition.
Chase, R. B., Jacobs, R. F & Aquilano, N. S (2004), Operations Management for Competitive Advantage, Tata McGraw - Hill.
Collins, D., et al (1996), Health Financing reform in Kenya: The fall and rise o f cost sharing, 1989 -94, Management science for health.
Cooper, D.R. & Schindler, D.S. (2003), Business Research Methods.8th Ed. McGraw- Hill.
Drury, C. (2000), Management and Cost Accounting 5th Ed. ELST Edition.
Evans, J. K. & Berman, B. (2001), "Conceptualizing and operationalizing the Business- to - Business value chain”, Industrial Marketing management, 39, (2), 135-48.
Ghalayini, A.M. & Noble, J.S. (1996), “The changing basis o f performance measurement”. International journal o f operations and production management. 16(8).
Hamid, A. Bakar, A. & Hakim, I. L. (2010), “Measuring Supply Chain Performance”, Journal o f Productivity and Performance measurement, 59 (1), 75-80.
Hines, P. Rich, N. & Hittmeyer, M. (1998), “Competing Against Ignorance: Advantage through Knowledge ”, International Journal o f Physical Distribution and Logistics, 28 (1), 18-43.
51

Hines, P. (1993), “Integrated Materials Management: The Value Chain Redefined”, International Journal o f Logistics management, 4(1), 13- 22.
Hines, P. (1994), Creating World Class Suppliers. London Pitman Publishing.
Hines, P. (1995), Integrated Materials Management: A post porterian paradigm? Proceeding o f the Second International Conference o f the PSF RG. Revolution in purchasing: The challenge o f Change, University of Bath, pp. 145 - 165.
Hines, P., & Rich, N. (1998), “Outsourcing Competitive Advantage”, Proceedings of the Second Worldwide Research Symposium on Purchasing and Supply Chain Management IPSERA, London, pp. 268-94.
Hooley, G; Nigel, P. P. & Nicouland, B. (2008). Marketing Strategy and competitive positioning. 4th Ed. Pierson Education Limited.
Ikundo, N. (2007). Perceptions o f pharmaceutical producers and end users towards the role played by pharmaceutical distributors using the value chain concept in Kenya: Unpublished MBA Project. University of Nairobi.
Jarrett, P. J. (1998), “Logistics in the health care Industry”, International Journal o f Physical Distributions and Logistics Management, 28 (9/10), 741-2.
Johnson G. & Scholes, K. (2002), Exploring Corporate Strategy. 6th Ed. Prentice Hall.
Karoney, F. (2008), Competitive strategies adopted by the Kenya Television Network (KTN) o f the standard group. Unpublished MBA Project. University of Nairobi.
KEMSA’s Standard Operating Procedures Manual, August (2009, August).
Kenya Medical Supplies Agency [On-line] Available http://www.kemsa.co.ke. Kenya’s Health Policy Framework, (1994).
Koigi, A. N. (2002), Implementation o f strategic alliance: Experience o f Kenya post office bank and Citi Bank. Unpublished MBA Project. University of Nairobi.
Kotler, P. (2000), Marketing Management. International Edition, 11th Ed. Upper
Kutz, D. L. & Clow, K. E. (2002), Services marketing, New York.
Lambert, D. M. & Cooper, M. C. (2000), “Issues in Supply Chain Management”, Industrial Marketing Management, 29 (1), 65-83.
Lysons, K. & Farrington, B. (2006), Purchasing and Supply Chain Management. 7th Ed. Pearson Education Limited Prentice Hall.
52

Maclean, R. (2003), ‘Where is The Real Value’ [On-line] Availablehttp://vmw.eponline.com.
Ministry o f Health Public Facility List, (2008, April).
Musau, J. (2000) A survey o f value chain management practices o f large manufacturing firms in Kenya: Unpublished MBA Project. University of Nairobi.
National Health Sector Strategic plan, (1999-2004), Health sector Reform Secretariat.
National Health Sector Strategic plan, (2005-2010), Health sector Reform Secretariat.
Norman, R, & Ramirez, R. (1994), Creating Customer Value, Thompson Executive Press, Incinnati, OH.
Odero, S. (2006), The value chain and competitive advantage in the cooperate banking industry in Kenya: The case o f Citi Bank in Kenya. Unpublished MBA Project. University of Nairobi.
Pearce II, A. J. & Robinson, J. R. (1997), Strategic management: Formulation, implementation and control. 6th Ed. Irwin, McGraw- Hill.
Pitta, D. A & Laric, M. V. (2004), “Value Chains in Health care”, Journal o f Consumer Marketing, 21 (7), 451 -64.
Porter, M. E., (1985), Competitive Advantage: Creating and Sustainability a superior performance. New York: Free press.
Thomas, L. W. & Hunger, D. (2008), Strategic Management and Business Policy. 11th Ed. Pearson Education INC; Pearson Prentice Hall.
Thompson, A. A. & Strickland III, A. J. (2003), Strategic Management Concepts and Cases. 3rd Ed. New York: McGraw- Hill.
Thompson, J. R., Strickland II & Gamble (2007), Crafting and Executing Strategy: The Quest for Competitive Advantage Concepts and Cases: 15th Ed. McGraw Hill, Irwin.
Webster, F. E. (1992), “The Changing role o f Marketing in the Corporation”, Journal o f Marketing, pp. 1- 17.
53

Westbrook, P. A & Oliver, R. L. (1981), “Developing Better Measures o f Consumer Satisfaction: Some Preliminary Results in Monroe, K.B. (Ed.), Advanced in consumer Research: Association for consumer Research, Ann Arthor, MI 8, 94-9.
Zeithmal, V. A & Bitner, M. J., (1996), Services Marketing. International Edition, Singapore: McGraw -Hill.
54

APPENDICES
APPENDIX Is LETTER OF INTRODUCTION
PHYLLIS KINANU MARETE
UNIVERSITY OF NAIROBI
DEPARTMENT OF BUSINESS ADMINISTRATION
P.0 BOX 18882 -00100, NAIROBI
Dear Respondent,
RE: REQUEST FOR RESEARCH DATA
I am a post graduate student at the University of Nairobi, department of Business
Administration.
In partial fulfilment of the requirement for the degree of master in Business
Administration (MBA), 1 am undertaking a management research project entitled;
“Application o f the Hines value chain model by The Kenya Medical Supplies Agency” I
therefore kindly request you to assist me in filling the attached questionnaire. The
information provided will be used exclusively for the purpose of this research and will be
treated in strict confidence.
Your co-operation will be highly appreciated.
Yours faithfully
PHYLLIS KINANU MARETE
MBA STUDENT
UNIVERSITY OF NAIROBI
55
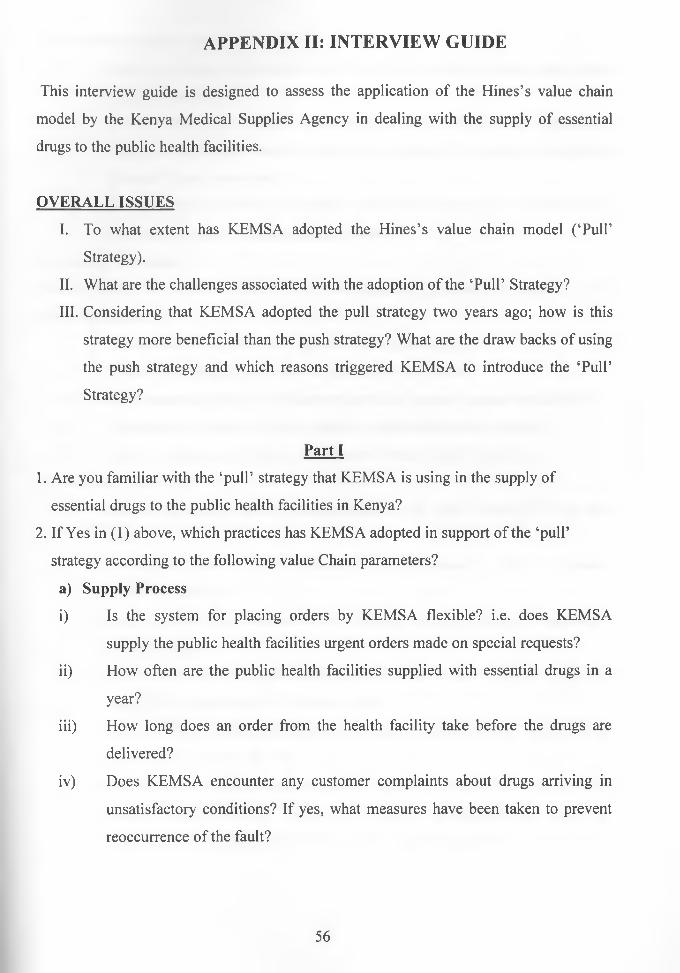
APPENDIX II: INTERVIEW GUIDE
This interview guide is designed to assess the application of the Hines’s value chain
model by the Kenya Medical Supplies Agency in dealing with the supply of essential
drugs to the public health facilities.
OVERALL ISSUES
I. To what extent has KEMSA adopted the Hines’s value chain model (‘Pull’
Strategy).
II. What are the challenges associated with the adoption of the ‘Pull’ Strategy?
III. Considering that KEMSA adopted the pull strategy two years ago; how is this
strategy more beneficial than the push strategy? What are the draw backs of using
the push strategy and which reasons triggered KEMSA to introduce the ‘Pull’
Strategy?
Parti
1. Are you familiar with the ‘pull’ strategy that KEMSA is using in the supply of
essential drugs to the public health facilities in Kenya?
2. If Yes in (1) above, which practices has KEMSA adopted in support of the ‘pull’
strategy according to the following value Chain parameters?
a) Supply Process
i) Is the system for placing orders by KEMSA flexible? i.e. does KEMSA
supply the public health facilities urgent orders made on special requests?
ii) How often are the public health facilities supplied with essential drugs in a
year?
iii) How long does an order from the health facility take before the drugs are
delivered?
iv) Does KEMSA encounter any customer complaints about drugs arriving in
unsatisfactory conditions? If yes, what measures have been taken to prevent
reoccurrence of the fault?
56

b) Structure and Direction
i) Are there measures undertaken by KEMSA for gathering information about
customer needs?
ii) Does KEMSA seek to know by seeking to understand customer responses to
the style and mode of service delivery by carrying out customer satisfaction
surveys? If yes, how often?
iii) Are the drugs provided by KEMSA consistently meeting the health facility
requirements and performance expectations?
c) Primary Activities
To what extent has KEMSA been involved in efficiency and effective handling of the
following activities?
i) Procurement drugs that are in good and safe packaging.
ii) Procurement of drugs with new molecules in the market.
iii) Procurement of drugs in satisfactory quantities (ensure product availability).
iv) Procuring and supplying drugs that have reasonable expiry duration.
v) Supply of drugs at affordable prices to the Public Health Facilities.
d) Secondary Activities
i. Does KEMSA carry out employees training on the ‘Puli’ Strategy? If yes, how
often?
ii. In what ways has KEMSA empowered its employees in order to enhance
service delivery?
iii. What measures have been taken by KEMSA to ensure prompt responses to
customer needs?
iv. Does KEMSA review the performance levels of the ‘Puli’ strategy to determine
the areas of improvement? If yes how often?
v. Which mode of contact is available to the public health facilities in case of any
inquiry (email, phone, fax etc)
vi. Does KEMSA encounter any complaints from the customers? How long does it
take to respond? Is there a follow up from the management to ensure the
complaint was addressed effectively and by h right personnel?
57

vii. What measures has KEMSA taken to upgrade its procurement and supplies
procedures on the basis of advancing technology? E.g. can the Public Health
Facilities order for KEMSA drugs online? Has KEMSA provided information
about their products, services and ordering procedures online?
viii. What measures has KEMSA taken in helping the public health facilities to be
successful in providing the best services to the patients?
ix. What measures has KEMSA put in place in ensuring that there is overall data
accuracy and security in the procedures followed to deliver the drugs to the
Public Health Facilities?
3. Other than the practices mentioned, are there other practices the organization has
adopted in support of the ‘puli’ strategy?
4. Evaluating the four value chain parameters which parameter(s) (Supply process,
structure and direction, primary activities, secondary activities) do you think requires
most improvement?
Part II
5(a) Considering that KEMSA adopted the ‘puli’ strategy two years ago, are there
Challenges associated with adopting this strategy?
Yes No
(b) If yes in (a) above please outline the challenges experienced so far?
6(a) Since KEMSA adopts the ‘pull’ strategy to deliver drugs to all the major health
facilities in the country and the ‘push’ strategy to deliver to just a few health facilities, are
there benefits associated with the adoption of the ‘pull’ strategy because it’s used more
widely than the ‘push’ strategy?
Yes No
(b)If yes in (a) above, outline the benefits associated with the adoption of the ‘pull’
Strategy?
58

7. What are the reasons that triggered KEMSA to introduce the ‘puli’ strategy?
8. Are there future plans for the adoption of the ‘puli’ strategy to the health facilities?
that are still being supplied using the ‘push” strategy?
9. (a) In your own opinion do you think the right decision was made by adopting the
‘pull’ strategy instead of continuing with the initial ‘push’ strategy?
Yes No
(b) If yes in (a) above, what are the draw backs of using the ‘push’
strategy?
10. Which of the two strategies ‘Pull’ and ‘Push’ is geared towards enhancing
customer satisfaction?
11. Comment about the effectiveness of this preferred strategy
12. Recently in the media, (Reported in Citizen TV on Sunday 28th March, 2010 during
1:00 p.m. news) Malindi hospital which is among the public health facilities supplied by
KEMSA was faced with a severe lack of essential drugs. What are your comments about
this issue?
Part III
General Information of the Respondent
13. Name (Optional)__________________________________________
14. Job Title________________________________________________
15. Department_____________________________________________
16. How long have you been working for KEMSA.
Less than 2 Years ( )
2-5 Years ( )
Over 5 Years ( )
59

APPENDIX III: OPERATIONALIZATION OF THE ADOPTION OF THE
HINES’S VALUE CHAIN MODEL
D e te r m in a n ts o f th e
ex ten t o f a d o p t in g th e
H in e s ’s v a lu e c h a in
m o d el (v a lu e c h a in
p a r a m e te r s )
A s p e c t s o f th e H i n e s ’s
v a lu e c h a in m o d e l
d e f in in g th e
p a r a m e t e r
R e le v a n t p r a c t ic e s in s u p p o r t o f th e v a lu e
c h a in p a r a m e t e r
R e le v a n t
q u e s t io n
Supply processes Pull system • Flexibility of the system for placing orders
• Availability and coding of the standard
order form
• The approximate lead time (time between
when an order is placed and when it is
served)
• Supply of drugs in satisfactory condition
2(a)
Structure and direction One large flow pointing
from consumer to raw
materials source
• Carrying out customer satisfactory surveys
to enhance service delivery
• Meeting performance expectations of the
customers through the style of service and
products supplied.
2(b)
Primary activities Teams concerned with marketing materials
engineering quality
research and design
• Procurement of drugs that are in good and safe packaging
• Procurement of drugs in satisfactory
quantities
• Procuring and supplying drugs that have
reasonable expiry duration
• Supply of drugs at affordable prices to the
public health facilities
• Procurement of drugs with new molecules
in the market
2(c)
Secondary activities
'-----__
Activity- based costing
(ABC), Human
Resource Management, Training/ Education
Total quality
• Employee training on the pull strategy
• Employee participation and empowerment
• Ensure prompt responses to customer needs
• Review of performance levels of the pull
strategy to determine areas of improvement
r 2 W ~
60

management, Electronic data interchange, profit
• Handling customer complaints effectively
• Measures taken to upgrade procurement
supplies procedures on the basis of
advancing and technology
• Measures taken by KEMSA in helping the
PHFs become better service providers to the patients
• Measures taken to ensure overall security in
the procedures followed to deliver drugs to
the PHFs
Principal objective Customer satisfaction • Overall practices mentioned above in
support of the supply process, structure and direction, primary activities and secondary
activities
Q2
(a,b,c,&d)
Q10
61

APPENDIX IV: PUBLIC HEALTH FACILITIES SUPPLIED BY
KEMSA
TYPE OF HEALTH FACILITY TOTAL NUMBER IN THE
COUNTRY
National Referral Hospital 2
Provincial General Hospital 7
District Hospital 70
Sub-District Hospital 96
Health Centres 642
Dispensaries 3170
Rural Health Dem onstration Centres 10
Rural Health Training Centres 5
Grand Total 4002
62

A P P E N D IX V
Essential Medicine* Standard Order Form (Hospital.) ------------------------------------ -— _Hospital Order Order
k e m s acode no
Item description N am e/form / strength
Order Unit }* Size
UnitCost
(Kshs)
CurrentStock(units)
AMC(units)J A 1 L :
' '" I . ; . 'Order
Qty(units)
y ■ Order cost
(Kshs)
a) Essential Medicines: Tablets and Capsules xPHA0539
PHA0003Acyclovir Tabs 400m g. Albendazole tabs 400mg
100’s1,000
320 93 1,285.00
PHA0005PHA0009
AmilriptyUine tabs 25m g 1,000 168 00Amoxidllin caps 250m g 1,000 775.00
PHA0385 Artemether/Iumefnntrine tabs 100/20mg 6 001PHA0386 Artemether/lumefantrine tabs 100 /20m g 12 0.01PHA0387 Artemether/lumefanlrine tabs 100/20m g 18 0.01PHA0388 Artemether/lumefantrine tabs 100 /20m g 24 0.01PHA0001 Aspirin tabs 300mg l,00tl 108.00PHA0415 Atenolol tabs 50mg 1,000 315.00PHA0021 Benzhexol tabs 5mg 1,000 26110P1IA0379PHA0026PHA0027
Calcium/Vit Dj tablets lg /2 0 0 IU 10 39.00Car bn maze pine tab 200mg 1,000 820.00Carbimazole talws 5mg 1,000 2,483.00
PHA0036 Chlorphenamine tabs 4mg 1,000 56.17PHA0039 Chlorpromazine tal)s 100mg 1,000 469.00PHA0432 Ciprofloxacin tabs 250mg 1,000 924.00PHA0436 Codeine Phosphate Tabs 30 mg 100 368.90PHA0048 Cotrlmoxazole tabs 480mg 1,000 438.10PHA0374 Dexamethasone Tabs 0.5mg 1,000 45.00PHA0055 Diazepam tabs 5mg 1,000 81.00PHA0440 Diclofenac Sodium Tabs 50 mg 100 21.40PHA0239 Digoxln tabs 250mcg 500 3,692.00PHA0070 Doxycydine caps 100m g 1,000 631.31PHA0444 Enalaprll Tabs 5mg 100 55.49PHA0073 Hrythromydn tabs 250mg 1,000 1,376.00PHA0078 Ferrous sulphate tabs f /c 200mg 1,000 59.91PHA0079PHA0554PHA0083
Fludoxacillin caps 250mg 1,000 2,177.10Fluconazole Caps 50mg 100 186.87Folic add Ial>s5mg 1,000 48.00
PHA0090 Glibcndamide tabs 5mg 1,000 123.00 v
PHA0091 Haloperidol Tabs 5mg 1,000 1,561.21PHA0414PHA0130
Hydrochlorothiazide tabs 50mg I bu pro fen tabs f /c 200mg (scored)
1,000 181.041,000 205.00
PHA0331 Ketoconazoie tabs 200mg 30 74.89PHA0143PHA0146
Levothyroxine labs lOOmcg 100 275.00Loperamide caps 2mg 1,000 460.07
PHA0148PHA0549
Magnesium trisilicate co tabs 1,000 98.13Metocloprarnide Tabs lOmg 100 48.00
PHA0378 Metformin tabs 500mg 1,000 973.56PHA0155 Methyldopa tabs f /c 250mg 1,000 1,819.11
Essential Medicines Standard Order Form (Hospitals)
KEMSA code no
, ' f . : ' I V
Item description Name / form / strength
OrderUnitSize
UnitCost
(Kshs)
CurrentStock(units)
■■ • 1AMC(units)
OrderQty
(units)
Ordercost
(K ,l»lPHA0159 Metronidazole labs 200mg 1,000 273.34PHA0160 Multivitamin tabs 1,000 125.00PHA0166 Nifedipine tabs s /r 20mg 1,000 299.00PHA0493 Omeprazole caps 20mg 1,000 1,300.00PHA0332 Paracetamol tabs lOOmg 1,000 64.00PH AO] 78 Paracetamol tabs 500mg 1,000 185.00PHA0182 Phenobarbitone tabs 30mg 100 20.00PHA0183 Phenytoin tabs 50mg 1,000 252.00

Essential Medicine* Standard Order Form (Hospitals)
k e m s acode no
Item description Name / fonn / strength
OrderUnitSize
UnitGoat
(Kshs)
CurrentStock(units)
AMG(units)
OrdeiQty
(iinita)
Ordercost
(Kshit)
PHA0038 CWorpromazine ini 25m g/m L 2mL amp r 4.00PHA0438 Cotrimoxazole Inj. 96mg/ml,5ml amp i * 174.45PHA0050 Darrow's Vi strength IV infusion 500mL i * 23.00PHA0375 Dexamethasone inj 4m g/ mL, lmL amp r 7.65
'PHA0Q51 Dextran 7 0 /glucose 6% /5% infusion 500mL i * 300.00PH A0054 Diazepam inj 5m g/ m l, 2mL amp i * 4.25PHA0348 Diclofenac inj 25 m g / mL, 3mL amp i* 3.88PHA0488 Digoxin Inj 50mcg/ml, 2ml amp. i * 21208PHA0082 Fluphenazine decanoate inj 25m g/lm L amp i* 28.00
I PHA0085 Furosemide inj 10m g / mL, 2mL amp i * 4.29PHA0087 Gentamicin inj lO m g/m L 2mL amp i * 285PHA0088 Gentamicin inj 40mg/mL, 2mL amp i* 235PHA0052 Glucose infusion 5 * , 500mL i» 34.00PHA0421 Glucose infusion 10%, 500m L i * 34.00PHA0053 Glucose injection 50%, lOOmL i * 34 50PHA0447 Haloperidol Decan. Inj. 50m g / ml, 1ml amp. i * 160.00
——PHA0120 Heparin inj 5,000 IU/mL, 5mL vial i * 80.00
PHA0123 Hydralazine inj 20m g amp pfr i * 99.80PHA0124 Hydrocortisone inj lOOmg vial i * 16.96PH A 0412 Insulin biphasic 30/70100 IU/ mL lOmL vial i * 418.00PHA0139 Insulin soluble, human 100 IU /m L lOmL vial i * 475.00PHA0142 Ketamine injection 50m g/ mL 10mL vial i * 40.50PHA0145 Lidocairte inj 2% 30ml. amp i* 13.00DEN0020 Lignocaine/adren. dental cart 2% + 1:80,000 100 1,800.00PHA0287 Magnesium sulphate inj 50%, lOmL amp i * 179.00PHA0357 Metodopramide inj. 5mg/ ml, 2ml amp. l* 272PHA0156 Metronidazole inj 5mg/mL, 100mL vial i * 18.80PHA0453 Morphine inj. 10m g/ ml, 1ml amp. l* 39.75PHA0163 Neostigmine methyLsulph. 25m g/m L lmL amp i * 13.50PHA0174 Oxytocin inj 10 IU /m L lmL amp l* 1206PHA0175 Pancuronium bromide inj 2mg/mL, 2mL amp i * 36.12PHA0180 Pethidine inj 50mg/mL, 2mL amp l* 31.00PHA0181 Pethidine inj 50mg/mL, lm L amp i * 30.00PHA0289 Phytomenad.inj (Vit K,) 2mg/mL, 0.2mL amp i* 80.00FHA0290 Phytomenad.inj (Vit K) 10mg/mL, lmL amp i* 56.00PHA0461 Pralidoxine Mesylate inj.fPAM) 200mg/ml, lm i amp. l - 1,900.00PHA0192 Quinine dihydrochloride inj 300mg/mL 2mL amp i * 8.93PHA0351 Sod.stibogluconate inj lOOrng/mL 100mL amp l* 7,125.00PHA0204 Sodium bicarbonate inj 8.4%, lOmL amp l* 58.30PHA0169 Sodium chloride IV infusion 0.9% l* 24.00PHA0094 Sodium lactate co IV infusion (Hartmann's) i * 23.00PHA0217 Suxamethonium chloride inj 50m g/m L 2mL amp l* 2400PHA0224 Thiopentone inj 500mg vial pfr l* 39.08PHA0365 Vecuronium bromide lOmg vial pfr i * 790.00

Fawntial Medicines Standard Order form (Hospitals)
KEMSA code no
Item description Name / form / strength
OrderUnitSize
UnitCost
(Kshs)
CurrentStock(unit*)< ■- 1 ;
AMC(units)
OrderQty
(units)
Ordercost
(Kshs)
PHA0337 Vincristine suphate irtj lm g /lm L vial 1* 121.00PHA0229 Water for insertion lOmL amp 1* 1.98
d) Essential Medicines: External Medicines/Other ItemsNPH0138 Alcohol pre-injection swabs 200 0.00NPH00430 Atropine Sulphate eye drops 1 % 5ml 190.00PHA0411 Beclomethasone inhal. 1 OOmcg/ dose (200 doses) 1 400 00PHA0235 Benzyl Benzoate Application 25% 100ml 0.01PHA0280 Calamine Lotions 15 * 100ml 20.00PHA0029 Cetrimide / chlorhexidine so in 15% /1.5% 5L 681.00PHA0034 Chlorhexi dine gluconate 5% so In (for dilution) 5L 690.00PHA0044 Clotrimazole cream 1 % 5.99PHA0045 Clotrimazole pessaries lOOmg (+ applicator) 6 10.48PHA0147 Cresol/soap solution (Lysol) 5L 745.08PHA0069 Dispensing envelopes plastic resealable 10x1000 3,233.97PHA0446 Ethanol denatured 94% 5L 405.00PHA0338 Gentamycin eye Drops 0.3% 5ml 7.49PHA0093 Haiothane inhalation 250m L 1,362.00PHA0248 Hydrocortisone ointment 1% 15g 15.00PHA0137 IV infusion giving set with air inlet 1 1200PHA0186 Povidone iodine solution 10% 5L 850.00PHA0463 Salbutamol inhaler 1 OOmcg/ dose (200 doses) 1 135.42PHA0464 Salbutamol nebuliser so In 5mg/mL, lOmL vial 1 398.29PHA0465 Silver Sulphadiazine cream 1% 250g 90.00PHA0205 Sodium hypochlorite solution 4-6% 5L 220.00PHA0223 Tetracycline eye ointment 1% 5g tube 1* 8.70
e) Reproductive Health Supplies (currently supplied at no cost under pull system)NPH0021 Condom, female 1 0.01NPH0022 Condom, male 1 0.01
KTT0007 Depot Medroxyprogesterone acetate 150mg injKit
(lxlOOviais)
0.01
PHA0255 Levonorgestrel implant 75mg 10's 0.01PHA0408 Etonogestrel Implant 68mg 1 0.01PHA0252 Implant insertion kit Kit 0.01FHA0250 IUD Copper T 25's 0.01PHA0251 IUD insertion/removal kit 1 0.01
PHA0241 Levonorgestrel/ethinylestradiol tab 0.15mg/0.03mg (COG)
1x21 0.01
PHA0346 Levonorgestrel tab 30mcg (POP) 1x35 0.01PHA0263 Levonorgestrel tab 750mcg (EC) 2 0.01
Total Order Value KshsDrawing Rights Available Balance KshsPrepared by (name/Pharmacist j/c) Date SignatureAuthorised by (name/MedSup) Date SignatureNote: Items with a * against Order Unit Size may only be ordered in multiples of the KEMSA Minimum Order Size (MOS)

PHA0333 Praziquantel tabs 600mg 500 4,212501PHA0187 Prednisolone tabs 5me 1,000 297.24PHA0291 Quinine sulphate tabs 300mg 1,000 1,190.73PHA0201 SaJbutamol tabs 2mg 1,000 52.42PHA0214 Sulfadoxine/pyrimethamine tabs 500/25mg 1,000 1,160.78PHA0225 Tinidazole tabs 500mg 1,000 475.58PHA0470 Zinc Sulphate Tabs 20mg 100 240.00
b) Essential Medicines: Oral liquidsPHA0011 Amoxicillin syrup 125mg/5mL lOOmL 16.00PHA0330 Amoxicillin/davulanic add oral susp 228mg/5mL 70mL 146.00PHA0037 Chlorphenamine syrup 2mg/mL 2L 47.54PHA0046 Cotrimoxaznle suspension 240mg/5mL 50mL 9.21PHA0487 Digoxin Oral Solution lOOmcg/ml 100ml 1,402.21PHA0072 Erythromycin oral susp 125mg/5mL lOOmL 38.05PHA0158 Metronidazole oral susp 200mg/5mL lOOmL 1600PHA0170 Nystatin oral susp 100,000 IU/mL 30m L 25.00PHA0173 ORS sachet for 500mL (new formula) 1* 2.77PHA0176 Paracetamol susp 120mg/5mL 5L 265.00PHA0200 Salbutamol oral solution 2mg/5mL 100mL 11.25
c) Essential Medicines: ParenteralsPHA0002 Adrenaline (epinephrine) inj lm g /lm L amp 1* 3.30PHA0004 Aminophylline inj 25mg/ m l, lOmL amp 1* 5.50PHA0017 Atropine sulphate inj lm g/m L , lm L amp 1* 4.00PHA0019 Benzathine penicillin inj 2.4 MU vial (pfr) 1* 14.40PHA0024 Benzylpemcillin inj 3g (5MU) vial (pfr) 1* 15.85PHA0025 Benzylpenidllin inj 600mg (1MU) vial (pfr) 1* 3.76PHA0429 Bupivacaine heavy spinal inj 5mg/mL, 4mL amp 1* 20.00PHA0285 Ceftriaxone inj Ig (pfr) 1* 41.19PHA0028 Ceftriaxone inj 250mg (pfr) 1* 21.70PHA0032 Chloramphenicol inj lg (pfr) 1* 14.25PHA0035 Chlorphenamine inj lOmg/mL, lmL amp 1* 3.00