application of the reverse engineer in the …wfb/ammi/publications/6... · application of the...
TRANSCRIPT
APPLICATION OF THE REVERSE ENGINEER IN THE MODELING OF A FRANCIS TURBINE IN A HYDROELECTRIC MINIPOWER STATION
Manuel J. García R. Pierre Boulanger Jaime Barbosa P. John Betancur M. Departamento de Ingeniería
Mecánica, Universidad EAFIT, Medellín-Colombia
AMMI Laboratory University of Alberta
Canada [email protected]
Departamento de Ingeniería Mecánica, Universidad EAFIT, Medellín-Colombia
Departamento de Ingeniería Mecánica, Universidad EAFIT, Medellín-Colombia
Brian Quintero A. Leonel F. Castañeda Germán R. Betancur G.
Grupo de Investigación en Mecánica de Fluidos, Universidad
Autónoma de Occidente, Cali-Colombia
Departamento de Ingeniería Mecánica, Universidad EAFIT, Medellín-Colombia
Departamento de Ingeniería Mecánica, Universidad EAFIT, Medellín-Colombia
Abstract - This article presents a method for the geometry reconstruction of a Francis turbine installed in a hydroelectric Minipower-station in Colombia. In order to obtain the geometrical CAD model techniques as basic metrology, surface scanning, 3D digitalization, and development of moulds were used. The modeling process was based on the measurements taken directly from the machine and matched against the original incomplete drawings. The Francis Turbine is composed for five main components: Spiral case, Runner, Covers with Fixed Blades, Regulatory Blades and Draft Tube. The importance of this reconstruction method is that the resulting CAD geometry can be use in: a) restoration and rehabilitation using robotic repairing systems through the automatic generation of CNC codes and schematic groups of profiles, b) Simulation of the fluid dynamics and structural behavior by using Computational Fluid Dynamics (CFD) and Finite Element Methods (FEM), c) Estimation of remaining life using CFD, FEM and experimental techniques in site, and d) Development of diagnostic methods from vibration measurements..
I INTRODUCTION Reverse engineering is a rapidly evolving
discipline, which covers a multitude of activities. While conventional engineering transforms engineering concepts and models into real parts, in reverse engineering real parts are transformed into engineering models and concepts [1], [2]. Reverse
engineering typically starts with measuring an existing object so that a surface or solid model can be deduced in order to exploit the advantages of CAD/CAM technologies.
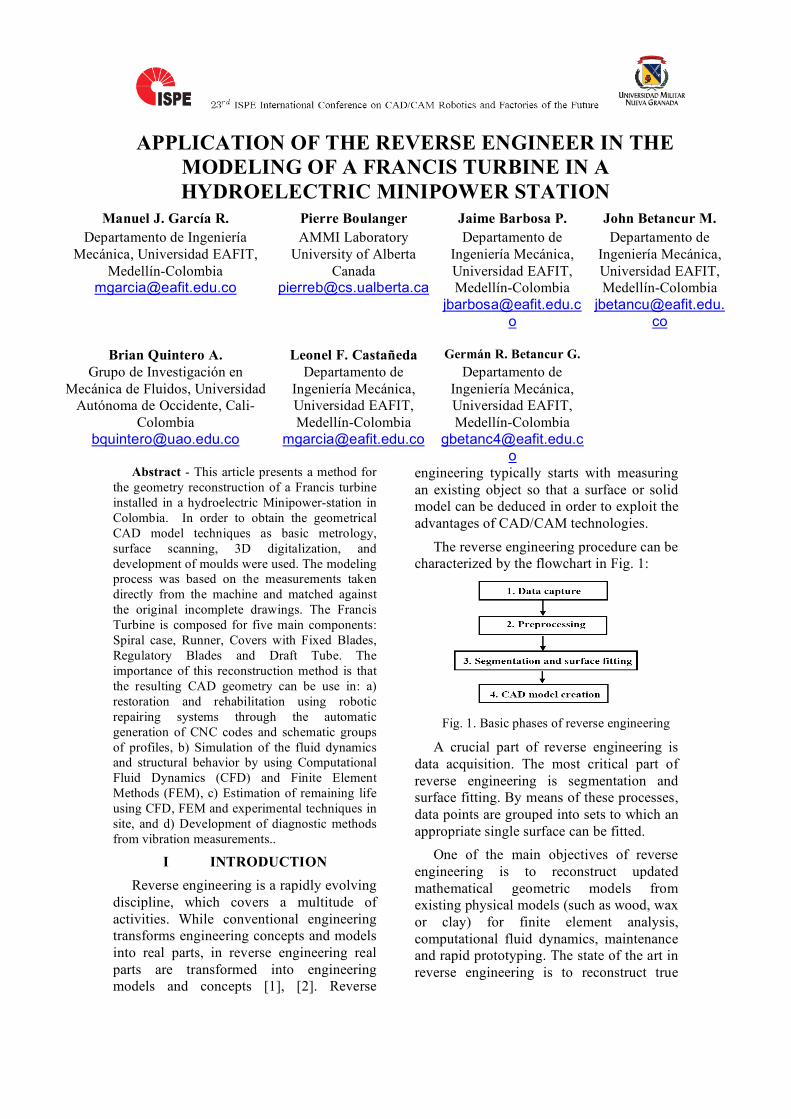
The reverse engineering procedure can be characterized by the flowchart in Fig. 1:
Fig. 1. Basic phases of reverse engineering
A crucial part of reverse engineering is data acquisition. The most critical part of reverse engineering is segmentation and surface fitting. By means of these processes, data points are grouped into sets to which an appropriate single surface can be fitted.
One of the main objectives of reverse engineering is to reconstruct updated mathematical geometric models from existing physical models (such as wood, wax or clay) for finite element analysis, computational fluid dynamics, maintenance and rapid prototyping. The state of the art in reverse engineering is to reconstruct true
geometric shapes from physical objects in an efficient and accurate way.
Some fast 3D digitizers, such as laser range finders, stereo image detectors, moiré interferometers and structured lighting devices, have been developed to rapidly capture clouds of surface points. Unfortunately, the scanning results from these devices are error prone and not reliable when problems, like unexpected light disturbance and invisible occluded surface regions, are encountered in the digitizing process. Furthermore, existing digitized errors are very difficult to reduce from the measured result. Consequently, the reconstructed surfaces could lose their true shape in the design cycle. The time required for reprocessing in this case would be unacceptable to the manufacturing industry and thereby be unusable for further steps. This case study presents an innovative industrial application by applying an integrated reverse engineering approach to the geometry reconstructions of a hydraulic turbine. It combines drawings information, measurement in site, 3-D laser scanning, and mold imprints. This reconstructed geometry can be used for fluid dynamic studies, and structural analysis that would give rise to improvements in the design of low power hydraulic turbines.
II METHODS OF RECONSTRUCTION
A Basic Metrology During the measurement process of the
most relevant parts of the turbine geometry, length measurement instruments were used. These instruments were calibrated at the metrology laboratory of EAFIT University. This laboratory is certified under the NTC-ISO 17025 norms for Laboratories devotes to testing, measurement and calibration of instruments. This is recognized within the necessary traceability to guarantee rigorousness in the obtained data [3]. B 3D Digitalization
Non-contact digitizers use lasers, moiré interferometry, and patterned light techniques. Laser scanners illuminate either
a small spot or a thin line of light on the surface of an object. Systems that project a line are hundreds of times faster at collecting point data than those illuminating a spot of light. Since planar scanners cover area faster than point scanners, they are useful for reverse engineering tasks involving large objects. Both use a technique known as optical triangulation to determine the location of points in 3D space. A directed laser beam is set-up at a baseline distance from a digital camera, oriented at a known angle with respect to the beam. The pupil of the camera collects light scattered back by the object. From the position of the light point as seen by the sensor it is possible to calculate the range and angle between the laser and the illuminated point of the object. In an established coordinate system, the (x, y, z) coordinates of the point can be obtained by these range measurements.
Laser digitizing ensures complete coverage of a part and enables digitization of the most intricate detail. The laser scanning process captures sweeping curves and lofted surfaces that are difficult to measure using more traditional measurement technologies. Accuracy of these devices can be up to 0.1mm. Laser digitizing is not without its limitations. Because the process is based on analyzing reflected light, it is susceptible to misinterpreting light reflected from certain surface types. Similarly, transparent and translucent objects may reflect some of the light from within them, corrupting the surface coordinates. The triangulation technology has difficulty picking up light reflected from a right angle, although multi-axis scanning mitigates this problem. Laser digitizing works best with white or light gray objects with a flat matte finish. As long as doing so would not harm the object, as it would in the case of artwork or valuable artifacts, paint or powder can be applied to the object to overcome the aforementioned problems. For objects beyond the 0.2m – 2m range, a time-of-flight range measurement approach may be better suited. A laser or light beam emitting device is still used but the coordinate location of the reflected light is calculated by its path of travel in
combination with the time for the return trip from source to sensor. Medical and industrial scans, such as MRI (magnetic resonance imaging) and CT (computer tomography) are non-contact approaches that obtain dimensional data from the interior of an object [4].
Reverse engineering of turbines blades has been explored by Lian-Chia Chen et al [5] and presented a case study on reverse engineering of turbine blades used in nuclear power generators.
The 3D reconstruction of free-form using images has been explored [6]. The objects or scenes from range images, also known as depth maps, is preferable than using intensity images or stereoscopy. These maps represent information of distances measured from an observer (optical sensor or camera) to the scene in a rectangular grid. Therefore, the 3D information is explicit and will not need to be recovered as in the case of intensity images.
III MEASUREMENT SYSTEMS The geometry of the turbine was not fully
nor clearly described in the drawings. They were lack of relevant information for the geometrical reconstruction and that’s why the procedure involved both the original drawings and other kind of measurements.
In order to model geometrically the five main components of the turbine, spiral case, covers with fixed blades, regulatory blades, runner and draft tube a variety of techniques were used. The main technique used was direct measurements from the real model and comparison with the assembly drawings provided by the company. These measurements were also indirect by making molds of parts in low-density polyurethane. Each component was modeled depending on the information that could be obtained from it and their accessibility, which lead to the most accurate and effective result.
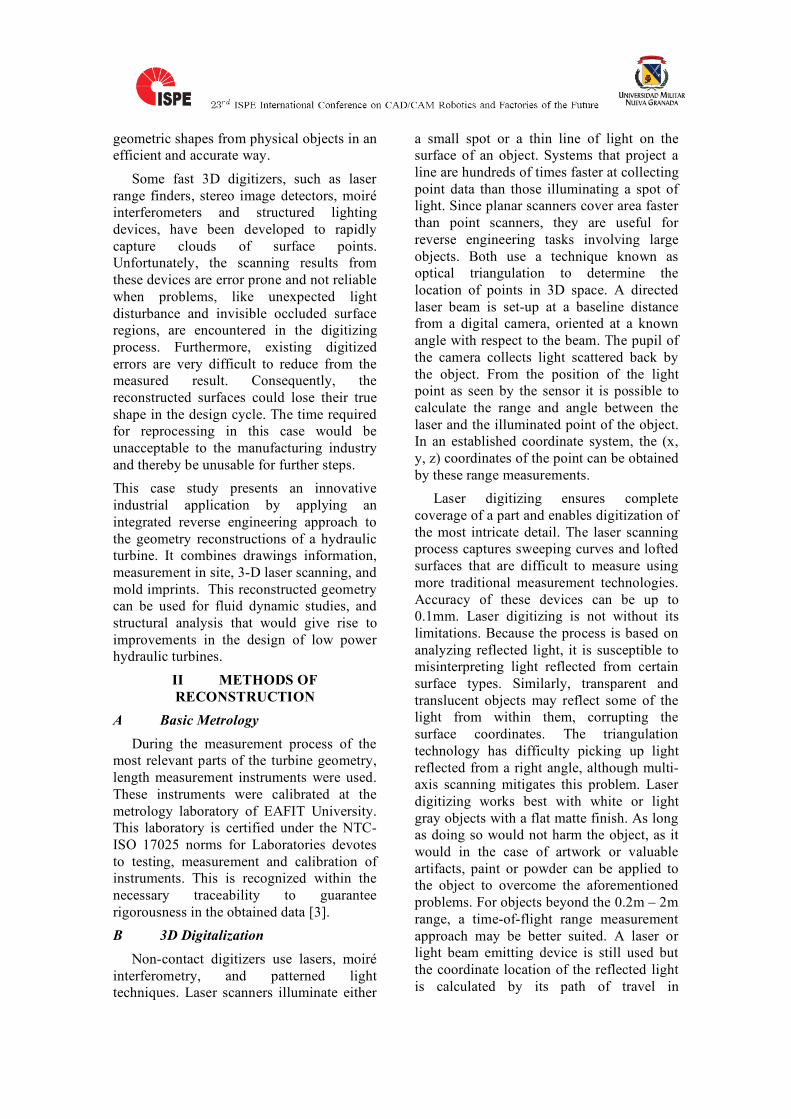
A Spiral Case The first step was the CAD modeling of
the spiral case. A picture of it is showed in Fig. 2.
Fig. 2. Real picture of spiral case
To obtain the spiral case’s geometry, physical measures were taken at the minipower-station site. Furthermore, these measures were verified with several assembly drawings from which some other dimensions were taken due to the impossibility to measure them in place.
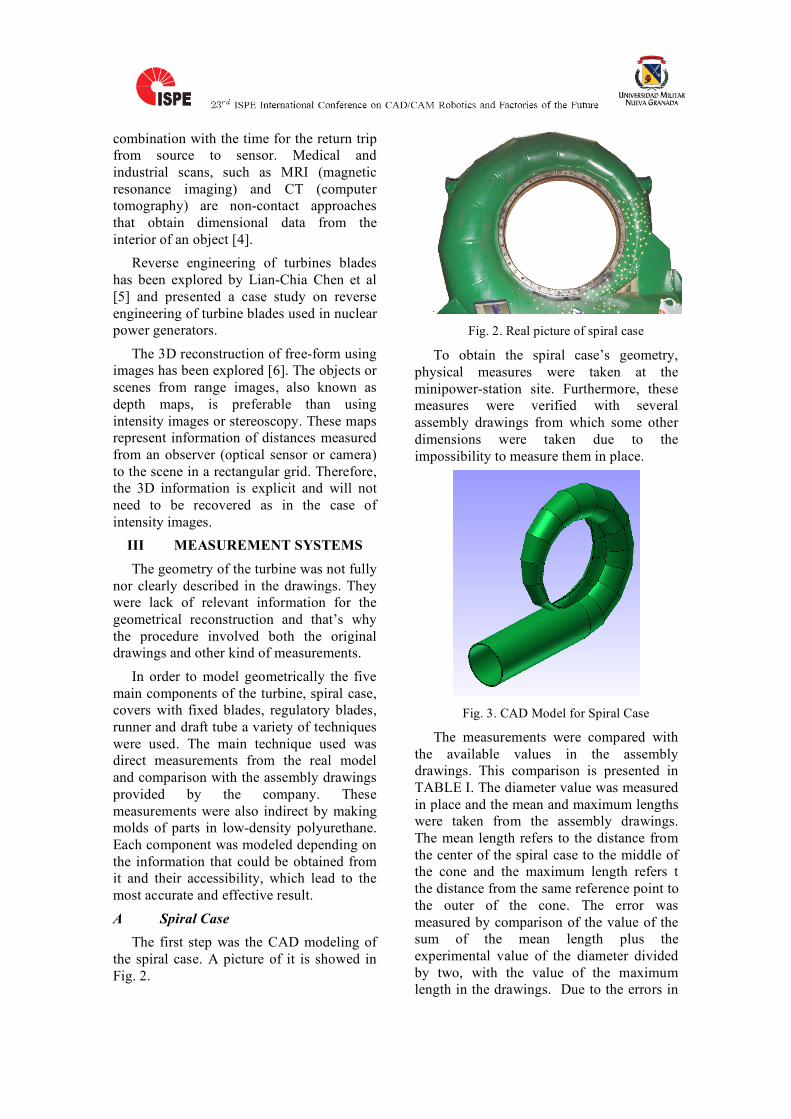
Fig. 3. CAD Model for Spiral Case
The measurements were compared with the available values in the assembly drawings. This comparison is presented in TABLE I. The diameter value was measured in place and the mean and maximum lengths were taken from the assembly drawings. The mean length refers to the distance from the center of the spiral case to the middle of the cone and the maximum length refers t the distance from the same reference point to the outer of the cone. The error was measured by comparison of the value of the sum of the mean length plus the experimental value of the diameter divided by two, with the value of the maximum length in the drawings. Due to the errors in
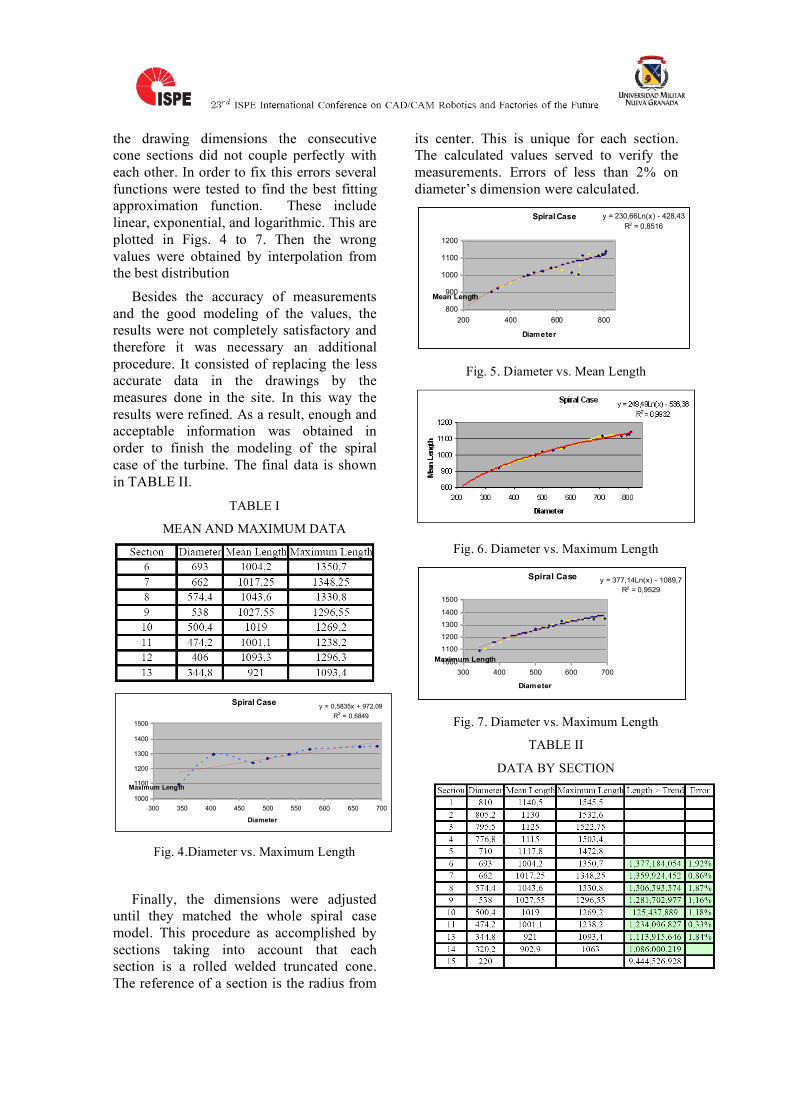
the drawing dimensions the consecutive cone sections did not couple perfectly with each other. In order to fix this errors several functions were tested to find the best fitting approximation function. These include linear, exponential, and logarithmic. This are plotted in Figs. 4 to 7. Then the wrong values were obtained by interpolation from the best distribution
Besides the accuracy of measurements and the good modeling of the values, the results were not completely satisfactory and therefore it was necessary an additional procedure. It consisted of replacing the less accurate data in the drawings by the measures done in the site. In this way the results were refined. As a result, enough and acceptable information was obtained in order to finish the modeling of the spiral case of the turbine. The final data is shown in TABLE II.
TABLE I
MEAN AND MAXIMUM DATA
Spiral Case
y = 0,5835x + 972,09
R2 = 0,6849
1000
1100
1200
1300
1400
1500
300 350 400 450 500 550 600 650 700
Diameter
Maximum Length
Fig. 4.Diameter vs. Maximum Length
Finally, the dimensions were adjusted until they matched the whole spiral case model. This procedure as accomplished by sections taking into account that each section is a rolled welded truncated cone. The reference of a section is the radius from
its center. This is unique for each section. The calculated values served to verify the measurements. Errors of less than 2% on diameter’s dimension were calculated.
Spiral Case y = 230,66Ln(x) - 428,43
R2 = 0,8516
800
900
1000
1100
1200
200 400 600 800
Diameter
Mean Length
Fig. 5. Diameter vs. Mean Length
Fig. 6. Diameter vs. Maximum Length
Spiral Case y = 377,14Ln(x) - 1089,7
R2 = 0,9529
1000
1100
1200
1300
1400
1500
300 400 500 600 700
Diameter
Maximum Length
Fig. 7. Diameter vs. Maximum Length
TABLE II
DATA BY SECTION
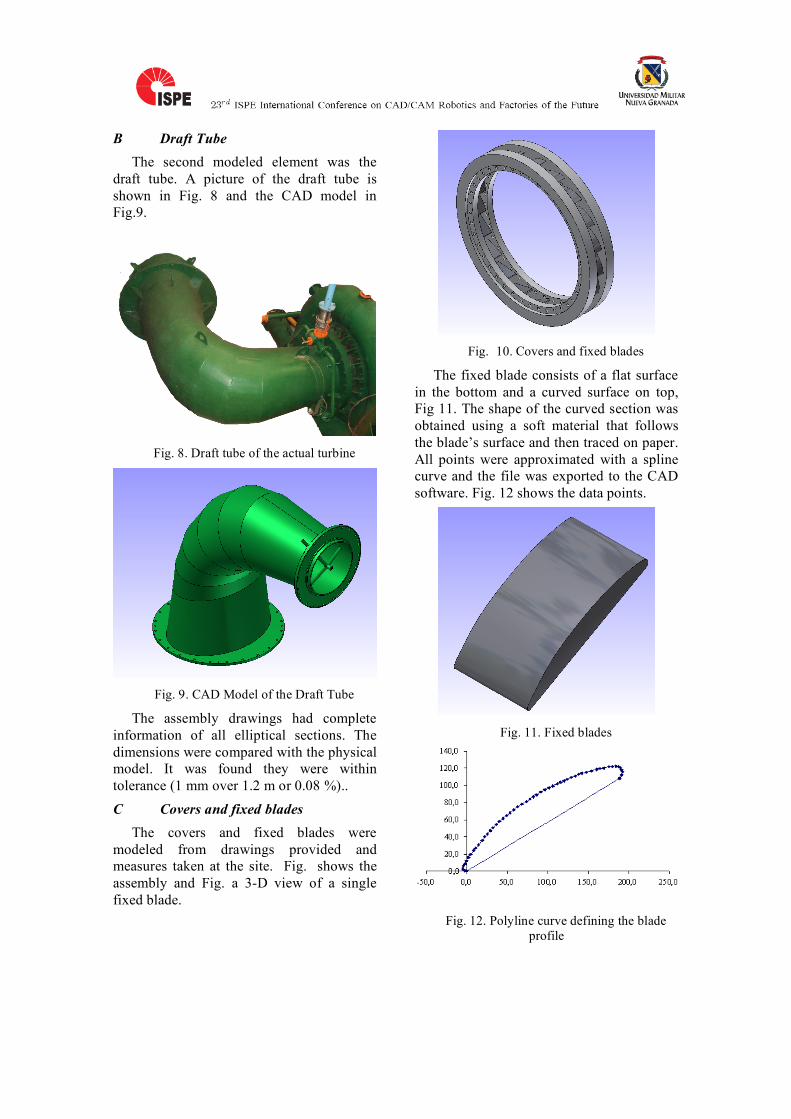
B Draft Tube
The second modeled element was the draft tube. A picture of the draft tube is shown in Fig. 8 and the CAD model in Fig.9.
Fig. 8. Draft tube of the actual turbine
Fig. 9. CAD Model of the Draft Tube
The assembly drawings had complete information of all elliptical sections. The dimensions were compared with the physical model. It was found they were within tolerance (1 mm over 1.2 m or 0.08 %)..
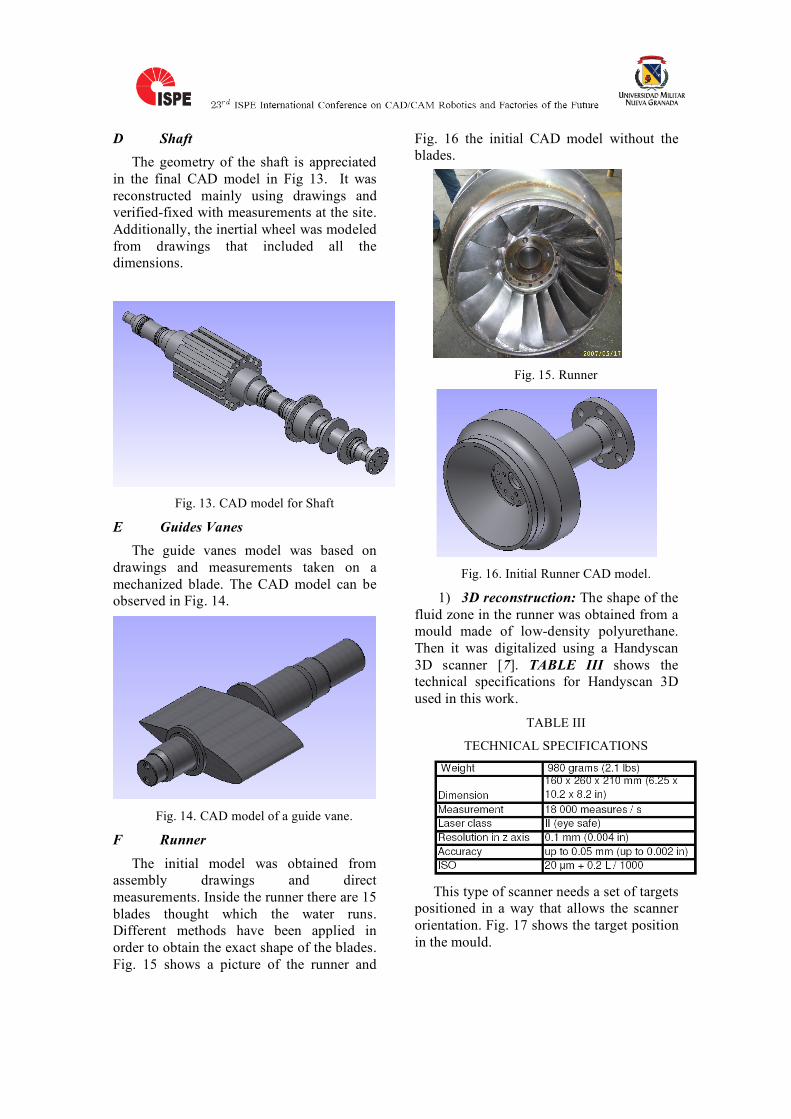
C Covers and fixed blades The covers and fixed blades were
modeled from drawings provided and measures taken at the site. Fig. shows the assembly and Fig. a 3-D view of a single fixed blade.
Fig. 10. Covers and fixed blades
The fixed blade consists of a flat surface in the bottom and a curved surface on top, Fig 11. The shape of the curved section was obtained using a soft material that follows the blade’s surface and then traced on paper. All points were approximated with a spline curve and the file was exported to the CAD software. Fig. 12 shows the data points.
Fig. 11. Fixed blades
Fig. 12. Polyline curve defining the blade
profile
D Shaft
The geometry of the shaft is appreciated in the final CAD model in Fig 13. It was reconstructed mainly using drawings and verified-fixed with measurements at the site. Additionally, the inertial wheel was modeled from drawings that included all the dimensions.
Fig. 13. CAD model for Shaft
E Guides Vanes The guide vanes model was based on
drawings and measurements taken on a mechanized blade. The CAD model can be observed in Fig. 14.
Fig. 14. CAD model of a guide vane.
F Runner The initial model was obtained from
assembly drawings and direct measurements. Inside the runner there are 15 blades thought which the water runs. Different methods have been applied in order to obtain the exact shape of the blades. Fig. 15 shows a picture of the runner and
Fig. 16 the initial CAD model without the blades.
Fig. 15. Runner
Fig. 16. Initial Runner CAD model.
1) 3D reconstruction: The shape of the fluid zone in the runner was obtained from a mould made of low-density polyurethane. Then it was digitalized using a Handyscan 3D scanner [7]. TABLE III shows the technical specifications for Handyscan 3D used in this work.
TABLE III
TECHNICAL SPECIFICATIONS
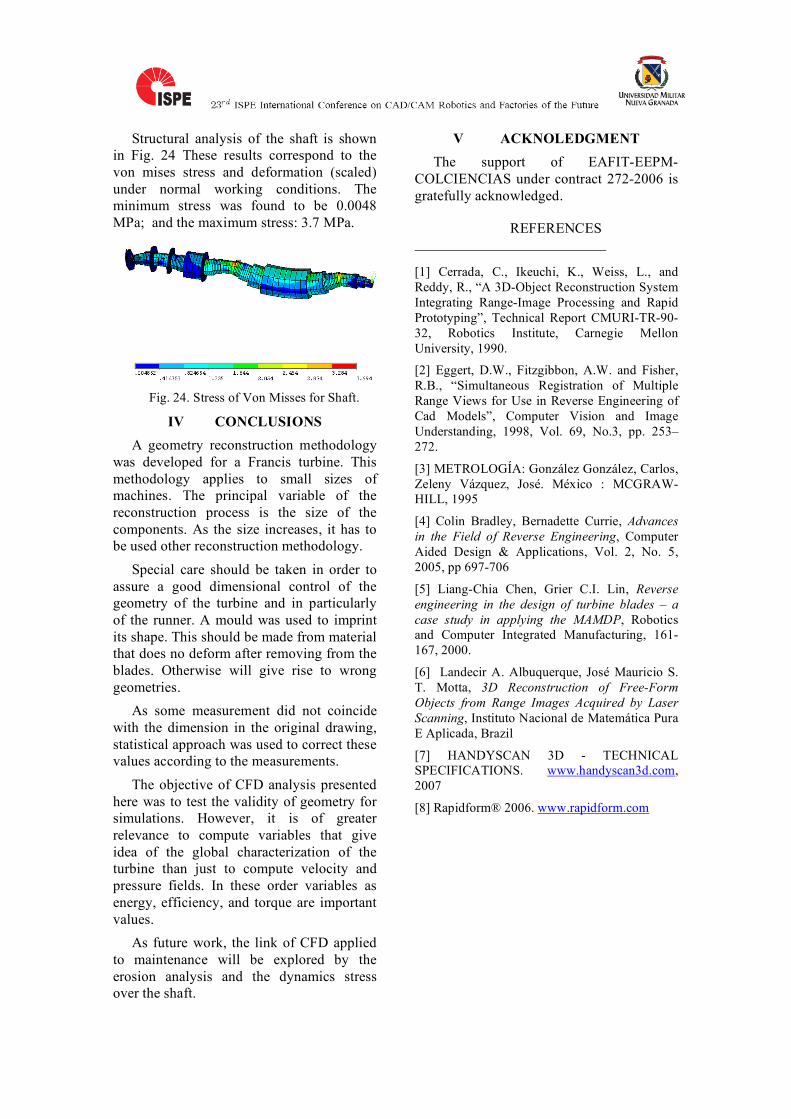
This type of scanner needs a set of targets
positioned in a way that allows the scanner orientation. Fig. 17 shows the target position in the mould.
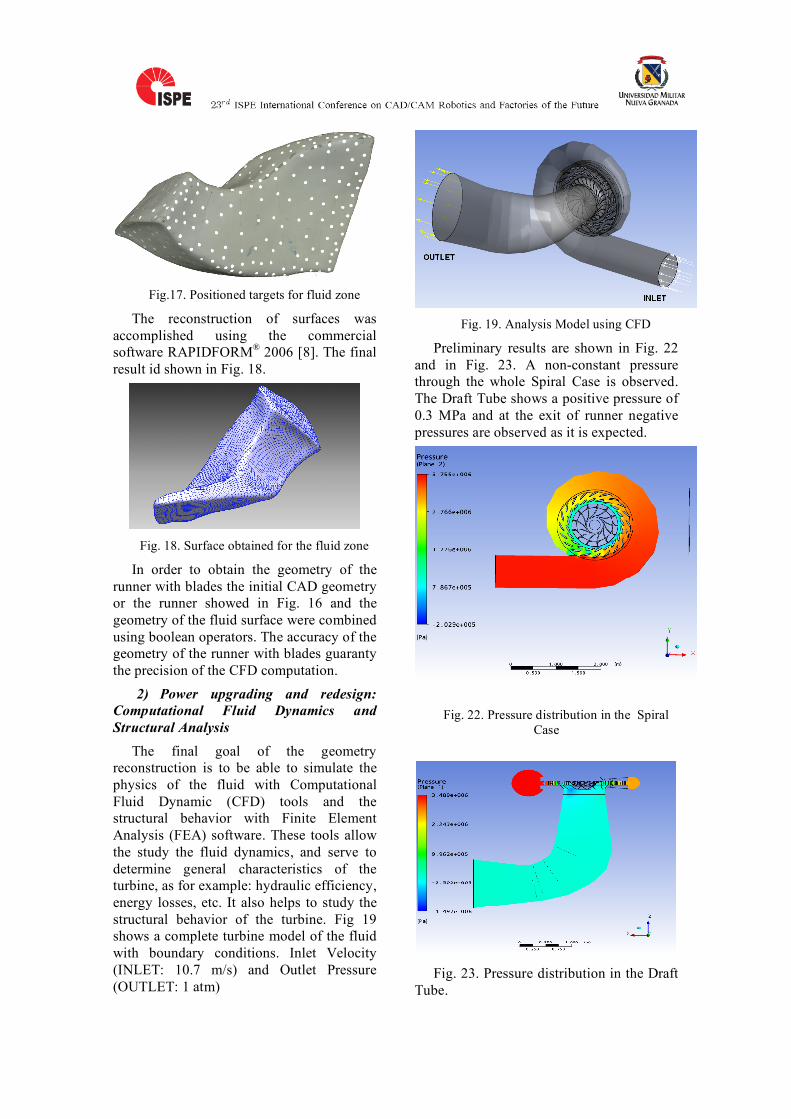
Fig.17. Positioned targets for fluid zone
The reconstruction of surfaces was accomplished using the commercial software RAPIDFORM® 2006 [8]. The final result id shown in Fig. 18.
Fig. 18. Surface obtained for the fluid zone
In order to obtain the geometry of the runner with blades the initial CAD geometry or the runner showed in Fig. 16 and the geometry of the fluid surface were combined using boolean operators. The accuracy of the geometry of the runner with blades guaranty the precision of the CFD computation.
2) Power upgrading and redesign: Computational Fluid Dynamics and Structural Analysis
The final goal of the geometry reconstruction is to be able to simulate the physics of the fluid with Computational Fluid Dynamic (CFD) tools and the structural behavior with Finite Element Analysis (FEA) software. These tools allow the study the fluid dynamics, and serve to determine general characteristics of the turbine, as for example: hydraulic efficiency, energy losses, etc. It also helps to study the structural behavior of the turbine. Fig 19 shows a complete turbine model of the fluid with boundary conditions. Inlet Velocity (INLET: 10.7 m/s) and Outlet Pressure (OUTLET: 1 atm)
Fig. 19. Analysis Model using CFD
Preliminary results are shown in Fig. 22 and in Fig. 23. A non-constant pressure through the whole Spiral Case is observed. The Draft Tube shows a positive pressure of 0.3 MPa and at the exit of runner negative pressures are observed as it is expected.
Fig. 22. Pressure distribution in the Spiral Case
Fig. 23. Pressure distribution in the Draft
Tube.
Structural analysis of the shaft is shown
in Fig. 24 These results correspond to the von mises stress and deformation (scaled) under normal working conditions. The minimum stress was found to be 0.0048 MPa; and the maximum stress: 3.7 MPa.
Fig. 24. Stress of Von Misses for Shaft.
IV CONCLUSIONS A geometry reconstruction methodology
was developed for a Francis turbine. This methodology applies to small sizes of machines. The principal variable of the reconstruction process is the size of the components. As the size increases, it has to be used other reconstruction methodology.
Special care should be taken in order to assure a good dimensional control of the geometry of the turbine and in particularly of the runner. A mould was used to imprint its shape. This should be made from material that does no deform after removing from the blades. Otherwise will give rise to wrong geometries.
As some measurement did not coincide with the dimension in the original drawing, statistical approach was used to correct these values according to the measurements.
The objective of CFD analysis presented here was to test the validity of geometry for simulations. However, it is of greater relevance to compute variables that give idea of the global characterization of the turbine than just to compute velocity and pressure fields. In these order variables as energy, efficiency, and torque are important values.
As future work, the link of CFD applied to maintenance will be explored by the erosion analysis and the dynamics stress over the shaft.
V ACKNOLEDGMENT The support of EAFIT-EEPM-
COLCIENCIAS under contract 272-2006 is gratefully acknowledged.
REFERENCES [1] Cerrada, C., Ikeuchi, K., Weiss, L., and Reddy, R., “A 3D-Object Reconstruction System Integrating Range-Image Processing and Rapid Prototyping”, Technical Report CMURI-TR-90-32, Robotics Institute, Carnegie Mellon University, 1990.
[2] Eggert, D.W., Fitzgibbon, A.W. and Fisher, R.B., “Simultaneous Registration of Multiple Range Views for Use in Reverse Engineering of Cad Models”, Computer Vision and Image Understanding, 1998, Vol. 69, No.3, pp. 253–272.
[3] METROLOGÍA: González González, Carlos, Zeleny Vázquez, José. México : MCGRAW-HILL, 1995
[4] Colin Bradley, Bernadette Currie, Advances in the Field of Reverse Engineering, Computer Aided Design & Applications, Vol. 2, No. 5, 2005, pp 697-706
[5] Liang-Chia Chen, Grier C.I. Lin, Reverse engineering in the design of turbine blades – a case study in applying the MAMDP, Robotics and Computer Integrated Manufacturing, 161-167, 2000.
[6] Landecir A. Albuquerque, José Mauricio S. T. Motta, 3D Reconstruction of Free-Form Objects from Range Images Acquired by Laser Scanning, Instituto Nacional de Matemática Pura E Aplicada, Brazil
[7] HANDYSCAN 3D - TECHNICAL SPECIFICATIONS. www.handyscan3d.com, 2007
[8] Rapidform® 2006. www.rapidform.com