applications - 6th grade math · dezi researches dvd rental prices at local video stores. source...
TRANSCRIPT

Investigation 2 Analyzing Graphs and Tables 35
Applications1. Use the table to answer parts (a)–(e).
a. What weight is predicted for a 1-week-old tiger cub?
b. What weight is predicted for a 10-week-old tiger cub?
c. At what age do tiger cubs typically weigh 7 kilograms?
d. Describe the pattern relating age and weight. Do you expect thispattern to continue indefinitely?
e. Would it make sense to connect the points in a graph of these data?
Typical Weights forTiger Cubs
Expected Body Weight (kg)
Age(weeks)
1.3
2.3
3.0
3.8
4.5
5.2
6.0
6.7
7.5
7.6
8.9
9.7
SOURCE: www.tigerlink.org
birth
1
2
3
4
5
6
7
8
9
10
11
7cmp06se_VP2.qxd 5/19/06 7:56 AM Page 35

2. Dezi researches DVD rental prices at local video stores. Source Videohas a yearly membership package. The manager gives Dezi this table:
Supreme Video does not have membership packages. Dezi makes thegraph below to relate the cost at Supreme Video to the number ofDVDs rented.
a. Both video stores have a good selection of movies. Dezi’s family plans to watch about two movies a month. Which video store should they choose?
b. Write a paragraph explaining to Dezihow he can decide which video store to use.
c. For each store, describe the pattern ofchange relating the number of DVDsrented to the cost.
3. The table shows the fees charged at one of the campgrounds on theOcean Bike Tour.
a. Make a coordinate graph of the data.
b. Does it make sense to connect the points on your graph? Explain.
c. Using the table, describe the pattern of change in the totalcampground fee as the number of campsites increases.
d. How is the pattern you described in part (c) shown in your graph?
Number ofCampsites
TotalCampground Fee
Campground Fees
1
$12.50
2
$25.00
3
$37.50
4
$50.00
5
$62.50
6
$75.00
7
$87.50
8
$100.00
Number of DVDs
Supreme VideoDVD Rentals
Ren
tal C
ost
$0
$40
$80
$20
$60
$100
0 10 20 30
y
x
Number of DVDs Rented
Total Cost
Source Video Membership/Rental Packages
5
$35
10
$40
15
$45
20
$50
25
$55
30
$60
0
$30
36 Variables and Patterns
7cmp06se_VP2.qxd 5/19/06 7:56 AM Page 36

4. Some class officers want to sell T-shirts to raise funds for a class trip.They ask the students in their class how much they would pay for ashirt and record the data in a table.
a. Describe the relationship between the price per shirt and theexpected number of shirt sales. Is this the sort of pattern you would expect?
b. Copy and complete this table to show the relationship betweenprice per shirt and the expected total value of the shirt sales.
c. How would you describe the relationship between price per shirtand expected total value of shirt sales? Is this the sort of patternyou would expect?
d. Use grid paper to make coordinate graphs of the data like the onesstarted below.
e. Explain how your answers to parts (a) and (c) are shown in the graphs.
Price per Shirt
Projected Shirt Sales
Val
ue
of
Shir
t Sa
les
$0
$100
$200
$300
$400
$500
$0 $5 $10 $15 $20 $25
y
x
Price per Shirt
Projected Shirt Sales
Nu
mb
er o
f Sa
les
0
10
20
30
40
50
$0 $5 $10 $15 $20 $25
y
x
Price per Shirt
Number of Shirt Sales
Value of Shirt Sales
Projected Shirt Sales
$10
40
$400
$15
30
■
$20
20
■
$25
10
■
$5
50
$250
Price per Shirt
Number of Shirt Sales
Projected Shirt Sales
$10
40
$15
30
$20
20
$25
10
$5
50
Investigation 2 Analyzing Graphs and Tables 37
7cmp06se_VP2.qxd 5/19/06 7:56 AM Page 37

5. A camping-supply store rents camping gear for $25 per person.
a. Make a table of the total rental charges for 0, 5, 10, 15, 20, 25, 30,35, 40, 45, and 50 campers.
b. Make a coordinate graph using the data in your table.
c. Compare the pattern of change in your table and graph withpatterns you found in Exercise 3. Describe the similarities anddifferences between the two sets of data.
6. The tour operators need to rent a truck to transport camping gear,clothes, and bicycle repair equipment. They check prices at twotruck-rental companies.
a. East Coast Trucks charges $4.25 for each mile driven. Make a table of the charges for 0, 25, 50, 75, 100, 125, 150, 175, 200, 225,250, 275, and 300 miles.
b. Philadelphia Truck Rental charges $40 per day and an additional$2.00 for each mile driven. Make a table of the charges for renting a truck for five days and driving it 0, 25, 50, 75, 100, 125, 150, 175,200, 225, 250, 275, and 300 miles.
c. On one coordinate grid, plot the charge plans for both rentalcompanies. Use a different color to mark each company’s plan.
d. Based on your work in parts (a)–(c), which company offers thebetter deal? Explain.
38 Variables and Patterns
7cmp06se_VP2.qxd 5/19/06 7:56 AM Page 38

Investigation 2 Analyzing Graphs and Tables 39
7. The table shows fees for using a campsite at a state park from 1 day up to the park limit of 10 days.
a. Make a coordinate graph using the table.
b. Does it make sense to connect the points on your graph? Why orwhy not?
c. Describe the pattern relating the variables days of use and campsite fee.
8. Suppose a motion detector tracks the time and the distance traveled as you walk 40 feet in 8 seconds. Match the following (time, distance)graphs with the “stories” that describe each walk.
a. You walk at a steady pace of 5 feet per second.
b. You walk slowly at first and then steadily increase your walkingspeed.
c. You walk rapidly at first, pause for several seconds, and then walk at an increasing rate for the rest of the trip.
d. You walk at a steady rate for 3 seconds, pause for 2 seconds, andthen walk at a steady rate for the rest of the trip.
e. You walk rapidly at first, but gradually slow down as the end of the trip nears.
9. For each walk in Exercise 8, complete a (time, distance) table like theone below. Use numbers that will match the pattern of the walk and its graph.
Time (seconds)
Distance (feet)
2
■
3
■
4
■
5
■
6
■
7
■
8
40
1
■
Graph 1 Graph 2 Graph 3 Graph 4 Graph 5
Days of Use
Campsite Fee
Campsite Fees
2
$30
3
$40
4
$50
5
$60
6
$70
7
$75
8
$80
9
$85
10
$90
1
$20
7cmp06se_VP2.qxd 5/19/06 7:56 AM Page 39

10. The graphs below show five patterns of change in the price per gallonof gasoline. Match each (time, price) graph with the “story” it tells.
a. The price declined at a steady rate.
b. The price did not change.
c. The price rose rapidly, then leveled off for a while, and then declined rapidly.
d. The price rose at a steady rate.
e. The price dropped rapidly at first and then at a slower rate.
11. Multiple Choice Jamie is going to Washington, D.C., to march in aparade with his school band. He plans to set aside $25 at the end ofeach month to use for the trip. Choose the graph that shows howJamie’s savings will build as time passes.
A. B.
C. D. None of these is correct.
Time (mo)
Tota
l Sav
ing
s
$0
$50
$100
$25
$75
$125$150
0 2 4 6 71 3 5
y
x
Time (mo)
Tota
l Sav
ing
s
$0
$50
$100
$25
$75
$125$150
0 2 4 6 71 3 5
y
x
Time (mo)
Tota
l Sav
ing
s
$0
$50
$100
$25
$75
$125$150
0 2 4 6 71 3 5
y
x
Graph 1 Graph 2 Graph 3 Graph 4 Graph 5
40 Variables and Patterns
7cmp06se_VP2.qxd 5/19/06 7:56 AM Page 40

Investigation 2 Analyzing Graphs and Tables 41
12. The graph shows how the temperature changed during an all-day hikeby students.
a. What was the maximum temperature and when did it occur?
b. When was the temperature rising most rapidly?
c. When was the temperature falling most rapidly?
d. When was the temperature about 24˚C?
e. The hikers encounter a thunderstorm with rain. When do you think this happened?
Elapsed Time (hr)
Temperature During Hike
Air
Tem
per
atu
re (
°C)
0
6
12
18
24
30
0 1.0 2.0 3.0 4.0 5.0 6.0
7cmp06se_VP2.qxd 5/19/06 7:56 AM Page 41

Jacy works at a department store. This graph shows parking costs at the parking garage Jacy uses.
13. Multiple Choice How much does Jacy spend to park for less than a half hour?
F. $0.50 G. $0.75
H. $1 J. $1.50
14. Multiple Choice How much does Jacy spend to park for 4 hours and 15 minutes?
A. $6 B. $6.50
C. $6.75 D. $7
Connections15. The area of a rectangle is the product of its
length and its width.
a. Find all whole number pairs of length and width values that give an area of 24 square meters. Record the pairs in a table.
b. Make a coordinate graph of the (length, width) data from part (a).
c. Connect the points on your graph if it makes sense to do so. Explainyour decision.
d. Describe the relationship between length and width for rectanglesof area 24 square meters.
16. The perimeter of any rectangle is the sum of its side lengths.
a. Make a table of all possible whole-number pairs of length and width values for a rectangle with a perimeter of 18 meters.
b. Make a coordinate graph of the (length, width) data from part (a).
c. Connect the points on your graph if it makes sense to do so.Explain your decision.
d. Describe the relationship between length and width for rectanglesof perimeter 18 meters, and explain how that relationship is shown in the table and graph.
Length
Width
Rectangles with anArea of 24 m2
■
■
■
■
…
…
■
■
length
wid
th
Parking Time (hr)
Parking Costs
Co
st
$0
$2
$4
$1
$3
$5$6$7$8$9
0 2 4 61 3 5
y
x
42 Variables and Patterns
For: Help with Exercise 16Web Code: ane-1216
7cmp06se_VP2.qxd 5/19/06 7:56 AM Page 42

Investigation 2 Analyzing Graphs and Tables 43
17. The table below shows the winners and the winning times for thewomen’s Olympic 400-meter dash since 1964.
a. Make a coordinate graph of the (year, time) information. Choose a scale that allows you to see the differences between the winningtimes.
b. What patterns do you see in the table and graph? Do the winningtimes seem to be rising or falling? In which year was the best timeearned?
18. The circumference of a circle is related to its radius by the formula The area of a circle is related to its radius by the formula A = p 3 r2.
a. Make a table showing how the circumference of a circle increases asthe radius increases in 1-unit steps from 1 to 6. Make sure to express the circumferences in terms of p. Then describe the pattern relatingthose two variables.
b. Make a table showing how the area of a circle increases as theradius increases in 1-unit steps from 1 to 6. Make sure to express the areas in terms of p. Then describe the pattern relating those two variables.
C 5 2 3 p 3 r. rC � 2 � p � rA � p � r2
Womenís Ol ympic 400-meter Dash
NameYear
1964
1968
1972
1976
1980
1984
1988
1992
1996
2000
2004
Time(seconds)
52.0
52.0
51.08
49.29
48.88
48.83
48.65
48.83
48.25
49.11
49.41
Celia Cuthbert, AUS
Colette Besson, FRA
Monika Zehrt, E. GER
Irena Szewinska, POL
Martia Koch, E. GER
Valerie Brisco-Hooks, USA
Olga Bryzgina, USSR
Marie-Jose Perec, FRA
Marie-Jose Perec, FRA
Cathy Freeman, AUS
Tonique Williams-Darling, BAH
7cmp06se_VP2.qxd 5/19/06 7:56 AM Page 43

19. Here are the box-office earnings for a movie during each of the firsteight weeks following its release.
a. Make a coordinate graph showing the weekly earnings after eachweek. Because a film’s weekly earnings depend on the number ofweeks it is in theaters, put the weeks in theaters on the x-axis andthe weekly earnings on the y-axis.
b. Explain how the weekly earnings changed as time passed. How isthis pattern of change shown in the table and the graph? Why might this change have occurred?
c. What were the total earnings of the movie in the eight weeks?
d. Make a coordinate graph showing the total earnings after eachweek.
e. Explain how the movie’s total earnings changed over time. How isthis pattern of change shown in the table and the graph? Why might this change have occurred?
Extensions20. Use what you know about decimals to find coordinates of five points
that lie on the line segment between the labeled points on each graph:
a. b. y
x(0, 0)
(0.2, 0.2)
y
x(0, 0)
(2, 2)
Weeks in Theaters
Weekly Earnings(millions)
Box Office Earnings
4
$12
5
$7
6
$4
7
$3
8
$1
3
$18
2
$22
1
$16
44 Variables and Patterns
7cmp06se_VP2.qxd 5/19/06 7:56 AM Page 44

Investigation 2 Analyzing Graphs and Tables 45
21. The graphs below each show relationships between independent(x-axis) and dependent (y-axis) variables. However, the scales on thecoordinate axes are not the same for all the graphs.
a. Which graph shows the dependent variable increasing most rapidlyas the independent variable increases?
b. Which graph shows the dependent variable increasing most slowlyas the independent variable increases?
Graph 1
0
2
4
6
8
10
0 1 2 3 4 5
y
x
Graph 2
0
2
4
6
8
10
0 1 2 3 4 5
y
x
Graph 3
0
1
2
3
4
5
0 1 2 3 4 5
y
x
Graph 4
0
1
2
3
4
5
0 1 2 3 4 5
y
x
7cmp06se_VP2.qxd 5/19/06 7:56 AM Page 45
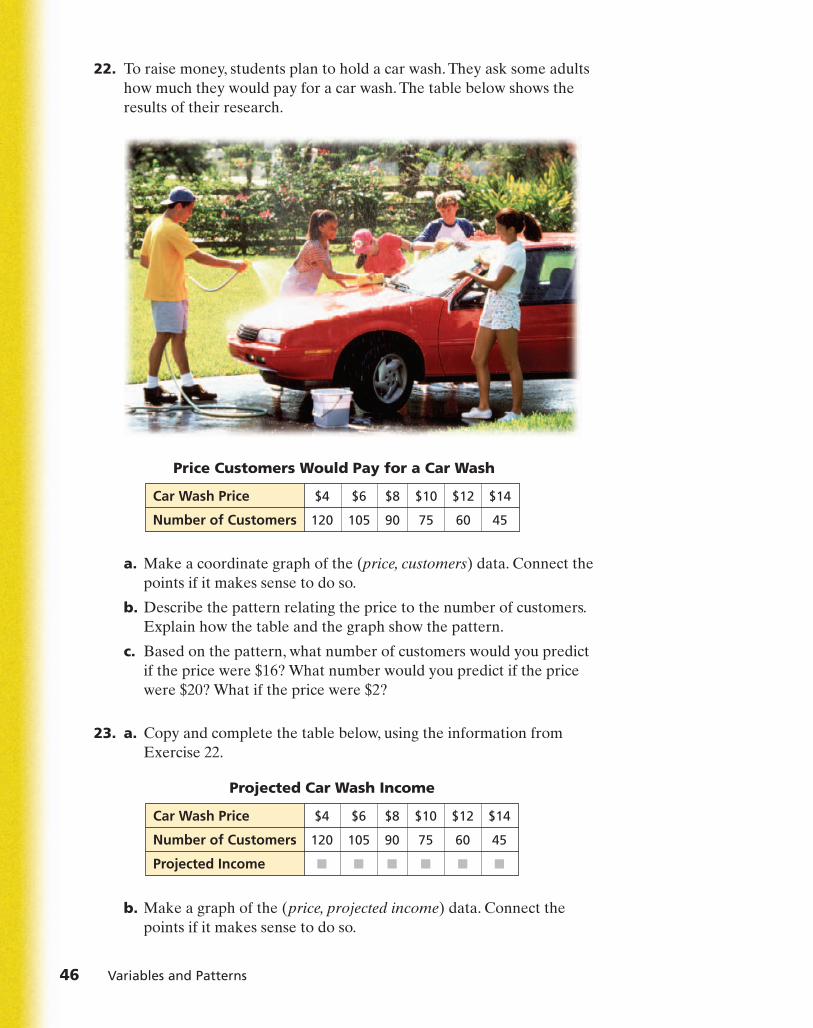
22. To raise money, students plan to hold a car wash. They ask some adultshow much they would pay for a car wash. The table below shows theresults of their research.
a. Make a coordinate graph of the (price, customers) data. Connect thepoints if it makes sense to do so.
b. Describe the pattern relating the price to the number of customers.Explain how the table and the graph show the pattern.
c. Based on the pattern, what number of customers would you predictif the price were $16? What number would you predict if the pricewere $20? What if the price were $2?
23. a. Copy and complete the table below, using the information fromExercise 22.
b. Make a graph of the (price, projected income) data. Connect thepoints if it makes sense to do so.
Car Wash Price
Number of Customers
Projected Income
$6
105
■
$8
90
■
$10
75
■
$12
60
■
$14
45
■
$4
120
■
Projected Car Wash Income
Car Wash Price
Number of Customers
Price Customers Would Pay for a Car Wash
$6
105
$8
90
$10
75
$12
60
$14
45
$4
120
46 Variables and Patterns
7cmp06se_VP2.qxd 5/19/06 7:56 AM Page 46

Investigation 2 Analyzing Graphs and Tables 47
c. Describe the pattern relating the price and the projected income.Explain how the table and the graph show the pattern. Explain why the pattern does or does not make business sense to you.
d. Suppose the shopping center where the students plan to hold thecar wash will charge the students $1.50 per car for water andcleaning supplies. How can you use this factor to find the profit from the car wash for various prices?
24. Adriana is at a skateboard park that has tracks shaped like regularpolygons. Recall that a regular polygon is a polygon with congruentsides and congruent angles. Here are some examples:
At each vertex of a track, Adriana must make a turn.The size of the turn relates to the number of sides in the polygon. For example, at each vertex of the triangle track, she must make a 120° turn.
a. Copy and complete the table below to show how the size of the turn Adriana must make at each vertex is related to the number of sides of the polygon.
b. Make a coordinate graph of the (sides, degrees) data.
c. What pattern of change do you see in the degrees Adriana mustturn as the number of sides increases? How does the table showthat pattern? How does the graph show that pattern?
Track Turns
Number of Sides
Degrees in Turn
4
■
5
■
6
■
7
■
8
■
9
■
10
■
3
120
Regular Quadrilateral(Square)
Regular Pentagon Regular Hexagon
Regular Triangle(Equilateral Triangle)
120°
120°
120°
turn
turn
turn
7cmp06se_VP2.qxd 5/19/06 7:56 AM Page 47