applications of fourier series circuit analysis & design group d
TRANSCRIPT
APPLICATIONS OF FOURIER SERIESCircuit Analysis & Design
GROUP D

Group Members
Akber Raza
Sameed Qureshi
M. Oneeb Ul Haq Khan
Mahnoor Ajaz
Saad Iftikhar
Hareem Shafi
Wu Ranlu
S.M. Zain Zafar
Tauseef Khan
Muhammad Saad
Ali Waqar Durrani
Moeez Akmal

Sinusoidal Steady State
Also known as AC steady-state.
A sinusoidal forcing function when applied to a linear circuit always produces responses in the form of sinusoids.
These sinusoidal forced responses are of the same frequency as that of the source.
In order to find a steady state voltage or current in the circuit, all we need to know is its magnitude and its phase relative to the source.
For this, we use the concepts of phasors and complex impedances.
Phasors and complex impedances convert problems involving differential equations into circuit analysis problems.

Sinusoidal Steady State Analysis
1. Representing sinusoidal function as phasor.
2. Evaluating element impedances at the source frequency.
Impedance is frequency dependent
3. All resistive-circuit analysis techniques can be used for phasors and impedances.
Such as node analysis, mesh analysis, superposition principle, Thevenin theorem, Norton theorem.
4. Converting the phasors back to sinusoidal function.

Phasor Representation of a Sinusoidal Waveform

Fourier Circuit Analysis in the Frequency Domain
The Fourier transform takes an input function f (in red) in the "time domain" and converts it into a new function f-hat (in blue) in the "frequency domain".
In other words, the original function can be thought of as being "amplitude given time", and the Fourier transform of the function is "amplitude given frequency".
Shown here is a simple 6-component approximation of a square wave which is decomposed (exactly, for simplicity) into 6 sine waves. These component frequencies show as very sharp peaks in the frequency domain of the function, shown as the blue graph.


Applications of Fourier Series in Circuit Analysis
Power Spectrum Analyzer
Audio Equalizer
Filter Design (Low Pass Filter)
ECG Machine

Power Spectrum Analyzer

Power Spectrum Analyzer
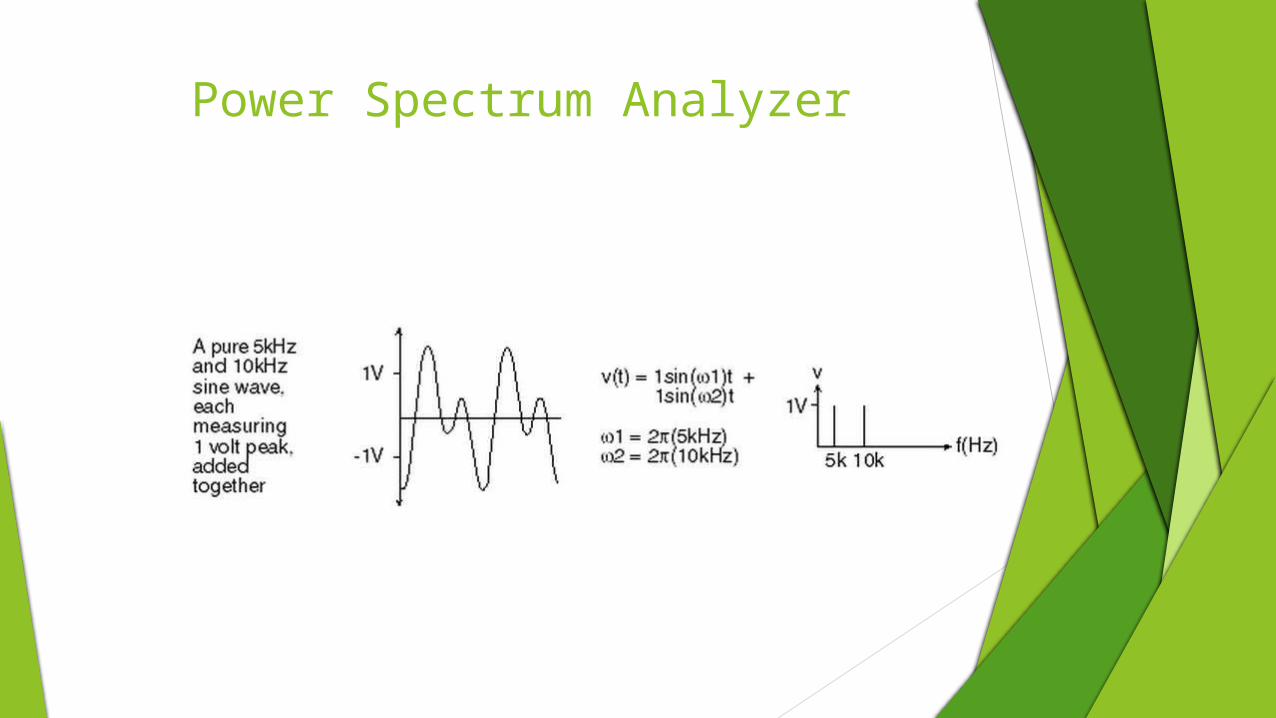
Spectrum Analysis is a technique used to break down complex signals in to simpler parts.
Spectrum Analysis is the process of plotting graphs of different quantities (which in this case is power) versus frequency.

Power Spectrum Analyzer
This instrument applies a Fast Fourier Transform (FFT) to the input signal in order to break it down into more simpler parts.
- FFT is an algorithm used to compute the DFT (Discrete Fourier Transform) of an input function at a faster rate than directly computing the DFT.
Once the FFT is applied, we are now able to see the various frequencies that are present in our signal.

Power Spectrum Analyzer
Power Spectrum Analyzer

Power Spectrum Analyzer

Power Spectrum Analyzer

Power Spectrum Analyzer
By obtaining the power spectrum, we are able to observe the various noise frequencies present in our signal e.g.
- In case of a DC voltage, if we see a spike at any frequency x apart from at f = 0, we can almost immediately know of any noise feeding into our system.

Power Spectrum Analysis
Once obtained, the Power Spectrum of a signal provides us with all the knowledge of the input signal, and is perhaps more informative than the input signal being displayed itself.
We are able to know of the various sinusoids comprising the input signal.
The power spectrum also provides us with enough knowledge to reconstruct the input signal.

AUDIO EQUALIZER
How Fourier transform is used in equalizers?
Fourier transforms (FT) take a signal and express it in terms of the frequencies of the waves that make up that signal.
Sound is probably the easiest thing to think about when talking about Fourier transforms.
In the form of an FT it’s easy to filter sound. When you adjust the equalizer on your sound system, what
you’re really doing is telling the device to multiply the different frequencies by different amounts before sending the signal to the speakers.
For example, when the base is turned up, the lower frequencies get multiplied by a bigger value than the higher frequencies.

Sound data converted from time domain to frequency domain.

Types of Filters Used
There are different kinds of filters used in Audio Equalizers that change the type of sound we hear. They have different uses and they all need the waves in frequency domain which is achieved by Fourier Transform.
1. Peak Filter: Peak filter has a typical bell type curve around the central frequency, which is affected by a specified gain. These filters are the most commonly used.
2. Low/high shelf filter: Low/high shelf filter affects all frequencies below/above the threshold limit defined by the frequency parameter and the Q. These are mostly used on bass or treble.
3. Low/high pass filter: Low/high pass filter lets you remove all frequencies above/below the limit.
4. Band-pass and notch filters: Band-pass and notch filters are similar to low/high pass filters as they either remove all frequencies in a specific range around the central frequency (notch) or outside it (band-pass).

Filters
• Filtering is the process of removing certain portions of the input signal in order to create a new signal
• A familiar example would be the bass and treble controls on a CD player or electric guitar. (Typically used for noise removal and data smoothing)

Types of Filter

Low Pass
• The capacitor exhibits reactance, and blocks low-frequency signals, forcing them through the load instead
• At higher frequencies the reactance drops, and the capacitor effectively functions as a short circuit

High Pass
• At higher frequencies, the capacitor effectively works as a short circuit, allowing the current through to the resistor
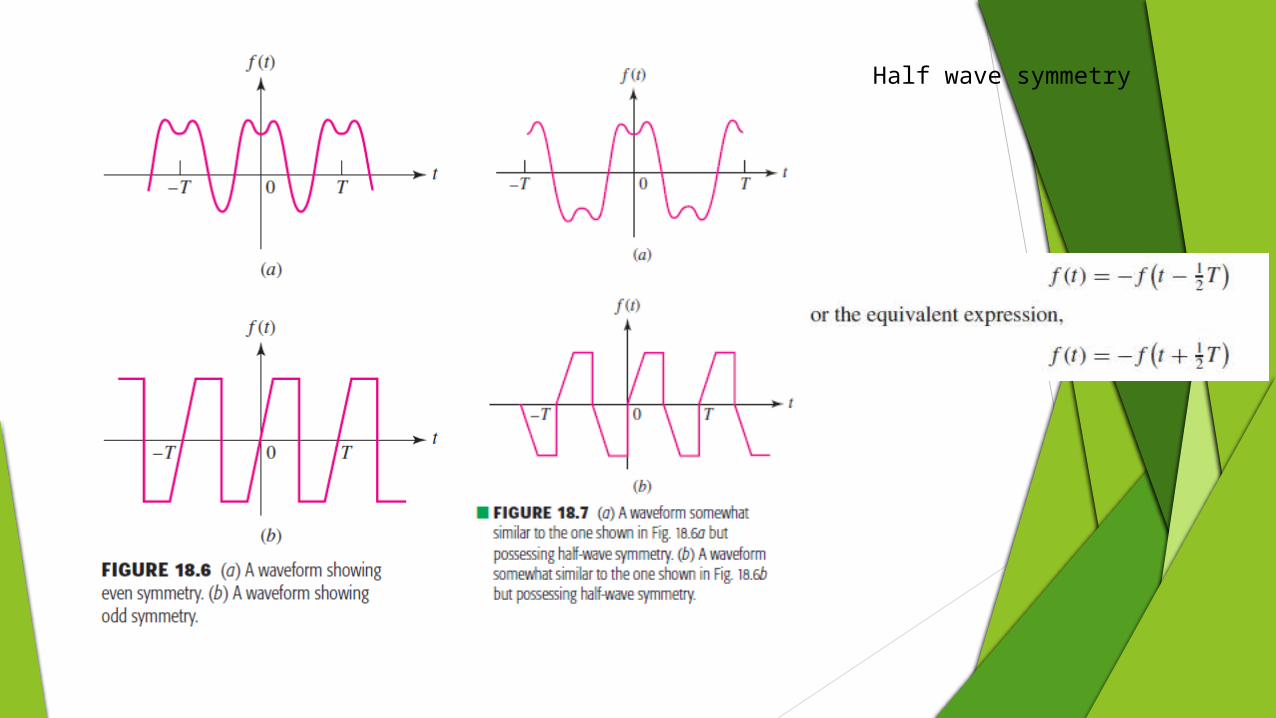
Half wave symmetry

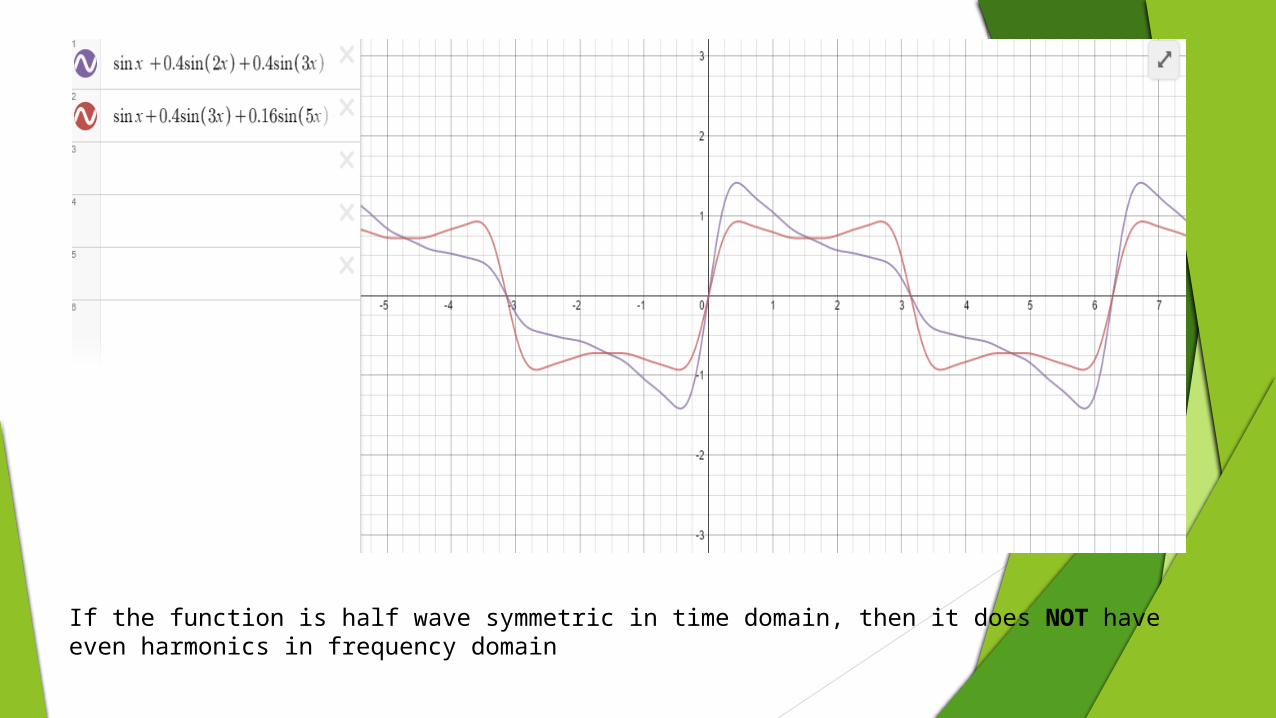
If the function is half wave symmetric in time domain, then it does NOT have even harmonics in frequency domain
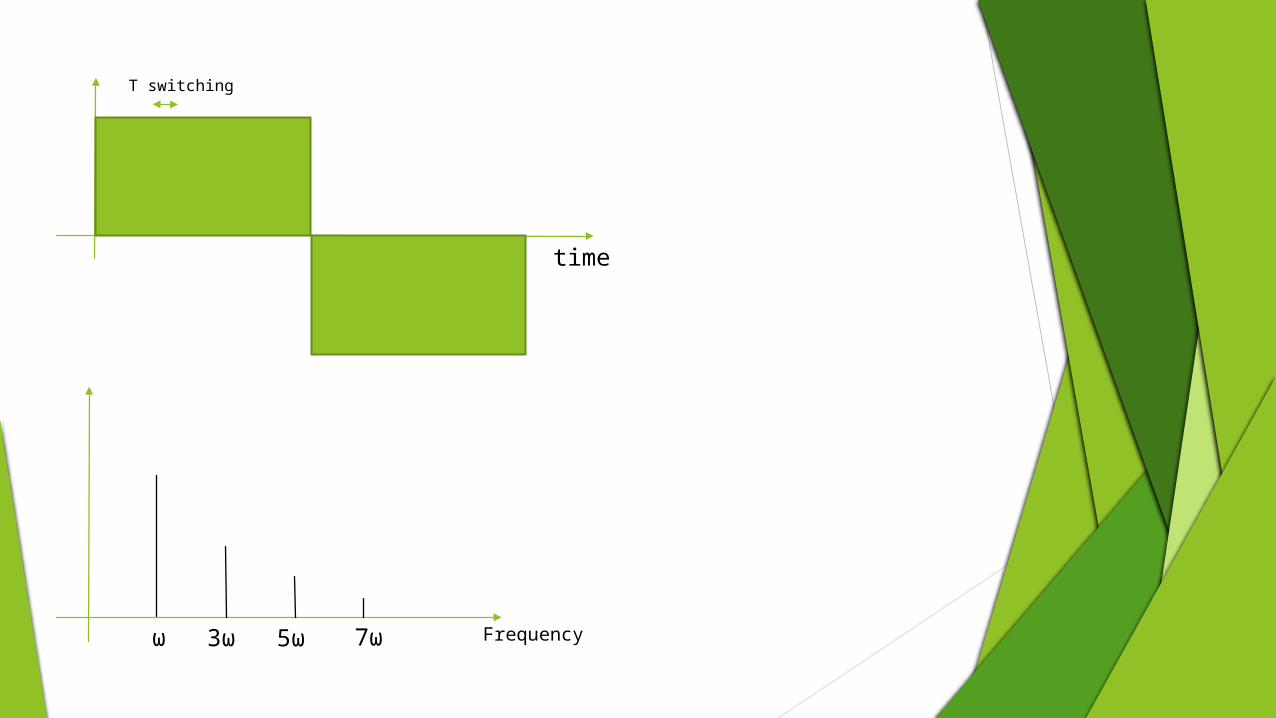
time
T switching
Frequencyω 3ω 7ω5ω
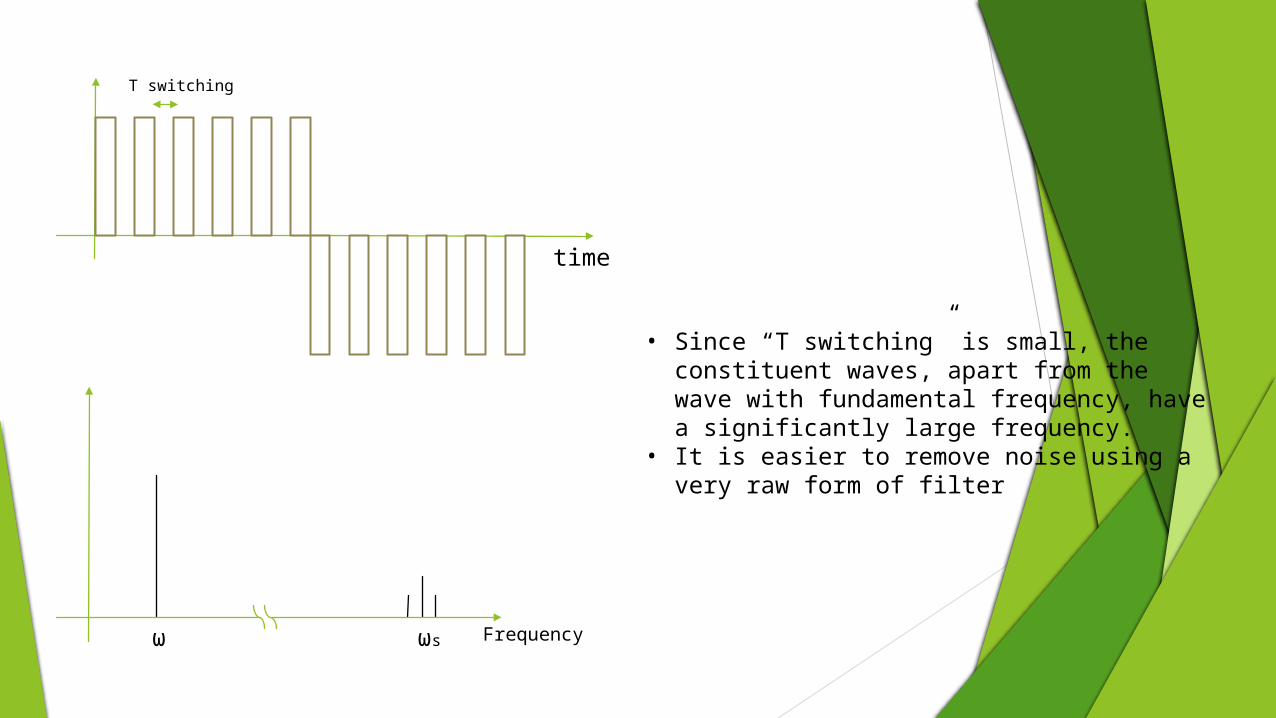
Frequencyω ωs
time
T switching
• Since “T switching” is small, the constituent waves, apart from the wave with fundamental frequency, have a significantly large frequency.
• It is easier to remove noise using a very raw form of filter

Electrocardiography (ECG)

Principles of ECG
Electrocardiography (ECG) is the recording of the electrical activity of the heart. The recording produced by this non-invasive procedure is termed an electrocardiogram.
With the help of electrodes connected to various parts of the body, it picks up electrical impulses generated by the polarization and depolarization of cardiac tissue and translates it into a waveform. The waveform is then used to measure the rate and regularity of heartbeats.

Sample ECG readout
In more detail, the features of the repeated pulse shown above are as follows:•The P wave is caused by contraction of the right atrium followed by the left atrium (the chambers at the top of the heart).•The QRS complex represent the point in time when most of the heart muscles are in action; so it has the highest amplitude.•The T wave represents the polarization of the ventricles (the chambers at the bottom of the heart).

Modeling the Heartbeat Using Fourier Series
A heartbeat is roughly regular. So, in mathematical terms, we can say that it is periodic. Such waves can be represented using a Fourier Series.
To keep things simple we will only model the R wave and shall assume the period to be equal to 1. P, Q, S and T waves can be obtained in a similar manner and added to the model.
The R wave is about 2.5 mV high and lasts for a total of 40 ms.
The following polynomial models the R wave:
f(t) = -0.0000156(t − 20)⁴ + 2.5
f(t) = f(t + 1000)

Graph of the Model
This is the graph of part of one period (the part above the t-axis from t = 0 to t = 40):
However, this is just a single pulse.
In order to produce a graph that repeats this pulse over regular intervals we use Fourier Series.

To obtain the Fourier Series, we need to find the mean value, a0, and 2 coefficient expressions involving n, an and bn which are multiplied by trigonometric terms and summed for n = 1 to infinity.

Mean Value Term a0 is obtained by
integration as follows (L is half of the period)
Coefficient Terms, an and bn
Next, we compute an and bn


Finally, we put it all together and obtain the Fourier Series for our simple model of a heart beat:

When we graph this for just the first 5 terms (n = 1 to 5), we can see the beginnings of a regular 1-second heart beat.
The above graph shows the "noise" you get in a Fourier Series expansion, especially if you haven’t taken enough terms.

Taking more terms gives us the following, and we see we get a reasonable approximation for a regular R wave with period 1 second.
So, in summary, we took a single spike that represented one R wave of a heartbeat. Then, using Fourier Series, we found a formula that repeats that spike at regular intervals of time.

THANK YOU!