applications of opls statistical method in medicine · applications of opls statistical method in...
TRANSCRIPT

411
Journal of mathematics and computer science 8 (2014), 411-422
Applications of OPLS Statistical Method in Medicine
Kianoush Fathi Vajargah*1, Robabe Mehdizadeh2, Homayoun Sadeghi-Bazargani3
1,2Department of Statistics, Islamic Azad University, North branch, Tehran, Iran
3Department of Statistics and Epidemiology, Tabriz University of Medical Sciences, Tabriz, Iran
[email protected] , [email protected], [email protected]
Abstract
Studies related to prognosis in medicine result in a large volume of variables if clinical and laboratory variables are
simultaneously accompanied with new imaging techniques; this issue causes problems for classical statistical methods such as
logistic and linear regression. Among these cases, emergence of multicollinearity or close linear correlation between regression
variables when the number of regression variables is high can be pointed out. Emergence of multicollinearity is inappropriate for
ordinary least squares of regression model. PLS is a well-known method for connecting two X and Y data matrices using a
multicollinearity model. OPLS is the product of a change which has occurred on PLS method in recent years. Considering
application problems of linear regression method, applying an alternative method is a requirement. Using OPLS method can
reduce model complexity and develop its power.
Key words: Medical studies, linear regression, PLS , OPLS
1. Introduction
In studies related to medicine, biology, chemistry, social and behavioral sciences and other sciences,
researchers collect data related to several variables. Data related to these variables are called "multivariate
data" and multivariate statistical methods are applied for their analysis. In most situations, there are a
large number of variables (sometimes more than the number of observations). In such a situation, using
multivariate linear regression method is faced with problems due to emergence of multicollinearity
(correlation between the variables) because least squares method offers poor estimation of each individual
parameter of the model, which may seriously limit application and usage of regression model in inference
and prediction. Various methods have been proposed for dealing with the problem of multicollinearity,
each of which has specific limitations. So, principal component analysis method was first proposed in

K.F. Vajargah, R. Mehdizadeh, H. Sadeghi-Bazargani / J. Math. Computer Sci. ( ), -
412
order to solve this problem. Although this method solves multicollinearity problem, the problem of
optimal sub-category selection from among the predictors is still left. Principal component regression
analyzes X in order to obtain components which can explain X in the best way. In contrast, PLS (partial
least squares) regression finds components of X which can predict Y in the best way. OPLS (projection to
latent structures) is the improved PLS method, which removes X changes (predictor) that have no
correlation with Y (response variable). In mathematical terms, it eliminates systematic changes in X
matrix which are perpendicular to Y. Therefore, considering the above-mentioned items, it is required for
clinicians to have basic familiarity with novel methods of statistical analysis such as PLS and OPLS. In
this article, the possibility of using OPLS and PLS models was discussed by considering appropriate
practical examples.
2. Multicollinearity
Regression models are used in a wide field of application. A serious problem in applying regression
model is multicollinearity or close linear correlation between regression variables in case there are many
regression variables. Multicollinearity closely depends on regression variables. Close dependence causes
difficulty in estimating capability of regression coefficients. Emergence of multicollinearity is
inappropriate for ordinary least squares regression analysis. In this situation, variance of estimator of least
squares may be highly large and prediction will be inaccurate. On the other hand, the number of
observations may be less than that of regression variables; in this situation, there is no invertible matrix
and thus no unbiased estimator of unique least squares for the matrix coefficient (1).
Effects of multicollinearity: Although lack of collinearity is not among primary assumptions of regression
and does not completely invalidate regression analysis, since it leads to an error in model determination, it
can cause difficulties in calculation, interpretation and prediction. Multicollinearity also results in
estimating least squares QUOTE 𝛽 𝑗 which are very large in terms of absolute value. Generally, when
there is severe multicollinearity, least squares method offers poor estimation of each individual parameter
of the model, which may seriously limit application of regression model for inference and prediction (1).
Methods for Confronting Collinearity Problem:
Re-definition of the model in terms of a set which is smaller than regression variables, conducting
preliminary studies which use only subcategories of basic variables, relating Y response to main
components of prediction variables which decide on the regression variables that should be eliminated
from the model, collecting additional data which is not always possible unfortunately due to economic
bounds or lack of access to studied sampling process, ridged regression and so forth are some examples of
methods for confronting collinearity problem. In the first two methods, relationships between regression
variables are ignored and can lead to unacceptable results (1).
K.F. Vajargah, R. Mehdizadeh, H. Sadeghi-Bazargani / J. Math. Computer Sci. ( ), -
413
3. Three Alternative Methods for Managing Multiplicity of Variables
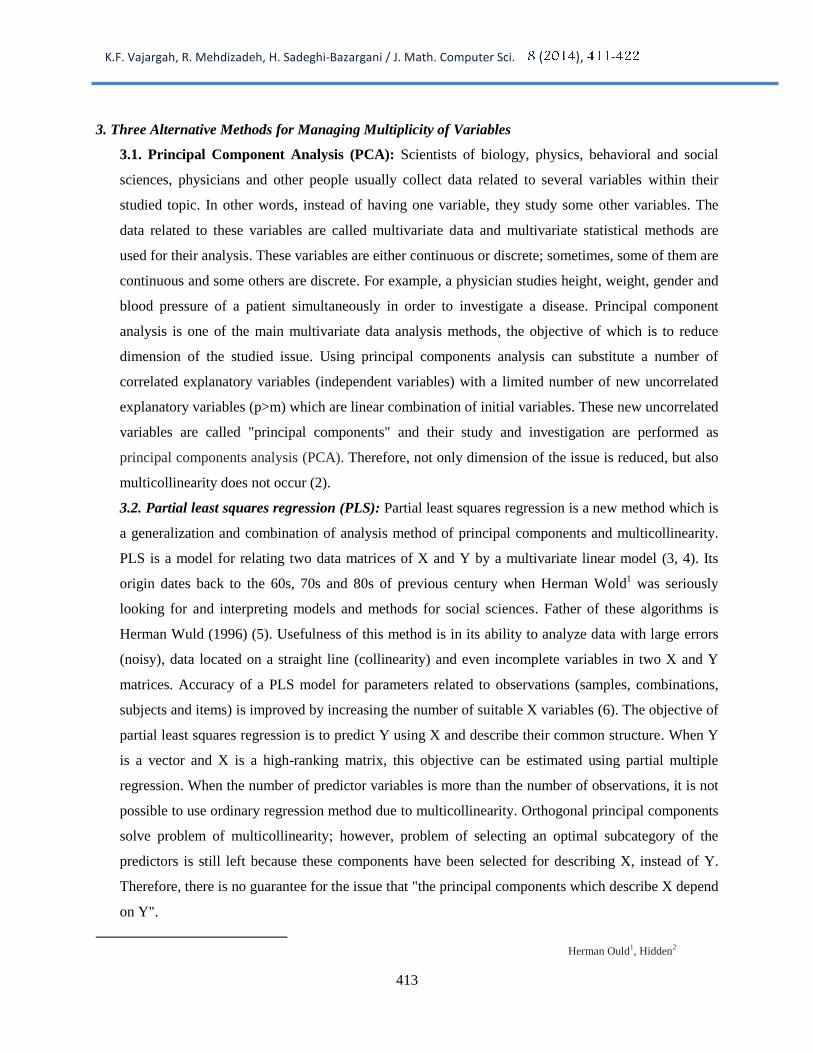
3.1. Principal Component Analysis (PCA): Scientists of biology, physics, behavioral and social
sciences, physicians and other people usually collect data related to several variables within their
studied topic. In other words, instead of having one variable, they study some other variables. The
data related to these variables are called multivariate data and multivariate statistical methods are
used for their analysis. These variables are either continuous or discrete; sometimes, some of them are
continuous and some others are discrete. For example, a physician studies height, weight, gender and
blood pressure of a patient simultaneously in order to investigate a disease. Principal component
analysis is one of the main multivariate data analysis methods, the objective of which is to reduce
dimension of the studied issue. Using principal components analysis can substitute a number of
correlated explanatory variables (independent variables) with a limited number of new uncorrelated
explanatory variables (p>m) which are linear combination of initial variables. These new uncorrelated
variables are called "principal components" and their study and investigation are performed as
principal components analysis (PCA). Therefore, not only dimension of the issue is reduced, but also
multicollinearity does not occur (2).
3.2. Partial least squares regression (PLS): Partial least squares regression is a new method which is
a generalization and combination of analysis method of principal components and multicollinearity.
PLS is a model for relating two data matrices of X and Y by a multivariate linear model (3, 4). Its
origin dates back to the 60s, 70s and 80s of previous century when Herman Wold1 was seriously
looking for and interpreting models and methods for social sciences. Father of these algorithms is
Herman Wuld (1996) (5). Usefulness of this method is in its ability to analyze data with large errors
(noisy), data located on a straight line (collinearity) and even incomplete variables in two X and Y
matrices. Accuracy of a PLS model for parameters related to observations (samples, combinations,
subjects and items) is improved by increasing the number of suitable X variables (6). The objective of
partial least squares regression is to predict Y using X and describe their common structure. When Y
is a vector and X is a high-ranking matrix, this objective can be estimated using partial multiple
regression. When the number of predictor variables is more than the number of observations, it is not
possible to use ordinary regression method due to multicollinearity. Orthogonal principal components
solve problem of multicollinearity; however, problem of selecting an optimal subcategory of the
predictors is still left because these components have been selected for describing X, instead of Y.
Therefore, there is no guarantee for the issue that "the principal components which describe X depend
on Y".
Herman Ould
1, Hidden
2
K.F. Vajargah, R. Mehdizadeh, H. Sadeghi-Bazargani / J. Math. Computer Sci. ( ), -
414
PLS regression finds some components of X which predict Y in the best way (some components of X
which are related to Y). In particular, partial least squares regression seeks a set of principal
components (called latent2 vectors) which simultaneously analyzes X and Y with the constraint that
these components explain the variance between X and Y as much as possible. This stage generalizes
analysis of principal components. During one regression stage, X analysis is followed for Y
prediction (7).
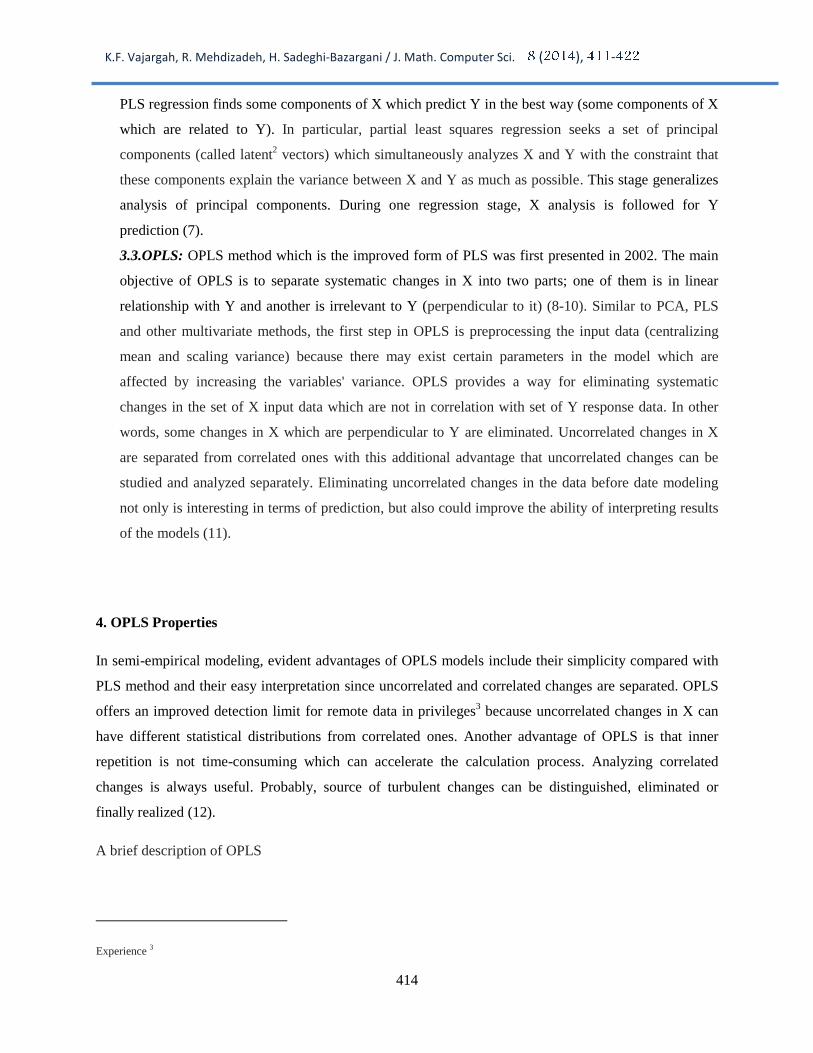
3.3.OPLS: OPLS method which is the improved form of PLS was first presented in 2002. The main
objective of OPLS is to separate systematic changes in X into two parts; one of them is in linear
relationship with Y and another is irrelevant to Y (perpendicular to it) (8-10). Similar to PCA, PLS
and other multivariate methods, the first step in OPLS is preprocessing the input data (centralizing
mean and scaling variance) because there may exist certain parameters in the model which are
affected by increasing the variables' variance. OPLS provides a way for eliminating systematic
changes in the set of X input data which are not in correlation with set of Y response data. In other
words, some changes in X which are perpendicular to Y are eliminated. Uncorrelated changes in X
are separated from correlated ones with this additional advantage that uncorrelated changes can be
studied and analyzed separately. Eliminating uncorrelated changes in the data before date modeling
not only is interesting in terms of prediction, but also could improve the ability of interpreting results
of the models (11).
4. OPLS Properties
In semi-empirical modeling, evident advantages of OPLS models include their simplicity compared with
PLS method and their easy interpretation since uncorrelated and correlated changes are separated. OPLS
offers an improved detection limit for remote data in privileges3 because uncorrelated changes in X can
have different statistical distributions from correlated ones. Another advantage of OPLS is that inner
repetition is not time-consuming which can accelerate the calculation process. Analyzing correlated
changes is always useful. Probably, source of turbulent changes can be distinguished, eliminated or
finally realized (12).
A brief description of OPLS
Experience 3

K.F. Vajargah, R. Mehdizadeh, H. Sadeghi-Bazargani / J. Math. Computer Sci. ( ), -
415
Below, two examples of studies in medical field which have used these methods are mentioned. Both
studies have utilized SIMCA (ver. 12) software, which is special software for modeling techniques of
supervised models. OPLS is a tool in SIMCA software so that it is accessible based on standards of PLS
and PCA models:
5. The First Sample:
This study was done to compare new statistical methods of OPLS-DA and PLS regression in management
of multiple variables in a case-control study on burns. The data used in this study for implementing and
comparing statistical models were drawn from a continuous case-control study for determining the
damage induced by unintentional burns. The studied samples were the ones which referred to Burn Centre
of Northwest of Iran. The control group included below 14 year old children, who referred to Tabriz
Children Hospital. Before the modeling process, the data were divided into two parts. The set of training
data consisted of 316 observations and set of predictor data included 80 observations. OPLS-DA which
Problem description
More PLS components
Any orthogonal changes in X
The original data
set
Easy Interpretation
Fewer components
More communication
Set of OPLS training
data
Set of orthogonal
Data
To evaluate orthogonal changes in principal components
To determine source of orthogonal changes

K.F. Vajargah, R. Mehdizadeh, H. Sadeghi-Bazargani / J. Math. Computer Sci. ( ), -
416
was conducted in this study on the data was discussed a bit later than OPLS, namely in 2006, and all the
recognized advantages of OPLS modeling were kept in field of audit analysis (13).
Both PLS-Da and OPLS-DA models were fitted on a set of training data consisting of 2 ± 247 and 316
observations in both groups. The least possible number of components was 3 components in PLS-DA.
But only one predictor component in OPLS-Da model was obtained by extracting two orthogonal
components in X. Gaining a predictor component in OPLS as the only component relating to Y made
model interpretation easier than PLS model. OPLS-DA was approved owing to its better interpretation as
a model superior to PLS-DA. Authors of this study encouraged epidemiologists who study injuries and
damage and also statisticians who apply and evaluate these methods in analyzing the data related to
damage in order to increase its studying ability and statistical validity. Other epidemiological studies can
take advantage of this method using a higher number of dependent variables (14).
6. The Second Sample:
This study was a prospective study and its general objective was to determine role of Transcranial
Doppler in prognosis of ischemic strokes. The studied sample was a set of data obtained from 116
patients with diagnosis of ischemic stroke who were hospitalized in Neurology Unit, Razi Hospital.
During the first week, TCD (Transcranial Doppler) hospitalization was done (for the patients diagnosed
with stroke embolic, TCD was done in the first 48 h; in case the first 48 h was passed, they were mostly
removed from the study based on re-establishing of blood flow (Ray Canalization) and, for other cases,
the first week was acceptable.) Then, UNSS (Unified Neurological Stroke Scale) questionnaires were
completed by another person who was unaware of TCD result. Finally, the same person re-completed the
forms at the end of 6 months. UNSS form is a simple form for evaluating clinical status of neurological
patients and the objective of its design is to facilitate estimating the patients' disability; it can measure
awareness, speech, eye movement, walking, muscle strength and power of organs. Transcranial Doppler
is a method for evaluating cervical carotid arteries and intracranial vessels which studies hemodynamic
situation of vessels (blood flow velocity and its direction) (15-17).
Four groups of variables were analyzed in this study: the first group: demographic variables and medical
records; the second group: laboratory variables; the third group: variables of Transcranial Doppler
Sonography (TCD); the forth group: variables of UNSS scale. The obtained UNSS scale was considered a
response variable which was predicted by other variables. R2 and Q2 parameters were calculated for each
of the methods and the following results were obtained: considering R2 and Q
2 values for PLS model, one
component was obtained. One predicted and two orthogonal components were also obtained for OPLS

K.F. Vajargah, R. Mehdizadeh, H. Sadeghi-Bazargani / J. Math. Computer Sci. ( ), -
417
model. Values of R2Y and Q
2 for PLS model were calculated as 0.53 and 0.14, respectively. R
2Y and Q
2
for OPLS model were calculated as 0.73 and 0.37, respectively (Figures 1 and 2).
Figure 1: Calculated values of R2 and Q2 for the PLS method
Figure 2: Calculated values of R2 and Q
2 for the OPLS method
0.0
0.1
0.2
0.3
0.4
0.5
0.6
0.7
0.8
0.9
Com
p[1
]P
Comp No.
ord90.M3 (OPLS/O2PLS) R2Y(cum)
Q2(cum)
SIMCA-P+ 12 - 2011-05-17 14:54:25 (UTC+3.5)

K.F. Vajargah, R. Mehdizadeh, H. Sadeghi-Bazargani / J. Math. Computer Sci. ( ), -
418
By comparing the calculated indices for two models, it was found that OPLS model was superior to PLS
model in terms of goodness of fit and ability to predict the model. In this study, based on very high
number of variables resulting from Transcranial Doppler Sonography (TCD) in patients with stroke
compared to the limited number of studied observations, inclusion of other demographic and laboratory
variables in the study and close correlation between TCD variables, OPLS application was suggested as
an alternative method for linear regression and both PLS and OPLS were conducted on the data. In the
results obtained by both methods of PLS and OPLS, one component and one predictor and two
orthogonal components were obtained, respectively. An important property of OPLS is simpler
interpretation of results than PLS since OPLS results in only one predictor component and other
components are orthogonal. Although PLS only offered one component in this study, in other references,
several components have been obtained for PLS method; the more the number of components, the more
complicated the result interpretation would be. This study presented similar results for both methods in
terms of determining significant variables in other cases; but, OPLS method showed a significantly less
number of variables because of removing the variables which had no role in prediction and considering
them as orthogonal components (18).
7. Discussion and Results:
Although using likelihood estimation and logistic regression methods has some advantages compared to
linear regression analysis method, they have some limitations like other regression methods, which
include independence of X variables, accuracy of X variables and randomization of error distribution.
Power and missing data are among other concerns for classical regression model (11). Limitations of
these methods require using alternative methods with supplement while being applied in studies which
consist of a large number of correlated variables.
The first problem which stems from the large number of variables while using classical regression
analysis method (especially, logistic regression) is power requirement. In case the number of variables is
more than that of observations, it will be more complicated. Although methods of estimation (maximum
conditional and unconditional likelihood) are useful for logistic regression, the correlation between
predictor variables which increases by the increase in the number of variables is a problem which should
be properly dealt with.
Multiple correlation is also an issue which arises from facing dependant variable (19). Multiple
correlation inflates variances of parameters estimation. Generally, when there is severe multicollinearity,
method of least squares presents weak estimation of each individual parameters of the model, which may
severely limit application and usage of regression model for inference and prediction (1). In order to
K.F. Vajargah, R. Mehdizadeh, H. Sadeghi-Bazargani / J. Math. Computer Sci. ( ), -
419
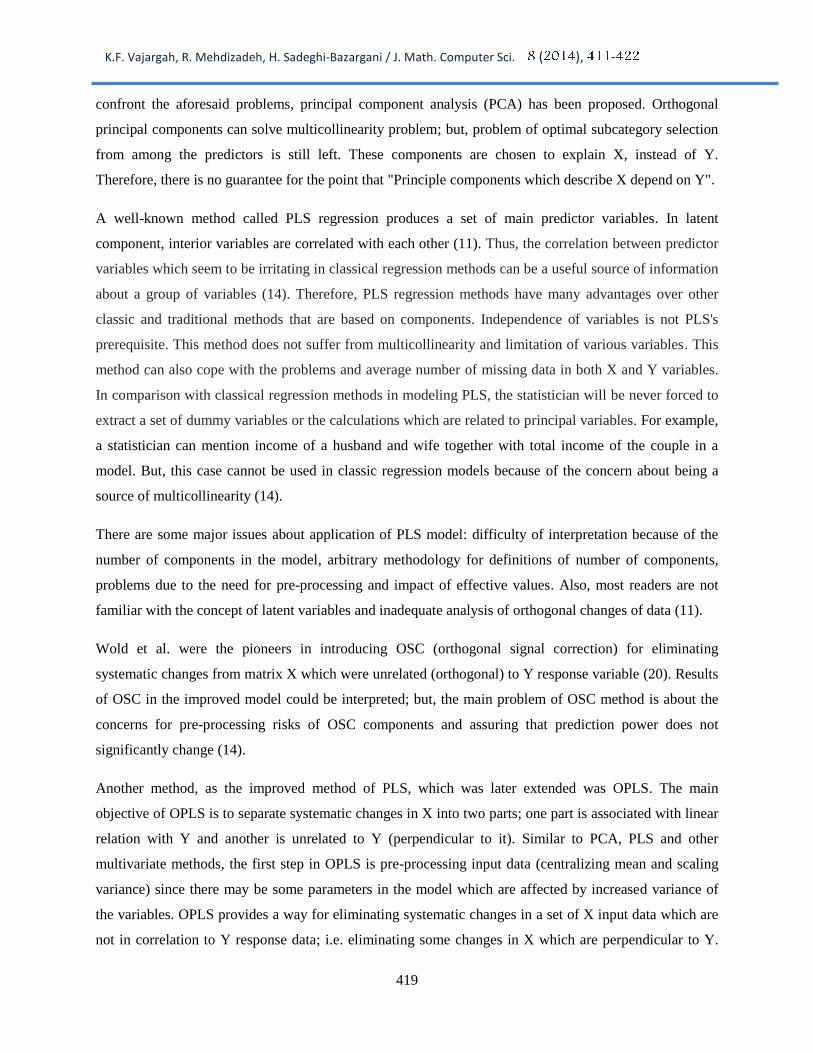
confront the aforesaid problems, principal component analysis (PCA) has been proposed. Orthogonal
principal components can solve multicollinearity problem; but, problem of optimal subcategory selection
from among the predictors is still left. These components are chosen to explain X, instead of Y.
Therefore, there is no guarantee for the point that "Principle components which describe X depend on Y".
A well-known method called PLS regression produces a set of main predictor variables. In latent
component, interior variables are correlated with each other (11). Thus, the correlation between predictor
variables which seem to be irritating in classical regression methods can be a useful source of information
about a group of variables (14). Therefore, PLS regression methods have many advantages over other
classic and traditional methods that are based on components. Independence of variables is not PLS's
prerequisite. This method does not suffer from multicollinearity and limitation of various variables. This
method can also cope with the problems and average number of missing data in both X and Y variables.
In comparison with classical regression methods in modeling PLS, the statistician will be never forced to
extract a set of dummy variables or the calculations which are related to principal variables. For example,
a statistician can mention income of a husband and wife together with total income of the couple in a
model. But, this case cannot be used in classic regression models because of the concern about being a
source of multicollinearity (14).
There are some major issues about application of PLS model: difficulty of interpretation because of the
number of components in the model, arbitrary methodology for definitions of number of components,
problems due to the need for pre-processing and impact of effective values. Also, most readers are not
familiar with the concept of latent variables and inadequate analysis of orthogonal changes of data (11).
Wold et al. were the pioneers in introducing OSC (orthogonal signal correction) for eliminating
systematic changes from matrix X which were unrelated (orthogonal) to Y response variable (20). Results
of OSC in the improved model could be interpreted; but, the main problem of OSC method is about the
concerns for pre-processing risks of OSC components and assuring that prediction power does not
significantly change (14).
Another method, as the improved method of PLS, which was later extended was OPLS. The main
objective of OPLS is to separate systematic changes in X into two parts; one part is associated with linear
relation with Y and another is unrelated to Y (perpendicular to it). Similar to PCA, PLS and other
multivariate methods, the first step in OPLS is pre-processing input data (centralizing mean and scaling
variance) since there may be some parameters in the model which are affected by increased variance of
the variables. OPLS provides a way for eliminating systematic changes in a set of X input data which are
not in correlation to Y response data; i.e. eliminating some changes in X which are perpendicular to Y.

K.F. Vajargah, R. Mehdizadeh, H. Sadeghi-Bazargani / J. Math. Computer Sci. ( ), -
420
The uncorrelated changes in X are separated from the correlated ones assuming that these changes can be
studied and analyzed separately. Removing uncorrelated changes of data before date modeling not only is
interesting in terms of prediction but also could improve the interpretation ability of model results (11).
At semi-empirical modeling level, obvious advantages of OPLS models are their simplicity compared
with PLS and easy interpretation because uncorrelated and correlated changes are separated. OPLS gives
an improved detection limit for remote data in privileges since uncorrelated changes in X can have
different statistical distribution from the correlated ones. Another advantage of OPLS is that its presented
inner repetition4 is not time-consuming, which could accelerate calculation process (18).
The present authors recommend epidemiology experts as well as statisticians to apply and study this
model's application in various fields of medicine in order to broaden statistical power and validity of
studies. Other epidemiologic studies which deal with a large number of correlated variables can also take
advantage of this method. Since this subject is new and there are a limited number of studies in this
regard, implementing more studies in various fields is proposed for future works.
Referenceses:
[1]Montgomery DC, Peck EA. Translated by: Razavi Parisei SA. Statistics: Introduction to Linear
Regression Analysis. 1st ed. Shahid Bahonar University of Kerman Publications, 1953; PP: 471-485,
501-503 (Persian)
[2]Johnson RA, Wichern DW. Translated by: Niroomand HA. Statistics: Applied Multivariate
Statistical Analysis. 2nd ed. Mashhad Ferdowsi University Press, 1942; PP: 431-432 (Persian)
[3]McIntosh A R, Lobaugh NJ. Partial least squares analysis of neuroimaging data: applications and
advances. NeuroImage 2004; 23: S250–S263.
[4]Sadeghi Bazargani H. Epidemiology and Statistical Modeling in Burn Injuries. Thesis submitted
for epidemiology PhD degree, Karolinska Institutet, Sweden. 2010.
[5]Majidi Parsa T. Partial least squares regression and its applications. Thesis submitted for Statistics
Msc degree, Islamic Azad University Tehran North Branch, 2008.
[6]Charles H, Disya R. Ultrasound and cerebral vascular disease. In: Toole JF, editor.
Cerebrovascular disease, 5th ed. Philadelphia, Lippincott Williams & Wilkins, 1998; PP: 83-128.
[7]Abdi H. Partial least squares regression and projection on latent structure regression (PLS
Regression), Wiley & Sons, Inc. WIREs Comp Stat. 2010,
[8]Gabrielsson J, Jonsson H, Airiau C, Schmidt B, Escott R, Trygg J. The OPLS methodology for
analysis of multi-block batch process data. J Chemometrics 2006; 20: 362-369.
Internal repeat
4

K.F. Vajargah, R. Mehdizadeh, H. Sadeghi-Bazargani / J. Math. Computer Sci. ( ), -
421
[9]Gabrielssona J, Jonsson H, Airiaub C, Schmidtb B, Escottb R, Trygg J. OPLS methodology for
analysis of pre-processing effects on spectroscopic data. Chemometrics and Intelligent Laboratory
Systems 2006; 84: 153-158.
[10]Jalali-Heravi M, Ebrahimi-Najafabadi H, Khodabandehloo A. Use of Kernel Orthogonal
Projection to Latent Structure in Modeling of Retention Indices of Pesticides. QSAR Comb Sci 2009;
28,: 1432-1441.
[11]Eriksson L, Johansson E, Wold N, Trygg J, Wikstrom C, Wold S. Multi- and Megavariate data
analysis: Advanced applications and method extensions. 1st ed. Umea, Umetrics AB, 2006; PP:
[12]Trygg J, Wold S. Orthogonal projections to latent structures (O-PLS). J Chemometrics 2002; 16:
119-128.
[13]Bylesjo M, Rantalainen M, Cloarec O, Nicholson JK, Holmes E, Trygg J. OPLS discriminant
analysis: Combining the strengths of PLSDA and SIMCA classification. J Chemometr 2006; 20(8-
10): 341-351.
[14]Sadeghi-Bazargani H, Bangdiwala SI, Mohammad K, Maghsoudi H, Mohammadi R. Compared
application of the new OPLS-DA statistical model versus partial least squares regression to manage
large numbers of variables in an injury case-control study. Scientific Research and Essays 2011;
6(20): 4369-4377.
[15]Charles H, Disya R. Ultrasound and cerebral vascular disease. In: Toole JF, editor.
Cerebrovascular disease. 5th ed. Philadelphia, Lippincott Williams & Wilkins, 1998; PP: 83-128.
[16]Rajamany K, Gorman M. Transcranial doppler in stroke. Biomed Pharamacother 2001; 55: 247-
57.
[17]Wechsler LR. Cerebrovascular diseases. In: Babikian VL, Wechsler LR, editors. Transcranial
doppler ultrasonography. 2nd ed. USA, Butterworth-Heinemann, 1999; PP: 91-108.
[18]Mehdizadeh Esfanjani R. Comparison of PLS and OPLS methods in controlling the variety of
variables. Example: A Sample in TCD. Thesis submitted for Statistics Msc degree, Islamic Azad
University Tehran North Branch, 2011.
[19]Dohoo IR, Ducrot C, Fourichon C, Donald A, Hurnik D. An overview of techniques for dealing
with large numbers of independent variables in epidemiologic studies. Prev Vet Med 1997; 29(3):
221-239.
[20]Wold S, Antti H, Lindgren F, Ohman J. Orthogonal signal correction of near-infrared spectra.
Chemometrics Intell Lab Syst 1998; 44: 175-185.
[21] M. Bagheri, M. Valipour, V. Amin, The Bankruptcy Prediction in Tehran share holding using
Neural Network and it's Comparison with Logistic Regression,5(3),pp-219- 228.(2012).
[22] A. Arjmandzadeh, S. Effati, Interval Support Vector Machine in Regression Analysis, 2(3), pp
565- 571 (2011).

K.F. Vajargah, R. Mehdizadeh, H. Sadeghi-Bazargani / J. Math. Computer Sci. ( ), -
422
[23] A.H. Hadjahmadi, T. J. Askari, A Decision Support System for Parkinson's Disease Diagnosis
using Classification and Regression Tree, 4(2) pp-257 – 263,(2012).