applications of unmanned aerial systems (uass) in
TRANSCRIPT

remote sensing
Review
Applications of Unmanned Aerial Systems (UASs) inHydrology: A Review
Mercedes Vélez-Nicolás 1,* , Santiago García-López 1 , Luis Barbero 1 , Verónica Ruiz-Ortiz 2
and Ángel Sánchez-Bellón 1
�����������������
Citation: Vélez-Nicolás, M.;
García-López, S.; Barbero, L.;
Ruiz-Ortiz, V.; Sánchez-Bellón, Á.
Applications of Unmanned Aerial
Systems (UASs) in Hydrology: A
Review. Remote Sens. 2021, 13, 1359.
https://doi.org/10.3390/rs13071359
Academic Editor: Giacomo De Carolis
Received: 25 February 2021
Accepted: 31 March 2021
Published: 1 April 2021
Publisher’s Note: MDPI stays neutral
with regard to jurisdictional claims in
published maps and institutional affil-
iations.
Copyright: © 2021 by the authors.
Licensee MDPI, Basel, Switzerland.
This article is an open access article
distributed under the terms and
conditions of the Creative Commons
Attribution (CC BY) license (https://
creativecommons.org/licenses/by/
4.0/).
1 Department of Earth Sciences, Faculty of Marine and Environmental Sciences, University of Cádiz,11510 Puerto Real, Spain; [email protected] (S.G.-L.); [email protected] (L.B.);[email protected] (Á.S.-B.)
2 Department of Industrial and Civil Engineering, Higher Polytechnic School of Algeciras, University of Cádiz,11202 Algeciras, Spain; [email protected]
* Correspondence: [email protected]
Abstract: In less than two decades, UASs (unmanned aerial systems) have revolutionized the field ofhydrology, bridging the gap between traditional satellite observations and ground-based measure-ments and allowing the limitations of manned aircraft to be overcome. With unparalleled spatialand temporal resolutions and product-tailoring possibilities, UAS are contributing to the acquisitionof large volumes of data on water bodies, submerged parameters and their interactions in differenthydrological contexts and in inaccessible or hazardous locations. This paper provides a comprehen-sive review of 122 works on the applications of UASs in surface water and groundwater researchwith a purpose-oriented approach. Concretely, the review addresses: (i) the current applications ofUAS in surface and groundwater studies, (ii) the type of platforms and sensors mainly used in thesetasks, (iii) types of products generated from UAS-borne data, (iv) the associated advantages andlimitations, and (v) knowledge gaps and future prospects of UASs application in hydrology. The firstaim of this review is to serve as a reference or introductory document for all researchers and watermanagers who are interested in embracing this novel technology. The second aim is to unify in asingle document all the possibilities, potential approaches and results obtained by different authorsthrough the implementation of UASs.
Keywords: drone applications; surface water; groundwater; photogrammetry; optical sensing;thermal infrared
1. Introduction
Sustainable water management has become a major concern over the past decades;as water demand increases with socioeconomic development and population growth,the availability of freshwater resources shrinks due to climate change, aquatic ecosystemdegradation and anthropogenic impacts. According to UNESCO [1], water use has beenincreasing 1% annually worldwide since the 1980s and the global demand for water isexpected to keep a similar trend until 2050. This would account for an increase of 20%to 30% above the current level of water use. Under these circumstances, ensuring waterin adequate quantity and quality to meet food security, environmental targets, publichealth requirements and the production of energy, services and other goods remains oneof the greatest challenges for water managers in coming years. This is especially criticalin regions such as sub-Saharan Africa, central and southwest Asia, which are affected bypersistent multi-year droughts, or the Mediterranean basin, where water resources areunevenly distributed and present severe deficiencies in its southern and eastern parts. Onthe other side of the coin, extreme precipitation events and alterations in flood frequencyand duration are affecting an increasing number of countries globally, causing loss oflives, health-related issues and multiple social and economic damages. These extreme
Remote Sens. 2021, 13, 1359. https://doi.org/10.3390/rs13071359 https://www.mdpi.com/journal/remotesensing
Remote Sens. 2021, 13, 1359 2 of 42
hydrological phenomena are likely to be exacerbated as a result of climate change, withincreases in their frequency according to the Fifth Assessment Report of the IPCC [2].Likewise, water quality issues are becoming a major concern. Numerous aquatic systemshave undergone severe pollution processes linked to agricultural, domestic and industrialactivities and waste disposal, situation that compromises the supply of clean potable waterand have deleterious effects on the ecosystem functioning and biota.
This scenario demands effective management and intervention in catchments, whichnecessarily involves gaining further knowledge of hydrological systems and filling currentinformation gaps. In this regard, unmanned aerial systems (UAS) also known as unmannedaerial vehicles (UAVs), remotely piloted aircraft systems (RPAS) or drones, have recentlyemerged as new allies in environmental monitoring and management. UAS have notonly made bird’s eye observation a reality, but also offer a vast range of applications thatis continually growing as technology advances. Although initially devised to supportmilitary operations, the civilian and scientific applications of UAS have attracted increasingattention in recent years, experiencing an exponential growth in their commercial, gov-ernmental and amateur use. The advances in fabrication, remote control capabilities andpower systems along with the improvements in sensing technologies installed onboard,have led to the development of a wide range of UAS that can be used to obtain valuableinformation in different contexts. Numerous advantages of UASs over other systems can becited; they are portable and enable the retrieval of data with very-high spatial resolutionsand unprecedent temporal coverage. They also enable engagement with areas that wouldotherwise be inaccessible or cost-prohibitive, especially if compared with methods such asairborne campaigns. Moreover, these platforms are easy to deploy, can be flown in smallenclosed areas [3] and their imagery might constitute systematic and permanent data thatcan be used by other individuals and organizations [4]. Regarding the latter aspect, itshould be noted that there is still a long way to go in terms of standardization of the meth-ods and available information. To date, UASs have been implemented in a wide range offields, such as wildlife research and monitoring [5,6] forestry [7,8], precision agriculture [9],architecture, engineering and construction [10,11], disaster management [12] and socialresearch just to name a few.
The need for monitoring the elements of the hydrological cycle is a widely recog-nized issue. Although in the last decades the field of hydrology has witnessed tremen-dous advances that have resulted in an increasing number of papers on the subject, asMcCabe et al. [13] pointed out, there are still significant gaps in our hydrological knowl-edge and analysis capabilities such as the estimation of water and mass transport processesacross aquatic–terrestrial interfaces, groundwater depth and storage, deep soil moisture,evaporation or snow water equivalent, among others. In this regard, the emergence ofUAS is leading to improvements in the understanding of hydrological processes and themanagement of water resources [14].
This article presents a review focused on the latest applications and advances of UAStechnology in the field of hydrology, concretely in water resource research, comprisingsurface water and groundwater. Although there are other reviews in this field, somehave a general scope, addressing the application of UAS to a wide range of civilian andenvironmental purposes [15] while others focus on very specific aspects of hydrology.For instance, Carrivick and Smith [16] reviewed the application of the structure frommotion (Sf M) algorithms in photogrammetry for aquatic and fluvial environments, Tomsettand Leyland [17] the current applications of remote sensing in river corridors and Rheeet al. [18] the application of UAS remote sensing to fluvial environments exclusively.DeBell et al. [14] focused on pragmatic concepts of UAS technology and sensors adequatefor water resource management. Several authors reviewed the applications of UAS inharmful algal bloom studies [19,20]. Here, nevertheless, we address the vast range ofUASs applications in inland water bodies with a purpose-oriented approach, classifyingthem according to the aim of the research conducted. This paper addresses (i) the currentapplications of UAS in surface and groundwater research, (ii) the type of UASs and sensors
Remote Sens. 2021, 13, 1359 3 of 42
mainly used in these tasks, (iii) the type of products generated from UAS-borne data,(iv) the advantages and limitations associated with their use and (v) knowledge gaps andfuture prospects of UASs application in freshwater research and management. Studieson oceanic-coastal applications, hydric erosion, atmospheric water cycle, glaciology andaquatic biodiversity/ecology were excluded from this review.
2. Methodology
An exhaustive search of papers published in academic journals was carried out fromAugust to November 2020. Papers without direct relevance to the use of UAS in freshwaterresearch were discarded. The academic databases and search engines used were Scopus,Google Scholar, Science Direct and Web of Science. Search results were restricted to Englishlanguage. Table 1 depicts the keywords used in the bibliographic search, including drone-related and hydrology-related terms.
Table 1. Search terms.
UAS and Sensor-Related Terms Hydrology-Related Terms
DroneLiDARRemote sensingRPASUASUAVUnmanned AerialSystemUnmanned AerialVehicleStructure fromMotionRGB
PhotogrammetryMultispectralHyperspectralThermal infrared
Algal bloomAquiferBathymetryFloodingFreshwaterGroundwaterHydrologyMorphologyRiverRiver dischargeRiverine plasticRunoff
SubmarinegroundwaterdischargeSubsidenceSurface velocitySurface-GroundwaterinteractionThermal plumeThermal structureWater budgetWater levelWater pollutionWater samplingWater storageWater tableWetland
For each application covered in this paper, search was conducted using differentcombinations of keywords, such as: “UAS hydrology”; “unmanned vehicle bathymetry”;“river bathymetry UAV”; “UAV river discharge”; “water surface velocity UAV”, “algalbloom UAV”, “UAS submarine groundwater discharge”, etc.
Only those papers published over the last two decades (2000–2020) were considered inorder to report the most updated information and ensure the inclusion of the most relevantworks, given the recent development of this technology.
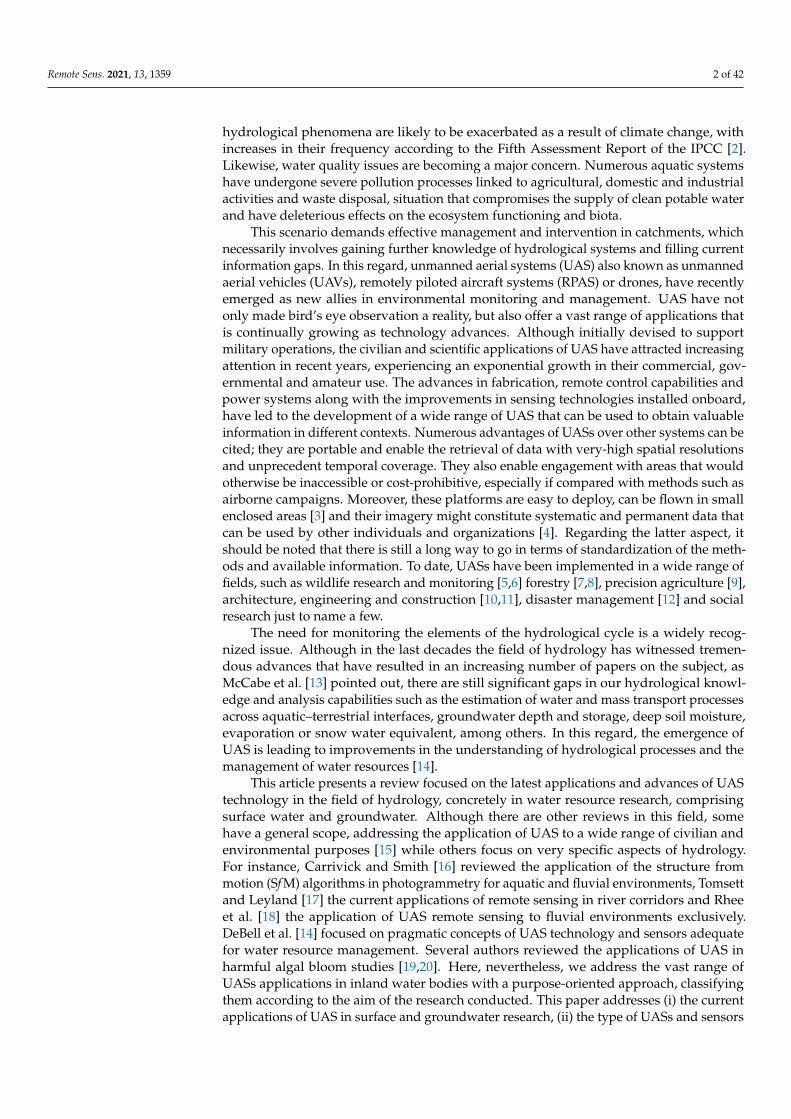
The study focuses on the applications of UASs in hydrology, concretely in freshwaterresearch, thus the literature search process was restricted to those experiences in whichUAS were used to study rivers, lakes, reservoirs, wetlands, groundwater bodies and theinteractions among them. Figure 1 shows the steps followed in the literature search andclassification process, from the initial screening and selection of eligible articles to theirfinal inclusion. Research articles were manually screened by reading the title and abstract,and to ensure relevance, were subsequently analyzed in detail. After discarding duplicatesand non-relevant works, a total of 122 research papers were selected and subsequentlycategorized according to the focus of the research work (Surface-groundwater interactions,water levels, contamination studies, system dynamics, etc.). It should be noted however,that some of the UAS applications presented here could fit into more than one category. Forthis reason, the papers have been classified according to the main objective of the study.
Remote Sens. 2021, 13, 1359 4 of 42Remote Sens. 2021, 13, 1359 4 of 43
Figure 1. Process of literature search and classification.
3. Types of UAS, Sensors and Other Payloads 3.1. Platforms
These sections do not intend to make an exhaustive overview on the type of UAS, sensor, power systems, etc., but to provide the necessary background for the comprehen-sion of the review as a whole. The vehicle itself is just one part of the complete unmanned aerial system as recognized by other authors [21]. Components such as the control and command element, the payload, take off and recovery system, data link and transmission, and the most important part: the human component, are essential for the system to per-form its task.
An unmanned aerial system consists of a flying device that includes: (i) A platform with the structural, mechanical and electronic elements necessary for the flight, its control and stability, (ii) a set of sensors and devices for the acquisition of information from the environment and (iii) a ground control station. UAS characterization can be made based on different variables. Normally, they are classified based on weight [22,23]. Terms such as “nano drone”, “micro drone”, “mini drone”, “pico-drone”, etc., are the most frequently used. Apart from weight, other authors include in the classification the typology of aerial vehicle itself or the take-off and landing mode: horizontal take-off and landing (HTOL) versus vertical take-off and landing (VTOL) [24]. Unconventional UAS such as bio-drones, smart dust, air-land-water hybrid drones are being considered in recent times [24]. In any case, most of the applications discussed in this work refer to “lightweight UAS”, which due to their reduced maximum take-off weight (MTOW) (less than 7 kg), affordable price, easy deployment and high performance are widely used in scientific research. The most affordable models range between 500 and 1500 €, while the most sophisticated can reach prices up to 120,000 € including the sensing equipment. Although some authors such as Watts et al. [25] propose a classification for civil applications that ranges from very small UAS to large remotely controlled vehicles that can reach thousands of meters in height and many hours of autonomy, legal restrictions in most countries justify a more restrictive classification. DeBell et al. [14], classified the lightweight UASs and analyzed their main characteristics and the available sensors with application to the management of water re-sources. More recently, Johnston [26] established a new classification and provided a cur-rent overview of platforms and sensors that, although it is oriented at marine research and conservation, it is also of interest for research on water resources.
Figure 1. Process of literature search and classification.
3. Types of UAS, Sensors and Other Payloads3.1. Platforms
These sections do not intend to make an exhaustive overview on the type of UAS,sensor, power systems, etc., but to provide the necessary background for the comprehensionof the review as a whole. The vehicle itself is just one part of the complete unmanned aerialsystem as recognized by other authors [21]. Components such as the control and commandelement, the payload, take off and recovery system, data link and transmission, and themost important part: the human component, are essential for the system to perform its task.
An unmanned aerial system consists of a flying device that includes: (i) A platformwith the structural, mechanical and electronic elements necessary for the flight, its controland stability, (ii) a set of sensors and devices for the acquisition of information from theenvironment and (iii) a ground control station. UAS characterization can be made basedon different variables. Normally, they are classified based on weight [22,23]. Terms suchas “nano drone”, “micro drone”, “mini drone”, “pico-drone”, etc., are the most frequentlyused. Apart from weight, other authors include in the classification the typology of aerialvehicle itself or the take-off and landing mode: horizontal take-off and landing (HTOL)versus vertical take-off and landing (VTOL) [24]. Unconventional UAS such as bio-drones,smart dust, air-land-water hybrid drones are being considered in recent times [24]. In anycase, most of the applications discussed in this work refer to “lightweight UAS”, whichdue to their reduced maximum take-off weight (MTOW) (less than 7 kg), affordable price,easy deployment and high performance are widely used in scientific research. The mostaffordable models range between 500 and 1500 €, while the most sophisticated can reachprices up to 120,000 € including the sensing equipment. Although some authors such asWatts et al. [25] propose a classification for civil applications that ranges from very smallUAS to large remotely controlled vehicles that can reach thousands of meters in heightand many hours of autonomy, legal restrictions in most countries justify a more restrictiveclassification. DeBell et al. [14], classified the lightweight UASs and analyzed their maincharacteristics and the available sensors with application to the management of waterresources. More recently, Johnston [26] established a new classification and provided acurrent overview of platforms and sensors that, although it is oriented at marine researchand conservation, it is also of interest for research on water resources.
Remote Sens. 2021, 13, 1359 5 of 42
In general, for most hydrological applications these platforms can be categorizedaccording to their airframe configuration, propulsion method, and flight characteristicsinto four main types: multi-rotor, fixed wing, transitional and others (balloons, kitesand blimps). Multi-rotor UASs have multiple engines and propellers that allow the lift,movement and orientation of the platform (pitch, roll, and yaw). Multi-rotors, also knownas multicopters, typically employ four (quadcopter), six (hexacopter), or eight (octocopter)motors and propellers; by increasing or decreasing the output of individual motors it ispossible to control the movement of such vehicles. A greater number of motors, especiallyin larger UASs, reduces the risk of falling due to mechanical failures, even though thisredundancy is often accompanied by a reduction in efficiency. In fact, the main limitationof multirotor systems is their flight time, mostly due to higher energy demands, batteryweight and energy storage constraints. Finally, these types of UASs are manufacturedfrom lightweight and resistant materials such as aluminum, composites (carbon fiber)and plastic.
Fixed-wing UASs have one or two wings that provide maneuverability and lift; theycan have several wings configurations (gliders, delta wings, canards, among others). Fixed-wing UASs are generally driven by one or two motors and propellers in a push or pullconfiguration. These types of UASs are manufactured from very lightweight materials,including various forms of expanded foam (polyolefin, polypropylene or polystyrene) andcomposite. The flight efficiency of these aircraft is usually higher than in the multi-rotorsUASs, due to their lower relative weight and the fact that the lift is of the passive type,through large airfoil surfaces.
Transitional UASs combine aspects of multi-rotor and fixed-wing devices to providegreater flexibility in their use. They intend to incorporate the advantages of the verticaltake-off and landing of the former with the greater autonomy and range of action of thelatter. Vertical flight is typically driven through three or four motors facing upward, andhorizontal flight is driven by a motor and propeller in a push configuration while lift isproduced by the wings.
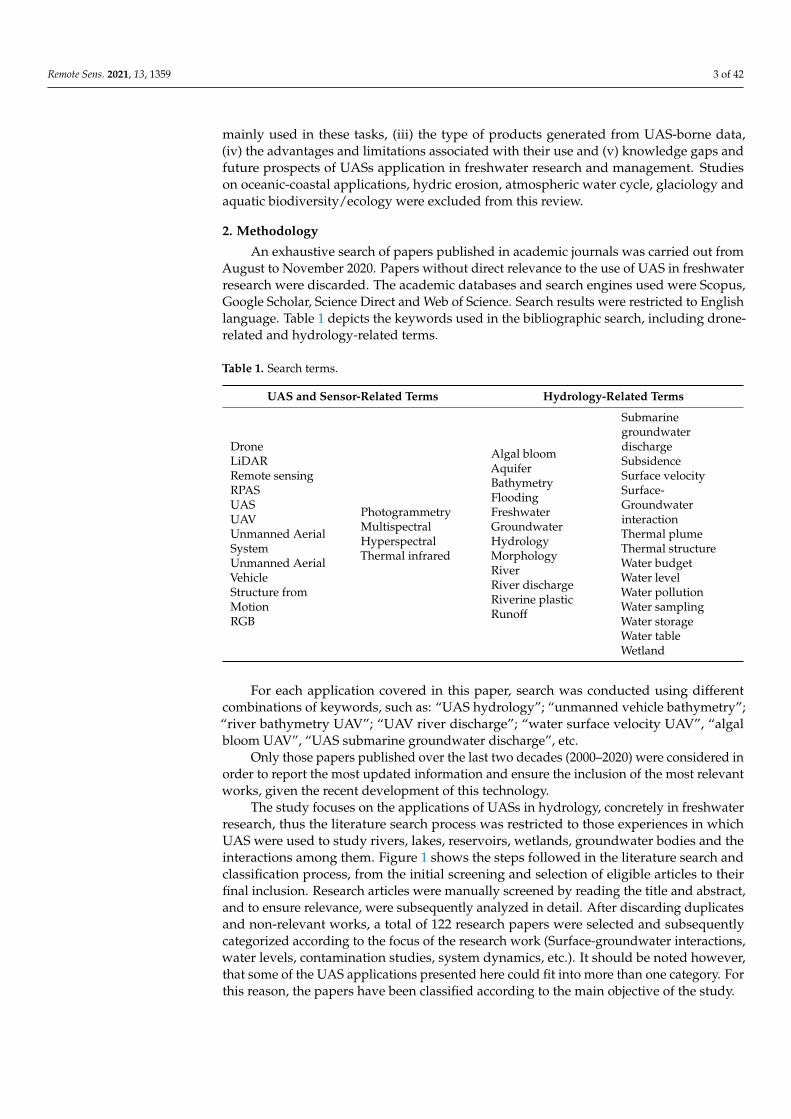
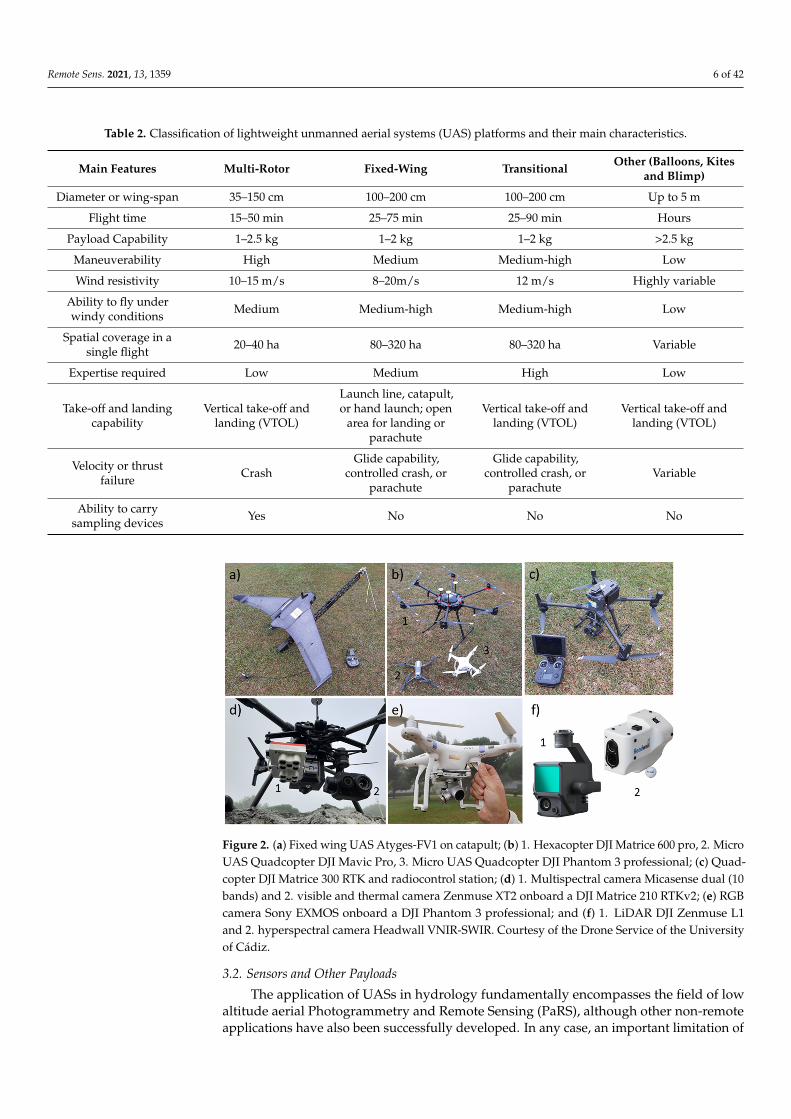
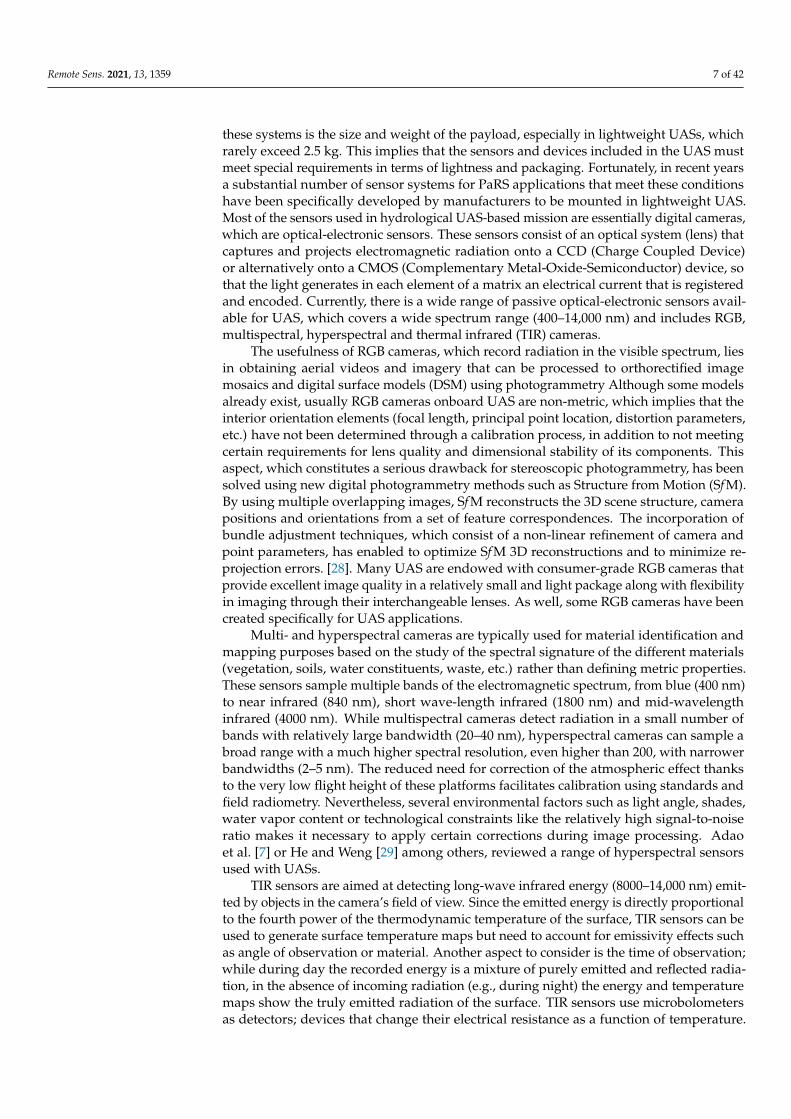
Finally, the category “other” includes devices that either do not have autonomousmeans of propulsion (kites and balloons) or, if they do, the lift is given by gas lighterthan air (blimps). In recent years, these devices have been gradually replaced in mostapplications by the previous types, due to technological development which have notablyimproved their performance. Table 2 shows the main characteristics of the platform classesand Figure 2 illustrates different types of platforms and sensors.
Albeit different power supply and energy management systems can be used (see areview on this topic in [27]) most UASs used for research purposes are battery powered.Lithium polymer batteries provide significant energy density and can discharge enoughelectrical current to meet the variable electrical current demands of the engine and payload.Some systems are hybrid, employing combustion engines together with battery-poweredelectric motors.
The flight control system, sometimes named autopilot, is the core of the vehicle. Itnormally includes a flight control processing unit composed of an inertial measurementunit (IMU), electronic speed control (ESC) units, barometer and a global navigation satellitesystem (GNSS). The IMU consists of a set of accelerometers (normally 3), gyroscopes andmagnetometers whose main purpose is determining the orientation, linear and angularaccelerations to estimate the movement direction with respect to the earth magnetic field.A data storage system and communication modules (telemetry) are also additional partsof the flight control system. UASs rely on two main navigation technologies, InertialNavigation Systems (INS) and Global Navigation Satellite Systems (GNSS), so that they canwork in a GNSS-only or INS/GNSS coupling mode. The cost reduction and miniaturizationof high-performance GNSS units, which allow connection to a nearby reference station andreception of correctional data in real time (kinematic correction), can provide accuracies of3–5 cm in the dynamic position of the platform, with the consequent improvement in theobservations made using sensors and devices.
Remote Sens. 2021, 13, 1359 6 of 42
Table 2. Classification of lightweight unmanned aerial systems (UAS) platforms and their main characteristics.
Main Features Multi-Rotor Fixed-Wing Transitional Other (Balloons, Kitesand Blimp)
Diameter or wing-span 35–150 cm 100–200 cm 100–200 cm Up to 5 m
Flight time 15–50 min 25–75 min 25–90 min Hours
Payload Capability 1–2.5 kg 1–2 kg 1–2 kg >2.5 kg
Maneuverability High Medium Medium-high Low
Wind resistivity 10–15 m/s 8–20m/s 12 m/s Highly variable
Ability to fly underwindy conditions Medium Medium-high Medium-high Low
Spatial coverage in asingle flight 20–40 ha 80–320 ha 80–320 ha Variable
Expertise required Low Medium High Low
Take-off and landingcapability
Vertical take-off andlanding (VTOL)
Launch line, catapult,or hand launch; open
area for landing orparachute
Vertical take-off andlanding (VTOL)
Vertical take-off andlanding (VTOL)
Velocity or thrustfailure Crash
Glide capability,controlled crash, or
parachute
Glide capability,controlled crash, or
parachuteVariable
Ability to carrysampling devices Yes No No NoRemote Sens. 2021, 13, 1359 6 of 43
Figure 2. (a) Fixed wing UAS Atyges-FV1 on catapult; (b) 1. Hexacopter DJI Matrice 600 pro, 2. Micro UAS Quadcopter DJI Mavic Pro, 3. Micro UAS Quadcopter DJI Phantom 3 professional; (c) Quadcopter DJI Matrice 300 RTK and radiocontrol station; (d) 1. Multispectral camera Micasense dual (10 bands) and 2. visible and thermal camera Zenmuse XT2 onboard a DJI Matrice 210 RTKv2; (e) RGB camera Sony EXMOS onboard a DJI Phantom 3 professional; and (f) 1. LiDAR DJI Zenmuse L1 and 2. hyperspectral camera Headwall VNIR-SWIR. Courtesy of the Drone Service of the University of Cádiz.
Albeit different power supply and energy management systems can be used (see a review on this topic in [27]) most UASs used for research purposes are battery powered. Lithium polymer batteries provide significant energy density and can discharge enough electrical current to meet the variable electrical current demands of the engine and pay-load. Some systems are hybrid, employing combustion engines together with battery-powered electric motors.
The flight control system, sometimes named autopilot, is the core of the vehicle. It normally includes a flight control processing unit composed of an inertial measurement unit (IMU), electronic speed control (ESC) units, barometer and a global navigation satel-lite system (GNSS). The IMU consists of a set of accelerometers (normally 3), gyroscopes and magnetometers whose main purpose is determining the orientation, linear and angu-lar accelerations to estimate the movement direction with respect to the earth magnetic field. A data storage system and communication modules (telemetry) are also additional parts of the flight control system. UASs rely on two main navigation technologies, Inertial Navigation Systems (INS) and Global Navigation Satellite Systems (GNSS), so that they can work in a GNSS-only or INS/GNSS coupling mode. The cost reduction and miniatur-ization of high-performance GNSS units, which allow connection to a nearby reference station and reception of correctional data in real time (kinematic correction), can provide accuracies of 3–5 cm in the dynamic position of the platform, with the consequent im-provement in the observations made using sensors and devices.
3.2. Sensors and Other Payloads The application of UASs in hydrology fundamentally encompasses the field of low
altitude aerial Photogrammetry and Remote Sensing (PaRS), although other non-remote applications have also been successfully developed. In any case, an important limitation of these systems is the size and weight of the payload, especially in lightweight UASs, which rarely exceed 2.5 kg. This implies that the sensors and devices included in the UAS must meet special requirements in terms of lightness and packaging. Fortunately, in re-cent years a substantial number of sensor systems for PaRS applications that meet these conditions have been specifically developed by manufacturers to be mounted in light-weight UAS. Most of the sensors used in hydrological UAS-based mission are essentially
Figure 2. (a) Fixed wing UAS Atyges-FV1 on catapult; (b) 1. Hexacopter DJI Matrice 600 pro, 2. MicroUAS Quadcopter DJI Mavic Pro, 3. Micro UAS Quadcopter DJI Phantom 3 professional; (c) Quad-copter DJI Matrice 300 RTK and radiocontrol station; (d) 1. Multispectral camera Micasense dual (10bands) and 2. visible and thermal camera Zenmuse XT2 onboard a DJI Matrice 210 RTKv2; (e) RGBcamera Sony EXMOS onboard a DJI Phantom 3 professional; and (f) 1. LiDAR DJI Zenmuse L1and 2. hyperspectral camera Headwall VNIR-SWIR. Courtesy of the Drone Service of the Universityof Cádiz.
3.2. Sensors and Other Payloads
The application of UASs in hydrology fundamentally encompasses the field of lowaltitude aerial Photogrammetry and Remote Sensing (PaRS), although other non-remoteapplications have also been successfully developed. In any case, an important limitation of
Remote Sens. 2021, 13, 1359 7 of 42
these systems is the size and weight of the payload, especially in lightweight UASs, whichrarely exceed 2.5 kg. This implies that the sensors and devices included in the UAS mustmeet special requirements in terms of lightness and packaging. Fortunately, in recent yearsa substantial number of sensor systems for PaRS applications that meet these conditionshave been specifically developed by manufacturers to be mounted in lightweight UAS.Most of the sensors used in hydrological UAS-based mission are essentially digital cameras,which are optical-electronic sensors. These sensors consist of an optical system (lens) thatcaptures and projects electromagnetic radiation onto a CCD (Charge Coupled Device)or alternatively onto a CMOS (Complementary Metal-Oxide-Semiconductor) device, sothat the light generates in each element of a matrix an electrical current that is registeredand encoded. Currently, there is a wide range of passive optical-electronic sensors avail-able for UAS, which covers a wide spectrum range (400–14,000 nm) and includes RGB,multispectral, hyperspectral and thermal infrared (TIR) cameras.
The usefulness of RGB cameras, which record radiation in the visible spectrum, liesin obtaining aerial videos and imagery that can be processed to orthorectified imagemosaics and digital surface models (DSM) using photogrammetry Although some modelsalready exist, usually RGB cameras onboard UAS are non-metric, which implies that theinterior orientation elements (focal length, principal point location, distortion parameters,etc.) have not been determined through a calibration process, in addition to not meetingcertain requirements for lens quality and dimensional stability of its components. Thisaspect, which constitutes a serious drawback for stereoscopic photogrammetry, has beensolved using new digital photogrammetry methods such as Structure from Motion (Sf M).By using multiple overlapping images, Sf M reconstructs the 3D scene structure, camerapositions and orientations from a set of feature correspondences. The incorporation ofbundle adjustment techniques, which consist of a non-linear refinement of camera andpoint parameters, has enabled to optimize Sf M 3D reconstructions and to minimize re-projection errors. [28]. Many UAS are endowed with consumer-grade RGB cameras thatprovide excellent image quality in a relatively small and light package along with flexibilityin imaging through their interchangeable lenses. As well, some RGB cameras have beencreated specifically for UAS applications.
Multi- and hyperspectral cameras are typically used for material identification andmapping purposes based on the study of the spectral signature of the different materials(vegetation, soils, water constituents, waste, etc.) rather than defining metric properties.These sensors sample multiple bands of the electromagnetic spectrum, from blue (400 nm)to near infrared (840 nm), short wave-length infrared (1800 nm) and mid-wavelengthinfrared (4000 nm). While multispectral cameras detect radiation in a small number ofbands with relatively large bandwidth (20–40 nm), hyperspectral cameras can sample abroad range with a much higher spectral resolution, even higher than 200, with narrowerbandwidths (2–5 nm). The reduced need for correction of the atmospheric effect thanksto the very low flight height of these platforms facilitates calibration using standards andfield radiometry. Nevertheless, several environmental factors such as light angle, shades,water vapor content or technological constraints like the relatively high signal-to-noiseratio makes it necessary to apply certain corrections during image processing. Adaoet al. [7] or He and Weng [29] among others, reviewed a range of hyperspectral sensorsused with UASs.
TIR sensors are aimed at detecting long-wave infrared energy (8000–14,000 nm) emit-ted by objects in the camera’s field of view. Since the emitted energy is directly proportionalto the fourth power of the thermodynamic temperature of the surface, TIR sensors can beused to generate surface temperature maps but need to account for emissivity effects suchas angle of observation or material. Another aspect to consider is the time of observation;while during day the recorded energy is a mixture of purely emitted and reflected radia-tion, in the absence of incoming radiation (e.g., during night) the energy and temperaturemaps show the truly emitted radiation of the surface. TIR sensors use microbolometersas detectors; devices that change their electrical resistance as a function of temperature.

Remote Sens. 2021, 13, 1359 8 of 42
This resistance change is measured and transformed into temperatures which can beused to create an image. Currently, there are two main types of commercial TIR systems;(i) sensors with cooled microbolometer arrays, which measure the short-medium wave IR,offer greater resolution and thermal sensitivity but are bulkier and more expensive and(ii) sensors with uncooled microbolometers, which work in the LWIR spectrum and are lesssusceptible to solar reflection. As cooled microbolometers are heavier, they are normallyused in airplanes or satellites. Uncooled microbolometer on the other hand are lighterand cheaper, what makes them suitable to be mounted on UAS, but they can experiencetemperature drift issues [30]. This temperature drift problem is an inherent consequence ofthe set-up of the sensor; uncooled microbolometers are infrared sensors distributed in anarray where each unit function as single sensor elements. Temperature drift in the systemwill occur due to temperature changes inside the camera or due to heating of the lenses orfocal plane array. The most common approach to tackle with this issue is the application ofnon-uniformity corrections to remove noise, what leads to a more homogenized responsesignal along the microbolometer array [31,32]. In this regard, ref. [32] proposes a workflowfor data acquisition and preprocessing along with best practices to reduce camera uncer-tainty in long and short-term noise. In recent years LiDAR (Light Detection and Ranging)sensors are being incorporated into lightweight UAS platforms. These sensor packages,which are active type, use lasers to scan the environment to produce 3D point clouds of theterrain, bottom of surface water bodies and vegetation.
Finally, in addition to the devices that remotely acquire information from objects avoid-ing any physical contact, UAS platforms can carry instruments such as multiparameterprobes (temperature, electrical conductivity, pH, Eh, dissolved oxygen, oxidation-reductionpotential, etc.) to be dipped into the water column, different types of samplers, Geiger coun-ters or magnetometers or multi-gas monitors among others. In all cases, UAS constitute aplatform from which conventional measurements can be carried out with great flexibilityin terms of location and movement, reducing campaign costs and minimizing risks [33]. Ageneral overview of the different types of sensors and their advantages, limitations andpotential applications is provided in Table 3.
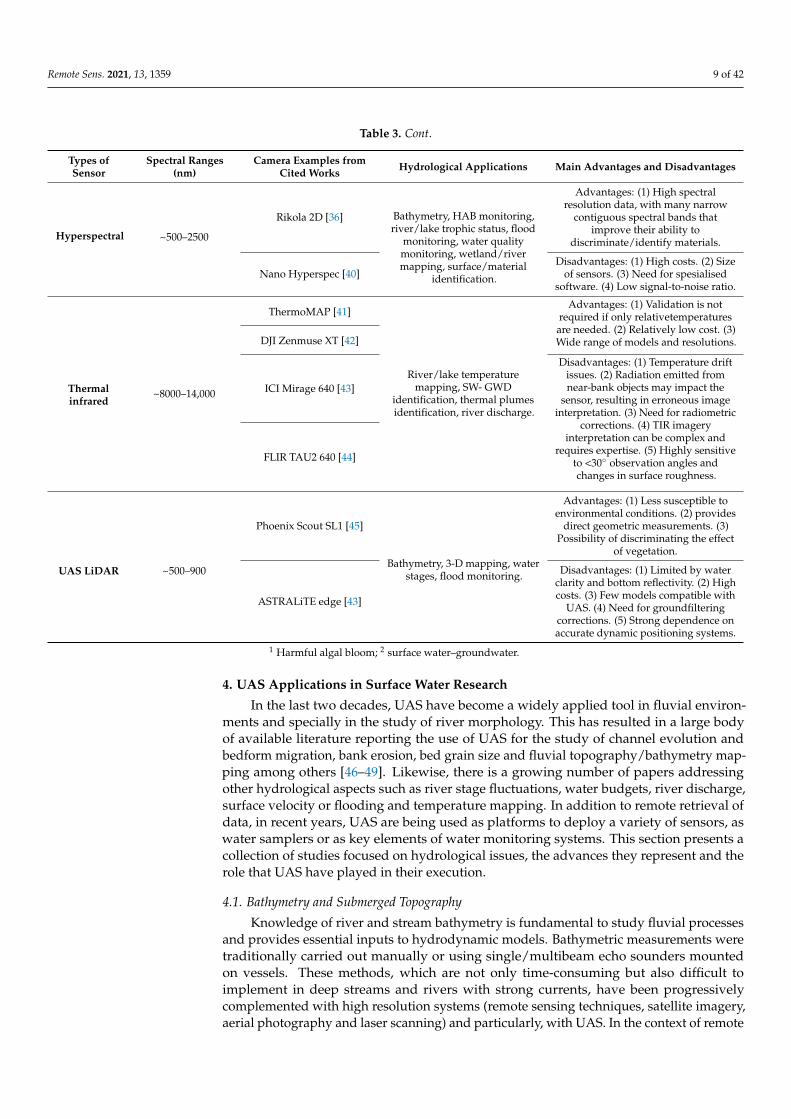
Table 3. Overview and some examples of sensors commonly used with UAS in hydrological research.
Types ofSensor
Spectral Ranges(nm)
Camera Examples fromCited Works Hydrological Applications Main Advantages and Disadvantages
RGB ~400–700
Canon PowershotG5/Canon EOS [34]
Visual analysis, bathymetry,DEM photogrammetry, water
stages, flood monitoring, particlevelocymetry, HAB 1 monitoring,
mapping and classification ofsurfaces.
Advantages: (1) Wide range of prices,resolutions and weights available
depending on the model. (2) Videocapture. (3) Easy integration in
different platforms.
Zenmuse X3 FC350 [35] Disadvantages: (1) Lower spectralresolution that makes them unsuitable
for many tasks. (2) Very sensitive toenvironmental and ilumination
conditions. (3) Some lack of geometricand radiometric calibration.
RGB OLYMPUS EP-2 [36]
Nikon D500/D5100 [37]
Multispectral ~400–1000Rededge Micasense
[38,39]
Bathymetry, HAB monitoring,river/lake trophic status, flood
monitoring, SW–GW 2
interactions, wetland/rivermapping, surface/material
identification.
Advantages: (1) Wider range ofapplications compared to RGB sensors,
allowing to discriminate/identify avariety of materials. (2) Some presentmeans of radiometric calibration. (3)Allow geometric reconstruction. (4)
Allow sub-decimetric mapping.
Disadvantages: (1) Relatively highprices. (2) Detect radiation in a smallnumber of broad wavelength bands,
limiting their applications. (3)Currently, sensors are not optimisedfor aquatic applications. (4) Limited
compatibility to UASs.
Remote Sens. 2021, 13, 1359 9 of 42
Table 3. Cont.
Types ofSensor
Spectral Ranges(nm)
Camera Examples fromCited Works Hydrological Applications Main Advantages and Disadvantages
Hyperspectral ~500–2500
Rikola 2D [36] Bathymetry, HAB monitoring,river/lake trophic status, flood
monitoring, water qualitymonitoring, wetland/rivermapping, surface/material
identification.
Advantages: (1) High spectralresolution data, with many narrow
contiguous spectral bands thatimprove their ability to
discriminate/identify materials.
Nano Hyperspec [40]Disadvantages: (1) High costs. (2) Size
of sensors. (3) Need for spesialisedsoftware. (4) Low signal-to-noise ratio.
Thermalinfrared
~8000–14,000
ThermoMAP [41]
River/lake temperaturemapping, SW- GWD
identification, thermal plumesidentification, river discharge.
Advantages: (1) Validation is notrequired if only relativetemperatures
are needed. (2) Relatively low cost. (3)Wide range of models and resolutions.DJI Zenmuse XT [42]
ICI Mirage 640 [43]
Disadvantages: (1) Temperature driftissues. (2) Radiation emitted fromnear-bank objects may impact the
sensor, resulting in erroneous imageinterpretation. (3) Need for radiometric
corrections. (4) TIR imageryinterpretation can be complex and
requires expertise. (5) Highly sensitiveto <30◦ observation angles andchanges in surface roughness.
FLIR TAU2 640 [44]
UAS LiDAR ~500–900
Phoenix Scout SL1 [45]
Bathymetry, 3-D mapping, waterstages, flood monitoring.
Advantages: (1) Less susceptible toenvironmental conditions. (2) provides
direct geometric measurements. (3)Possibility of discriminating the effect
of vegetation.
ASTRALiTE edge [43]
Disadvantages: (1) Limited by waterclarity and bottom reflectivity. (2) Highcosts. (3) Few models compatible with
UAS. (4) Need for groundfilteringcorrections. (5) Strong dependence onaccurate dynamic positioning systems.
1 Harmful algal bloom; 2 surface water–groundwater.
4. UAS Applications in Surface Water Research
In the last two decades, UAS have become a widely applied tool in fluvial environ-ments and specially in the study of river morphology. This has resulted in a large bodyof available literature reporting the use of UAS for the study of channel evolution andbedform migration, bank erosion, bed grain size and fluvial topography/bathymetry map-ping among others [46–49]. Likewise, there is a growing number of papers addressingother hydrological aspects such as river stage fluctuations, water budgets, river discharge,surface velocity or flooding and temperature mapping. In addition to remote retrieval ofdata, in recent years, UAS are being used as platforms to deploy a variety of sensors, aswater samplers or as key elements of water monitoring systems. This section presents acollection of studies focused on hydrological issues, the advances they represent and therole that UAS have played in their execution.
4.1. Bathymetry and Submerged Topography
Knowledge of river and stream bathymetry is fundamental to study fluvial processesand provides essential inputs to hydrodynamic models. Bathymetric measurements weretraditionally carried out manually or using single/multibeam echo sounders mountedon vessels. These methods, which are not only time-consuming but also difficult toimplement in deep streams and rivers with strong currents, have been progressivelycomplemented with high resolution systems (remote sensing techniques, satellite imagery,aerial photography and laser scanning) and particularly, with UAS. In the context of remote
Remote Sens. 2021, 13, 1359 10 of 42
sensing, bathymetric mapping can be tackled with three approaches; (i) spectral methodsbased on the attenuation of the electromagnetic wave in the water column and the reflectionfrom the bottom of the water body, (ii) photogrammetry, which uses sets of images recordedwith imaging sensors to identify coordinates of points, boundaries and features in theimages, and (iii) bathymetric LiDAR, which measures the time from pulse emission andecho reception, scattered back from the river/lake bottom within the instantaneous field ofview. These remote sensing tools can significantly improve the accuracy and reliability ofriver geomorphology mapping and modeling specially when high topographical resolutionis required.
Optical methods such as UAS photogrammetry were traditionally restricted to above-water studies, but nowadays their scope of application has been extended to below-waterareas due to the development of refraction-correction algorithms. This has made possibleto capture water surface and bottom features and water column characteristics as long asthe system is not masked by vegetation or other obstacles and water is clear. One of earliestexamples of this type of UAS application is provided by Lejot et al. [34], who launched aparamotor-paraglider equipped with a conventional RGB camera to acquire high resolutionimagery and study channel water depth and gravel bar geometry at the Ain and Dromerivers (France). A simple empirical model that related radiometric signal with water depthwas used to characterize aquatic zones of different size, yielding spatial resolutions of5–7 cm. The water depth surveyed ranged from 0 to 5 m, and the results showed goodaccuracy until 3 m. The gravel bar was characterized through classical photogrammetrywith a DEM generated using stereoscopic pairs, achieving 5 cm resolution. Althoughheterogeneous, the quality of both products was sufficient for bathymetric and channelmicrotopography mapping. In a pilot study Zinke and Flener [50] generated bathymetricmaps at 2 sites of a gravel riverbed in Norway using drone-borne photography and theLyzenga’s deep water correction algorithm. Although the results of this study offeredvariable levels of accuracy and precision, the authors demonstrated the usefulness of UAS-based optical remote sensing methods to improve the effectiveness of bathymetric surveys.Flener et al. [37] created a seamless DEM of a subarctic river channel and plains combiningmobile laser scanning and UAS-photography based bathymetric modeling. Albeit waterdepth in the study area did not exceed 1.5 m, the authors found quality issues in the UASimagery that were mostly related to reflection (sunglint) and illumination changes duringthe flight. Accuracy varied depending on the combination of methods applied. Despitethese problems, the UAS-photography-bathymetric model gave depth accuracies below10 cm, which is suitable for applications such as hydraulic modeling or habitat studies, butinsufficient for more detailed studies.
On the other hand, structure from motion (Sf M), has been widely used in fluvialbathymetry in recent years. For instance, Woodget et al. [51] quantified the exposed andsubmerged topography of two river reaches (depths ranging from 0.14 to 0.70 m) in UKthrough Sf M photogrammetry. An UAS equipped with a RGB consumer-grade camera wasused to produce DEMs with hyperspatial resolutions of 2–15 cm. Mean errors in submergedareas ranged between 1.6–8.9 cm but were significantly reduced after the application ofa simple refraction correction, reaching values between −2.9 to 5.3 cm. Dietrich [52]retrieved fluvial bathymetric measurements from UAS imagery and Sf M and proposed amulticamera-based refraction correction method for off-nadir Sf M datasets. In this case, thesurveyed water depth varied between 0 and 1.5m. The bathymetric datasets obtained afterthe correction showed precisions of ~0.1% of the flying altitude (40 and 60 m above groundlevel), which makes this method suitable for a range of fluvial applications. Entwistle andHeritage [53] generated a Sf M-derived DEM with imagery collected from a small UAS topredict water depth and map bathymetric surfaces. The results from the Sf M survey werecompared with others from a theodolite survey, showing similar accuracy and precision(0.85 R2 value after using a 1.02 multiplier on the regression line up to depths of 1 m), thusdemonstrating that the UAS approach proposed could achieve good depth estimations.Carrivick and Smith [16] reviewed the applications of Sf M photogrammetry and UAS
Remote Sens. 2021, 13, 1359 11 of 42
technology in aquatic environments, highlighting the need of automated procedures tocorrect refraction. The issue of refraction correction has been addressed in several works;Woodget et al. [35] quantified above and below-water geomorphic changes in a riverthrough Sf M photogrammetry and analyzed the implications of refraction, water surfaceelevation and the spatial variability of topographic errors. They demonstrated that itis possible to quantify submerged geomorphic changes with levels of accuracy of lessthan 4 cm similar to that from exposed areas without the need of calibration data andthat, using nadir imagery, the results obtained after different refraction corrections arepractically the same. Partama et al. [54] presented a novel technique based on co-registeredimage sequences or video frames to reduce the effects of water-surface reflection on UAS-based photogrammetry. This promising method, applied in a river reach 0–1.5 m deep,achieved accuracies of 5–15 cm, clarified the reflected signal from the bottom bed andenabled to reduce moving light patterns. The issue of refraction correction has beenaddressed by several authors, although most works focus on the marine environment, forinstance Skarlatos and Agrafiotis [55] proposed an iterative algorithm that, applied at thephoto level, could reduce the effect of refraction to 2 times the ground pixel size withinthe photogrammetric workflow. Also in marine environments, Agrafiotis et al. [56,57]provided a deep-learning framework to automatically correct water refraction errors. Themethod consisted in a support vector regression model based on known depth observationsfrom bathymetric LiDAR surveys, which enabled to estimate the real depth of point cloudsobtained from Sf M and multi-view-stereo techniques. The model demonstrated greatpotential in terms of depth accuracy in shallow waters and can be used when no LiDARdata are available.
River depth estimations have also been successfully retrieved from UAS hyperspectraldata; Gentile et al. [36] used very high spatial resolution hyperspectral images and anempirical model to map the bathymetry of a shallow river, achieving a good fit in thespectral range from 700–800 nm and average errors of even less than 13 cm at depthsbetween 9–101 cm.
On the other hand, LiDAR sensors were rarely implemented in UAS owing to theirhigh costs and usually excessive weight, however, these issues are being overcome lead-ing to the democratization of these systems and making their use increasingly frequent.For these reasons, until recently, a widely applied alternative to optimize photogrammet-ric DEMs and produce more accurate products was the complementary use of satellite,airborne or land-based LiDAR data and UAS optical images. The performance of multi-spectral satellite imagery, hyperspectral data from manned aircraft and UAS, and waterpenetrating green LiDAR to map fluvial bathymetry was assessed by [40] in a short reachof Sacramento River with a mean depth of 1.8 m. LiDAR systems offered greater accuracies,while UAS-borne products tended to underpredict depths, reaching R2 values of 0.95 and0.88 respectively. However, the maximum detectable depth for the LiDAR sensor was animportant constraint due to the lack of bottom returns at depths greater than 2 m. Giventhe constraints of remote sensing of river bathymetry, the authors advocate for a hybridfield and airborne approach but recommend the use of hyperspectral or multispectralUAS imagery for small channels and fine-scale information owing to their versatility, highspatial resolution and the possibility of collecting targeted and task-specific data. A majorleap forward for river mapping is the methodology presented Mandlburger et al. [58] whodeveloped a novel compact topo-bathymetric laser scanner designed for integration onUASs and other types of aircrafts. The sensor comprised an IR laser that emitted pulses ata wavelength of 532 nm with a duration about 1.5 ns pulse and a pulse repetition rate of50–200 kHz. The laser had a 10–30 cm footprint on the ground and yielded a point densityof 20–50 points/m2, which made it particularly well suited for capturing river bathymetry.The system was tested in freshwater ponds with an overall depth of 5–6 m and turbidbottoms. Although the system presented a maximum vertical deviation of 7.8 cm and asystematic depth-dependent error, the sensor showed great potential for hydrology and
Remote Sens. 2021, 13, 1359 12 of 42
fluvial morphology applications owing to its good depth performance, accuracy and highspatial resolution.
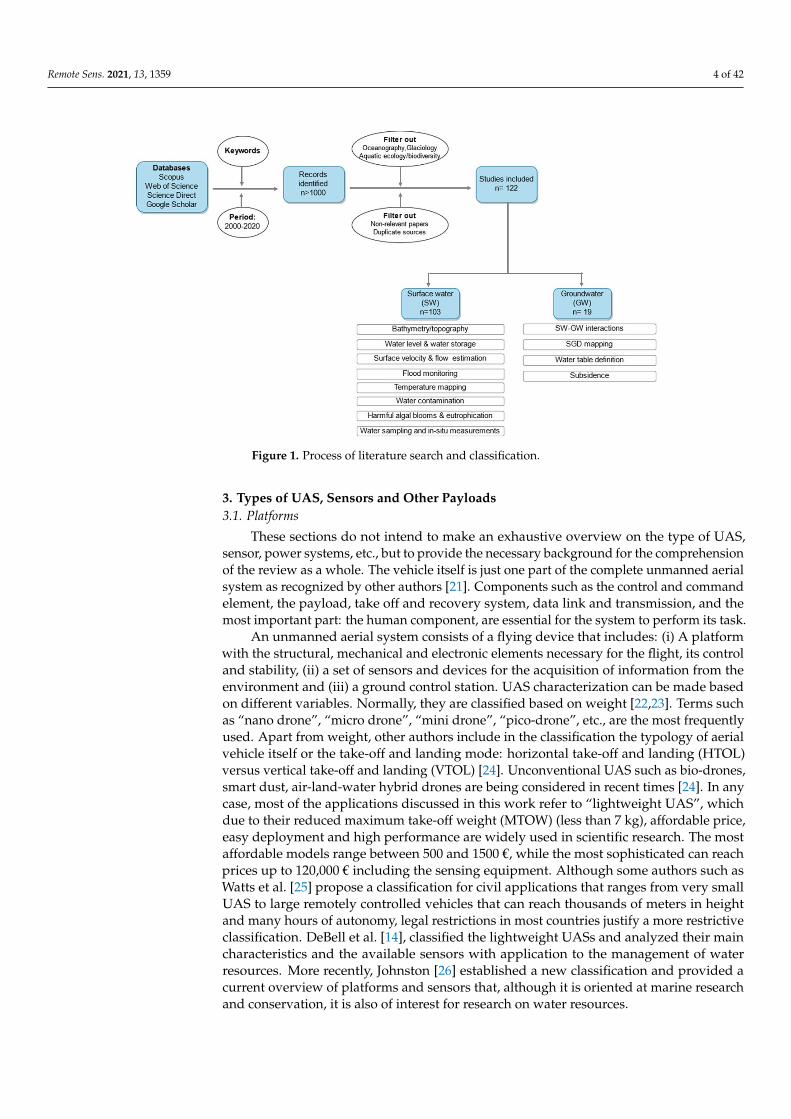
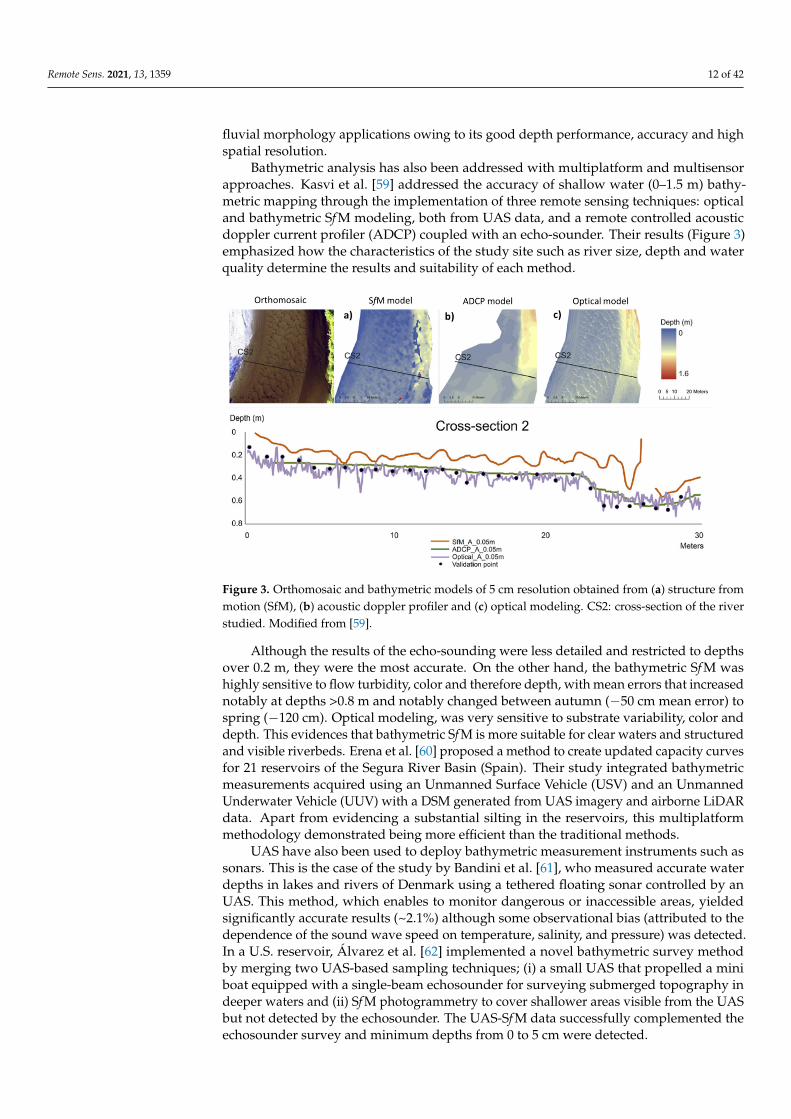
Bathymetric analysis has also been addressed with multiplatform and multisensorapproaches. Kasvi et al. [59] addressed the accuracy of shallow water (0–1.5 m) bathy-metric mapping through the implementation of three remote sensing techniques: opticaland bathymetric Sf M modeling, both from UAS data, and a remote controlled acousticdoppler current profiler (ADCP) coupled with an echo-sounder. Their results (Figure 3)emphasized how the characteristics of the study site such as river size, depth and waterquality determine the results and suitability of each method.
Remote Sens. 2021, 13, 1359 12 of 43
Figure 3. Orthomosaic and bathymetric models of 5 cm resolution obtained from (a) structure from motion (SfM), (b) acoustic doppler profiler and (c) optical modeling. CS2: cross-section of the river studied. Modified from [59].
Although the results of the echo-sounding were less detailed and restricted to depths over 0.2 m, they were the most accurate. On the other hand, the bathymetric SfM was highly sensitive to flow turbidity, color and therefore depth, with mean errors that in-creased notably at depths >0.8 m and notably changed between autumn (−50 cm mean error) to spring (−120 cm). Optical modeling, was very sensitive to substrate variability, color and depth. This evidences that bathymetric SfM is more suitable for clear waters and structured and visible riverbeds. Erena et al. [60] proposed a method to create updated capacity curves for 21 reservoirs of the Segura River Basin (Spain). Their study integrated bathymetric measurements acquired using an Unmanned Surface Vehicle (USV) and an Unmanned Underwater Vehicle (UUV) with a DSM generated from UAS imagery and airborne LiDAR data. Apart from evidencing a substantial silting in the reservoirs, this multiplatform methodology demonstrated being more efficient than the traditional meth-ods.
UAS have also been used to deploy bathymetric measurement instruments such as sonars. This is the case of the study by Bandini et al. [61], who measured accurate water depths in lakes and rivers of Denmark using a tethered floating sonar controlled by an UAS. This method, which enables to monitor dangerous or inaccessible areas, yielded sig-nificantly accurate results (~2.1%) although some observational bias (attributed to the de-pendence of the sound wave speed on temperature, salinity, and pressure) was detected. In a U.S. reservoir, Álvarez et al. [62] implemented a novel bathymetric survey method by merging two UAS-based sampling techniques; (i) a small UAS that propelled a mini boat equipped with a single-beam echosounder for surveying submerged topography in deeper waters and (ii) SfM photogrammetry to cover shallower areas visible from the UAS but not detected by the echosounder. The UAS-SfM data successfully complemented the echosounder survey and minimum depths from 0 to 5 cm were detected.
Finally, it should be noted that many studies on bathymetric reconstruction of shal-low streams and reservoirs proved that models derived from high resolution UAS data are more robust than previous models based on conventional methods, reducing inaccu-racies and biases, and enabling better hydraulic modeling performance [63–66].
4.2. Water Level Measurement and Water Storage Albeit the temporal and spatial fluctuations of water stored in rivers, lakes, reservoirs
and wetlands are among the most important hydrologic observations, the current
Figure 3. Orthomosaic and bathymetric models of 5 cm resolution obtained from (a) structure frommotion (SfM), (b) acoustic doppler profiler and (c) optical modeling. CS2: cross-section of the riverstudied. Modified from [59].
Although the results of the echo-sounding were less detailed and restricted to depthsover 0.2 m, they were the most accurate. On the other hand, the bathymetric Sf M washighly sensitive to flow turbidity, color and therefore depth, with mean errors that increasednotably at depths >0.8 m and notably changed between autumn (−50 cm mean error) tospring (−120 cm). Optical modeling, was very sensitive to substrate variability, color anddepth. This evidences that bathymetric Sf M is more suitable for clear waters and structuredand visible riverbeds. Erena et al. [60] proposed a method to create updated capacity curvesfor 21 reservoirs of the Segura River Basin (Spain). Their study integrated bathymetricmeasurements acquired using an Unmanned Surface Vehicle (USV) and an UnmannedUnderwater Vehicle (UUV) with a DSM generated from UAS imagery and airborne LiDARdata. Apart from evidencing a substantial silting in the reservoirs, this multiplatformmethodology demonstrated being more efficient than the traditional methods.
UAS have also been used to deploy bathymetric measurement instruments such assonars. This is the case of the study by Bandini et al. [61], who measured accurate waterdepths in lakes and rivers of Denmark using a tethered floating sonar controlled by anUAS. This method, which enables to monitor dangerous or inaccessible areas, yieldedsignificantly accurate results (~2.1%) although some observational bias (attributed to thedependence of the sound wave speed on temperature, salinity, and pressure) was detected.In a U.S. reservoir, Álvarez et al. [62] implemented a novel bathymetric survey methodby merging two UAS-based sampling techniques; (i) a small UAS that propelled a miniboat equipped with a single-beam echosounder for surveying submerged topography indeeper waters and (ii) Sf M photogrammetry to cover shallower areas visible from the UASbut not detected by the echosounder. The UAS-Sf M data successfully complemented theechosounder survey and minimum depths from 0 to 5 cm were detected.
Remote Sens. 2021, 13, 1359 13 of 42
Finally, it should be noted that many studies on bathymetric reconstruction of shallowstreams and reservoirs proved that models derived from high resolution UAS data aremore robust than previous models based on conventional methods, reducing inaccuraciesand biases, and enabling better hydraulic modeling performance [63–66].
4.2. Water Level Measurement and Water Storage
Albeit the temporal and spatial fluctuations of water stored in rivers, lakes, reservoirsand wetlands are among the most important hydrologic observations, the current knowl-edge of these variables is still considerably improvable, limiting our water managementand forecasting capacity. Water level measurements have been traditionally made withlimnimetric scales and limnigraphs, which despite being useful for determining waterstages, only provide information of very specific points in the water body. The translationof water levels into stored volumes can be complicated and give imprecise results. Inthis regard, achieving a better understanding of these processes and reliable hydrologicpredictions require accurate observations of several variables, such as surface water area,water level elevation, slope and temporal changes [67]. In this context, UAS are playing akey role in quantitatively characterizing and monitoring water level and their usefulnesshas been demonstrated in recent works. For instance, UAS allow to retrieve data frominaccessible environments and to overcome the disadvantages of traditional static sensors,which can be deployed in limited numbers and imply higher personnel and maintenancecosts. UAS imagery has been used to obtain rapid observations of water level fluctuationsin large-scale hydrological systems such as reservoirs. Ridolfi and Manciola [68] proposed asensing platform that allowed to measure the water level and collect hydraulic informationduring adverse operation conditions such as floods. Water level in a dam was retrievedfrom the combination of UAS-based RGB imagery and optical methods based on groundcontrol points and edge detectors. Their results were promising and proved the suitabilityof the platform for hydraulic measurement acquisition, however, the pixelization of theimages and the perspective constituted an important source of uncertainty. Gao et al. [69]devised an innovative methodology that integrated UAS photogrammetry and imagerecognition to define water level in a complex hydrological environment (plunge pooldownstream a hydropower station) in China. Water surface fluctuations were captured byan UAS and the regions of interest were extracted from imagery. The relationship betweenimage pixel scale and actual spatial scale, the real water surface elevation and fluctuations,as well as the maximum, average and minimum water levels were obtained applyingspecific calibration coefficients. The method was successfully implemented and offeredreliable results that back its potential to monitor water level.
The water level in rivers and lakes was estimated in [70] using three types of sensors(radar, sonar and a camera-based laser distance sensor) capable of measuring the range towater surface onboard lightweight UAS. Water surface level was calculated by subtractingthe range measured by the sensors from the vertical position retrieved by the onboardGNSS receiver. The radar offered the best results in terms of accuracy (0.5% of the range)and longest maximum range (60 m), whereas the sonar was more appropriate for stableand low flight altitude. The laser system gave less accurate results but proved to be usefulfor narrow fields of view. This system proved that water level measurements acquiredwith ranging sensors and GNSS receivers can provide more accuracy than spaceborne orairborne altimetry. In a more recent work, ref. [71] retrieved water surface elevation (WSE)measurements in very small vegetated streams (1–2 m wide) using a drone-based radaraltimetry solution with full waveform analysis. The water surface elevations measurementsprovided by this system were one order of magnitude better than those obtained fromLiDAR or photogrammetry. Following a similar approach, Jiang et al. [72] deployed a UAS-based radar altimetry system to map spatially distributed WSE in a small vegetated streamand subsequently used the dataset obtained to calibrate and validate roughness parametersin hydrodynamic models. UAS altimetry delivered WSE observations with 3 cm accuracyand 0.5 m resolution and could identify significant variations of the Manning–Strickler
Remote Sens. 2021, 13, 1359 14 of 42
coefficients over time. The study demonstrated that UAS-borne WSE constitutes a usefultool to understand the variations of hydraulic roughness. In order to assess the usefulness ofvarious UAS geospatial products in water body recognition, Tymkow et al. [73] combineddata from UAS-based laser scanner, thermal infrared and RGB imagery to estimate thewater extent of several rivers and lakes. According to their results, the most suitable productin water body detection was four bands RGB + TIR (Thermal InfraRed) orthomosaic,achieving an average kappa coefficient above 0.9.
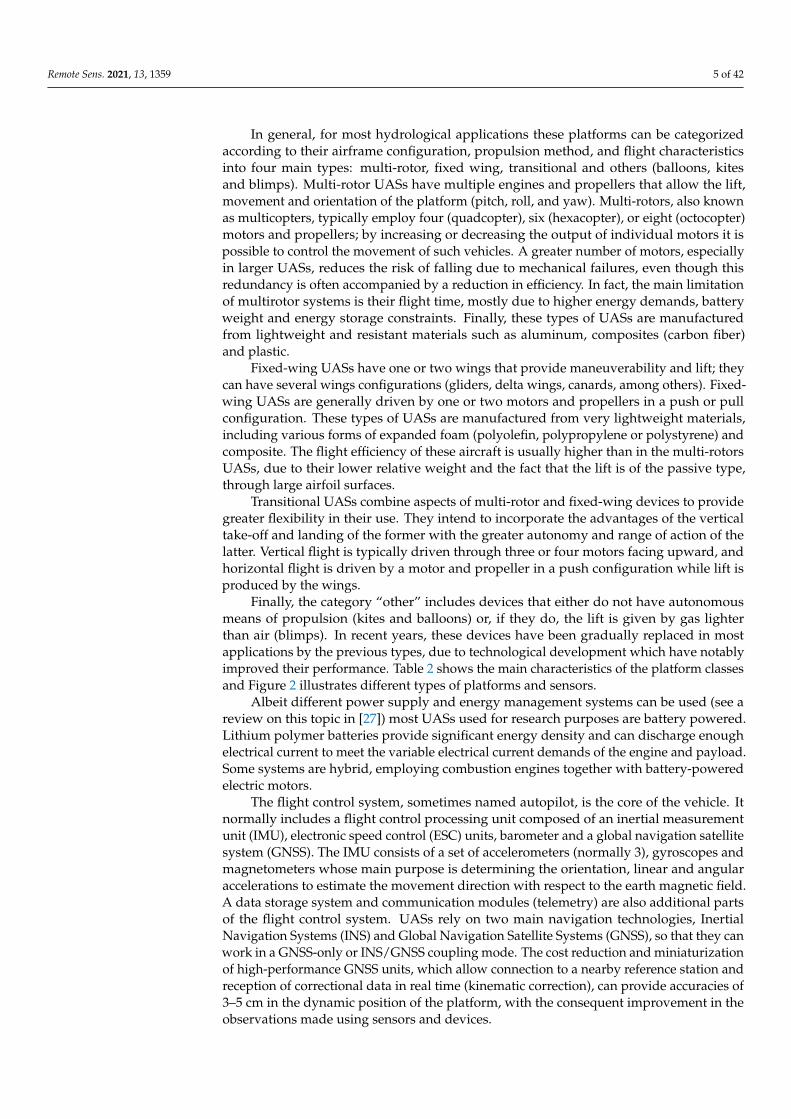
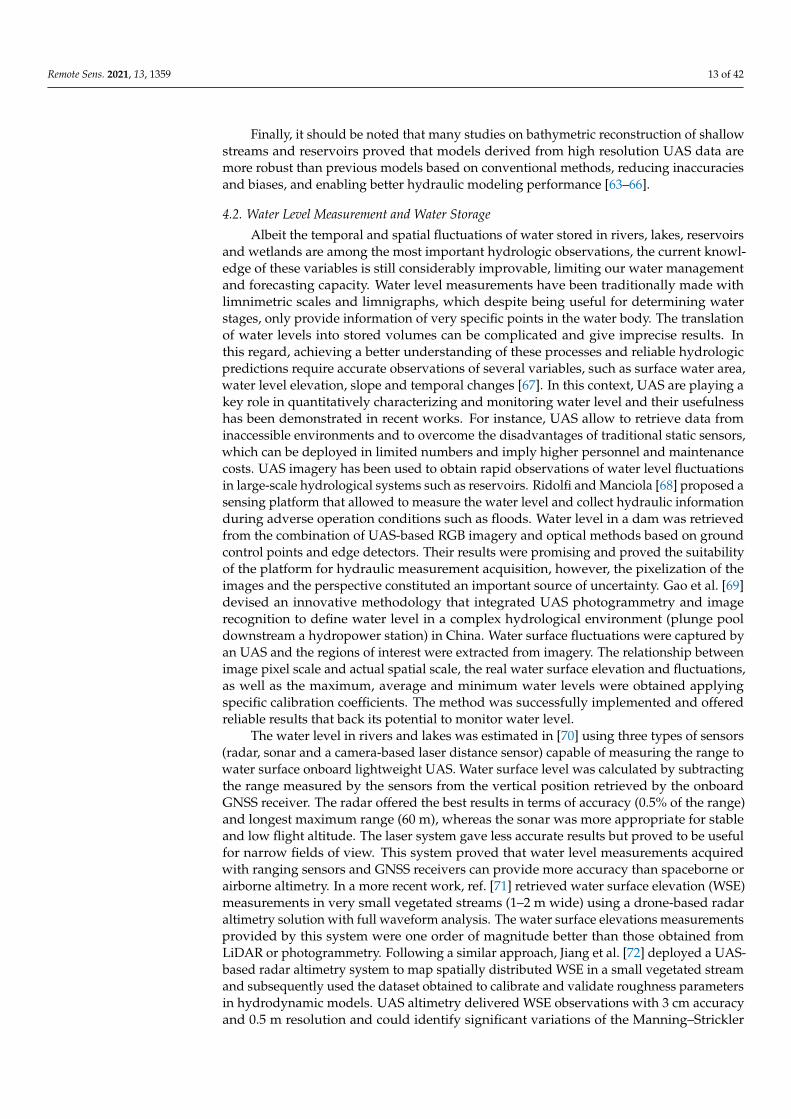
On the other hand, Sf M is currently offering promising results in the reconstructionof free water surfaces. The potential innovative applications of this technique have beenhighlighted in several recent works. Niedzielski et al. [74] observed the water stages inthe Scinawka river (SW Poland) by combining UAS RGB imagery and Sf M algorithms togenerate multitemporal orthophotomaps without using ground control points. The authorsdetected statistically significant increments in water surface areas between orthophotomapsusing asymptotic and bootstrapped versions of the Student’s t-test. This approach provedto be effective in detecting statistically significant transitions produced by all characteristicwater levels, from low and mean, to high stages, and can be used to verify hydrodynamicmodels, monitor the water level in ungauged basins and predict high flows. A methodologyto estimate the water storage in seasonal ponds is provided by García-López et al. [75](Figure 4). The authors defined the geometry of a coastal wetland’s basin in pre-floodconditions via UAS photogrammetry and Sf M techniques. The DEM generated allowed aspatial resolution of 6.9 cm and a mean squared error in Z of 5.9 cm with a practically nil biasand resulted an order of magnitude better than the pre-existing official LiDAR cartographicproducts. Although the effect of vegetation on the DEM was the main obstacle to theapplication of this method and it had to be minimized through spectral and morphologicaltechniques, as a whole, this approach proved to be useful for calculating the water balancein this type of systems.
Remote Sens. 2021, 13, 1359 14 of 43
On the other hand, SfM is currently offering promising results in the reconstruction of free water surfaces. The potential innovative applications of this technique have been highlighted in several recent works. Niedzielski et al. [74] observed the water stages in the Scinawka river (SW Poland) by combining UAS RGB imagery and SfM algorithms to gen-erate multitemporal orthophotomaps without using ground control points. The authors detected statistically significant increments in water surface areas between orthophoto-maps using asymptotic and bootstrapped versions of the Student’s t-test. This approach proved to be effective in detecting statistically significant transitions produced by all char-acteristic water levels, from low and mean, to high stages, and can be used to verify hy-drodynamic models, monitor the water level in ungauged basins and predict high flows. A methodology to estimate the water storage in seasonal ponds is provided by García-López et al. [75] (Figure 4). The authors defined the geometry of a coastal wetland’s basin in pre-flood conditions via UAS photogrammetry and SfM techniques. The DEM gener-ated allowed a spatial resolution of 6.9 cm and a mean squared error in Z of 5.9 cm with a practically nil bias and resulted an order of magnitude better than the pre-existing official LiDAR cartographic products. Although the effect of vegetation on the DEM was the main obstacle to the application of this method and it had to be minimized through spectral and morphological techniques, as a whole, this approach proved to be useful for calculating the water balance in this type of systems.
Figure 4. Prediction of the flooded area according to different water levels ((a) 1.80, (b) 1.90, (c) 2.00 and (d) 2.20 m with respect to the mean sea level) from UAS-derived DEM. Modified from [75].
To identify the river stages along the Kilim river (Malaysia), Mohamad et al. [76] generated DSM and orthomosaics for different tidal phases through the combination of UAS-based photogrammetry, GNSS vertical data and the use of the SfM algorithm. Alt-hough the study achieved a limited vertical precision, it may be useful for future works on water level measurement in estuaries and systems influenced by tides. SfM techniques have also been employed in the mining field by Yucel et al. [77] to analyze the areal changes and evolution of lakes originated by acid mine drainage. More recently, Chen et al. [45] developed a ground-filtering method to remove the effect of vegetation in wet-land´s water budget estimations, thus improving the DEM obtained from UAS photo-grammetry. Their approach comprised the combination of airborne LiDAR products with UAS LiDAR, UAS photogrammetric surveys and the application of a linear-weighted-av-erage filter to generate a filtered DEM where the vegetation interference in the bathymet-ric data was reduced. The ground-filtered DEM showed a 90% correlation with in situ measurements, diminished the errors in water balance and reduced the uncertainties in the results.
4.3. Surface Velocity and Flow Estimations Runoff and river discharge constitute a fundamental element of the water balance
and is of critical importance for the sustainable management of water resources, freshwa-ter ecosystems integrity and flood forecasting, among others. Although river discharge is one of the most accurately measured components of the hydrological cycle, the access to
Figure 4. Prediction of the flooded area according to different water levels ((a) 1.80, (b) 1.90, (c) 2.00 and (d) 2.20 m withrespect to the mean sea level) from UAS-derived DEM. Modified from [75].
To identify the river stages along the Kilim river (Malaysia), Mohamad et al. [76]generated DSM and orthomosaics for different tidal phases through the combinationof UAS-based photogrammetry, GNSS vertical data and the use of the Sf M algorithm.Although the study achieved a limited vertical precision, it may be useful for future workson water level measurement in estuaries and systems influenced by tides. Sf M techniqueshave also been employed in the mining field by Yucel et al. [77] to analyze the areal changesand evolution of lakes originated by acid mine drainage. More recently, Chen et al. [45]developed a ground-filtering method to remove the effect of vegetation in wetland´swater budget estimations, thus improving the DEM obtained from UAS photogrammetry.Their approach comprised the combination of airborne LiDAR products with UAS LiDAR,UAS photogrammetric surveys and the application of a linear-weighted-average filter togenerate a filtered DEM where the vegetation interference in the bathymetric data wasreduced. The ground-filtered DEM showed a 90% correlation with in situ measurements,diminished the errors in water balance and reduced the uncertainties in the results.
Remote Sens. 2021, 13, 1359 15 of 42
4.3. Surface Velocity and Flow Estimations
Runoff and river discharge constitute a fundamental element of the water balance andis of critical importance for the sustainable management of water resources, freshwaterecosystems integrity and flood forecasting, among others. Although river discharge isone of the most accurately measured components of the hydrological cycle, the accessto this information remains limited. The reasons are that large extensions of river basinsaround the globe are still poorly gauged or even ungauged [78], the decline in hydrometricstations, the gaps in datasets, the need for improved methods for the storage, retrieval andprocessing of hydrometric information [79].
Traditionally, discharge measurements have been carried out through direct andindirect methods. The first consist of the definition of the river section and flow velocitywith mechanical current-meters, ADCP, tracers, etc. Indirect methods are based on themeasurement of water surface level at gauging stations, which provide flow estimationsthrough rating curves. Remote sensing and satellite altimetry on the other hand, has beenwidely used to successfully calculate river discharge in well-known large rivers of theworld [80,81]. However, this methodology is less suitable for medium/small rivers andpresents limitations related to the measurement of the average flow velocity and slope,the need of calibration with in situ measurements, poor spatial and temporal resolutionand other issues. In this line, UAS have been increasingly used in the estimation of riverdischarge and flow as they overcome the handicaps of satellite remote sensing and presentsome advantages over it in terms of data accuracy.
Some authors propose the combined use of UAS with traditional hydrological for-mulas to calculate river discharge in ungauged areas. Yang et al. [82] calculated the riverdischarge in ten sections in the Tibetan Plateau and Province of Xinjiang by (i) retrieving theparameters of the slope-area method using an UAS to generate a digital orthophoto mapand a DSM and (ii) applying three different formulas (Manning–Strickler, Saint-Venant andDarcy–Weisbach). In Yang et al. [83], UAS remote sensing, high altitude remote sensingand in situ measurements are combined to estimate river flow in medium/small wideshallow rivers in arid areas. The attenuation coefficient and discharge of the ungaugedHotan river (Central Asia) was calculated by applying energy equations and a trapezoidalcross-section discharge equation. Similarly, UAS-borne data were used to verify the riversection morphology through orthophotomaps and a DSM, reaching a centimeter levelaccuracy. Both studies proved the usefulness of UAS for carrying out rapid river dischargeassessments and provide relevant hydrological data in poorly gauged or ungauged sys-tems. Lou et al. [84] integrated UAS and satellite remote sensing (Gaofen-2, SPOT-5, andSentinel-2) with the application of hydrological formulas (Manning–Strickler) to obtainaccurate discharge values from 24 ungauged rivers in the Tibetan Plateau on a long termscale, extending the previously mentioned works.
In addition, the monitoring of surface velocity has been addressed through UAS-basedvideos and the application of particle tracking velocimetry methods using natural andartificial tracers. Koutalakis et al. [85] compared the results obtained from the analysisof UAS imagery with 3 specific software based on different velocimetry methods: large-scale particle image velocimetry (LSPIV), large scale particle tracking velocimetry (LSPTV)and space-time image velocimetry (STIV). Although the three methods displayed similartrends, the surface velocity values differed slightly in some vegetated parts of the riverreach and the authors point out the need for verification. Similarly, ref. [86] used UAS-borne imagery to evaluate the sensitivity of 5 image velocimetry algorithms under lowflow conditions and concluded that, for surface velocities of approximately 0.12 m/s,image velocimetry techniques can provide results comparable to traditional techniquessuch as ADCPs. Tauro et al. [87] presented a custom-built UAS platform equipped with aground-facing orthogonal camera that did not require image orthorectification, to monitorthe surface flow through LSPIV in a natural stream. This low-cost system expands theuse of traditional fixed cameras employed in particle velocimetry by enabling access tootherwise inaccessible areas. Tauro et al. [88] assessed the suitability of a low cost UAS
Remote Sens. 2021, 13, 1359 16 of 42
for creating accurate surface flow maps of small-scale streams. After calibration, flowvelocity maps were extracted from the motion of stream floaters at real-time by applyingthe LSPIV high-speed cross-correlation algorithm. Similarly, ref. [89] integrated LSPIV andUAS imagery and compared the discharge values obtained with that from other methods,such as a fixed camera, ADCP, stream gauges and a propeller meter. The authors alsoreport the minimum steps required to produce accurate LSPIV measurements using UAS.
Despite its many advantages, the accuracy of the image velocimetry method is con-ditioned by several factors such as seeding density, the environmental and experimentalsetting conditions or the presence of floating materials on the stream surface. In this re-gard, ref. [90] used high-definition UAS footage to test the precision of LSPIV and particletracking velocimetry methods under different seeding and hydrological conditions. Theauthors demonstrated that seeding density, dispersion index and the spatial variance oftracer dimension are statistically relevant metrics in the estimation of velocity and that aprior knowledge of seeding conditions can be useful for selecting the processing intervals,image velocimetry techniques to apply and for controlling the accuracy of results.
Time series of temperature images have also been used for estimating surface flowvelocities. Kinzel and Legeiter [43] proposed a methodology to estimate river dischargethrough the combination of thermal velocimetry and scanning polarizing LiDAR, bothUAS-based. The velocity of surface features, expressed as small differences in temperature,was tracked with a particle image velocimetry algorithm. The system was able to detect themovement of flow features expressed as subtle differences in temperature, with velocitymeasurements that agreed closely with that made in situ. However, depths inferred fromthe LiDAR showed less agreement with in situ measurements in the deeper sections of theriver. Another innovative approach was proposed by Thumser et al. [91] who measuredreal-time river velocity using floating, infrared light-emitting particles and a color visionsensor onboard a UAS to track the position of objects. The system, termed by the authorsas RAPTOR-UAV, enabled to capture large-scale, nonstationary regions of the velocity fieldwhere the flow fields are persistent and chaotic. Recently, remote sensing of surface velocityand river discharge has been addressed in [92] through UAS-based doppler radars yieldingresults comparable to conventional streamgaging if cross-sectional area is available.
4.4. Flood Monitoring
Floods are among the most important driving forces in fluvial environments. Theseperiodic events not only reshape floodplain landscape and riverbeds, but also contributeto basin connectivity facilitating the exchange of water, sediments, organic matter, andnutrients between rivers, floodplains, and riparian wetlands. However, floods can also havedramatic impacts on human societies, causing economic damage, health issues, and loss ofhuman life, infrastructures and productive land. For this reason, gathering information onflooding conditions and dynamics and determining the extent of floods at different scalesis crucial for predicting and mitigating the impact of this natural hazard. Over severaldecades, flood hazard assessment and inundation mapping has been addressed throughthe use of satellite remote sensing. Nowadays, UAS provide very high-resolution imageryon-demand and are being increasingly used in geohazard studies and monitoring.
UAS-based photography has been extensively used to acquire data in inaccessiblelocations and create high resolution DEMs, map flood-prone areas and to enhance hydraulicmodeling [93–97]. In particular, Sf M techniques have seen a strong development as analternative approach to classical digital photogrammetry in the study of floods, leading toan increasing body of literature in the last years; Özcan and Özcan [98] extracted a high-resolution DEM of a flood-vulnerable river in Turkey applying UAS-based SfM. Landformalterations due to erosion and deposition after flood events were analyzed through theapplication of DEM of difference algorithm (DoD) and geomorphic change detection(GCD) techniques. After a 2-year monitoring period, the authors verified that UAS Sf Mand DoD were useful tools for geomorphological dynamic mapping and flood eventmonitoring. Diakakis et al. [99] investigated one of the most devastating floods occurred
Remote Sens. 2021, 13, 1359 17 of 42
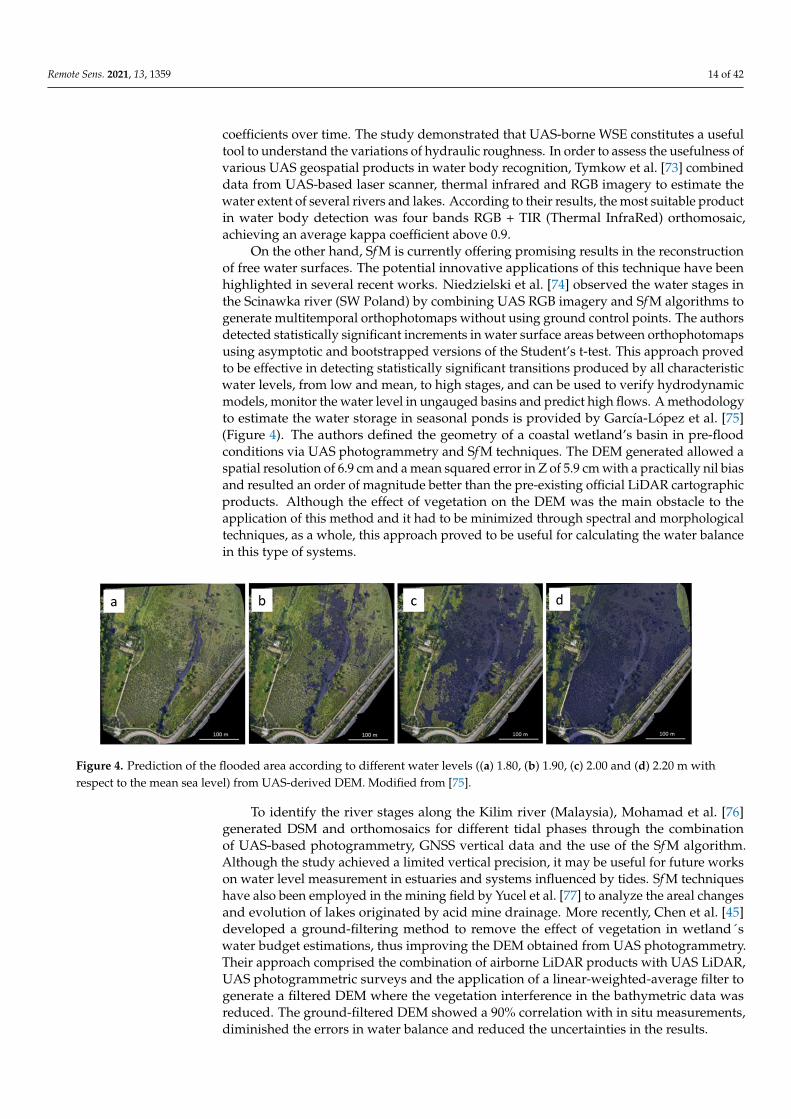
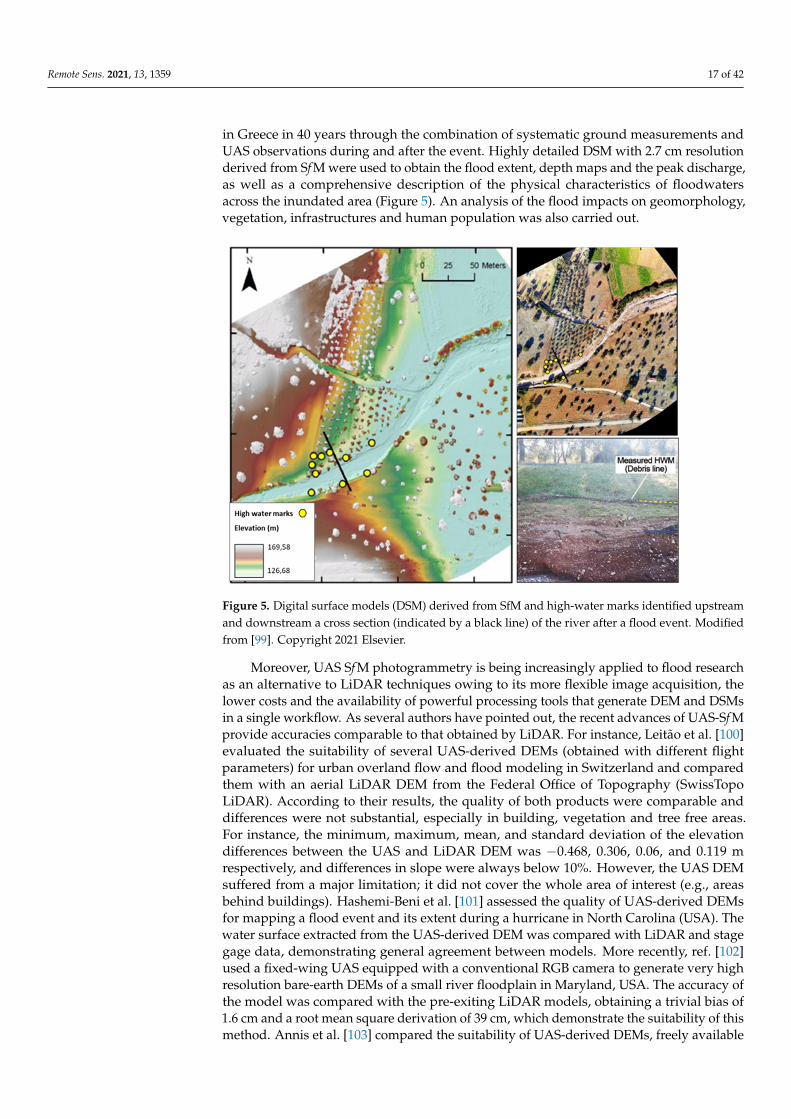
in Greece in 40 years through the combination of systematic ground measurements andUAS observations during and after the event. Highly detailed DSM with 2.7 cm resolutionderived from Sf M were used to obtain the flood extent, depth maps and the peak discharge,as well as a comprehensive description of the physical characteristics of floodwatersacross the inundated area (Figure 5). An analysis of the flood impacts on geomorphology,vegetation, infrastructures and human population was also carried out.
Remote Sens. 2021, 13, 1359 17 of 43
and UAS observations during and after the event. Highly detailed DSM with 2.7 cm reso-lution derived from SfM were used to obtain the flood extent, depth maps and the peak discharge, as well as a comprehensive description of the physical characteristics of flood-waters across the inundated area (Figure 5). An analysis of the flood impacts on geomor-phology, vegetation, infrastructures and human population was also carried out.
Figure 5. Digital surface models (DSM) derived from SfM and high-water marks identified up-stream and downstream a cross section (indicated by a black line) of the river after a flood event. Modified from [99]. Copyright 2021 Elsevier.
Moreover, UAS SfM photogrammetry is being increasingly applied to flood research as an alternative to LiDAR techniques owing to its more flexible image acquisition, the lower costs and the availability of powerful processing tools that generate DEM and DSMs in a single workflow. As several authors have pointed out, the recent advances of UAS-SfM provide accuracies comparable to that obtained by LiDAR. For instance, Leitão et al. [100] evaluated the suitability of several UAS-derived DEMs (obtained with different flight parameters) for urban overland flow and flood modeling in Switzerland and com-pared them with an aerial LiDAR DEM from the Federal Office of Topography (Swis-sTopo LiDAR). According to their results, the quality of both products were comparable and differences were not substantial, especially in building, vegetation and tree free areas. For instance, the minimum, maximum, mean, and standard deviation of the elevation dif-ferences between the UAS and LiDAR DEM was −0.468, 0.306, 0.06, and 0.119 m respec-tively, and differences in slope were always below 10%. However, the UAS DEM suffered from a major limitation; it did not cover the whole area of interest (e.g., areas behind build-ings). Hashemi-Beni et al. [101] assessed the quality of UAS-derived DEMs for mapping a flood event and its extent during a hurricane in North Carolina (USA). The water surface extracted from the UAS-derived DEM was compared with LiDAR and stage gage data, demonstrating general agreement between models. More recently, [102] used a fixed-wing UAS equipped with a conventional RGB camera to generate very high resolution bare-earth DEMs of a small river floodplain in Maryland, USA. The accuracy of the model was compared with the pre-exiting LiDAR models, obtaining a trivial bias of 1.6 cm and a root mean square derivation of 39 cm, which demonstrate the suitability of this method. Annis et al. [103] compared the suitability of UAS-derived DEMs, freely available large-scale DEM and LiDAR DEMs for flood modeling in small basins. The authors proved that
Figure 5. Digital surface models (DSM) derived from SfM and high-water marks identified upstreamand downstream a cross section (indicated by a black line) of the river after a flood event. Modifiedfrom [99]. Copyright 2021 Elsevier.
Moreover, UAS Sf M photogrammetry is being increasingly applied to flood researchas an alternative to LiDAR techniques owing to its more flexible image acquisition, thelower costs and the availability of powerful processing tools that generate DEM and DSMsin a single workflow. As several authors have pointed out, the recent advances of UAS-Sf Mprovide accuracies comparable to that obtained by LiDAR. For instance, Leitão et al. [100]evaluated the suitability of several UAS-derived DEMs (obtained with different flightparameters) for urban overland flow and flood modeling in Switzerland and comparedthem with an aerial LiDAR DEM from the Federal Office of Topography (SwissTopoLiDAR). According to their results, the quality of both products were comparable anddifferences were not substantial, especially in building, vegetation and tree free areas.For instance, the minimum, maximum, mean, and standard deviation of the elevationdifferences between the UAS and LiDAR DEM was −0.468, 0.306, 0.06, and 0.119 mrespectively, and differences in slope were always below 10%. However, the UAS DEMsuffered from a major limitation; it did not cover the whole area of interest (e.g., areasbehind buildings). Hashemi-Beni et al. [101] assessed the quality of UAS-derived DEMsfor mapping a flood event and its extent during a hurricane in North Carolina (USA). Thewater surface extracted from the UAS-derived DEM was compared with LiDAR and stagegage data, demonstrating general agreement between models. More recently, ref. [102]used a fixed-wing UAS equipped with a conventional RGB camera to generate very highresolution bare-earth DEMs of a small river floodplain in Maryland, USA. The accuracy ofthe model was compared with the pre-exiting LiDAR models, obtaining a trivial bias of1.6 cm and a root mean square derivation of 39 cm, which demonstrate the suitability of thismethod. Annis et al. [103] compared the suitability of UAS-derived DEMs, freely available
Remote Sens. 2021, 13, 1359 18 of 42
large-scale DEM and LiDAR DEMs for flood modeling in small basins. The authors provedthat DEMs generated from UAS imagery significantly outperformed the large-scale DEM,and that drone-derived topography constitutes an appropriate alternative to LiDAR DEMs.
Another recent development in DEM generation methods is the combination of Sf Mand multi-view stereo (MVS) 3D reconstruction techniques. In a typical Sf M-based process,the application of MVS algorithms follows image matching and allows to generate dense 3Dpoint clouds from large sets of images. Villanueva et al. [104] assessed the DEM accuracyachieved from a Sf M-MVS processing chain using LiDAR-derived control points andcompared the estimations of flood volume and area obtained from UAS and LiDAR data.The authors concluded that UAS based DEMs were as accurate as LiDAR DEMs.
Reconstruction of flood episodes is also crucial to better evaluate and prevent potentialrisks in the future, being thus necessary precise information on flood extents, flow peaks,depths as well as on factors that might worsen the outcomes of the event. High resolutionpre- and post-flood topographic data and UAS-derived ortho-imagery (4–5 cm/pixel)were employed by [105] to analyze three-dimensional morphodynamic changes associatedwith an extreme flood event in the Elbow River (Canada). Subsequently, geomorphicchanges were assessed using the DEMs and their relationship with flow conditions were an-alyzed with a 2D hydrodynamic model. The authors documented large elevation changes,widespread bank erosion and channel widening after the flood and highlighted potentialrelationships between flood forces and geomorphic change. Abdelkader et al. [106] em-ployed an UAS as a platform for Lagrangian flood sensing. The aircraft dropped smalldisposable buoyant wireless sensors that were carried away by the flood and transmittedreal-time data that were used to map the extent of the inundated area. This method enabledaccurate estimations of local flood parameters and short-term forecast of flood propagation.
Computer vision techniques and machine learning have also been used to classifyremotely sensed imagery of flood events, e.g., [107] proposed a novel method for thedetection and segmentation of flooded areas based on texture and color analysis in adeep neural network. The system, supported by ground control stations and a fixed wingUAS for image acquisition, increased the accuracy of flooded area detection up to 99.12%.Gebrehiwot et al. [108] applied a deep learning approach based on convolutional neuralnetworks (CNN) to extract the flooded areas from UAS-borne (fixed wing and multicopter)RGB imagery. This method, implemented immediately after two hurricane events over3 flood-prone areas in the USA, yielded a highly accurate classification (97.5%) of theremotely sensed data. Jakovljevic et al. [109] generated flood risk maps from LiDAR andUAS-derived data through a novel methodology based on raw point cloud classificationand ground point filtering using neural networks. Flood risk assessment was calculated at12 different vertical water levels. Although the UAS-derived model was less accurate thanLiDAR and tended to overestimate the elevation, the overall approach met the accuracyrequired for flood mapping according to European Flood Directive standards.
In addition to the aforementioned applications, UASs constitute the most efficient andfastest tool for situational awareness in disaster management, not only providing accurateand spatially detailed hydrologic information during flooding events, but also enabling toidentify safe shelter points, detect stranded people and damaged properties and to definefuture action strategies [110,111].
Nevertheless, although UASs have demonstrated to be a very useful tool in floodmonitoring and delineation, they cannot substitute ground-truth measurements in thisfield since they cannot provide data on flood depth and the quality of the topographicproducts is compromised when the terrain is masked by vegetation or anthropogenicfeatures. This issue has been recently addressed by [112], who reconstructed the flashflood events of two ungauged ephemeral streams in Olympiada region (North Greece)through the combination of ground-based and UAS observations and hydraulic (HEC-RAS)with hydrological (SCS-CN) models. Although the comparison between the modeled andobserved flow extents showed a good performance of the hydraulic model, the modeled
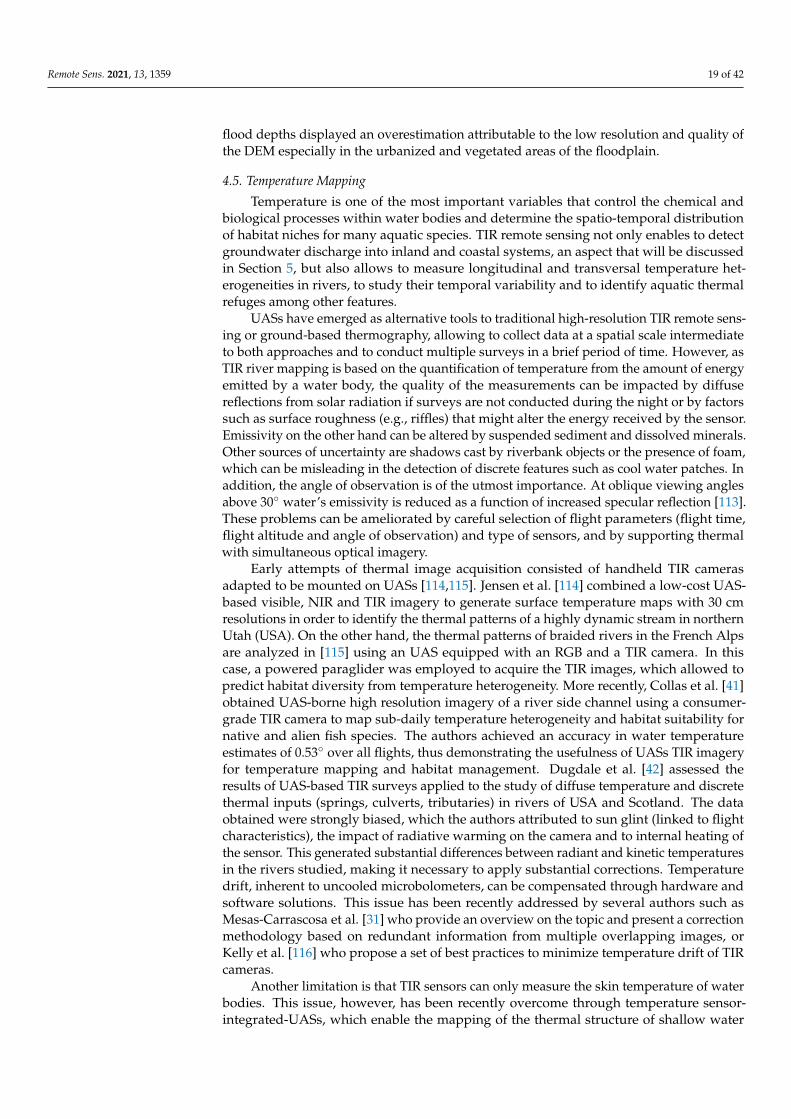
Remote Sens. 2021, 13, 1359 19 of 42
flood depths displayed an overestimation attributable to the low resolution and quality ofthe DEM especially in the urbanized and vegetated areas of the floodplain.
4.5. Temperature Mapping
Temperature is one of the most important variables that control the chemical andbiological processes within water bodies and determine the spatio-temporal distributionof habitat niches for many aquatic species. TIR remote sensing not only enables to detectgroundwater discharge into inland and coastal systems, an aspect that will be discussedin Section 5, but also allows to measure longitudinal and transversal temperature het-erogeneities in rivers, to study their temporal variability and to identify aquatic thermalrefuges among other features.
UASs have emerged as alternative tools to traditional high-resolution TIR remote sens-ing or ground-based thermography, allowing to collect data at a spatial scale intermediateto both approaches and to conduct multiple surveys in a brief period of time. However, asTIR river mapping is based on the quantification of temperature from the amount of energyemitted by a water body, the quality of the measurements can be impacted by diffusereflections from solar radiation if surveys are not conducted during the night or by factorssuch as surface roughness (e.g., riffles) that might alter the energy received by the sensor.Emissivity on the other hand can be altered by suspended sediment and dissolved minerals.Other sources of uncertainty are shadows cast by riverbank objects or the presence of foam,which can be misleading in the detection of discrete features such as cool water patches. Inaddition, the angle of observation is of the utmost importance. At oblique viewing anglesabove 30◦ water’s emissivity is reduced as a function of increased specular reflection [113].These problems can be ameliorated by careful selection of flight parameters (flight time,flight altitude and angle of observation) and type of sensors, and by supporting thermalwith simultaneous optical imagery.
Early attempts of thermal image acquisition consisted of handheld TIR camerasadapted to be mounted on UASs [114,115]. Jensen et al. [114] combined a low-cost UAS-based visible, NIR and TIR imagery to generate surface temperature maps with 30 cmresolutions in order to identify the thermal patterns of a highly dynamic stream in northernUtah (USA). On the other hand, the thermal patterns of braided rivers in the French Alpsare analyzed in [115] using an UAS equipped with an RGB and a TIR camera. In thiscase, a powered paraglider was employed to acquire the TIR images, which allowed topredict habitat diversity from temperature heterogeneity. More recently, Collas et al. [41]obtained UAS-borne high resolution imagery of a river side channel using a consumer-grade TIR camera to map sub-daily temperature heterogeneity and habitat suitability fornative and alien fish species. The authors achieved an accuracy in water temperatureestimates of 0.53◦ over all flights, thus demonstrating the usefulness of UASs TIR imageryfor temperature mapping and habitat management. Dugdale et al. [42] assessed theresults of UAS-based TIR surveys applied to the study of diffuse temperature and discretethermal inputs (springs, culverts, tributaries) in rivers of USA and Scotland. The dataobtained were strongly biased, which the authors attributed to sun glint (linked to flightcharacteristics), the impact of radiative warming on the camera and to internal heating ofthe sensor. This generated substantial differences between radiant and kinetic temperaturesin the rivers studied, making it necessary to apply substantial corrections. Temperaturedrift, inherent to uncooled microbolometers, can be compensated through hardware andsoftware solutions. This issue has been recently addressed by several authors such asMesas-Carrascosa et al. [31] who provide an overview on the topic and present a correctionmethodology based on redundant information from multiple overlapping images, orKelly et al. [116] who propose a set of best practices to minimize temperature drift of TIRcameras.
Another limitation is that TIR sensors can only measure the skin temperature of waterbodies. This issue, however, has been recently overcome through temperature sensor-integrated-UASs, which enable the mapping of the thermal structure of shallow water
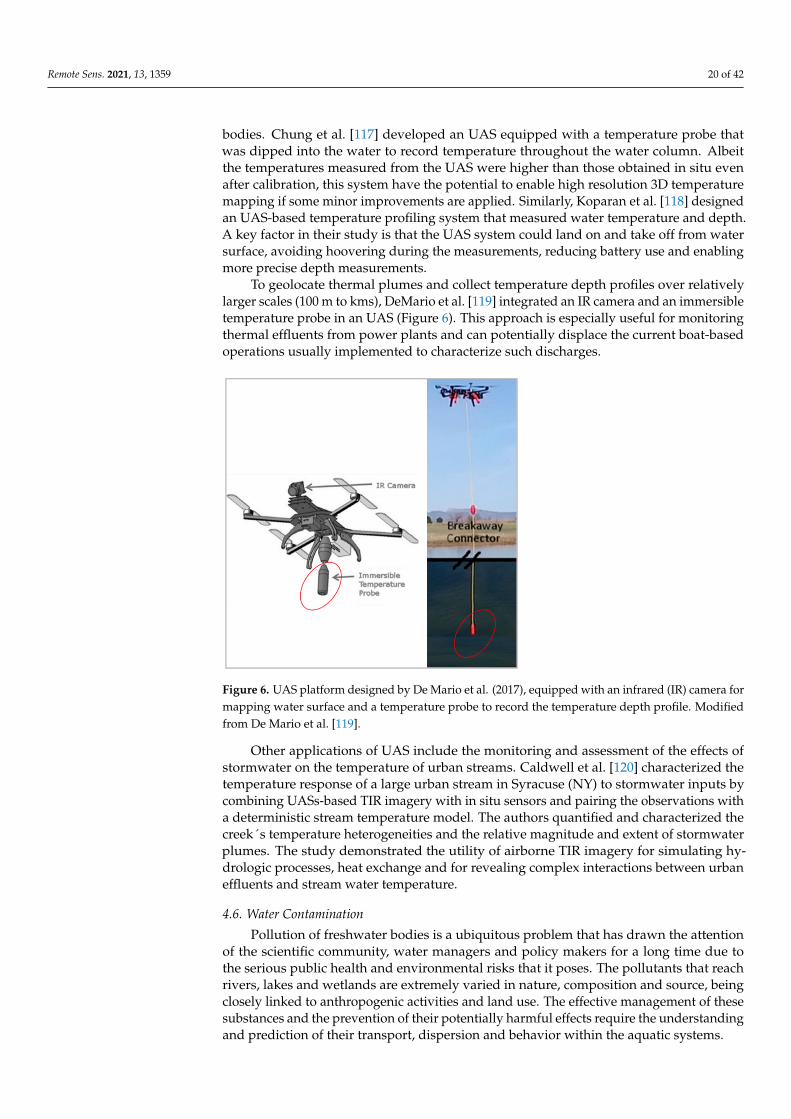
Remote Sens. 2021, 13, 1359 20 of 42
bodies. Chung et al. [117] developed an UAS equipped with a temperature probe thatwas dipped into the water to record temperature throughout the water column. Albeitthe temperatures measured from the UAS were higher than those obtained in situ evenafter calibration, this system have the potential to enable high resolution 3D temperaturemapping if some minor improvements are applied. Similarly, Koparan et al. [118] designedan UAS-based temperature profiling system that measured water temperature and depth.A key factor in their study is that the UAS system could land on and take off from watersurface, avoiding hoovering during the measurements, reducing battery use and enablingmore precise depth measurements.
To geolocate thermal plumes and collect temperature depth profiles over relativelylarger scales (100 m to kms), DeMario et al. [119] integrated an IR camera and an immersibletemperature probe in an UAS (Figure 6). This approach is especially useful for monitoringthermal effluents from power plants and can potentially displace the current boat-basedoperations usually implemented to characterize such discharges.
Remote Sens. 2021, 13, 1359 20 of 43
dipped into the water to record temperature throughout the water column. Albeit the temperatures measured from the UAS were higher than those obtained in situ even after calibration, this system have the potential to enable high resolution 3D temperature map-ping if some minor improvements are applied. Similarly, Koparan et al. [118] designed an UAS-based temperature profiling system that measured water temperature and depth. A key factor in their study is that the UAS system could land on and take off from water surface, avoiding hoovering during the measurements, reducing battery use and enabling more precise depth measurements.
To geolocate thermal plumes and collect temperature depth profiles over relatively larger scales (100 m to kms), DeMario et al. [119] integrated an IR camera and an immers-ible temperature probe in an UAS (Figure 6). This approach is especially useful for moni-toring thermal effluents from power plants and can potentially displace the current boat-based operations usually implemented to characterize such discharges.
Figure 6. UAS platform designed by De Mario et al. (2017), equipped with an infrared (IR) camera for mapping water surface and a temperature probe to record the temperature depth profile. Mod-ified from De Mario et al. [119].
Other applications of UAS include the monitoring and assessment of the effects of stormwater on the temperature of urban streams. Caldwell et al. [120] characterized the temperature response of a large urban stream in Syracuse (NY) to stormwater inputs by combining UASs-based TIR imagery with in situ sensors and pairing the observations with a deterministic stream temperature model. The authors quantified and characterized the creek´s temperature heterogeneities and the relative magnitude and extent of storm-water plumes. The study demonstrated the utility of airborne TIR imagery for simulating hydrologic processes, heat exchange and for revealing complex interactions between ur-ban effluents and stream water temperature.
4.6. Water Contamination Pollution of freshwater bodies is a ubiquitous problem that has drawn the attention
of the scientific community, water managers and policy makers for a long time due to the serious public health and environmental risks that it poses. The pollutants that reach riv-ers, lakes and wetlands are extremely varied in nature, composition and source, being closely linked to anthropogenic activities and land use. The effective management of these substances and the prevention of their potentially harmful effects require the understand-ing and prediction of their transport, dispersion and behavior within the aquatic systems.
Figure 6. UAS platform designed by De Mario et al. (2017), equipped with an infrared (IR) camera formapping water surface and a temperature probe to record the temperature depth profile. Modifiedfrom De Mario et al. [119].
Other applications of UAS include the monitoring and assessment of the effects ofstormwater on the temperature of urban streams. Caldwell et al. [120] characterized thetemperature response of a large urban stream in Syracuse (NY) to stormwater inputs bycombining UASs-based TIR imagery with in situ sensors and pairing the observations witha deterministic stream temperature model. The authors quantified and characterized thecreek´s temperature heterogeneities and the relative magnitude and extent of stormwaterplumes. The study demonstrated the utility of airborne TIR imagery for simulating hy-drologic processes, heat exchange and for revealing complex interactions between urbaneffluents and stream water temperature.
4.6. Water Contamination
Pollution of freshwater bodies is a ubiquitous problem that has drawn the attentionof the scientific community, water managers and policy makers for a long time due tothe serious public health and environmental risks that it poses. The pollutants that reachrivers, lakes and wetlands are extremely varied in nature, composition and source, beingclosely linked to anthropogenic activities and land use. The effective management of thesesubstances and the prevention of their potentially harmful effects require the understandingand prediction of their transport, dispersion and behavior within the aquatic systems.

Remote Sens. 2021, 13, 1359 21 of 42
4.6.1. Dispersion Processes
UAS technology is enabling the rapid filling of knowledge gaps in the transport ofpollutants and other hazardous agents while overcoming the difficulties inherent to in situmeasurements. Powers et al. [121] coordinately used an UAS and an USV to detect andtrack dye released in a reservoir. The UAS was used to capture videos and images of thedye plume and to provide visual navigation of the tracer for the pilot of the USV. The dyeconcentration measurements collected by the USV were compared with that from UASimagery, yielding similar results and demonstrating that processed images from UAS canbe used to predict dye concentrations near the water surface. Baek et al. [122] estimatedthe concentration of fluorescent dye in an open channel using UAS RGB imagery. Theauthors applied an artificial neural network (ANN) to establish the empirical relationshipsbetween the digital numbers in the images and the spatio-temporal distribution of dyeconcentration (Figure 7). Although the ANN models required simultaneous in situ mea-surements, the authors demonstrated the feasibility of generating accurate high-resolutiondye concentration maps with this novel and cost-effective approach.
Remote Sens. 2021, 13, 1359 21 of 43
4.6.1. Dispersion Processes UAS technology is enabling the rapid filling of knowledge gaps in the transport of
pollutants and other hazardous agents while overcoming the difficulties inherent to in situ measurements. Powers et al. [121] coordinately used an UAS and an USV to detect and track dye released in a reservoir. The UAS was used to capture videos and images of the dye plume and to provide visual navigation of the tracer for the pilot of the USV. The dye concentration measurements collected by the USV were compared with that from UAS imagery, yielding similar results and demonstrating that processed images from UAS can be used to predict dye concentrations near the water surface. Baek et al. [122] estimated the concentration of fluorescent dye in an open channel using UAS RGB im-agery. The authors applied an artificial neural network (ANN) to establish the empirical relationships between the digital numbers in the images and the spatio-temporal distri-bution of dye concentration (Figure 7). Although the ANN models required simultaneous in situ measurements, the authors demonstrated the feasibility of generating accurate high-resolution dye concentration maps with this novel and cost-effective approach.
Figure 7. Transport of the tracer cloud at t = 90 s, original UAS RGB image and dye concentration distribution at Section 2. Modified from [122]. Copyright 2021 Advances in Water Resources.
Legleiter [123] assessed the suitability of various types of remotely sensed data (field spectra, hyperspectral images from manned and unmanned aircraft, and high resolution digital aerial photography) to estimate concentrations of a visible tracer. The results showed that a broad range of visible wavelengths were strongly correlated with dye con-centration and therefore, tracer dispersion could be accurately mapped using RGB im-agery.
4.6.2. Plastic Pollution Similarly, the problem of plastic pollution in aquatic ecosystems has garnered wide-
spread public and scientific attention. The rampant proliferation of plastics has led to ex-plore the use of UAS in the evaluation and dynamics of plastics in the aquatic environ-ment and to the development of numerous works on this issue. Several authors such as [124–126] have explored methodologies for the monitoring and automatic quantification
Figure 7. Transport of the tracer cloud at t = 90 s, original UAS RGB image and dye concentrationdistribution at Section 2. Modified from [122]. Copyright 2021 Advances in Water Resources.
Legleiter [123] assessed the suitability of various types of remotely sensed data (fieldspectra, hyperspectral images from manned and unmanned aircraft, and high resolutiondigital aerial photography) to estimate concentrations of a visible tracer. The results showedthat a broad range of visible wavelengths were strongly correlated with dye concentrationand therefore, tracer dispersion could be accurately mapped using RGB imagery.
4.6.2. Plastic Pollution
Similarly, the problem of plastic pollution in aquatic ecosystems has garneredwidespread public and scientific attention. The rampant proliferation of plastics hasled to explore the use of UAS in the evaluation and dynamics of plastics in the aquaticenvironment and to the development of numerous works on this issue. Several authorssuch as [124–126] have explored methodologies for the monitoring and automatic quan-tification of anthropogenic marine debris based on UAS imagery and machine learning
Remote Sens. 2021, 13, 1359 22 of 42
techniques. It should be noted however, that most of these studies have been conducted inmarine and coastal environments and to date, only a few works focus on fluvial systems.Geraeds et al. [127] presented a novel methodology to quantify the floating riverine plastictransport in the Klang River, Malaysia. In order to make detailed cross-sectional plastictransport profiles, the authors conducted an aerial survey with flight transects perpendicu-lar to the river flow direction. The flight path was set up at three different altitudes relativeto the instantaneous water level. Depending on the altitude at which images were taken,they served different purposes. Although sudden changes in weather conditions can leadto a loss of accuracy in flight altitude, the authors documented similar plastic densitiesand transport profiles using UAS aerial surveys, visual observations and plastic sampling.Jakovljevic et al. [128] utilized high resolution orthophotos obtained from UAS and Sf Malgorithms to map floating plastics in rivers and lakes in Bosnia Herzegovina. The authorsdeveloped an end-to end semantic segmentation algorithm based on U-Net architecturethat enabled to accurately detect and classify 3 types of plastic (OPS, Nylon and PET) atdifferent spatial resolutions with an underestimation of the plastic area of only 3.4%. Morerecently, Hengstmann and Fischer [129] identified sources for plastics and influences ontheir distribution at four sandy bank border segments of Lake Tollense in Germany. Theycompared field-based observations with the results of anthropogenic litter detection viaUAS imagery and obtained good recovery rates when minimizing the flight height. Inaddition, the aerial images were used to test automatic and supervised image analysis todetect and classify plastics.
4.7. Harmful Algal Blooms (HABs) and Eutrophication
Harmful algae blooms (HABs) outbreaks are closely linked to anthropogenic eutroph-ication and have dramatically increased in the past three decades. HABs not only give riseto a rapid depletion of dissolved oxygen in water bodies and massive deaths of aquaticorganisms but can also pose a serious threat to human health owing to the production ofneurotoxins of some species [130]. As in other disciplines, HAB monitoring evolved fromexpensive and labor-intensive water sampling techniques to satellite monitoring. However,HABs are highly dynamic and their monitoring, even with high resolution satellite data,is not always suitable owing to their limited temporal resolution (large time intervalsbetween image re-acquisition). The quality of satellite images can be affected by weatherconditions, cloudiness and atmospheric absorption. Remote sensing from manned aircrafts,nevertheless, can provide high spatio-temporal resolutions but its implementation is costlyand usually limited by safety, logistical and operational issues. In this context, UAS offerthe flight flexibility, temporal and spatial resolution and rapid response needed to detectand monitor HAB dynamics with minimal environmental disturbance. Despite theseadvantages, since the development of UAS-based techniques and the commercialization ofsuitable sensors is very recent, the current number of studies focused on the study of HABswith UAS is limited. One of the applications given to UAS imagery has been the visualinspection of water bodies, e.g., [131] detected the beginning of eutrophication processand tracked the proliferation of ragweed in a small lake in Hungary using high resolutionphotography from two different models of fixed wing UAS and an hexacopter.
Other early works include the use of conventional cameras separately or in combinationwith NIR sensors to map water quality and quantify algae concentrations. Ngo et al. [132]studied the relationship between algae concentration and water color through the im-plementation of a regression model. A RGB camera mounted on an UAS was used tocapture videos and retrieve individual frames to subsequently extract the color componentvalues of green and blue pixels. Van der Merwe and Price [133] exploited the contrastbetween clear water and cyanobacteria in color-infrared imagery. The authors employedUAS equipped with modified cameras that captured NIR and blue wavelengths to quantifyalgae densities at water surface through the formulation of a parameter termed as “bluenormalized difference vegetation index”. Their work emphasizes the role of UAS remotesensing as a complement to traditional methods and the usefulness of drones when HABs
Remote Sens. 2021, 13, 1359 23 of 42
need to be characterized and tracked with a high spatio-temporal precision and accuracy.Su and Chou [134] utilized UAS RGB and NIR imagery and established regression modelsto find the best correlations between water quality parameters and band ratio in orderto map the trophic state of a small reservoir. The authors emphasized that, comparedwith traditional photogrammetry or satellite remote sensing techniques, UAS offer a bettercost/profit ratio in terms of reservoir mapping. Jang et al. [135] monitored HABs in oneof the largest rivers in South Korea and developed a modified Algal Bloom DetectionIndex that included the red band (625 nm) to better distinguish algal bloom from clearwater. Their study combined the use of UASs equipped with a S110 RGB camera and aNIR camera with in situ measurements of spectral reflectance and water quality analysis.Aguirre-Gómez et al. [136] combined UAS high-definition imagery with in situ radiometricmeasurements and algae sampling to conduct spatio-temporal analysis of the extensionand distribution of cyanobacteria in urban lakes of Mexico. Their approach included darkobject subtraction techniques in order to correct sun/sky glint errors and proved to be anaccurate, flexible and rapid method to detect and predict eutrophication and cyanobacterialblooms in reservoirs. Salarux and Kaewplang [137] employed UAS-derived RGB and NIRimagery to calculate vegetation indexes and assess their performance using mathematicalmodels (Figure 8). This approach proved to be useful for estimating algal biomass.
Remote Sens. 2021, 13, 1359 23 of 43
“blue normalized difference vegetation index”. Their work emphasizes the role of UAS remote sensing as a complement to traditional methods and the usefulness of drones when HABs need to be characterized and tracked with a high spatio-temporal precision and accuracy. Su and Chou [134] utilized UAS RGB and NIR imagery and established regression models to find the best correlations between water quality parameters and band ratio in order to map the trophic state of a small reservoir. The authors emphasized that, compared with traditional photogrammetry or satellite remote sensing techniques, UAS offer a better cost/profit ratio in terms of reservoir mapping. Jang et al. [135] moni-tored HABs in one of the largest rivers in South Korea and developed a modified Algal Bloom Detection Index that included the red band (625 nm) to better distinguish algal bloom from clear water. Their study combined the use of UASs equipped with a S110 RGB camera and a NIR camera with in situ measurements of spectral reflectance and water quality analysis. Aguirre-Gómez et al. [136] combined UAS high-definition imagery with in situ radiometric measurements and algae sampling to conduct spatio-temporal analysis of the extension and distribution of cyanobacteria in urban lakes of Mexico. Their ap-proach included dark object subtraction techniques in order to correct sun/sky glint errors and proved to be an accurate, flexible and rapid method to detect and predict eutrophica-tion and cyanobacterial blooms in reservoirs. Salarux and Kaewplang [137] employed UAS-derived RGB and NIR imagery to calculate vegetation indexes and assess their per-formance using mathematical models (Figure 8). This approach proved to be useful for estimating algal biomass.
Figure 8. Map of algae biomass. Modified from [137].
Since the recent development of the first lightweight hyperspectral cameras adapted to be mounted on UASs, the applications of this type of imagery have increased in numer-ous research fields, including algal bloom monitoring. Although hyperspectral sensors are still expensive, these are emerging as alternatives to conventional RGB and multispec-tral cameras owing to their improved capacity of quantifying water constituents and iden-tifying algal and phytoplankton groups species and genus by their spectral pigment ab-sorption. Some recent experiences using drone-borne hyperspectral imagery can be cited; in an early work, Honkavaara et al. [138] presented a promising water quality monitoring technique that combined small-manned vehicles and UAS equipped with a Fabry-Perot interferometer (FPI) hyperspectral camera. Becker et al. [139] deployed two different low-cost UAS configurations in a lake and a river to monitor water quality and assess potential
Figure 8. Map of algae biomass. Modified from [137].
Since the recent development of the first lightweight hyperspectral cameras adapted tobe mounted on UASs, the applications of this type of imagery have increased in numerousresearch fields, including algal bloom monitoring. Although hyperspectral sensors arestill expensive, these are emerging as alternatives to conventional RGB and multispectralcameras owing to their improved capacity of quantifying water constituents and identifyingalgal and phytoplankton groups species and genus by their spectral pigment absorption.Some recent experiences using drone-borne hyperspectral imagery can be cited; in anearly work, Honkavaara et al. [138] presented a promising water quality monitoringtechnique that combined small-manned vehicles and UAS equipped with a Fabry-Perotinterferometer (FPI) hyperspectral camera. Becker et al. [139] deployed two different low-cost UAS configurations in a lake and a river to monitor water quality and assess potentialalgal blooms in near-real time. UAS were equipped with hyperspectral radiometers tomeasure chlorophyll-a, cyanobacteria index, surface scums and suspended minerals. TheUAS spectral data presented a quality similar to that from ground based spectroradiometersand enabled the construction of transect maps of derived cyanobacterial index products that
Remote Sens. 2021, 13, 1359 24 of 42
showed the distribution of algae abundance in the systems. Penmetcha et al. [140] proposeda deep learning-based algae detector and a multi-robot system algae removal plannerintegrated by an UAS and a USV. More recently, Castro et al. [38] presented a multisensortool to monitor water quality in a Spanish reservoir affected by eutrophication. Theirapproach combined satellite, in situ data and multispectral UAS imagery to retrieve chl-aconcentrations, which indicates the trophic status of the system. The performance of thedifferent sensors, empirical models and band indices was evaluated. The authors concludedthat multi-platform and multi-sensor approaches have great potential for small reservoireutrophication monitoring. Kwon et al. [141] retrieved hyperspectral data from portableand drone-based sensors to develop bio-optical algorithms, measure the vertical pigment-concentration profile and map the distribution of phycocyanin in a deep reservoir. Thebio-optical algorithms implemented using UAS-based reflectance measurements performedslightly worse than those using in situ remote sensing. The authors point out that futurework should aim to improve remote-sensing algorithms through the identification of therelationship between pigment cumulation depth and light attenuation. Zhang et al. [142]mapped the concentration of eutrophication-related parameters in an urban river throughthe development of a self-adapting ANN based on UAS hyperspectral imagery and usingthe modified spectral reflectance of water measured with a ground-based analytical spectraldevice.
4.8. Water Sampling and In Situ Parameter Measurement
In addition to acquiring images, UAS are being increasingly used to take water sam-ples, as they eliminate sampling risks to humans and allow to reach otherwise inaccessiblelocations. These innovative sampling platforms reduce costs and efforts, increasing thespeed and range at which samples were traditionally obtained and allow to obtain undis-turbed samples when hoovered at an adequate height to avoid induced mixing due todownwash. Some of the first references on the use of these instruments date correspond toOre et al. [143] and Detweiler et al. [144], who designed a mechanism for sampling waterautonomously from an UAS. The system was able to collect 3 samples of 20 mL per missionand the properties of the water collected matched that from manual samples, proving theadequacy of this technique. Similar works on the use of UAS as water sampling tools canbe found in [145,146].
More recently, water sampling from UAS has gone a step further by including a widerange of sensors to conduct in situ measurements of different physical-chemical parameters.Song et al. [147] compared the reliability and effectiveness of UAS-based in situ physico-chemical measurements and water sampling with traditional and sensor-based methods.Although UAS enhance the reliability of data, there are still barriers to their full integra-tion in limnological studies; the drone´s maximum carrying capacity limits the numberand volume of samples, making these less representative of water chemistry comparedto manually collected samples. Elijah et al. [148] implemented a smart river monitoringsystem that included an UAS to collect water samples and was equipped with and arrayof sensors and probes. Koparan et al. [149] designed a lightweight hexacopter equippedwith a multiprobe system to measure temperature, electrical conductivity (EC), dissolvedoxygen (DO), and pH. To avoid hoovering, the platform had flotation elements to allowthe UAS to land on water surface at the waypoints in the flight mission. Esakki et al. [150]designed a UAS-based platform equipped with a robotic arm, a water pump and severalsensors to collect 500 mL water samples and conduct in situ measurements of water quality.The results gathered by this system were in close agreement with laboratory test, with a 98%accuracy. To take samples of DNA fragments from a reservoir, Doi et al. [151] developed anew method for water collection consisting of a UAS with an attachment for a 1-L waterbottle. The performance and contamination risk of the system was compared with thatof samples obtained by boat, yielding similar results. Banerjee et al. [152] developed anelectromechanical and pneumatic system to collect water samples from UAS, facilitatingthe access to inaccessible water bodies or dangerous mine sites and enabling the analysis of
Remote Sens. 2021, 13, 1359 25 of 42
several physical-chemical variables. Castendyk et al. [153] presented the first applicationof UASs for deep water sampling (up to 80 m) in pit lakes. Their system collected samplesusing Nisking sampler bottles and measured in situ the physical-chemical profiles of thewater body. Later, Castendyk et al. [154] built on this work and on similar experiences toassess the state-of-the-art of drone water sampling of pit lakes in North America and todemonstrate how UAS-derived profiles can be used to select optimal sampling depths.
The use of UAS is not restricted to HAB monitoring and detection; in recent years UAShave also been employed to counteract them. Jung et al. [155] developed an autonomousrobotic system to remove algal blooms that combined a catamaran-type USV instrumentedwith an electrocoagulation and flotation reactor with an UAS. The latter detected the HABsthrough an image-based algorithm and sent GPS coordinates to the USV for path planning.This method achieved a 98.3% of cyanobacteria removal.
Finally, the recent advances in technology have facilitated the creation of “multipur-pose drones” that apart from completing standard tasks such as the acquisition of videosand photos, can monitor and take samples in a variety of environments and situations.An example of multipurpose UAS is provided by Agarwal et al. [156] who designed aplatform capable of taking water samples, monitoring air and water quality in situ and thatincluded video recording functions. Similarly, in order to access to an extreme environmentsuch as the Lusi mud eruption in Indonesia, Di Stefano et al. [33] designed a multipurposeUAS. The platform was able to complete video surveys, high resolution photogrammetry,TIR mapping and was equipped with deployable thermometers and gas, mud and watersamplers. An UAS equipped with a hydrophilic with a lipophilic balance (HLB), thin-filmsolid-phase microextraction (TF-SPME) sampler was developed by Grandy et al. [157] toremotely screen a wide range of pollutants present in water bodies. Finally, a recent reviewon drones use for water sampling can be found in [158].
5. UAS Applications in Hydrogeology
The number of papers documenting the application of UAS to groundwater (GW) andaquifer research is rather scarce, especially if compared with the extensive literature dealingwith their use in riverine and oceanic environments. The reasons are the inherent limitationsof remote sensing and the very early stage in which the technological developments in thisfield are currently. The major constraint in GW detection and mapping is related to theinsufficient penetration capacity that remote sensing offers, only enabling the acquisitionof data at the ground surface or within shallow subsurface layers a few meters deep.Apart from geophysical techniques, ground-penetrating radar (GPR) is the only technologythat can survey depths of several meters. However, at present, owing to the mass, sizeand very high costs of these sensors, radars onboard UAS are still uncommon, and mostexperiences are restricted to applications such as landmine detection. Currently, sometechnological advances such as the Frequency Domain Electromagnetic (FDEM) methodallow to perform geophysical surveys from UASs. These are aimed at the detection ofunderground properties such as magnetism and resistivity, which can be subsequentlyrelated with the presence of groundwater and its characteristics (e.g., salinity). Nevertheless,this field is still to be developed in scientific terms.
On the other hand, the thermal inertia of groundwater emergence in coastal areas(SGD) and fluvial systems has been recently exploited to generate temperature mapsand monitor warm plumes by means of TIR-equipped UAS yielding promising results.Current available research on UASs applications in hydrogeology includes studies onsurface-groundwater (SW–GW) exchange flow, submarine groundwater discharge (SGD),piezometric level delimitation and subsidence processes associated to groundwater with-drawals.
5.1. Surface Water–Groundwater (SW–GW) Interactions
Surface water–groundwater (SW–GW) interactions are critical to calculate water bal-ances and sustainable levels of water extraction. These interactions have been traditionally
Remote Sens. 2021, 13, 1359 26 of 42
studied through an array of methods (e.g., differential gauging, seepage meters, tracerinjection experiments, monitoring of piezometric heads or satellite remote sensing) whoseselection depend on the temporal and spatial scale, limitations and uncertainties inherentto each technique. Recently, UAS have been implemented in SW–GW research since theyare the only tools that enable indirect observations of these processes with a sufficientlyhigh spatial resolution.
As several experiences have demonstrated, UAS-derived TIR imagery can provideuseful information on the size and extent of groundwater plumes emerging from springsand near streambanks, especially when the temperature contrast between SW and GWis marked. Abolt et al. [159] mapped thermal refugia associated with groundwater dis-charge in Devil´s river (Texas) using a small UAS equipped with an inexpensive uncooledmicrobolometer and proposed a method for stabilizing the resulting image mosaic andcompensating the pixel bias. This low-cost platform produced more consistent results thanthose obtained from a more expensive TIR camera system and allowed to generate highquality maps of surface temperature in riparian ecosystems.
TIR imagery has also been supported by optical products; Harvey et al. [160] evaluatedthe suitability of UAS equipped with lightweight TIR sensors to identify groundwaterdischarges and validate thermal refugia goals in a hydrological restored peatland. TIR,visible, and DSM products were compared to evaluate the landscape forms and thermalsignature of groundwater inflows. The authors detected substantial inflows of warmgroundwater that were visible along the restored channel, along with seepage areas,discrete seeps and thermally stable pools of ecological importance (Figure 9). This workemphasizes the usefulness of UAS-based TIR for mapping groundwater seeps in wetlandswith a spatial coverage that is unimpeded by site-access considerations. However, theapproach presents several limitations: Firstly, while the method proved to be effective in acontinental climate with cold winter conditions, it is less effective when applied in spring,autumn or in temperate to tropical climates as the temperature contrast between SW–GWis less evident and becomes quickly lost by surface mixing. Secondly, TIR sensors cannotpenetrate vegetation, meaning that surface waters may not always be visible becauseof foliage. Thirdly, shallow groundwater temperature can be similar to the mean annualsurface temperature, weakening the TIR images contrast. Casas-Mulet et al. [161] generatedhigh-resolution TIR and RGB orthomosaics to characterize cold water patches associatedwith groundwater inputs over a 95 km-long river section using simultaneous UAS flights.This method allowed to identify riverscape spatial patterns of temperature and to detectand classify these patches. Finally, UAS-based TIR has also been applied in the field ofmining by Rautio et al. [162]. The authors combined airborne and UAS TIR imagery toidentify SW–GW interactions for the planning and siting of mining facilities in order toprevent potential acid mine drainage pollution.
Other studies focused on SW–GW interactions rely on the combination of ground-based measurements, UAS photogrammetry and hydrologic modeling. Pai et al. [39]quantified sinuosity-driven GW-SW exchange in a river employing a suite of UAS-derivedproducts (water surface elevation, normalized difference vegetation index (NDVI) mapsand vegetation-top elevation distribution along meanders) and distributed in situ tempera-ture measurements. Sf M photogrammetry was used to generate a DSM that allowed toestimate the river gradient, the hydraulic gradient across the meander necks, river-reachtopography, and vegetation-top elevations. Compared with the surveyed ground controlpoints, the modeled surface presented a 3.8 cm mean absolute error (less than aerial LiDAR)and a precision of 2.5 cm. The NDVI maps obtained presented a resolution better than10 cm, enabling to document even individual plants. The combination of topographicanalysis with low-cost multispectral imaging enabled to identify GW shortcutting, whichoccurred through the necks of the meander bends, where hydraulic gradients were foundto be larger. Bandini et al. [163] evaluated the potential of spatially-distributed UASsobservations for improving hydrological models and in particular, estimates of GW-SWexchange flow. The authors simulated a river and its catchment using an integrated hydro-

Remote Sens. 2021, 13, 1359 27 of 42
logical model that was calibrated through 2 methods; first, against river discharge retrievedby in situ stations and the piezometric head of the aquifers and second, against densespatially distributed water level observations obtained with UASs. After calibration, thesharpness of the estimates of GW–SW time series improved by 50% using UASs and theroot mean square error decreased by R75% compared with the values provided by themodel calibrated against discharge only. Tang et al., [164] simulated a flood event withthe groundwater model HydroGeosphere to study the spatial and temporal variability ofriverbed topography and hydraulic conductivity on SW–GW exchange and groundwaterheads. The authors combined several state-of-the-art techniques; UAS-based photogram-metry, physically based measurements and the ensemble Kalman Filter. This combinationresulted in substantially improved hydrological predictions and enabled the estimationof river-aquifer fluxes. Briggs et al. [165] combined remote sensing with ground- anddrone-based measurements to characterize the enhancement of SW–GW interactions andchanges in water chemistry induced by beaver activity along two alluvial mountain streamsin USA. Several UAS were deployed to map the river corridor and beaver ponds and Sf Mtechniques were applied to generate time-specific digital elevation models of floodplainstructure and channel geomorphology. The UAS information was complemented withhistorical imagery, TIR data from handheld cameras and measurements of water quality(metals) and seepage associated to beaver pond return flows. The authors reported amulti-seasonal enhancement of the floodplain hydrologic connectivity and an increase ingroundwater storage associated with beaver activity. Furlan et al. [166] combined electri-cal resistivity tomography with UAS photogrammetry to map the topography, internalmorphology, water storage and hydrologic flow paths in a savanna wetland in Brazil.The authors used a fixed-wing UAS with a RGB sensor to obtain very high-resolutionimages and create an orthomosaic and a DSM for the relief analysis. The wetland wascompartmentalized and the area and volume of each sector calculated for the subsequenthydrological modeling. On the other hand, the geophysical surveys provided informationabout groundwater behavior and infiltration zone architecture and enabled to produce a2D inversion and a pseudo-3D model to visualize the subsurface geologic structure andhydrologic flow paths. The combined application of very high resolution UAS images andelectrical surveys allowed the authors to propose a broader hydrologic interpretation ofthe wetland functioning and to complete surface and subsurface imaging of the system.
Remote Sens. 2021, 13, 1359 27 of 43
Figure 9. Thermal infrared (TIR) imagery showing the diffuse and discrete warm groundwater inputs into the stream. Modified from [160].
Other studies focused on SW–GW interactions rely on the combination of ground-based measurements, UAS photogrammetry and hydrologic modeling. Pai et al., [39] quantified sinuosity-driven GW-SW exchange in a river employing a suite of UAS-de-rived products (water surface elevation, normalized difference vegetation index (NDVI) maps and vegetation-top elevation distribution along meanders) and distributed in situ temperature measurements. SfM photogrammetry was used to generate a DSM that al-lowed to estimate the river gradient, the hydraulic gradient across the meander necks, river-reach topography, and vegetation-top elevations. Compared with the surveyed ground control points, the modeled surface presented a 3.8 cm mean absolute error (less than aerial LiDAR) and a precision of 2.5 cm. The NDVI maps obtained presented a reso-lution better than 10 cm, enabling to document even individual plants. The combination of topographic analysis with low-cost multispectral imaging enabled to identify GW shortcutting, which occurred through the necks of the meander bends, where hydraulic gradients were found to be larger. Bandini et al. [163] evaluated the potential of spatially-distributed UASs observations for improving hydrological models and in particular, esti-mates of GW-SW exchange flow. The authors simulated a river and its catchment using an integrated hydrological model that was calibrated through 2 methods; first, against river discharge retrieved by in situ stations and the piezometric head of the aquifers and second, against dense spatially distributed water level observations obtained with UASs. After calibration, the sharpness of the estimates of GW–SW time series improved by 50% using UASs and the root mean square error decreased by R75% compared with the values provided by the model calibrated against discharge only. Tang et al., [164] simulated a flood event with the groundwater model HydroGeosphere to study the spatial and tem-poral variability of riverbed topography and hydraulic conductivity on SW–GW exchange and groundwater heads. The authors combined several state-of-the-art techniques; UAS-based photogrammetry, physically based measurements and the ensemble Kalman Filter. This combination resulted in substantially improved hydrological predictions and ena-bled the estimation of river-aquifer fluxes. Briggs et al. [165] combined remote sensing with ground- and drone-based measurements to characterize the enhancement of SW–GW interactions and changes in water chemistry induced by beaver activity along two alluvial mountain streams in USA. Several UAS were deployed to map the river corridor and beaver ponds and SfM techniques were applied to generate time-specific digital ele-vation models of floodplain structure and channel geomorphology. The UAS information
Figure 9. Thermal infrared (TIR) imagery showing the diffuse and discrete warm groundwater inputsinto the stream. Modified from [160].
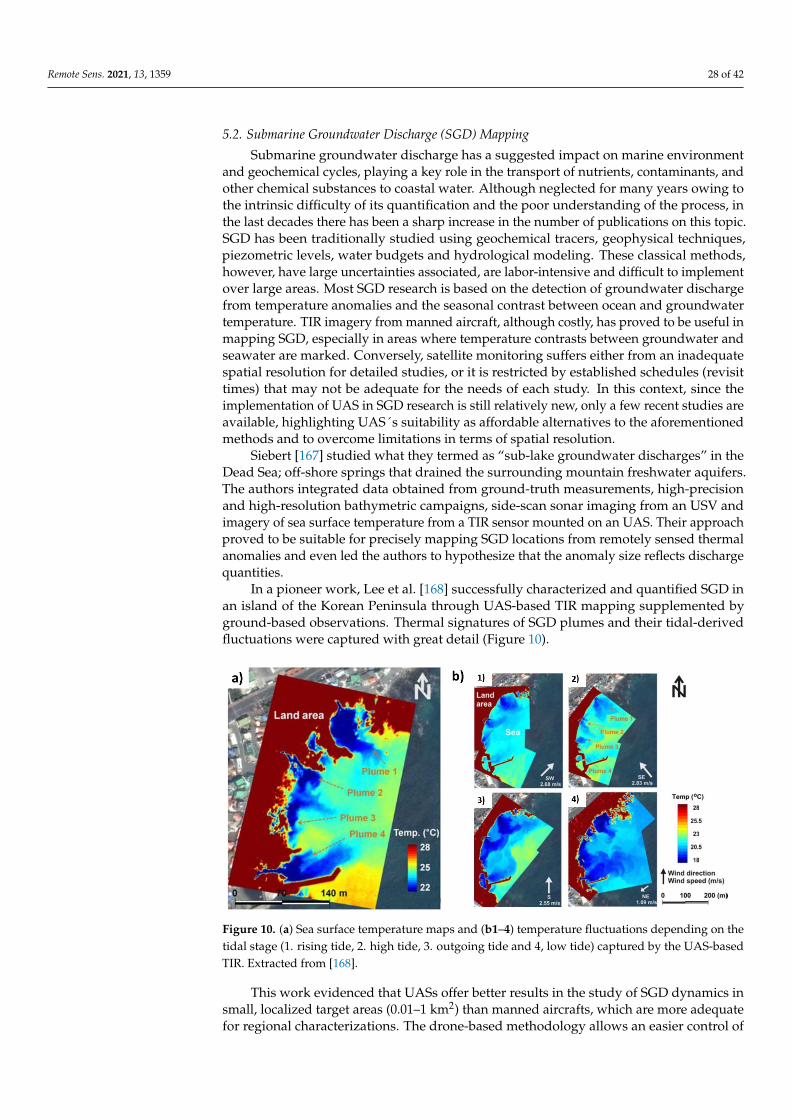
Remote Sens. 2021, 13, 1359 28 of 42
5.2. Submarine Groundwater Discharge (SGD) Mapping
Submarine groundwater discharge has a suggested impact on marine environmentand geochemical cycles, playing a key role in the transport of nutrients, contaminants, andother chemical substances to coastal water. Although neglected for many years owing tothe intrinsic difficulty of its quantification and the poor understanding of the process, inthe last decades there has been a sharp increase in the number of publications on this topic.SGD has been traditionally studied using geochemical tracers, geophysical techniques,piezometric levels, water budgets and hydrological modeling. These classical methods,however, have large uncertainties associated, are labor-intensive and difficult to implementover large areas. Most SGD research is based on the detection of groundwater dischargefrom temperature anomalies and the seasonal contrast between ocean and groundwatertemperature. TIR imagery from manned aircraft, although costly, has proved to be useful inmapping SGD, especially in areas where temperature contrasts between groundwater andseawater are marked. Conversely, satellite monitoring suffers either from an inadequatespatial resolution for detailed studies, or it is restricted by established schedules (revisittimes) that may not be adequate for the needs of each study. In this context, since theimplementation of UAS in SGD research is still relatively new, only a few recent studies areavailable, highlighting UAS´s suitability as affordable alternatives to the aforementionedmethods and to overcome limitations in terms of spatial resolution.
Siebert [167] studied what they termed as “sub-lake groundwater discharges” in theDead Sea; off-shore springs that drained the surrounding mountain freshwater aquifers.The authors integrated data obtained from ground-truth measurements, high-precisionand high-resolution bathymetric campaigns, side-scan sonar imaging from an USV andimagery of sea surface temperature from a TIR sensor mounted on an UAS. Their approachproved to be suitable for precisely mapping SGD locations from remotely sensed thermalanomalies and even led the authors to hypothesize that the anomaly size reflects dischargequantities.
In a pioneer work, Lee et al. [168] successfully characterized and quantified SGD inan island of the Korean Peninsula through UAS-based TIR mapping supplemented byground-based observations. Thermal signatures of SGD plumes and their tidal-derivedfluctuations were captured with great detail (Figure 10).
Remote Sens. 2021, 13, 1359 29 of 43
Figure 10. (a) Sea surface temperature maps and (b1–4) temperature fluctuations depending on the tidal stage (1. rising tide, 2. high tide, 3. outgoing tide and 4, low tide) captured by the UAS-based TIR. Extracted from [168].
This work evidenced that UASs offer better results in the study of SGD dynamics in small, localized target areas (0.01–1 km2) than manned aircrafts, which are more adequate for regional characterizations. The drone-based methodology allows an easier control of the spatial resolution, more flexibility in field operations and lower costs compared to conventional aerial surveys, making it a powerful tool to study SGD and other coastal processes.
More recently, Mallast and Siebert [44] investigated variations in thermal radiation induced by focused and diffuse SGD in a sedimentary fan of the Dead Sea. The authors used a hoovering UAS equipped with a long-wave TIR camera and a radiometry module and assumed that thermally stable areas indicated focused SGD whereas highly variable areas indicated diffuse SGD. After applying specific subjective variance thresholds and spatio-temporal analysis, their results highlighted that the spatio-temporal behavior of a SGD-induced thermal radiation pattern can vary in size and over time by up to 155% in the case of focused SGDs and by up to 600% in the case of diffuse SGDs owing to under-lying flow dynamics. The authors recommend the application of this approach prior any in situ sampling in order to identify adequate sampling locations and intervals.
5.3. Water Table Definition The definition of the water table of an aquifer is usually carried out from observations
at specific points in the territory with the subsequent application of the interpolation methods devised for this purpose (linear, polynomial, IDW, kriging, etc.). Direct observa-tions are made by measuring water level depth with specific instruments (electrical probes, pressure transducers, radar, etc.) at observation points that reach the saturated zone (wells, boreholes, piezometers, pits, excavations). The piezometric level is inferred from the subtraction of water level depth from ground elevation with respect to datum. Photogrammetry carried out from UAS can provide high accuracy in the definition of the morphology of the terrain and is useful for levelling the observation points. Nevertheless, the determination of the level depth using UAS require certain exposure of the water sheet. Therefore, it is not possible to detect the piezometric level when the observation points are closed (installed boreholes or piezometers with covers) or when their geometric characteristics (diameter) do not favor inspection from air. That is why there are very few works in this field. The only applications described refer to peatlands and karst aquifers affected by large dissolution/collapse structures (cenotes).
Thus, Rahman et al. [169] proposed a methodology for mapping groundwater in a treed-bog peatland using orthophotography and photogrammetric point clouds acquired
Figure 10. (a) Sea surface temperature maps and (b1–4) temperature fluctuations depending on thetidal stage (1. rising tide, 2. high tide, 3. outgoing tide and 4, low tide) captured by the UAS-basedTIR. Extracted from [168].
This work evidenced that UASs offer better results in the study of SGD dynamics insmall, localized target areas (0.01–1 km2) than manned aircrafts, which are more adequatefor regional characterizations. The drone-based methodology allows an easier control of

Remote Sens. 2021, 13, 1359 29 of 42
the spatial resolution, more flexibility in field operations and lower costs compared toconventional aerial surveys, making it a powerful tool to study SGD and other coastalprocesses.
More recently, Mallast and Siebert [44] investigated variations in thermal radiationinduced by focused and diffuse SGD in a sedimentary fan of the Dead Sea. The authorsused a hoovering UAS equipped with a long-wave TIR camera and a radiometry moduleand assumed that thermally stable areas indicated focused SGD whereas highly variableareas indicated diffuse SGD. After applying specific subjective variance thresholds andspatio-temporal analysis, their results highlighted that the spatio-temporal behavior of aSGD-induced thermal radiation pattern can vary in size and over time by up to 155% in thecase of focused SGDs and by up to 600% in the case of diffuse SGDs owing to underlyingflow dynamics. The authors recommend the application of this approach prior any in situsampling in order to identify adequate sampling locations and intervals.
5.3. Water Table Definition
The definition of the water table of an aquifer is usually carried out from observa-tions at specific points in the territory with the subsequent application of the interpolationmethods devised for this purpose (linear, polynomial, IDW, kriging, etc.). Direct obser-vations are made by measuring water level depth with specific instruments (electricalprobes, pressure transducers, radar, etc.) at observation points that reach the saturatedzone (wells, boreholes, piezometers, pits, excavations). The piezometric level is inferredfrom the subtraction of water level depth from ground elevation with respect to datum.Photogrammetry carried out from UAS can provide high accuracy in the definition of themorphology of the terrain and is useful for levelling the observation points. Nevertheless,the determination of the level depth using UAS require certain exposure of the watersheet. Therefore, it is not possible to detect the piezometric level when the observationpoints are closed (installed boreholes or piezometers with covers) or when their geometriccharacteristics (diameter) do not favor inspection from air. That is why there are very fewworks in this field. The only applications described refer to peatlands and karst aquifersaffected by large dissolution/collapse structures (cenotes).
Thus, Rahman et al. [169] proposed a methodology for mapping groundwater in atreed-bog peatland using orthophotography and photogrammetric point clouds acquiredfrom an UAS. DSM and a DEM were used to obtain a canopy height model and openwater objects were converted into a continuous surface. The elevations of the samples wereinterpolated to generate a water table surface, which was then subtracted from the DEM toobtain the depth to water surface. This method demonstrated great potential for measuringgroundwater levels over large, complex and inaccessible areas, although its performanceand effectiveness were hindered in densely vegetated areas. Bandini et al. [170] proposeda methodology based on the observation from UAS to define the water surface elevation(WSE) in cenotes in the calcareous aquifer of the Yucatán Peninsula (Mexico), which isuseful to feed hydrological models and estimate hydraulic gradients and groundwater flowdirections. WSE observations were retrieved using a radar and a global navigation satellitesystem on-board a multicopter platform. Moreover, water depth was measured using atethered floating sonar controlled by the UAS. Later, these observations are transformedto orthometric water height above mean sea level and compared with the ground-truthobservations retrieved by a GNSS rover station. The authors estimate an accuracy betterthan 5–7 cm in the WSE and they highlight that UASs allow monitoring of remote areaslocated in the jungle, which are difficult to access by human operators.
Other applications related to the detection of the saturated zone depth using UAS arefocused on the identification of drainage systems in agricultural fields; Allred et al. [171]conducted UAS surveys to detect drainage pipes in a pilot agricultural field where doc-umentation on the pipe network was available. The study was caried out using visible,NIR, and TIR images during the dry period. Under these field conditions, drainage pipescould not be detected with the VIS and NIR imagery. Conversely, the TIR image detected

Remote Sens. 2021, 13, 1359 30 of 42
roughly 60% of the subsurface drainage infrastructure. Kratt et al. [172] followed a similarapproach and obtained better results with visible images than with the TIR sensor, whichdid not detect the phenomenon owing to thermal differences lower than the sensitivity ofthe instrument, a consequence of non-optimal environmental conditions.
5.4. Subsidence
Subsidence is a slow and gradual movement caused by tension-induced changes overnatural terrains or built surfaces. This geological hazard can affect all types of terrainsand is produced by a range of natural factors and human activities. With regards to thelatter, groundwater extraction plays a significant role in the occurrence of land subsidence;pumping can lead to substantial drawdowns and water table depressions in the neighboringareas of boreholes, resulting higher water extraction costs and, in the worst-case scenario,to material and human damage.
This phenomenon has been extensively documented worldwide using different tech-niques like interferometry synthetic aperture radar (InSAR) from satellites or numericalmodels [173–175]. Nowadays, the implementation of UASs as complements or enhancingtools for conventional surveying and mapping of subsidence is drawing increasing atten-tion among the scientific community, however, this discipline is still in its earlier stages ofdevelopment.
Although works on the application of UASs in the study of subsidence linked togroundwater extraction are scarce, some pioneering attempts are worth mentioning. Oneof them was conducted in Arizona (USAEE.UU), where the central and southeasternregions present subsidence problems driven by groundwater pumping, leading to fissuresand cracks caused by tensile failure of sediment and soil. These fissures have resultedin property damages and increase the risk of groundwater contamination from surfacepollutants. To address this issue, the Arizona Geological Survey (AZGS) founded theearth fissure program in 2007 to systematically identify, map, and monitor earth fissures.In 2018 the AZGS incorporated the use of UAS-Sf M for fissure monitoring and terrainmapping [176]. As a result, they produced accurate DSM of the areas affected by fissures,highlighted the diffuse nature of ground surface disturbance around fissure openings andproposed to extend the use of UASs to other zones of Arizona due to the better precision ofthe method. On the other hand, the effect of subsidence on groundwater levels has beenstudied by [177,178]. The authors used RGB images from a rotatory-wing UAS to extractsubsided cultivated land in high-groundwater level coal mines. After calculating severalvegetation indexes and applying a hierarchical extraction method to define subsidedfarmland, the comparison of the results of the UAS-based images (Kappa coefficient of 0.96)with a traditional method (Kappa coefficient of 0.86) demonstrated the highest accuracy ofthe former. However, the methodology displayed some weaknesses; although the remotesensing images obtained by UAS at low altitude had high spatial resolution, the amountof data was relatively large, slowing down data processing. In addition, the high energydemands of the rotary-wing UAS only allowed to conduct shorter flights, what hinderedthe obtention of data over larger areas, and the resolution of the images was affected bymeteorological conditions (cloudiness and fog).
6. Results and Conclusions6.1. Current Applications of UASs in Water Resource Research
The advent of UASs as remote sensing platforms for hydrological monitoring consti-tutes a major breakthrough in water research, overcoming the shortcomings of traditionalmanned-aircraft and satellite observations, and opening up new opportunities to achievethe spatio-temporal resolutions required to understand small-scale hydrological processesand dynamics. In this regard, UASs are bridging the gaps between satellites, airborneimagery and ground-based measurements. In addition, the increasingly competitive pricesof these platforms, together with the parallel advances in sensor development and soft-

Remote Sens. 2021, 13, 1359 31 of 42
ware tools that automate data processing, have led to a growing interest of the scientificcommunity on this technology.
In this paper a total of 122 research works is summarized, providing an overview onUASs recent advances and state-of-the-art methodologies implemented in the study ofsurface water and groundwater, including notions about the types of sensors, platforms andadvantages and limitations of this technology that is in rapid and continuous development.The works reviewed were classified according to the phenomenon or process under studyand the type of water body considered.
The number of studies focused on surface water notably exceeds those on groundwaterinvestigations (Figure 11). In fact, UASs applications on surface water account for 84.4%of all the papers reviewed, of which river bathymetry and the study of floods are theprevalent studies. Conversely, groundwater research using aerial drones constitute only a15.6% of the total, being most of these papers related to SW–GW interactions.
Remote Sens. 2021, 13, 1359 31 of 43
a rotatory-wing UAS to extract subsided cultivated land in high-groundwater level coal mines. After calculating several vegetation indexes and applying a hierarchical extraction method to define subsided farmland, the comparison of the results of the UAS-based images (Kappa coefficient of 0.96) with a traditional method (Kappa coefficient of 0.86) demonstrated the highest accuracy of the former. However, the methodology displayed some weaknesses; although the remote sensing images obtained by UAS at low altitude had high spatial resolu-tion, the amount of data was relatively large, slowing down data processing. In addition, the high energy demands of the rotary-wing UAS only allowed to conduct shorter flights, what hindered the obtention of data over larger areas, and the resolution of the images was affected by meteorological conditions (cloudiness and fog).
6. Results and Conclusions 6.1. Current Applications of UASs in Water Resource Research
The advent of UASs as remote sensing platforms for hydrological monitoring constitutes a major breakthrough in water research, overcoming the shortcomings of traditional manned-aircraft and satellite observations, and opening up new opportunities to achieve the spatio-temporal resolutions required to understand small-scale hydrological processes and dynam-ics. In this regard, UASs are bridging the gaps between satellites, airborne imagery and ground-based measurements. In addition, the increasingly competitive prices of these plat-forms, together with the parallel advances in sensor development and software tools that au-tomate data processing, have led to a growing interest of the scientific community on this technology.
In this paper a total of 122 research works is summarized, providing an overview on UASs recent advances and state-of-the-art methodologies implemented in the study of surface water and groundwater, including notions about the types of sensors, platforms and ad-vantages and limitations of this technology that is in rapid and continuous development. The works reviewed were classified according to the phenomenon or process under study and the type of water body considered.
The number of studies focused on surface water notably exceeds those on groundwater investigations (Figure 11). In fact, UASs applications on surface water account for 84.4% of all the papers reviewed, of which river bathymetry and the study of floods are the prevalent studies. Conversely, groundwater research using aerial drones constitute only a 15.6% of the total, being most of these papers related to SW–GW interactions.
Figure 11. Percentage distribution and number of reviewed studies of UASs applications in hy-drology. Figure 11. Percentage distribution and number of reviewed studies of UASs applications in hydrology.
As this review evidences, a wide number of approaches have been developed forobserving surface and submerged features of rivers, lakes and other wetlands. For instance,UAS-based optical methods have been used to create bathymetric maps by stablishingcorrelations between pixel values or spectral properties of the images. The combination ofUAS images and videos with optical velocimetry and particle tracking techniques haveenabled to characterize surface flows and velocity fields of rivers and streams. UAS-derived data have been extensively used to produce high accuracy DEMs to identify theextent of inundations and improve flood models. IR sensors mounted on UASs havebeen also deployed to detect temperature patterns within rivers or lakes, and to identifygroundwater inputs or warm effluents from power plants. Likewise, RGB, IR and morerecently hyperspectral cameras are being deployed from UASs to early detect and monitoreutrophication and harmful algal blooms. Moreover, beyond being tools for the remotelyacquisition of data, UAS have gone one step further, with devices that allow the collectionof water samples and the measurement of parameters in situ, overcoming the manylimitations of traditional manual sampling.
Nevertheless, the application of UAS technology to surface water research is subjectto several limitations and challenges. Among the most obvious are the weather conditions,such as strong winds, rain, cloudiness and sunglint contamination that may hamperthe flights and result in geometrically distorted images. These factors might degradethe quality of the images, making necessary the formulation of correction algorithmsspecific for the flight and environmental conditions. Likewise, the characteristics anddistribution of vegetation can hinder the acquisition of data from the terrain in both aerialand underwater conditions and can even represent a serious risk for the movement andsafety of unmanned aerial platforms. The accuracy in vertical and horizontal position (x,y,z
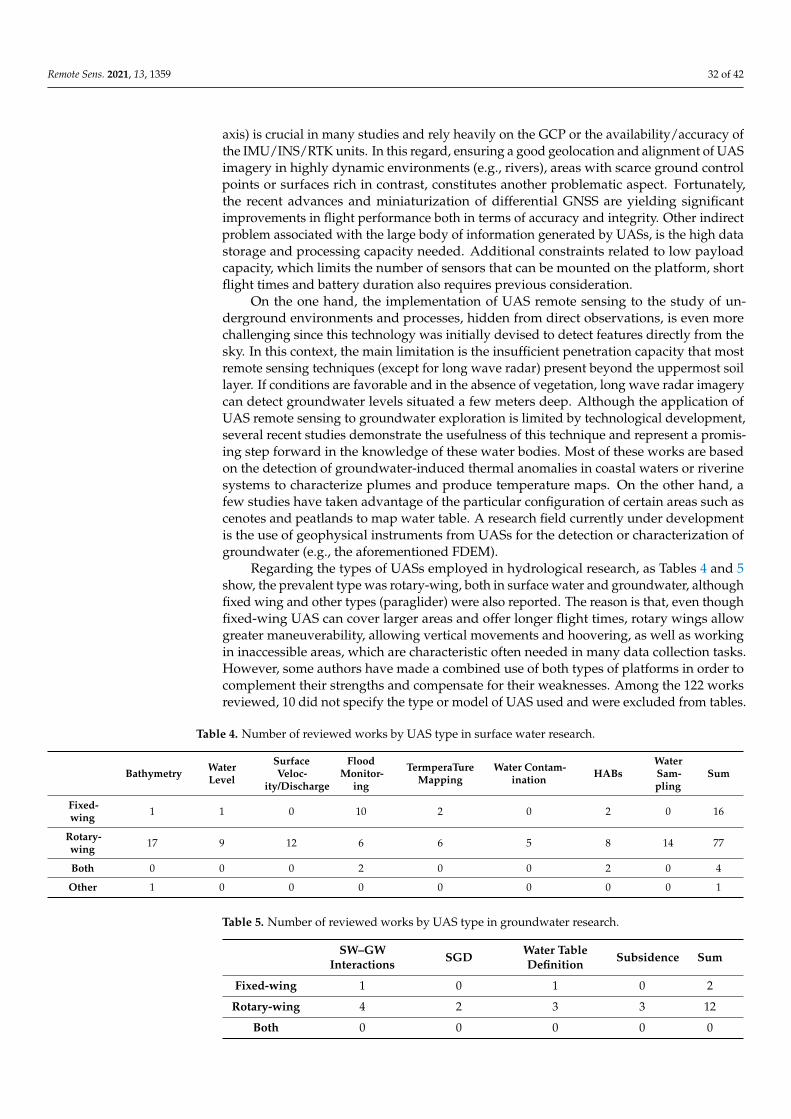
Remote Sens. 2021, 13, 1359 32 of 42
axis) is crucial in many studies and rely heavily on the GCP or the availability/accuracy ofthe IMU/INS/RTK units. In this regard, ensuring a good geolocation and alignment of UASimagery in highly dynamic environments (e.g., rivers), areas with scarce ground controlpoints or surfaces rich in contrast, constitutes another problematic aspect. Fortunately,the recent advances and miniaturization of differential GNSS are yielding significantimprovements in flight performance both in terms of accuracy and integrity. Other indirectproblem associated with the large body of information generated by UASs, is the high datastorage and processing capacity needed. Additional constraints related to low payloadcapacity, which limits the number of sensors that can be mounted on the platform, shortflight times and battery duration also requires previous consideration.
On the one hand, the implementation of UAS remote sensing to the study of un-derground environments and processes, hidden from direct observations, is even morechallenging since this technology was initially devised to detect features directly from thesky. In this context, the main limitation is the insufficient penetration capacity that mostremote sensing techniques (except for long wave radar) present beyond the uppermost soillayer. If conditions are favorable and in the absence of vegetation, long wave radar imagerycan detect groundwater levels situated a few meters deep. Although the application ofUAS remote sensing to groundwater exploration is limited by technological development,several recent studies demonstrate the usefulness of this technique and represent a promis-ing step forward in the knowledge of these water bodies. Most of these works are basedon the detection of groundwater-induced thermal anomalies in coastal waters or riverinesystems to characterize plumes and produce temperature maps. On the other hand, afew studies have taken advantage of the particular configuration of certain areas such ascenotes and peatlands to map water table. A research field currently under developmentis the use of geophysical instruments from UASs for the detection or characterization ofgroundwater (e.g., the aforementioned FDEM).
Regarding the types of UASs employed in hydrological research, as Tables 4 and 5show, the prevalent type was rotary-wing, both in surface water and groundwater, althoughfixed wing and other types (paraglider) were also reported. The reason is that, even thoughfixed-wing UAS can cover larger areas and offer longer flight times, rotary wings allowgreater maneuverability, allowing vertical movements and hoovering, as well as workingin inaccessible areas, which are characteristic often needed in many data collection tasks.However, some authors have made a combined use of both types of platforms in order tocomplement their strengths and compensate for their weaknesses. Among the 122 worksreviewed, 10 did not specify the type or model of UAS used and were excluded from tables.
Table 4. Number of reviewed works by UAS type in surface water research.
Bathymetry WaterLevel
SurfaceVeloc-
ity/Discharge
FloodMonitor-
ing
TermperaTureMapping
Water Contam-ination HABs
WaterSam-pling
Sum
Fixed-wing 1 1 0 10 2 0 2 0 16
Rotary-wing 17 9 12 6 6 5 8 14 77
Both 0 0 0 2 0 0 2 0 4
Other 1 0 0 0 0 0 0 0 1
Table 5. Number of reviewed works by UAS type in groundwater research.
SW–GWInteractions SGD Water Table
Definition Subsidence Sum
Fixed-wing 1 0 1 0 2
Rotary-wing 4 2 3 3 12
Both 0 0 0 0 0
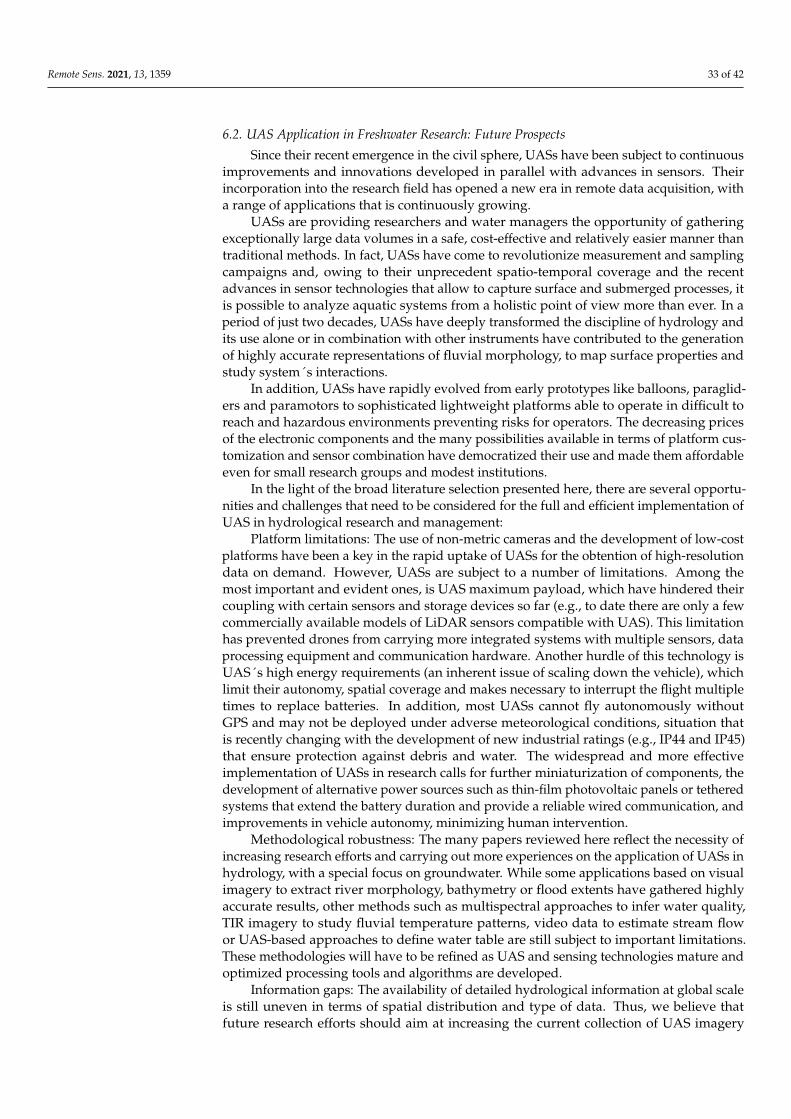
Remote Sens. 2021, 13, 1359 33 of 42
6.2. UAS Application in Freshwater Research: Future Prospects
Since their recent emergence in the civil sphere, UASs have been subject to continuousimprovements and innovations developed in parallel with advances in sensors. Theirincorporation into the research field has opened a new era in remote data acquisition, witha range of applications that is continuously growing.
UASs are providing researchers and water managers the opportunity of gatheringexceptionally large data volumes in a safe, cost-effective and relatively easier manner thantraditional methods. In fact, UASs have come to revolutionize measurement and samplingcampaigns and, owing to their unprecedent spatio-temporal coverage and the recentadvances in sensor technologies that allow to capture surface and submerged processes, itis possible to analyze aquatic systems from a holistic point of view more than ever. In aperiod of just two decades, UASs have deeply transformed the discipline of hydrology andits use alone or in combination with other instruments have contributed to the generationof highly accurate representations of fluvial morphology, to map surface properties andstudy system´s interactions.
In addition, UASs have rapidly evolved from early prototypes like balloons, paraglid-ers and paramotors to sophisticated lightweight platforms able to operate in difficult toreach and hazardous environments preventing risks for operators. The decreasing pricesof the electronic components and the many possibilities available in terms of platform cus-tomization and sensor combination have democratized their use and made them affordableeven for small research groups and modest institutions.
In the light of the broad literature selection presented here, there are several opportu-nities and challenges that need to be considered for the full and efficient implementation ofUAS in hydrological research and management:
Platform limitations: The use of non-metric cameras and the development of low-costplatforms have been a key in the rapid uptake of UASs for the obtention of high-resolutiondata on demand. However, UASs are subject to a number of limitations. Among themost important and evident ones, is UAS maximum payload, which have hindered theircoupling with certain sensors and storage devices so far (e.g., to date there are only a fewcommercially available models of LiDAR sensors compatible with UAS). This limitationhas prevented drones from carrying more integrated systems with multiple sensors, dataprocessing equipment and communication hardware. Another hurdle of this technology isUAS´s high energy requirements (an inherent issue of scaling down the vehicle), whichlimit their autonomy, spatial coverage and makes necessary to interrupt the flight multipletimes to replace batteries. In addition, most UASs cannot fly autonomously withoutGPS and may not be deployed under adverse meteorological conditions, situation thatis recently changing with the development of new industrial ratings (e.g., IP44 and IP45)that ensure protection against debris and water. The widespread and more effectiveimplementation of UASs in research calls for further miniaturization of components, thedevelopment of alternative power sources such as thin-film photovoltaic panels or tetheredsystems that extend the battery duration and provide a reliable wired communication, andimprovements in vehicle autonomy, minimizing human intervention.
Methodological robustness: The many papers reviewed here reflect the necessity ofincreasing research efforts and carrying out more experiences on the application of UASs inhydrology, with a special focus on groundwater. While some applications based on visualimagery to extract river morphology, bathymetry or flood extents have gathered highlyaccurate results, other methods such as multispectral approaches to infer water quality,TIR imagery to study fluvial temperature patterns, video data to estimate stream flowor UAS-based approaches to define water table are still subject to important limitations.These methodologies will have to be refined as UAS and sensing technologies mature andoptimized processing tools and algorithms are developed.
Information gaps: The availability of detailed hydrological information at global scaleis still uneven in terms of spatial distribution and type of data. Thus, we believe thatfuture research efforts should aim at increasing the current collection of UAS imagery

Remote Sens. 2021, 13, 1359 34 of 42
over different types of basins, hydrological conditions and events, with especial focuson ungauged systems and information-scarce areas. On the other hand, as this reviewevidences, most UAS remote sensing techniques are focused on morphological aspects,while works on dynamic processes such water surface elevation, discharge estimationsand surface-groundwater interactions are less common owing to technological, spatial andtemporal limitations. In this regard, future advances in the field of UASs, together withmultiplatform and multisensor approaches will narrow these information voids and willenable a deeper understanding of water bodies functioning and interactions.
Image processing and the role of machine learning: Manual extraction of regionsof interest from the large volumes of information generated by UASs is a costly andtime demanding task, even more in long-term monitoring programs involving repeatedsurveys. In this context, the emergence of machine learning algorithms provides greatopportunities to automatize image processing workflows and address the challenges ofhydrological research. To date, some works have successfully implemented machinelearning approaches such as support vector machine or ANN for feature extraction andclassification, or to solve non-linear problems in hydrological forecasting. Nevertheless,despite machine learning usually outperforms physically based models, their predictiveaccuracy is restricted to the range of input data used in the training stage. Thus, a long-termgoal to improve model predictions at broader scales is to fill information gaps and acquireconsistent spatial-temporal hydrological input data for their subsequent integration intoartificial intelligence networks. As technology matures, UASs will be extremely usefultools for the acquisition of different types of training data.
Uneven legal framework: The rapid expansion of UASs has not been balanced by anexhaustive regulation and to date, there is not a single harmonized regulatory instrumentat international scale. This situation stems from the shift in the use of UAS technology fromthe initial military purpose to professional/commercial and recreational use, leading tonew legal implications. UASs must comply with principles of safety and privacy and everyactivity performed by a drone is subject to a convoluted set of specific sectorial rules suchas data protection, privacy law, aviation law, telecommunication law, environmental law,product liability or criminal law, which hinders the potential and competitiveness of thedrone market. The integration of civil UAS into all areas of the airspace while removingthe technical barriers that limit their flight and addressing the inherent security, privacyand ethical issues still one of the main obstacles to overcome. Recently, the EuropeanRegulation 2019/947 [179] on the rules and procedures for the operation and registrationof unmanned aircraft has constituted a leap forward in the unification and integrationof civil drones into all areas of the airspace. The document sets the rules for conductingoperational risk assessment and cross-border operations within the EU, the conditionsunder which drone operations can be allowed and establishes the requirements for theregistration of UAS operators and certified UAS among others.
Finally, this paper presents a comprehensive literature review on the diverse applica-tions of UAS in the fields of hydrology and hydrogeology, classifying them according to theaim of the study and covering a range of aspects such as the types of platforms and sensorsused, their strengths, limitations and the new possibilities opened up by their combinationwith other measurement instruments. The compilation of experiences here summarizedhas demonstrated the great supporting role of UASs to ground-based and satellite-borneobservations, covering the demand of near real-time and cost-effective data especially inthe study of highly dynamic processes. Despite the rapid advances experienced and allthe advantages UASs offer, their integration in water resource research (as in many otherresearch fields) it is still in its infancy; there is room for improvement in many aspects suchas image processing, standardization of the techniques and procedures adopted, or UASsintegration with traditional instruments and analysis tools. In this regard, experience anddata sharing among researchers can further improve hydrological research, help to fillknowledge gaps and lay the foundations for the design of methodologies and protocolsappropriate to different hydrological contexts. This review aims at serving as a reference or
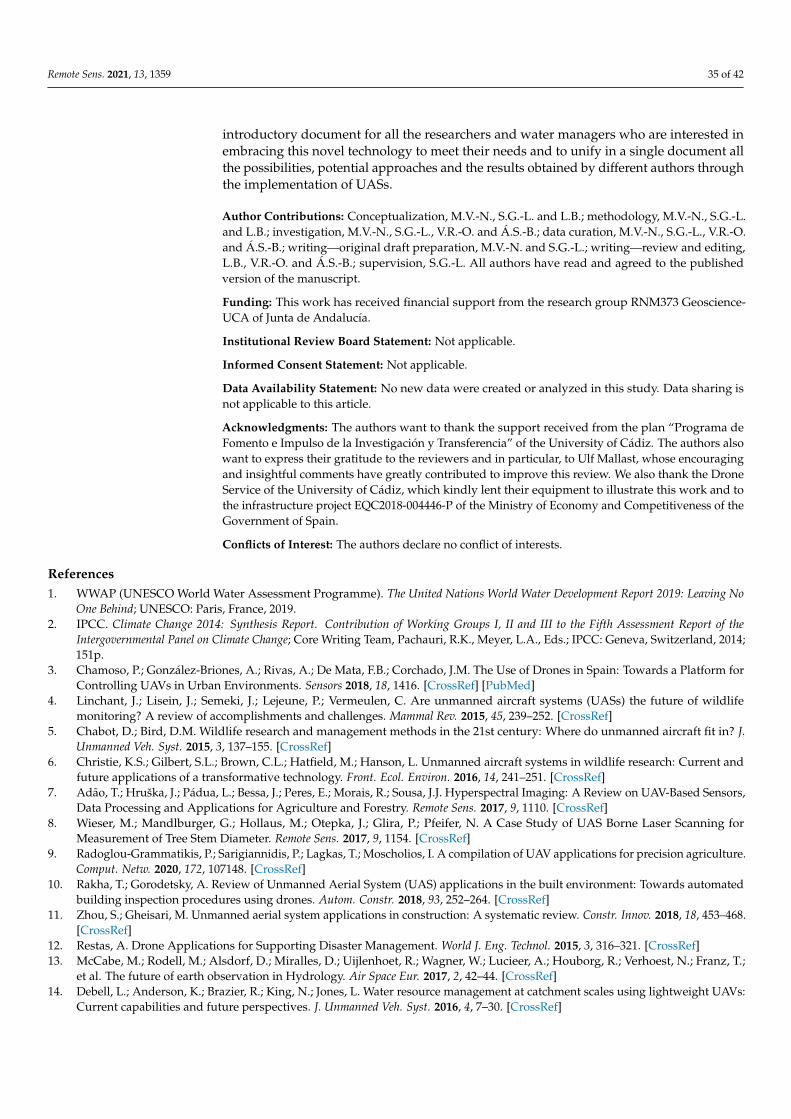
Remote Sens. 2021, 13, 1359 35 of 42
introductory document for all the researchers and water managers who are interested inembracing this novel technology to meet their needs and to unify in a single document allthe possibilities, potential approaches and the results obtained by different authors throughthe implementation of UASs.
Author Contributions: Conceptualization, M.V.-N., S.G.-L. and L.B.; methodology, M.V.-N., S.G.-L.and L.B.; investigation, M.V.-N., S.G.-L., V.R.-O. and Á.S.-B.; data curation, M.V.-N., S.G.-L., V.R.-O.and Á.S.-B.; writing—original draft preparation, M.V.-N. and S.G.-L.; writing—review and editing,L.B., V.R.-O. and Á.S.-B.; supervision, S.G.-L. All authors have read and agreed to the publishedversion of the manuscript.
Funding: This work has received financial support from the research group RNM373 Geoscience-UCA of Junta de Andalucía.
Institutional Review Board Statement: Not applicable.
Informed Consent Statement: Not applicable.
Data Availability Statement: No new data were created or analyzed in this study. Data sharing isnot applicable to this article.
Acknowledgments: The authors want to thank the support received from the plan “Programa deFomento e Impulso de la Investigación y Transferencia” of the University of Cádiz. The authors alsowant to express their gratitude to the reviewers and in particular, to Ulf Mallast, whose encouragingand insightful comments have greatly contributed to improve this review. We also thank the DroneService of the University of Cádiz, which kindly lent their equipment to illustrate this work and tothe infrastructure project EQC2018-004446-P of the Ministry of Economy and Competitiveness of theGovernment of Spain.
Conflicts of Interest: The authors declare no conflict of interests.
References1. WWAP (UNESCO World Water Assessment Programme). The United Nations World Water Development Report 2019: Leaving No
One Behind; UNESCO: Paris, France, 2019.2. IPCC. Climate Change 2014: Synthesis Report. Contribution of Working Groups I, II and III to the Fifth Assessment Report of the
Intergovernmental Panel on Climate Change; Core Writing Team, Pachauri, R.K., Meyer, L.A., Eds.; IPCC: Geneva, Switzerland, 2014;151p.
3. Chamoso, P.; González-Briones, A.; Rivas, A.; De Mata, F.B.; Corchado, J.M. The Use of Drones in Spain: Towards a Platform forControlling UAVs in Urban Environments. Sensors 2018, 18, 1416. [CrossRef] [PubMed]
4. Linchant, J.; Lisein, J.; Semeki, J.; Lejeune, P.; Vermeulen, C. Are unmanned aircraft systems (UASs) the future of wildlifemonitoring? A review of accomplishments and challenges. Mammal Rev. 2015, 45, 239–252. [CrossRef]
5. Chabot, D.; Bird, D.M. Wildlife research and management methods in the 21st century: Where do unmanned aircraft fit in? J.Unmanned Veh. Syst. 2015, 3, 137–155. [CrossRef]
6. Christie, K.S.; Gilbert, S.L.; Brown, C.L.; Hatfield, M.; Hanson, L. Unmanned aircraft systems in wildlife research: Current andfuture applications of a transformative technology. Front. Ecol. Environ. 2016, 14, 241–251. [CrossRef]
7. Adão, T.; Hruška, J.; Pádua, L.; Bessa, J.; Peres, E.; Morais, R.; Sousa, J.J. Hyperspectral Imaging: A Review on UAV-Based Sensors,Data Processing and Applications for Agriculture and Forestry. Remote Sens. 2017, 9, 1110. [CrossRef]
8. Wieser, M.; Mandlburger, G.; Hollaus, M.; Otepka, J.; Glira, P.; Pfeifer, N. A Case Study of UAS Borne Laser Scanning forMeasurement of Tree Stem Diameter. Remote Sens. 2017, 9, 1154. [CrossRef]
9. Radoglou-Grammatikis, P.; Sarigiannidis, P.; Lagkas, T.; Moscholios, I. A compilation of UAV applications for precision agriculture.Comput. Netw. 2020, 172, 107148. [CrossRef]
10. Rakha, T.; Gorodetsky, A. Review of Unmanned Aerial System (UAS) applications in the built environment: Towards automatedbuilding inspection procedures using drones. Autom. Constr. 2018, 93, 252–264. [CrossRef]
11. Zhou, S.; Gheisari, M. Unmanned aerial system applications in construction: A systematic review. Constr. Innov. 2018, 18, 453–468.[CrossRef]
12. Restas, A. Drone Applications for Supporting Disaster Management. World J. Eng. Technol. 2015, 3, 316–321. [CrossRef]13. McCabe, M.; Rodell, M.; Alsdorf, D.; Miralles, D.; Uijlenhoet, R.; Wagner, W.; Lucieer, A.; Houborg, R.; Verhoest, N.; Franz, T.;
et al. The future of earth observation in Hydrology. Air Space Eur. 2017, 2, 42–44. [CrossRef]14. Debell, L.; Anderson, K.; Brazier, R.; King, N.; Jones, L. Water resource management at catchment scales using lightweight UAVs:
Current capabilities and future perspectives. J. Unmanned Veh. Syst. 2016, 4, 7–30. [CrossRef]
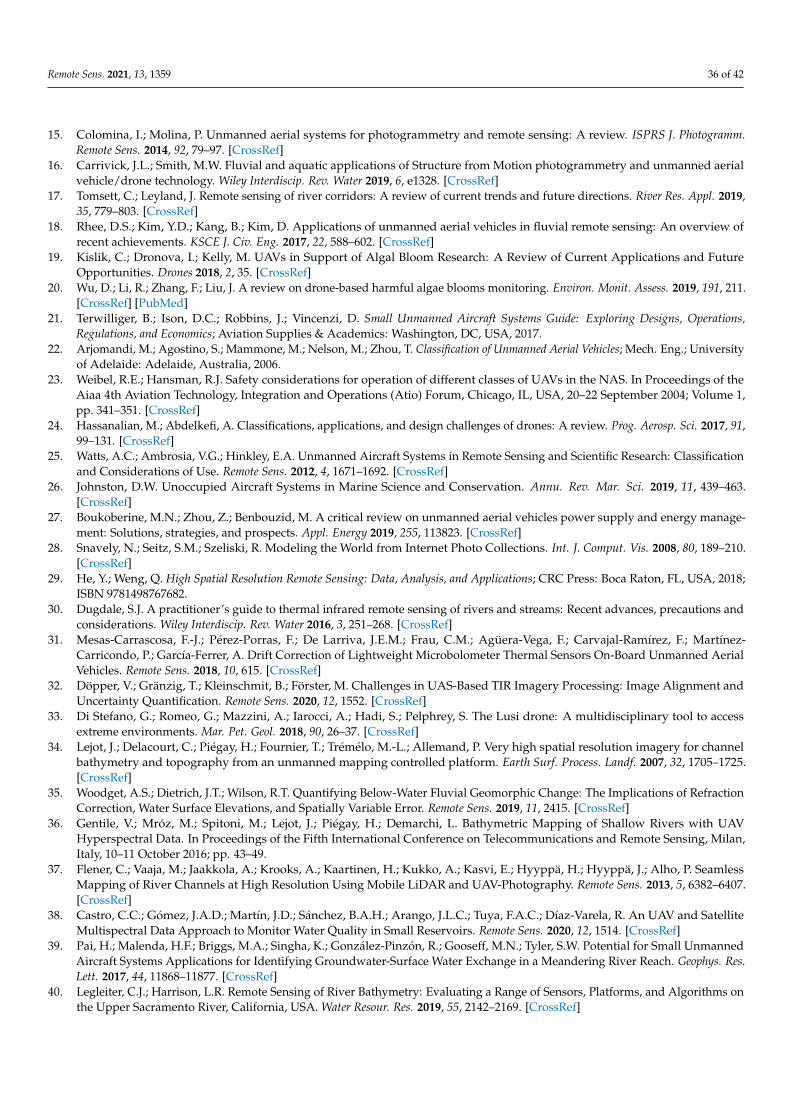
Remote Sens. 2021, 13, 1359 36 of 42
15. Colomina, I.; Molina, P. Unmanned aerial systems for photogrammetry and remote sensing: A review. ISPRS J. Photogramm.Remote Sens. 2014, 92, 79–97. [CrossRef]
16. Carrivick, J.L.; Smith, M.W. Fluvial and aquatic applications of Structure from Motion photogrammetry and unmanned aerialvehicle/drone technology. Wiley Interdiscip. Rev. Water 2019, 6, e1328. [CrossRef]
17. Tomsett, C.; Leyland, J. Remote sensing of river corridors: A review of current trends and future directions. River Res. Appl. 2019,35, 779–803. [CrossRef]
18. Rhee, D.S.; Kim, Y.D.; Kang, B.; Kim, D. Applications of unmanned aerial vehicles in fluvial remote sensing: An overview ofrecent achievements. KSCE J. Civ. Eng. 2017, 22, 588–602. [CrossRef]
19. Kislik, C.; Dronova, I.; Kelly, M. UAVs in Support of Algal Bloom Research: A Review of Current Applications and FutureOpportunities. Drones 2018, 2, 35. [CrossRef]
20. Wu, D.; Li, R.; Zhang, F.; Liu, J. A review on drone-based harmful algae blooms monitoring. Environ. Monit. Assess. 2019, 191, 211.[CrossRef] [PubMed]
21. Terwilliger, B.; Ison, D.C.; Robbins, J.; Vincenzi, D. Small Unmanned Aircraft Systems Guide: Exploring Designs, Operations,Regulations, and Economics; Aviation Supplies & Academics: Washington, DC, USA, 2017.
22. Arjomandi, M.; Agostino, S.; Mammone, M.; Nelson, M.; Zhou, T. Classification of Unmanned Aerial Vehicles; Mech. Eng.; Universityof Adelaide: Adelaide, Australia, 2006.
23. Weibel, R.E.; Hansman, R.J. Safety considerations for operation of different classes of UAVs in the NAS. In Proceedings of theAiaa 4th Aviation Technology, Integration and Operations (Atio) Forum, Chicago, IL, USA, 20–22 September 2004; Volume 1,pp. 341–351. [CrossRef]
24. Hassanalian, M.; Abdelkefi, A. Classifications, applications, and design challenges of drones: A review. Prog. Aerosp. Sci. 2017, 91,99–131. [CrossRef]
25. Watts, A.C.; Ambrosia, V.G.; Hinkley, E.A. Unmanned Aircraft Systems in Remote Sensing and Scientific Research: Classificationand Considerations of Use. Remote Sens. 2012, 4, 1671–1692. [CrossRef]
26. Johnston, D.W. Unoccupied Aircraft Systems in Marine Science and Conservation. Annu. Rev. Mar. Sci. 2019, 11, 439–463.[CrossRef]
27. Boukoberine, M.N.; Zhou, Z.; Benbouzid, M. A critical review on unmanned aerial vehicles power supply and energy manage-ment: Solutions, strategies, and prospects. Appl. Energy 2019, 255, 113823. [CrossRef]
28. Snavely, N.; Seitz, S.M.; Szeliski, R. Modeling the World from Internet Photo Collections. Int. J. Comput. Vis. 2008, 80, 189–210.[CrossRef]
29. He, Y.; Weng, Q. High Spatial Resolution Remote Sensing: Data, Analysis, and Applications; CRC Press: Boca Raton, FL, USA, 2018;ISBN 9781498767682.
30. Dugdale, S.J. A practitioner’s guide to thermal infrared remote sensing of rivers and streams: Recent advances, precautions andconsiderations. Wiley Interdiscip. Rev. Water 2016, 3, 251–268. [CrossRef]
31. Mesas-Carrascosa, F.-J.; Pérez-Porras, F.; De Larriva, J.E.M.; Frau, C.M.; Agüera-Vega, F.; Carvajal-Ramírez, F.; Martínez-Carricondo, P.; García-Ferrer, A. Drift Correction of Lightweight Microbolometer Thermal Sensors On-Board Unmanned AerialVehicles. Remote Sens. 2018, 10, 615. [CrossRef]
32. Döpper, V.; Gränzig, T.; Kleinschmit, B.; Förster, M. Challenges in UAS-Based TIR Imagery Processing: Image Alignment andUncertainty Quantification. Remote Sens. 2020, 12, 1552. [CrossRef]
33. Di Stefano, G.; Romeo, G.; Mazzini, A.; Iarocci, A.; Hadi, S.; Pelphrey, S. The Lusi drone: A multidisciplinary tool to accessextreme environments. Mar. Pet. Geol. 2018, 90, 26–37. [CrossRef]
34. Lejot, J.; Delacourt, C.; Piégay, H.; Fournier, T.; Trémélo, M.-L.; Allemand, P. Very high spatial resolution imagery for channelbathymetry and topography from an unmanned mapping controlled platform. Earth Surf. Process. Landf. 2007, 32, 1705–1725.[CrossRef]
35. Woodget, A.S.; Dietrich, J.T.; Wilson, R.T. Quantifying Below-Water Fluvial Geomorphic Change: The Implications of RefractionCorrection, Water Surface Elevations, and Spatially Variable Error. Remote Sens. 2019, 11, 2415. [CrossRef]
36. Gentile, V.; Mróz, M.; Spitoni, M.; Lejot, J.; Piégay, H.; Demarchi, L. Bathymetric Mapping of Shallow Rivers with UAVHyperspectral Data. In Proceedings of the Fifth International Conference on Telecommunications and Remote Sensing, Milan,Italy, 10–11 October 2016; pp. 43–49.
37. Flener, C.; Vaaja, M.; Jaakkola, A.; Krooks, A.; Kaartinen, H.; Kukko, A.; Kasvi, E.; Hyyppä, H.; Hyyppä, J.; Alho, P. SeamlessMapping of River Channels at High Resolution Using Mobile LiDAR and UAV-Photography. Remote Sens. 2013, 5, 6382–6407.[CrossRef]
38. Castro, C.C.; Gómez, J.A.D.; Martín, J.D.; Sánchez, B.A.H.; Arango, J.L.C.; Tuya, F.A.C.; Díaz-Varela, R. An UAV and SatelliteMultispectral Data Approach to Monitor Water Quality in Small Reservoirs. Remote Sens. 2020, 12, 1514. [CrossRef]
39. Pai, H.; Malenda, H.F.; Briggs, M.A.; Singha, K.; González-Pinzón, R.; Gooseff, M.N.; Tyler, S.W. Potential for Small UnmannedAircraft Systems Applications for Identifying Groundwater-Surface Water Exchange in a Meandering River Reach. Geophys. Res.Lett. 2017, 44, 11868–11877. [CrossRef]
40. Legleiter, C.J.; Harrison, L.R. Remote Sensing of River Bathymetry: Evaluating a Range of Sensors, Platforms, and Algorithms onthe Upper Sacramento River, California, USA. Water Resour. Res. 2019, 55, 2142–2169. [CrossRef]
Remote Sens. 2021, 13, 1359 37 of 42
41. Collas, F.P.; Van Iersel, W.K.; Straatsma, M.W.; Buijse, A.D.; Leuven, R.S. Sub-Daily Temperature Heterogeneity in a Side Channeland the Influence on Habitat Suitability of Freshwater Fish. Remote Sens. 2019, 11, 2367. [CrossRef]
42. Dugdale, S.J.; Kelleher, C.A.; Malcolm, I.A.; Caldwell, S.; Hannah, D.M. Assessing the potential of drone-based thermal infraredimagery for quantifying river temperature heterogeneity. Hydrol. Process. 2019, 33, 1152–1163. [CrossRef]
43. Kinzel, P.J.; Legleiter, C.J. sUAS-Based Remote Sensing of River Discharge Using Thermal Particle Image Velocimetry andBathymetric Lidar. Remote Sens. 2019, 11, 2317. [CrossRef]
44. Mallast, U.; Siebert, C. Combining continuous spatial and temporal scales for SGD investigations using UAV-based thermalinfrared measurements. Hydrol. Earth Syst. Sci. 2019, 23, 1375–1392. [CrossRef]
45. Chen, S.; Johnson, F.; Drummond, C.; Glamore, W. A new method to improve the accuracy of remotely sensed data for wetlandwater balance estimates. J. Hydrol. Reg. Stud. 2020, 29, 100689. [CrossRef]
46. Vázquez-Tarrío, D.; Borgniet, L.; Liébault, F.; Recking, A. Using UAS optical imagery and SfM photogrammetry to characterizethe surface grain size of gravel bars in a braided river (Vénéon River, French Alps). Geomorphology 2017, 285, 94–105. [CrossRef]
47. Li, H.; Chen, L.; Wang, Z.; Yu, Z. Mapping of River Terraces with Low-Cost UAS Based Structure-from-Motion Photogrammetryin a Complex Terrain Setting. Remote Sens. 2019, 11, 464. [CrossRef]
48. Hemmelder, S.; Marra, W.; Markies, H.; De Jong, S.M. Monitoring river morphology & bank erosion using UAV imagery—A casestudy of the river Buëch, Hautes-Alpes, France. Int. J. Appl. Earth Obs. Geoinf. 2018, 73, 428–437. [CrossRef]
49. Mazzoleni, M.; Paron, P.; Reali, A.; Juizo, D.; Manane, J.; Brandimarte, L. Testing UAV-derived topography for hydraulicmodelling in a tropical environment. Nat. Hazards 2020, 103, 139–163. [CrossRef]
50. Zinke, P.; Flenner, C. 2013. Experiences from the use of Unmanned Aerial Vehicles (UAV) for River Bathymetry Modelling inNorway. Vann 2013, 48, 351–360.
51. Woodget, A.S.; Carbonneau, P.E.; Visser, F.; Maddock, I.P. Quantifying submerged fluvial topography using hyperspatialresolution UAS imagery and structure from motion photogrammetry. Earth Surf. Process. Landf. 2014, 40, 47–64. [CrossRef]
52. Dietrich, J.T. Bathymetric Structure-from-Motion: Extracting shallow stream bathymetry from multi-view stereo photogrammetry.Earth Surf. Process. Landf. 2017, 42, 355–364. [CrossRef]
53. Entwistle, N.S.; Heritage, G.L. Small unmanned aerial model accuracy for photogrammetrical fluvial bathymetric survey. J. Appl.Remote Sens. 2019, 13, 014523. [CrossRef]
54. Partama, I.Y.; Kanno, A.; Ueda, M.; Akamatsu, Y.; Inui, R.; Sekine, M.; Yamamoto, K.; Imai, T.; Higuchi, T. Removal of water-surface reflection effects with a temporal minimum filter for UAV-based shallow-water photogrammetry. Earth Surf. Process.Landf. 2018, 43, 2673–2682. [CrossRef]
55. Skarlatos, D.; Agrafiotis, P. A Novel Iterative Water Refraction Correction Algorithm for Use in Structure from Motion Photogram-metric Pipeline. J. Mar. Sci. Eng. 2018, 6, 77. [CrossRef]
56. Agrafiotis, P.; Karantzalos, K.; Georgopoulos, A.; Skarlatos, D. Correcting Image Refraction: Towards Accurate Aerial Image-BasedBathymetry Mapping in Shallow Waters. Remote Sens. 2020, 12, 322. [CrossRef]
57. Agrafiotis, P.; Skarlatos, D.; Georgopoulos, A.; Karantzalos, K. DepthLearn: Learning to Correct the Refraction on Point CloudsDerived from Aerial Imagery for Accurate Dense Shallow Water Bathymetry Based on SVMs-Fusion with LiDAR Point Clouds.Remote Sens. 2019, 11, 2225. [CrossRef]
58. Mandlburger, G.; Pfennigbauer, M.; Schwarz, R.; Flöry, S.; Nussbaumer, L. Concept and Performance Evaluation of a NovelUAV-Borne Topo-Bathymetric LiDAR Sensor. Remote Sens. 2020, 12, 986. [CrossRef]
59. Kasvi, E.; Salmela, J.; Lotsari, E.; Kumpula, T.; Lane, S. Comparison of remote sensing based approaches for mapping bathymetryof shallow, clear water rivers. Geomorphology 2019, 333, 180–197. [CrossRef]
60. Erena, M.; Atenza, J.F.; García-Galiano, S.; Domínguez, J.A.; Bernabé, J.M. Use of Drones for the Topo-Bathymetric Monitoring ofthe Reservoirs of the Segura River Basin. Water 2019, 11, 445. [CrossRef]
61. Bandini, F.; Olesen, D.; Jakobsen, J.; Kittel, C.M.M.; Wang, S.; Garcia, M.; Bauer-Gottwein, P. Technical note: Bathymetryobservations of inland water bodies using a tethered single-beam sonar controlled by an unmanned aerial vehicle. Hydrol. EarthSyst. Sci. 2018, 22, 4165–4181. [CrossRef]
62. Alvarez, L.V.; Moreno, H.A.; Segales, A.R.; Pham, T.G.; Pillar-Little, E.A.; Chilson, P.B. Merging Unmanned Aerial Systems(UAS) Imagery and Echo Soundings with an Adaptive Sampling Technique for Bathymetric Surveys. Remote Sens. 2018, 10, 1362.[CrossRef]
63. Kim, J.S.; Baek, D.; Seo, I.W.; Shin, J. Retrieving shallow stream bathymetry from UAV-assisted RGB imagery using a geospatialregression method. Geomorphology 2019, 341, 102–114. [CrossRef]
64. Langhammer, J.; Janský, B.; Kocum, J.; Minarík, R. 3-D reconstruction of an abandoned montane reservoir using UAV photogram-metry, aerial LiDAR and field survey. Appl. Geogr. 2018, 98, 9–21. [CrossRef]
65. Tamminga, A.D.; Hugenholtz, C.H.; Eaton, B.C.; Lapointe, M. Hyperspatial Remote Sensing of Channel Reach Morphology andHydraulic Fish Habitat Using an Unmanned Aerial Vehicle (UAV): A First Assessment in the Context of River Research andManagement. River Res. Appl. 2015, 31, 379–391. [CrossRef]
66. Templin, T.; Popielarczyk, D.; Kosecki, R. Application of Low-Cost Fixed-Wing UAV for Inland Lakes Shoreline Investigation.Pure Appl. Geophys. 2018, 175, 3263–3283. [CrossRef]
67. Alsdorf, D.E.; Rodríguez, E.; Lettenmaier, D.P. Measuring surface water from space. Rev. Geophys. 2007, 45. [CrossRef]68. Ridolfi, E.; Manciola, P. Water Level Measurements from Drones: A Pilot Case Study at a Dam Site. Water 2018, 10, 297. [CrossRef]
Remote Sens. 2021, 13, 1359 38 of 42
69. Gao, A.; Wu, S.; Wang, F.; Wu, X.; Xu, P.; Yu, L.; Zhu, S. A Newly Developed Unmanned Aerial Vehicle (UAV) Imagery BasedTechnology for Field Measurement of Water Level. Water 2019, 11, 124. [CrossRef]
70. Bandini, F.; Jakobsen, J.; Olesen, D.H.; Reyna-Gutierrez, J.A.; Bauer-Gottwein, P. Measuring water level in rivers and lakes fromlightweight Unmanned Aerial Vehicles. J. Hydrol. 2017, 548, 237–250. [CrossRef]
71. Bandini, F.; Sunding, T.P.; Linde, J.; Smith, O.; Jensen, I.K.; Köppl, C.J.; Butts, M.; Bauer-Gottwein, P. Unmanned Aerial System(UAS) observations of water surface elevation in a small stream: Comparison of radar altimetry, LIDAR and photogrammetrytechniques. Remote Sens. Environ. 2020, 237, 111487. [CrossRef]
72. Jiang, L.; Bandini, F.; Smith, O.; Jensen, I.K.; Bauer-Gottwein, P. The Value of Distributed High-Resolution UAV-Borne Observationsof Water Surface Elevation for River Management and Hydrodynamic Modeling. Remote Sens. 2020, 12, 1171. [CrossRef]
73. Tymków, P.; Józków, G.; Walicka, A.; Karpina, M.; Borkowski, A. Identification of Water Body Extent Based on Remote SensingData Collected with Unmanned Aerial Vehicle. Water 2019, 11, 338. [CrossRef]
74. Niedzielski, T.; Witek, M.; Spallek, W. Observing river stages using unmanned aerial vehicles. Hydrol. Earth Syst. Sci. 2016, 20,3193–3205. [CrossRef]
75. García-López, S.; Ruiz-Ortiz, V.; Barbero, L.; Sánchez-Bellón, Á. Contribution of the UAS to the determination of the water budgetin a coastal wetland: A case study in the natural park of the Bay of Cádiz (SW Spain). Eur. J. Remote Sens. 2018, 51, 965–977.[CrossRef]
76. Mohamad, N.; Khanan, M.F.A.; Ahmad, A.; Din, A.H.M.; Shahabi, H. Evaluating Water Level Changes at Different Tidal PhasesUsing UAV Photogrammetry and GNSS Vertical Data. Sensors 2019, 19, 3778. [CrossRef]
77. Yucel, M.A.; Turan, R.Y. Areal Change Detection and 3D Modeling of Mine Lakes Using High-Resolution Unmanned AerialVehicle Images. Arab. J. Sci. Eng. 2016, 41, 4867–4878. [CrossRef]
78. McGlynn, B.L.; Blöschl, G.; Borga, M.; Bormann, H.; Hurkmans, R.; Komma, J.; Nandagiri, L.; Uijlenhoet, R.; Wagener, T. A DataAcquisition Framework for Runoff Prediction in Ungauged Basins, Runoff Prediction in Ungauged Basins; Cambridge University Press:Cambridge, UK, 2013. [CrossRef]
79. Mishra, A.K.; Coulibaly, P. Developments in hydrometric network design: A review. Rev. Geophys. 2009, 47. [CrossRef]80. Sichangi, A.W.; Wang, L.; Yang, K.; Chen, D.; Wang, Z.; Li, X.; Zhou, J.; Liu, W.; Kuria, D. Estimating continental river basin
discharges using multiple remote sensing data sets. Remote Sens. Environ. 2016, 179, 36–53. [CrossRef]81. Sneeuw, N.; Lorenz, C.; Devaraju, B.; Tourian, M.J.; Riegger, J.; Kunstmann, H.; Bárdossy, A. Estimating Runoff Using Hydro-
Geodetic Approaches. Surv. Geophys. 2014, 35, 1333–1359. [CrossRef]82. Yang, S.; Wang, J.; Wang, P.; Gong, T.; Liu, H. Low Altitude Unmanned Aerial Vehicles (UAVs) and Satellite Remote Sensing
Are Used to Calculated River Discharge Attenuation Coefficients of Ungauged Catchments in Arid Desert. Water 2019, 11, 2633.[CrossRef]
83. Yang, S.; Wang, P.; Lou, H.; Wang, J.; Zhao, C.; Gong, T. Estimating River Discharges in Ungauged Catchments Using theSlope–Area Method and Unmanned Aerial Vehicle. Water 2019, 11, 2361. [CrossRef]
84. Lou, H.; Wang, P.; Yang, S.; Hao, F.; Ren, X.; Wang, Y.; Shi, L.; Wang, J.; Gong, T. Combining and Comparing an Unmanned AerialVehicle and Multiple Remote Sensing Satellites to Calculate Long-Term River Discharge in an Ungauged Water Source Region onthe Tibetan Plateau. Remote Sens. 2020, 12, 2155. [CrossRef]
85. Koutalakis, P.; Tzoraki, O.; Zaimes, G. UAVs for Hydrologic Scopes: Application of a Low-Cost UAV to Estimate Surface WaterVelocity by Using Three Different Image-Based Methods. Drones 2019, 3, 14. [CrossRef]
86. Pearce, S.; Ljubicic, R.; Peña-Haro, S.; Perks, M.; Tauro, F.; Pizarro, A.; Sasso, S.F.D.; Strelnikova, D.; Grimaldi, S.; Maddock, I.;et al. An Evaluation of Image Velocimetry Techniques under Low Flow Conditions and High Seeding Densities Using UnmannedAerial Systems. Remote Sens. 2020, 12, 232. [CrossRef]
87. Tauro, F.; Pagano, C.; Phamduy, P.; Grimaldi, S.; Porfiri, M. Large-Scale Particle Image Velocimetry From an Unmanned AerialVehicle. IEEE/ASME Trans. Mechatronics 2015, 20, 3269–3275. [CrossRef]
88. Tauro, F.; Porfiri, M.; Grimaldi, S. Surface flow measurements from drones. J. Hydrol. 2016, 540, 240–245. [CrossRef]89. Lewis, Q.W.; Lindroth, E.M.; Rhoads, B.L. Integrating unmanned aerial systems and LSPIV for rapid, cost-effective stream
gauging. J. Hydrol. 2018, 560, 230–246. [CrossRef]90. Sasso, S.F.D.; Pizarro, A.; Manfreda, S. Metrics for the Quantification of Seeding Characteristics to Enhance Image Velocimetry
Performance in Rivers. Remote Sens. 2020, 12, 1789. [CrossRef]91. Thumser, P.; Haas, C.; Tuhtan, J.A.; Fuentes-Pérez, J.F.; Toming, G. RAPTOR-UAV: Real-time particle tracking in rivers using an
unmanned aerial vehicle. Earth Surf. Process. Landf. 2017, 42, 2439–2446. [CrossRef]92. Fulton, J.; Anderson, I.; Chiu, C.-L.; Sommer, W.; Adams, J.; Moramarco, T.; Bjerklie, D.; Fulford, J.; Sloan, J.; Best, H.; et al. QCam:
sUAS-Based Doppler Radar for Measuring River Discharge. Remote Sens. 2020, 12, 3317. [CrossRef]93. Dyer, J.L.; Moorhead, R.J.; Hathcock, L. Identification and Analysis of Microscale Hydrologic Flood Impacts Using Unmanned
Aerial Systems. Remote Sens. 2020, 12, 1549. [CrossRef]94. Mourato, S.; Fernandez, P.; Pereira, L.; Moreira, M. Improving a DSM Obtained by Unmanned Aerial Vehicles for Flood Modelling.
IOP Conf. Series: Earth Environ. Sci. 2017, 95, 022014. [CrossRef]95. Muthusamy, M.; Casado, M.R.; Salmoral, G.; Irvine, T.; Leinster, P. A Remote Sensing Based Integrated Approach to Quantify the
Impact of Fluvial and Pluvial Flooding in an Urban Catchment. Remote Sens. 2019, 11, 577. [CrossRef]

Remote Sens. 2021, 13, 1359 39 of 42
96. Serban, G.; Rus, I.; Vele, D.; Bretcan, P.; Alexe, M.; Petrea, D. Flood-prone area delimitation using UAV technology, in the areashard-to-reach for classic aircrafts: Case study in the north-east of Apuseni Mountains, Transylvania. Nat. Hazards 2016, 82,1817–1832. [CrossRef]
97. Yalcin, E. Two-dimensional hydrodynamic modelling for urban flood risk assessment using unmanned aerial vehicle imagery: Acase study of Kirsehir, Turkey. J. Flood Risk Manag. 2018, 12, e12499. [CrossRef]
98. Özcan, O. Multi-temporal UAV based repeat monitoring of rivers sensitive to flood. J. Maps 2020, 1–8. [CrossRef]99. Diakakis, M.; Andreadakis, E.; Nikolopoulos, E.; Spyrou, N.; Gogou, M.; Deligiannakis, G.; Katsetsiadou, N.; Antoniadis,
Z.; Melaki, M.; Georgakopoulos, A.; et al. An integrated approach of ground and aerial observations in flash flood disasterinvestigations. The case of the 2017 Mandra flash flood in Greece. Int. J. Disaster Risk Reduct. 2019, 33, 290–309. [CrossRef]
100. Leitão, J.P.; De Vitry, M.M.; Scheidegger, A.; Rieckermann, J. Assessing the quality of digital elevation models obtained from miniunmanned aerial vehicles for overland flow modelling in urban areas. Hydrol. Earth Syst. Sci. 2016, 20, 1637–1653. [CrossRef]
101. Hashemi-Beni, L.; Jones, J.; Thompson, G.; Johnson, C.; Gebrehiwot, A. Challenges and Opportunities for UAV-Based DigitalElevation Model Generation for Flood-Risk Management: A Case of Princeville, North Carolina. Sensors 2018, 18, 3843. [CrossRef]
102. Schumann, G.J.P.; Muhlhausen, J.; Andreadis, K.M. Rapid mapping of small-scale river-floodplain environments using UAV SfMsupports classical theory. Remote Sens. 2019, 11, 982. [CrossRef]
103. Annis, A.; Nardi, F.; Petroselli, A.; Apollonio, C.; Arcangeletti, E.; Tauro, F.; Belli, C.; Bianconi, R.; Grimaldi, S. UAV-DEMs forSmall-Scale Flood Hazard Mapping. Water 2020, 12, 1717. [CrossRef]
104. Villanueva, J.R.E.; Martínez, L.I.; Montiel, J.I.P. DEM Generation from Fixed-Wing UAV Imaging and LiDAR-Derived GroundControl Points for Flood Estimations. Sensors 2019, 19, 3205. [CrossRef] [PubMed]
105. Tamminga, A.D.; Eaton, B.C.; Hugenholtz, C.H. UAS-based remote sensing of fluvial change following an extreme flood event.Earth Surf. Process. Landf. 2015, 40, 1464–1476. [CrossRef]
106. Abdelkader, M.; Shaqura, M.; Claudel, C.G.; Gueaieb, W. A UAV based system for real time flash flood monitoring in desertenvironments using Lagrangian microsensors. In Proceedings of the 2013 International Conference on Unmanned AircraftSystems (ICUAS), Atlanta, GA, USA, 28–31 May 2013; pp. 25–34.
107. Popescu, D.; Ichim, L.; Stoican, F. Unmanned Aerial Vehicle Systems for Remote Estimation of Flooded Areas Based on ComplexImage Processing. Sensors 2017, 17, 446. [CrossRef]
108. Gebrehiwot, A.; Hashemi-Beni, L.; Thompson, G.; Kordjamshidi, P.; Langan, T.E. Deep Convolutional Neural Network for FloodExtent Mapping Using Unmanned Aerial Vehicles Data. Sensors 2019, 19, 1486. [CrossRef]
109. Jakovljevic, G.; Govedarica, M.; Alvarez-Taboada, F.; Pajic, V. Accuracy Assessment of Deep Learning Based Classification ofLiDAR and UAV Points Clouds for DTM Creation and Flood Risk Mapping. Geosciences 2019, 9, 323. [CrossRef]
110. Erdelj, M.; Natalizio, E.; Chowdhury, K.R.; Akyildiz, I.F. Help from the Sky: Leveraging UAVs for Disaster Management. IEEEPervasive Comput. 2017, 16, 24–32. [CrossRef]
111. Salmoral, G.; Casado, M.R.; Muthusamy, M.; Butler, D.; Menon, P.P.; Leinster, P. Guidelines for the Use of Unmanned AerialSystems in Flood Emergency Response. Water 2020, 12, 521. [CrossRef]
112. Kastridis, A.; Kirkenidis, C.; Sapountzis, M. An integrated approach of flash flood analysis in ungauged Mediterranean watershedsusing post-flood surveys and unmanned aerial vehicles. Hydrol. Process. 2020, 34, 4920–4939. [CrossRef]
113. Handcock, R.N.; Torgersen, C.E.; Cherkauer, K.A.; Gillespie, A.R.; Tockner, K.; Faux, R.N.; Tan, J. Thermal Infrared RemoteSensing of Water Temperature in Riverine Landscapes. Fluv. Remote Sens. Sci. Manag. 2012, 1, 85–113. [CrossRef]
114. Jensen, A.M.; Neilson, B.T.; McKee, M.; Chen, Y. Thermal remote sensing with an autonomous unmanned aerial remote sensingplatform for surface stream temperatures. 2012 IEEE Int. Geosci. Remote Sens. Symp. 2012, 5049–5052. [CrossRef]
115. Wawrzyniak, V.; Piégay, H.; Allemand, P.; Vaudor, L.; Grandjean, P. Prediction of water temperature heterogeneity of braidedrivers using very high resolution thermal infrared (TIR) images. Int. J. Remote Sens. 2013, 34, 4812–4831. [CrossRef]
116. Kelly, J.; Kljun, N.; Olsson, P.-O.; Mihai, L.; Liljeblad, B.; Weslien, P.; Klemedtsson, L.; Eklundh, L. Challenges and Best Practicesfor Deriving Temperature Data from an Uncalibrated UAV Thermal Infrared Camera. Remote Sens. 2019, 11, 567. [CrossRef]
117. Chung, M.; Detweiler, C.; Hamilton, M.; Higgins, J.; Ore, J.-P.; Thompson, S. Obtaining the Thermal Structure of Lakes from theAir. Water 2015, 7, 6467–6482. [CrossRef]
118. Koparan, C.; Koc, A.B.; Sawyer, C.; Privette, C. Temperature Profiling of Waterbodies with a UAV-Integrated Sensor Subsystem.Drones 2020, 4, 35. [CrossRef]
119. Demario, A.; Lopez, P.; Plewka, E.; Wix, R.; Xia, H.; Zamora, E.; Gessler, D.; Yalin, A.P. Water Plume Temperature Measurementsby an Unmanned Aerial System (UAS). Sensors 2017, 17, 306. [CrossRef] [PubMed]
120. Caldwell, S.; Kelleher, C.; Baker, E.; Lautz, L. Relative information from thermal infrared imagery via unoccupied aerial vehicleinforms simulations and spatially-distributed assessments of stream temperature. Sci. Total. Environ. 2019, 661, 364–374.[CrossRef]
121. Powers, C.; Hanlon, R.; Schmale, D. Tracking of a Fluorescent Dye in a Freshwater Lake with an Unmanned Surface Vehicle andan Unmanned Aircraft System. Remote Sens. 2018, 10, 81. [CrossRef]
122. Baek, D.; Seo, I.W.; Kim, J.S.; Nelson, J.M. UAV-based measurements of spatio-temporal concentration distributions of fluorescenttracers in open channel flows. Adv. Water Resour. 2019, 127, 76–88. [CrossRef]
123. Legleiter, C.J.; McDonald, R.R.; Nelson, J.M.; Kinzel, P.J.; Perroy, R.L.; Baek, D.; Seo, I.W. Remote sensing of tracer dyeconcentrations to support dispersion studies in river channels. J. Ecohydraulics 2019, 4, 131–146. [CrossRef]

Remote Sens. 2021, 13, 1359 40 of 42
124. Martin, C.; Parkes, S.; Zhang, Q.; Zhang, X.; McCabe, M.F.; Duarte, C.M. Use of unmanned aerial vehicles for efficient beach littermonitoring. Mar. Pollut. Bull. 2018, 131, 662–673. [CrossRef] [PubMed]
125. Fallati, L.; Polidori, A.; Salvatore, C.; Saponari, L.; Savini, A.; Galli, P. Anthropogenic Marine Debris assessment with UnmannedAerial Vehicle imagery and deep learning: A case study along the beaches of the Republic of Maldives. Sci. Total Environ. 2019,693, 133581. [CrossRef] [PubMed]
126. Kako, S.; Morita, S.; Taneda, T. Estimation of plastic marine debris volumes on beaches using unmanned aerial vehicles andimage processing based on deep learning. Mar. Pollut. Bull. 2020, 155, 111127. [CrossRef]
127. Geraeds, M.; Van Emmerik, T.; De Vries, R.; Bin Ab Razak, M.S. Riverine Plastic Litter Monitoring Using Unmanned AerialVehicles (UAVs). Remote Sens. 2019, 11, 2045. [CrossRef]
128. Jakovljevic, G.; Govedarica, M.; Alvarez-Taboada, F. A Deep Learning Model for Automatic Plastic Mapping Using UnmannedAerial Vehicle (UAV) Data. Remote Sens. 2020, 12, 1515. [CrossRef]
129. Hengstmann, E.; Fischer, E.K. Anthropogenic litter in freshwater environments—Study on lake beaches evaluating marineguidelines and aerial imaging. Environ. Res. 2020, 189, 109945. [CrossRef]
130. Wurtsbaugh, W.A.; Paerl, H.W.; Dodds, W.K. Nutrients, eutrophication and harmful algal blooms along the freshwater to marinecontinuum. Wiley Interdiscip. Rev. Water 2019, 6. [CrossRef]
131. Fráter, T.; Juzsakova, T.; Lauer, J.; Dióssy, L.; Rédey, Á. Unmanned Aerial Vehicles in Environmental Monitoring—An EfficientWay for Remote Sensing. J. Environ. Sci. Eng. A 2015, 4, 85–91. [CrossRef]
132. Ngo, A.S.K.; Desingco, J.D.B.; Ii, M.O.C.; Uy, R.L.; Ong, P.M.B.; Punzalan, E.R.; Ilao, J.P. Determining the Correlation betweenConcentration Levels and the Visual Determining the Correlation Between Concentration Levels and the Visual Features of Algaein Water Surfaces. 2015. Available online: https://www.researchgate.net/publication/283086583_Determining_the_Correlation_Between_Concentration_Levels_and_the_Visual_Features_of_Algae_in_Water_Surfaces (accessed on 30 November 2020).
133. Van Der Merwe, D.; Price, K.P. Harmful Algal Bloom Characterization at Ultra-High Spatial and Temporal Resolution UsingSmall Unmanned Aircraft Systems. Toxins 2015, 7, 1065–1078. [CrossRef] [PubMed]
134. Su, T.-C.; Chou, H.-T. Application of Multispectral Sensors Carried on Unmanned Aerial Vehicle (UAV) to Trophic State Mappingof Small Reservoirs: A Case Study of Tain-Pu Reservoir in Kinmen, Taiwan. Remote Sens. 2015, 7, 10078–10097. [CrossRef]
135. Jang, S.W.; Yoon, H.J.; Kwak, S.N.; Sohn, B.Y.; Kim, S.G.; Kim, D.H. Algal Bloom Monitoring using UAVs Imagery. Next Gener.Comput. Inf. Technol. 2016, 138, 30–33. [CrossRef]
136. Aguirre-Gómez, R.; Salmerón-García, O.; Gómez-Rodríguez, G.; Peralta-Higuera, A. Use of unmanned aerial vehicles and remotesensors in urban lakes studies in Mexico. Int. J. Remote Sens. 2016, 38, 2771–2779. [CrossRef]
137. Salarux, C.; Kaewplang, S. Estimation of Algal Bloom Biomass Using UAV-Based Remote Sensing with NDVI and GRVI.Mahasarakham Int. J. Eng. Technol. 2020, 6, 1–6.
138. Honkavaara, E.; Hakala, T.; Kirjasniemi, J.; Lindfors, A.; Mäkynen, J.; Nurminen, K.; Ruokokoski, P.; Saari, H.; Markelin, L. Newlight-weight stereosopic spectrometric airborne imaging technology for high-resolution environmental remote sensing; casestudies in water quality mapping. ISPRS Int. Arch. Photogramm. Remote Sens. Spat. Inf. Sci. 2013, XL-1/W1, 139–144. [CrossRef]
139. Becker, R.H.; Sayers, M.; Dehm, D.; Shuchman, R.; Quintero, K.; Bosse, K.; Sawtell, R. Unmanned aerial system based spectrora-diometer for monitoring harmful algal blooms: A new paradigm in water quality monitoring. J. Great Lakes Res. 2019, 45, 444–453.[CrossRef]
140. Penmetcha, M.; Luo, S.; Samantaray, A.; DIetz, J.E.; Yang, B.; Min, B.C. Computer vision-based algae removal planner formulti-robot teams. In Proceedings of the 2019 IEEE International Conference on Systems, Man and Cybernetics (SMC), Bari, Italy,6–9 October 2019; pp. 1575–1581. [CrossRef]
141. Kwon, Y.S.; Pyo, J.; Duan, H.; Cho, K.H.; Park, Y. Drone-based hyperspectral remote sensing of cyanobacteria using verticalcumulative pigment concentration in a deep reservoir. Remote Sens. Environ. 2020, 236, 111517. [CrossRef]
142. Zhang, Y.; Wu, L.; Ren, H.; Liu, Y.; Zheng, Y.; Liu, Y.; Dong, J. Mapping Water Quality Parameters in Urban Rivers fromHyperspectral Images Using a New Self-Adapting Selection of Multiple Artificial Neural Networks. Remote Sens. 2020, 12, 336.[CrossRef]
143. Ore, J.P.; Elbaum, S.; Burgin, A.; Detweiler, C. Autonomous aerial water sampling. In Field and Service Robotics; Mejias, L., Corke,P., Roberts, J., Eds.; Springer International Publishing: Cham, Switzerland, 2015; pp. 137–151.
144. Detweiler, C.; Ore, J.-P.; Anthony, D.; Elbaum, S.; Burgin, A.J.; Lorenz, A. Environmental Reviews and Case Studies: BringingUnmanned Aerial Systems Closer to the Environment. Environ. Pract. 2015, 17, 188–200. [CrossRef]
145. Schwarzbach, M.; Laiacker, M.; Mulero-Pazmany, M.; Kondak, K. Remote water sampling using flying robots. In Proceedingsof the 2014 International conference on unmanned aircraft systems (ICUAS), Orlando, FL, USA, 27–30 May 2014; pp. 72–76.[CrossRef]
146. Terada, A.; Morita, Y.; Hashimoto, T.; Mori, T.; Ohba, T.; Yaguchi, M.; Kanda, W. Water sampling using a drone at Yugama craterlake, Kusatsu-Shirane volcano, Japan. Earth Planets Space 2018, 70, 64. [CrossRef]
147. Song, K.; Brewer, A.; Ahmadian, S.; Shankar, A.; Detweiler, C.; Burgin, A.J. Using unmanned aerial vehicles to sample aquaticecosystems. Limnol. Oceanogr. Methods 2017, 15, 1021–1030. [CrossRef]
148. Elijah, O.; Rahman, T.A.; Leow, C.Y.; Yeen, H.C.; Sarijari, M.A.; Aris, A.; Salleh, J.; Chua, T.H. A concept paper on smart rivermonitoring system for sustainability in river. Int. J. Integr. Eng. 2018, 10, 130–139. [CrossRef]
Remote Sens. 2021, 13, 1359 41 of 42
149. Koparan, C.; Koc, A.B.; Privette, C.V.; Sawyer, C.B. In Situ Water Quality Measurements Using an Unmanned Aerial Vehicle(UAV) System. Water 2018, 10, 264. [CrossRef]
150. Esakki, B.; Ganesan, S.; Mathiyazhagan, S.; Ramasubramanian, K.; Gnanasekaran, B.; Son, B.; Park, S.W.; Choi, J.S. Designof Amphibious Vehicle for Unmanned Mission in Water Quality Monitoring Using Internet of Things. Sensors 2018, 18, 3318.[CrossRef]
151. Doi, H.; Akamatsu, Y.; Watanabe, Y.; Goto, M.; Inui, R.; Katano, I.; Nagano, M.; Takahara, T.; Minamoto, T. Water sampling forenvironmental DNA surveys by using an unmanned aerial vehicle. Limnol. Oceanogr. Methods 2017, 15, 939–944. [CrossRef]
152. Banerjee, B.; Raval, S.; Maslin, T.J.; Timms, W. Development of a UAV-mounted system for remotely collecting mine watersamples. Int. J. Mining Reclam. Environ. 2018, 34, 385–396. [CrossRef]
153. Castendyk, D.; Straight, B.; Flllatreault, P.; Thlbeault, S.; Cameron, L. Aerial drones used to sample pit lake water reduce costsand improve safety. Miner. Eng. 2017, 69, 20–28.
154. Castendyk, D.; Straight, B.; Voorhis, J.; Somogyi, M.; Jepson, W.; Kucera, B. Using aerial drones to select sample depths in pitlakes. In Proceedings of the 13th International Conference on Mine Closure, Perth, Australia, 3–5 September 2019; pp. 1113–1126.[CrossRef]
155. Jung, S.; Cho, H.; Kim, N.; Kim, K.; Han, J.-I.; Myung, H. Development of Algal Bloom Removal System Using Unmanned AerialVehicle and Surface Vehicle. IEEE Access 2017, 5, 22166–22176. [CrossRef]
156. Agarwal, P.; Singh, M.K. A multipurpose drone for water sampling video surveillance. In Proceedings of the 2019 SecondInternational Conference on Advanced Computational and Communication Paradigms (ICACCP), Gangtok, India, 25–28February 2019; pp. 1–5. [CrossRef]
157. Grandy, J.J.; Galpin, V.; Singh, V.; Pawliszyn, J. Development of a Drone-Based Thin-Film Solid-Phase Microextraction WaterSampler to Facilitate On-Site Screening of Environmental Pollutants. Anal. Chem. 2020, 92, 12917–12924. [CrossRef] [PubMed]
158. Lally, H.; O’Connor, I.; Jensen, O.; Graham, C. Can drones be used to conduct water sampling in aquatic environments? A review.Sci. Total Environ. 2019, 670, 569–575. [CrossRef] [PubMed]
159. Abolt, C.; Caldwell, T.; Wolaver, B.; Pai, H. Unmanned aerial vehicle-based monitoring of groundwater inputs to surface watersusing an economical thermal infrared camera. Opt. Eng. 2018, 57, 053113. [CrossRef]
160. Harvey, M.C.; Hare, D.K.; Hackman, A.; Davenport, G.; Haynes, A.B.; Helton, A.; Lane, J.J.W.; Briggs, M.A. Evaluation of Streamand Wetland Restoration Using UAS-Based Thermal Infrared Mapping. Water 2019, 11, 1568. [CrossRef]
161. Casas-Mulet, R.; Pander, J.; Ryu, D.; Stewardson, M.J.; Geist, J. Unmanned Aerial Vehicle (UAV)-Based Thermal Infra-Red (TIR)and Optical Imagery Reveals Multi-Spatial Scale Controls of Cold-Water Areas Over a Groundwater-Dominated Riverscape.Front. Environ. Sci. 2020, 8, 1–16. [CrossRef]
162. Rautio, A.; Korkka-Niemi, K.; Salonen, V.-P. Thermal Infrared Remote Sensing in Assessing Ground/Surface Water Resources Related tothe Hannukainen Mining Development Site; Mine Water and Circular Economy IMWA: Lappeenranta, Finland, 2017.
163. Bandini, F.; Butts, M.; Jacobsen, T.V.; Bauer-Gottwein, P. Water level observations from unmanned aerial vehicles for improvingestimates of surface water-groundwater interaction. Hydrol. Process. 2017, 31, 4371–4383. [CrossRef]
164. Tang, Q.; Schilling, O.S.; Kurtz, W.; Brunner, P.; Vereecken, H.; Franssen, H.-J.H. Simulating Flood-Induced Riverbed TransienceUsing Unmanned Aerial Vehicles, Physically Based Hydrological Modeling, and the Ensemble Kalman Filter. Water Resour. Res.2018, 54, 9342–9363. [CrossRef]
165. Briggs, M.A.; Wang, C.; Day-Lewis, F.D.; Williams, K.H.; Dong, W.; Lane, J.W. Return flows from beaver ponds enhancefloodplain-to-river metals exchange in alluvial mountain catchments. Sci. Total Environ. 2019, 685, 357–369. [CrossRef]
166. Furlan, L.M.; Rosolen, V.; Salles, J.; Moreira, C.A.; Ferreira, M.E.; Bueno, G.T.; Coelho, C.V.D.S.; Mounier, S. Natural superficialwater storage and aquifer recharge assessment in Brazilian savanna wetland using unmanned aerial vehicle and geophysicalsurvey. J. Unmanned Veh. Syst. 2020, 8, 224–244. [CrossRef]
167. Siebert, C.; Mallast, U.; Rödiger, T.; Ionescu, D.; Schwonke, F.; Hall, J.K.; Sade, A.R.; Pohl, T.; Merkel, B. Multiple sensor tracking ofsubmarine groundwater discharge: Concept study along the Dead Sea. In Proceedings of the EGU General Assembly ConferenceAbstracts, Vienna, Austria, 24 April–2 May 2014; p. 11217.
168. Lee, E.; Yoon, H.; Hyun, S.P.; Burnett, W.C.; Koh, D.; Ha, K.; Kim, D.; Kim, Y.; Kang, K. Unmanned aerial vehicles (UAVs)-basedthermal infrared (TIR) mapping, a novel approach to assess groundwater discharge into the coastal zone. Limnol. Oceanogr.Methods 2016, 14, 725–735. [CrossRef]
169. Rahman, M.M.; McDermid, G.J.; Strack, M.; Lovitt, J. A New Method to Map Groundwater Table in Peatlands Using UnmannedAerial Vehicles. Remote Sens. 2017, 9, 1057. [CrossRef]
170. Bandini, F.; Lopez-Tamayo, A.; Merediz-Alonso, G.; Olesen, D.; Jakobsen, J.; Wang, S.; Garcia, M.; Bauer-Gottwein, P. Unmannedaerial vehicle observations of water surface elevation and bathymetry in the cenotes and lagoons of the Yucatan Peninsula,Mexico. Hydrogeol. J. 2018, 26, 2213–2228. [CrossRef]
171. Allred, B.; Eash, N.; Freeland, R.; Martinez, L.; Wishart, D. Effective and efficient agricultural drainage pipe mapping with UASthermal infrared imagery: A case study. Agric. Water Manag. 2018, 197, 132–137. [CrossRef]
172. Kratt, C.; Woo, D.; Johnson, K.; Haagsma, M.; Kumar, P.; Selker, J.; Tyler, S. Field trials to detect drainage pipe networks usingthermal and RGB data from unmanned aircraft. Agric. Water Manag. 2020, 229, 105895. [CrossRef]
173. Levy, M.C.; Neely, W.R.; Borsa, A.A.; Burney, J.A. Fine-scale spatiotemporal variation in subsidence across California’s SanJoaquin Valley explained by groundwater demand. Environ. Res. Lett. 2020, 15, 104083. [CrossRef]

Remote Sens. 2021, 13, 1359 42 of 42
174. Nayyeri, M.; Hosseini, S.A.; Javadi, S.; Sharafati, A. Spatial Differentiation Characteristics of Groundwater Stress Index and itsRelation to Land Use and Subsidence in the Varamin Plain, Iran. Nat. Resour. Res. 2021, 30, 339–357. [CrossRef]
175. Yu, H.; Gong, H.; Chen, B.; Liu, K.; Gao, M. Analysis of the influence of groundwater on land subsidence in Beijing based on thegeographical weighted regression (GWR) model. Sci. Total Environ. 2020, 738, 139405. [CrossRef]
176. Carlson, G.; Carnes, L.K.; Cook, J.P. Exploring Arizona earth fissures: An anthropogenic geologic hazard. GSA Annu. Meet.Phoenix Ariz. 2019, 55, 115–126. [CrossRef]
177. Hu, X.; Li, X. Information extraction of subsided cultivated land in high-groundwater-level coal mines based on unmanned aerialvehicle visible bands. Environ. Earth Sci. 2019, 78. [CrossRef]
178. Hu, X.; Li, X.; Min, X.; Niu, B. Optimal scale extraction of farmland in coal mining areas with high groundwater levels based onvisible light images from an unmanned aerial vehicle (UAV). Earth Sci. Inform. 2020, 13, 1151–1162. [CrossRef]
179. Commission Implementing Regulation (EU) 2019/947 of 24 May 2019 on the Rules and Procedures for the Operation of UnmannedAircraft. Available online: http://data.europa.eu/eli/reg_impl/2019/947/oj (accessed on 30 November 2020).