applications of visible and near infrared spectroscopy for ... · applications of visible and near...
TRANSCRIPT
Applications of Visible and Near Infrared
Spectroscopy for Sorting and
Identification of Tree Seeds
Mostafa Farhadi Faculty of Forest Sciences
Southern Swedish Forest Research Centre
Alnarp
Doctoral Thesis
Swedish University of Agricultural Sciences
Alnarp 2015
Acta Universitatis agriculturae Sueciae
2015:103
ISSN 1652-6880
ISBN (print version) 978-91-576-8404-2
ISBN (electronic version) 978-91-576-8405-9
© 2015 Mostafa Farhadi, Alnarp
Print: SLU Service/Repro, Alnarp 2015
Cover: Raw average reflectance spectra of hybrid larch seeds in the NIR region
showing absorption peaks and molecular moieties responsible for absorption of the
NIR radiation on the background of hybrid larch seed lot
(photo: Mostafa Farhadi)

Applications of Visible and NIR Spectroscopy for Sorting and
Identification of Tree Seeds
Abstract
Seeds are the most commonly used regeneration material for reforestation purpose;
hence interest in “precision sowing” among nurseries is high due to the high cost of
containerized seedling production. In addition, the increased interest in growing hybrid
larch in commercial forestry has raised concerns about the purity of hybrid larch seed
lots, as there are large proportions of pure parental seeds mixed with hybrid larch seed
lots. The aims of the studies presented in this thesis were to evaluate the application of
visible (Vis) and/or near infrared (NIR) spectroscopy combined with multivariate
modelling for sorting filled-viable, empty and petrified seeds of Larix sibirica Ledeb.,
verification of hybrid larch, Larix × eurolepis Henry seeds, identification of seeds of
Betula pendula Roth and Betula pubescens Ehrh., and authentication of the origin of
Picea abies (L.) Karst seed lots. For these purposes, reflectance spectra were recorded
on single seeds using XDS Rapid Content Analyzer (FOSS NIRSystems, Inc.) from
400 – 2500 nm with a resolution of 0.5 nm, and multivariate classification models were
developed. The results showed that filled-viable, empty and petrified seeds of L.
sibirica can be sorted with 98%, 82% and 87% accuracies, respectively. When the seed
lot was sorted into viable and non-viable (empty and petrified combined) classes, the
predicted class membership reached 100% for both classes. The technique could
separate the hybrid larch seeds from pure parental seeds with 100% accuracy. Seeds of
B. pubescens and B. pendula were differentiated with 100% and 99% classification
accuracy, respectively. Also, the overall classification accuracy among three B. pendula
families was 93% and that of B. pubescens was 98%. NIR spectroscopy discriminated
Swedish, Finnish, Norwegian, Polish and Lithuanian seed lots of P. abies with 92% -
100% accuracy. Absorption bands that were accounted for distinguishing the various
seed lots examined in this thesis were attributed to differences in seed colour, moisture
content and chemical composition of the seeds, presumably polysaccharides, proteins
and fatty acids, which are the common seed storage reserves. The findings demonstrate
the feasibility of Vis + NIR spectroscopy as a robust technique for sorting seed lots
according to their viability and for certification of seed lots by species and origin. Thus,
concerted efforts should be made to scale-up the technique to on-line sorting system for
large-scale tree seed handling operations.
Keywords: seed quality, near infrared spectroscopy, multivariate analysis, signal pre-
processing, Siberian larch, hybrid larch, silver birch, downy birch, Norway spruce
Author’s address: Mostafa Farhadi, SLU, Southern Swedish Forest Research Centre,
P.O. Box 49, 230 53 Alnarp, Sweden
E-mail: [email protected]; [email protected]

Dedication
To my father and mother
To my wife, Tahmineh
and
To my cute daughter, Paniz
No honor is like knowledge and no aid is like consulting with wise friends.
Imam Ali (AS)

Contents
List of Publications 7
Abbreviations 9
1 Introduction 11 1.1 Seed sorting systems 11 1.2 Verification of species 13 1.3 Near Infrared Spectroscopy 15
1.3.1 Location in Electromagnetic Spectrum 15 1.3.2 Historical overview 16 1.3.3 Theory and Basics 17 1.3.4 Computation of Absorbance values 21 1.3.5 Basic instrumentation 22
1.4 Multivariate analysis of NIR spectra 24 1.4.1 Spectral pre-processing 24 1.4.2 Principal component analysis 27 1.4.3 Projection to Latent Structures – Discriminant Analysis 31 1.4.4 Orthogonal Projections to Latent Structures – Discriminant
Analysis 35
2 Objectives 37
3 Material and methods 39 3.1 Tree species, seed samples and preparation 39 3.2 NIR spectral acquisition 41 3.3 Data analysis 41
4 Results and Discussion 45 4.1 Discrimination of Larix sibirica seed lots according to viability class 45 4.2 Identification of hybrid larch seeds 50 4.3 Discrimination between two birch species and their families 55 4.4 Authentication of putative origin of P. abies seed lots 62
5 Conclusion and Recommendations 71
References 73

Acknowledgments 83
7
List of Publications
This thesis is based on the work contained in the following papers, referred to
by Roman numerals in the text:
I Farhadi M., Tigabu M., Odén P.C. (2015). Near Infrared Spectroscopy as
non-destructive method for sorting viable, petrified and empty seeds of
Larix sibirica. Silva Fennica 49, article id 1340, 12p.
II Farhadi M., Tigabu M., Stener L-G., Odén P.C. (2015). Feasibility of Vis +
NIR spectroscopy for non-destructive verification of European × Japanese
larch hybrid seeds. New Forests. Published On-line
(http://dx.doi.org/10.1007/s11056-015-9514-4).
III Farhadi M., Tigabu M., Stener L-G., Odén P.C. Multivariate discriminant
modelling of Visible + Near infrared spectra of single seeds differentiates
between two birch species and their families (Submitted manuscript).
IV Farhadi M., Tigabu M., Odén P.C. Authentication of Picea abies Seed
Origins by Near Infrared Spectroscopy and Multivariate Classification
Modelling (Submitted manuscript).
Papers I and II are reproduced with the permission of the publishers.

8
The contribution of Mostafa Farhadi to the papers included in this thesis was as
follows:
I Mulualem Tigabu initiated and developed the idea. I performed the
experiment, analysed the data and wrote the manuscript with great critical
help and revision from the co-authors. My overall participation was 80%.
II Mulualem Tigabu initiated and developed the idea. I performed the
experiment, analysed the data and wrote the manuscript with valuable
input from the co-authors. The overall contribution by me was 80%.
III Lars-Göran Stener initiated the idea; Mulualem Tigabu and I designed the
study. I performed the experiment, analysed the data and wrote the
manuscript with critical input from the co-authors. My overall contribution
was 80%.
IV Mulualem Tigabu initiated and developed the idea and planned the
experiment. I performed the experiment, analysed the data and wrote the
manuscript together with the co-authors. My overall contribution was 80%.

9
Abbreviations
AOTF Acousto-Optically Tuneable Filter
CV Cross Validation
FIR Far Infra-Red
IDS Incubation- Drying- Separation
ISTA International Seed Testing Association
LED Light Emitting Diodes
MIR Mid Infra-Red
MSC Multiplicative Signal Correction
MVDA Multivariate Data Analysis
NIRS Near Infra-Red Spectroscopy
OPLS-DA
Orthogonal Projections to Latent Structures-Discriminant
Analysis
OSC Orthogonal Signal Correction
PCA Principal Component Analysis
PLS-DA Projection to latent structures-Discriminant Analysis
PRESS Predictive Residual Sum of Squares
SIMCA Soft Independent Modelling of Class Analogy
SLED Super-luminescent Light-Emitting Diodes
SNR Signal-to-Noise Ratio
SNV Standard Normal Variate
VIP Variable Influence on Projection

10
11
1 Introduction
1.1 Seed sorting systems
There is a growing demand for high quality regeneration material from tree
planters. In Sweden, for instance, the total number of tree seedlings planted in
year 2011 was 384 million, of which Norway spruce accounted for 225
million, Scots pine 133 million, contorta pine 16 million and other conifer and
broad-leaved species accounted for 9.8 million (Anonymous, 2011). Seeds are
the most commonly used regeneration material for reforestation purpose, as a
result interests in “precision sowing” (also known as single seed sowing) have
spurred over time among nurseries due to the high cost of containerized
seedling production and to ensure successful emergence and establishment of
seedlings after direct sowing in the field (Winsa & Bergsten, 1994; Winsa &
Sahlén, 2001). Generally, improving seed quality results in more productivity,
higher harvest index and subsequently higher incomes to seed producers
(Deleuran et al., 2011; Karrfalt, 2011).
Seed quality is defined as “a measure of characters or attributes that will
determine the performance of seeds when sown or stored” (Hampton, 2002). It
is a multiple concept comprising of the physical, physiological and genetic
attributes that determine the ability of seeds to germinate and produce a normal
seedling (viability) and the rate and uniformity of seed germination and
seedling growth, emergence ability of seeds under unfavourable environmental
conditions, and performance after storage, collectively characterize seed vigour
(Hampton & TeKrony, 1995; Karrfalt, 2011). Often a seed lot is composed of
seeds of the desired species together with foreign seeds and non-seed materials.
According to ISTA (2010), the pure seed fraction of a given seed lot should
contain intact seeds of the actual species as well as immature, undersized,
shrivelled, diseased or germinated seeds, and pieces of seed units larger than
one-half of their original size, except some families like Leguminosae for
12
which seed units with seed coats entirely removed or seeds with separated
cotyledons are regarded as inert matter. Even the pure seed fraction is still
composed of both viable and non-viable seeds; the latter being empty, dead,
petrified, insect-attacked seeds that together influence the quality of a given
seed lot. While empty seeds are totally devoid of megagametophyte (storage
organ) and embryo, dead and petrified seeds are filled seeds but without
embryo – a miniature plant that germinates and produces a normal seedling
when sown. In many conifers (e.g. Larix species), insufficient female
flowering, lack of pollination and fertilization, degeneration of ovule or early
embryo, as well as abnormal development of the female gametophyte and
premature abortion of female strobili are the major causes of poor seed quality
(Owens, 1995; Philipson, 1996; Slobodník & Guttenberger, 2000). Insect
infestation and infection by seed borne pathogens are also among the
prominent factors that reduce the quality of a given seed lot (Pritam & Singh,
1997; Bates et al., 2001). Seed sorting is, thus, a common practice in seed
handling routine to upgrade seed lot quality by removing non-seed materials,
anatomical underdeveloped seeds as well as empty, insect and mechanically
damaged and dead-filled seeds.
To enhance the germination rate of seed lots, commercial seed conditioning
(Van der Berg & Hendricks, 1980; Halmer, 2000; Kwong et al., 2005) has
deployed specialized equipment to screen the seeds based on some
characteristics such as colour, size, viability, vigour, seed health, genetic
purity, seedling performance (Deleuran, 2011), specific gravity, shape
(Harmond et al., 1968) and surface texture (Karrfalt, 2011), for good and bad
seeds differ basically according to these traits. Over the years, several seed
sorting techniques have been developed to upgrade seed lot quality; including
pneumatic and hydraulic separators (Kaliniewicz et al., 2012), visible
spectrophotometers and chlorophyll fluorescence (Jalink et al., 1998;
Konstantinova et al., 2002; Ooms & Destain, 2011; Kenanoglu et al., 2013;
Bauriegel & Herppich, 2014) and flotation techniques. The flotation techniques
are the most widely used sorting systems at operational scale; notably specific
gravity separations in liquid media (Demelash et al., 2003; Sivakumar et al.,
2007), the Pressure-Vacuum (PREVAC) method for removing mechanically
damaged seeds of Scots pine (Lestander & Bergsten, 1985; Bergsten &
Wiklund, 1987), and the incubation, drying and separation (IDS) technique
originally developed for sorting empty and dead-filled seeds of Scots pine
(Simak, 1981 & 1984). Later on, the IDS technique has been applied on seed
lots of several other conifer (Simak, 1981 & 1984; Downie & Bergsten, 1991;
Downie & Wang, 1992; Singh & Vozzo, 1994; Poulsen, 1995; Demelash et al.,
13
2002) and broad-leaved species (Falleri & Pacella, 1997; Demelash et al.,
2003). However, the efficiency of these methods varies between species; e.g.
IDS doesn’t work well for sorting petrified seeds of Larix species (Lycksell,
1993). For Norway spruce seeds, the IDS method is limited by the wax and
crystal layers around the micropyle (the natural opening in the seed), which
restrict the imbibition process (Tillman-Sutela & Kauppi, 1995). Furthermore,
some flotation media have a detrimental effect on germination of sorted seeds
and their storability (Barnett, 1971; Simak, 1973; Hodgson, 1977).
These limitations have long aroused interests in search of an efficient and
robust sorting system that can be applied across species, and near infrared
(NIR) spectroscopy has been a subject of much interest (Agelet & Hurburgh,
2014). Previous studies have demonstrated the feasibility of NIR spectroscopy
for discriminating insect-attacked seeds (Tigabu & Odén, 2002, 2003b &
2004b; Tigabu et al., 2004 & 2007; Daneshvar et al., 2015), empty seeds
(Tigabu & Odén, 2003a & 2004b; Daneshvar et al., 2015), dead-filled seeds
(Lestander & Odén, 2002; Soltani et al., 2003) from viable seeds, as well as
seed lots according to vigour classes (Tigabu & Odén, 2004a). However, these
studies had focused on few species, thus further testing of the technique on
seed lots of several tree species and other factors that affect the quality of seed
lots is paramount to establish NIR spectroscopy as a robust seed sorting
system. Particularly, evaluating the potential of the technique for sorting
petrified seeds from a seed lot of Larix species is quintessentially given the
increasing demand for high quality of seeds by tree growers in the Nordic
region, and partly due to lack of efficient sorting system at the moment.
1.2 Verification of species
Verification of species is one of the international rules for seed testing with the
aim of determining the extent to which the submitted seed samples conform to
the species claimed for it using methods other than a purity test (ISTA, 2010).
Normally this is done by comparing seeds, seedlings and plants with authentic
samples, and seedlings and/or plants grown from authentic samples nearby and
in identical environmental and growth conditions. For tree seeds collected from
mixed stands, verification of species is problematic, especially when two
related species have similar morphological appearance (e.g. birch species). For
birch species, there are often individuals showing intermediate characteristics
of two related birch species and the species may also hybridize, making the
differentiation in field unreliable. Several morphological (Fries, 1964;
Atkinson & Codling, 1986) and biochemical (Lundgren et al., 1995; Keinänen

14
et al., 1999; Laitinen et al., 2005; Isidorov et al., 2014; Raal et al., 2015) traits
have been used to identify related birch species. However, these traits have
limited or no applicability for direct verification of seeds from similarly
looking birch species.
Another aspect that necessitates the importance of verification of species is
the increased interest in growing hybrids in commercial forestry. One notable
example is the increasing interest in growing Larix eurolepis Henry – a hybrid
of European larch (Larix decidua Mill.) and Japanese larch (Larix kaempferi
(Lamb.) Carr.) in Scandinavia. This interest has been driven by good growth,
relatively short rotation age and relatively high wind stability at older ages
(Ekö et al., 2004) as well as a greater focus on climate adaptation in forestry. It
is expected that future climate change may alter the growing conditions in
Scandinavia in a way that makes forestry with high productivity exotic species
more attractive than traditional ones (Picea abies (L.) Karst and Pinus
sylvestris L.); thereby the risk of an unknown future on tree growth can be
spread. There are, however, uncertainties about the purity of hybrid larch seed
lots, as the outputs of some commercial hybrid larch seed orchards are
composed of large proportions of pure parental seeds mixed with hybrid larch
seed lots (Pâques, 2000). In addition, the EU regulation demands that hybrid
seed producers have to provide information about the hybrid proportion
(Pâques, 2009). The current technique, involving molecular markers (Acheré et
al., 2004; Pâques, 2009), has limited application for routine certification of
hybrid larch seed lots due to relatively high cost, the need for highly trained
technician and being destructive.
In tree seed handling, verification of the seed lot origin is of paramount
importance as early establishment and growth of seedlings planted outside its
native environment is influenced by the maternal environment during
flowering and seed development (Johnsen et al., 1996) although transferring
maternal clones to a warmer climate in the south for better floral initiation and
seed maturation is a common practice. Previous studies with Norway spruce,
for example, have shown that seedlings raised from seeds reproduced under
warm conditions exhibit late flushing, an extended growth period and a
delayed development of frost hardiness during early autumn compared with
seedlings raised from seeds of the same parents reproduced under colder
conditions (Johnsen & Ostreng, 1994; Kohmann & Johnsen, 1994; Skrøppa et
al., 1994; Johnsen et al., 1995). These after-effects of the maternal
environment are opined to persist for a longer time from seed as a result of a
long-lasting epigenetic memory regulated by the prevailing temperature and
15
photoperiod during seed production (Besnard et al., 2008). For species with
low annual seed production, like Norway spruce (Almqvist et al., 2010), there
is a potential risk of seed lots mix-up with unknown origin as seed transaction
allows an easy transfer of seeds between countries. Authentication of seed
origins is, thus, quintessential to avoid the negative impact of planting
seedlings raised from unknown seed origins. Hitherto, “trust-on-labels” is the
common practice for seed certification, but rapid, technically simple and cost-
effective technique is still unavailable for objectively monitoring seed transfer.
It is this lack of efficient and cost effective techniques for seed certification
that motivated the studies on the application of NIR spectroscopy presented in
this thesis.
1.3 Near Infrared Spectroscopy
1.3.1 Location in Electromagnetic Spectrum
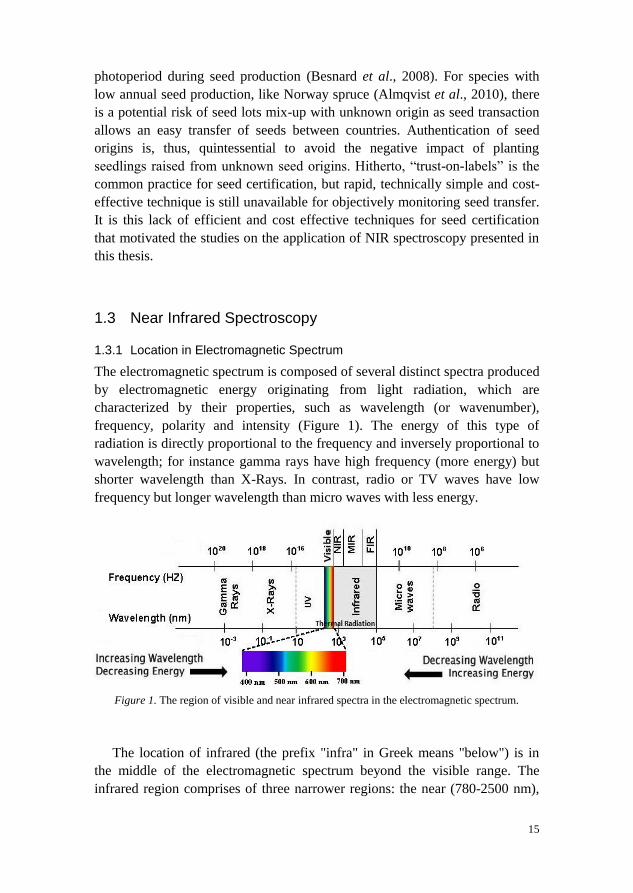
The electromagnetic spectrum is composed of several distinct spectra produced
by electromagnetic energy originating from light radiation, which are
characterized by their properties, such as wavelength (or wavenumber),
frequency, polarity and intensity (Figure 1). The energy of this type of
radiation is directly proportional to the frequency and inversely proportional to
wavelength; for instance gamma rays have high frequency (more energy) but
shorter wavelength than X-Rays. In contrast, radio or TV waves have low
frequency but longer wavelength than micro waves with less energy.
Figure 1. The region of visible and near infrared spectra in the electromagnetic spectrum.
The location of infrared (the prefix "infra" in Greek means "below") is in
the middle of the electromagnetic spectrum beyond the visible range. The
infrared region comprises of three narrower regions: the near (780-2500 nm),
16
mid (10 to 2.5 μm) and far (1 mm-10 μm) infrared regions, abbreviated as NIR,
MIR and FIR, respectively. Among these regions, the energy of the NIR is the
highest (Burns & Ciurczak, 2008; Ozaki, 2012; Workman & Weyer, 2012).
1.3.2 Historical overview
The NIR radiation was discovered by Sir William Herschel, a German-born
British astronomer, back in 1800 when he observed the sun spots using
different filters. While he was applying red filter, some heat with a higher
temperature than visible radiation beyond violet to red spectrum was produced.
Further investigations enabled him to conclude the presence of an invisible
form of radiation with more energy than visible light (Pasquini, 2003). Later
on, the wavelength interval of 780-1100 nm, often referred to as the shorter-
NIR region, was named as “Herschel infrared” in recognition of his pioneering
discovery (Davies, 1990; Ozaki, 2012). After this historic discovery, further
study on NIR was not pursued because of the wrong presumption that “NIR
doesn’t have relevant information for analytical Chemistry”. In addition, since
the NIR spectra are composed of broad overlapping and weak absorption
bands, MIR has instead become more practical and popular for its sharp
fundamental absorption bands (Dryden, 2003).
Although Abney and Festing were considered as pioneer applicants of NIR
to measure and interpret the NIR spectra in 1881, Coblentz was the first
researcher who applied NIR in 1900 to identify organic functional groups and
found that each compound has a unique spectrum. The researchers’ interest in
investigation of organic compounds and functional groups by NIR resulted in
only about 50 published papers up to 1970 (Osborne et al., 1993; Burns &
Ciurczak, 2008) but the publication rate had raised remarkably to more than
1000 in the 1990s (Pasquini, 2003). Among the earliest NIR spectroscopists
was Fowle who applied NIR to qualitatively measure the atmospheric moisture
in 1912, followed by Ellis and Bath who used NIR to estimate the amount of
water in gelatine in 1938. Further development of NIR technology was made in
the 1930s as a result of the discovery of photoelectric detector (lead sulphide),
which was eventually adopted as a major detector for the NIR region and had a
great influence on its applications for commercial purposes in 1950s. This
new-born detector accompanying with tungsten filament lamps significantly
improved the development of NIR instruments by creating the possibility for
measuring diffuse reflectance with better sensitive and sharp radiation.
17
In the late 1960s, the potential value of NIR spectroscopy for qualitatively
measurement of agricultural products was successfully demonstrated by Karl
Norris and his co-workers (Burns & Ciurczak, 2008). For example, they
determined the defection rate in eggs (Norris & Rowan, 1962), the degree of
fruit ripeness (Bittner & Norris, 1968) and moisture in grain and seed (Norris
& Hart, 1965). Moreover, Norris had designed and developed the first grain
moisture meter (Norris, 1962 & 1964); and hence considered as the “father” of
modern NIR technology. In 1971, Dickey-John constructed the first NIR unit
for commercial purposes, Grain Analysis Computer, using tungsten–halogen
lamp as radiation source (Burns & Ciurczak, 2008).
Today NIR spectroscopy is more matured and has greatly proven its
versatility for quantitative and qualitative analyses with notable developments
in instrumental precision and facilities such as computation and statistical
methods, spectral data acquisition and their pre-processing. The non-invasive
nature and diverse application of this technique in almost all fields of science
have made it the fastest growing analytical method (Williams & Norris 2001;
Blanco & Villarroya, 2002; Choquette et al., 2006; Burns & Ciurczak, 2008;
Alander et al., 2013).
1.3.3 Theory and Basics
The NIR spectrum originates from interaction between infrared radiation
energy and matter, which in turn causes transition of the radiation energy into
mechanical vibration of molecular bonds (Burns & Ciurczak, 2008). The
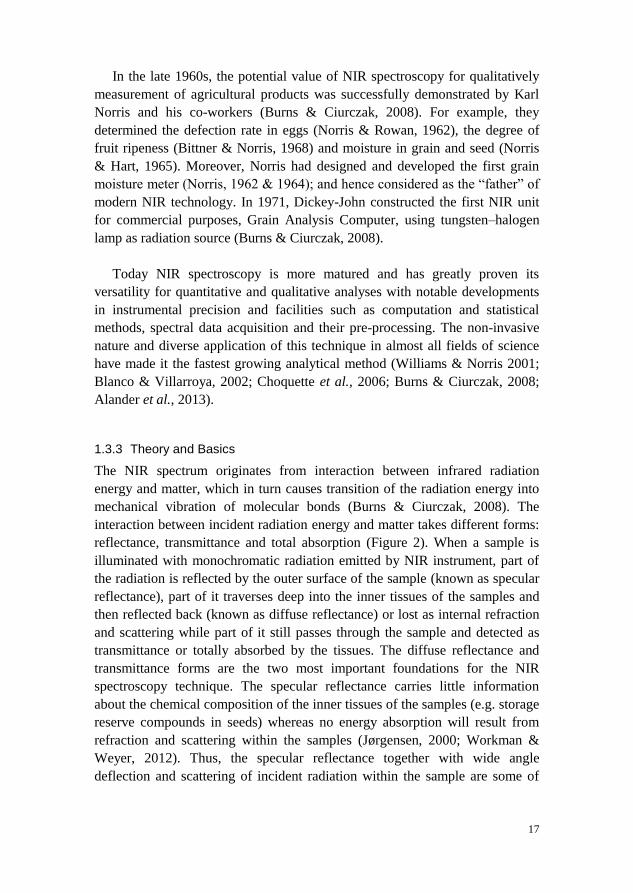
interaction between incident radiation energy and matter takes different forms:
reflectance, transmittance and total absorption (Figure 2). When a sample is
illuminated with monochromatic radiation emitted by NIR instrument, part of
the radiation is reflected by the outer surface of the sample (known as specular
reflectance), part of it traverses deep into the inner tissues of the samples and
then reflected back (known as diffuse reflectance) or lost as internal refraction
and scattering while part of it still passes through the sample and detected as
transmittance or totally absorbed by the tissues. The diffuse reflectance and
transmittance forms are the two most important foundations for the NIR
spectroscopy technique. The specular reflectance carries little information
about the chemical composition of the inner tissues of the samples (e.g. storage
reserve compounds in seeds) whereas no energy absorption will result from
refraction and scattering within the samples (Jørgensen, 2000; Workman &
Weyer, 2012). Thus, the specular reflectance together with wide angle
deflection and scattering of incident radiation within the sample are some of
18
the sources of spectral noise, masking the true spectral signal from the sample;
thus need to be carefully handle during data pre-processing to enhance signal
to noise ratio.
Figure 2. Various forms of interaction between NIR radiation and seed sample. I0 is the intensity
of incident radiation reaching to the seed and I is the intensity of output radiation occurring as a)
specular reflectance, b) transmittance, c) refraction, d) diffuse reflectance, e) scattering and f)
absorbance
The basis for absorption bands observed in NIR spectrum is that when a
molecule absorbs a photon (the small particles of the radiation), it transits from
one energy level to another; i.e. excitation of the atoms due to change in the
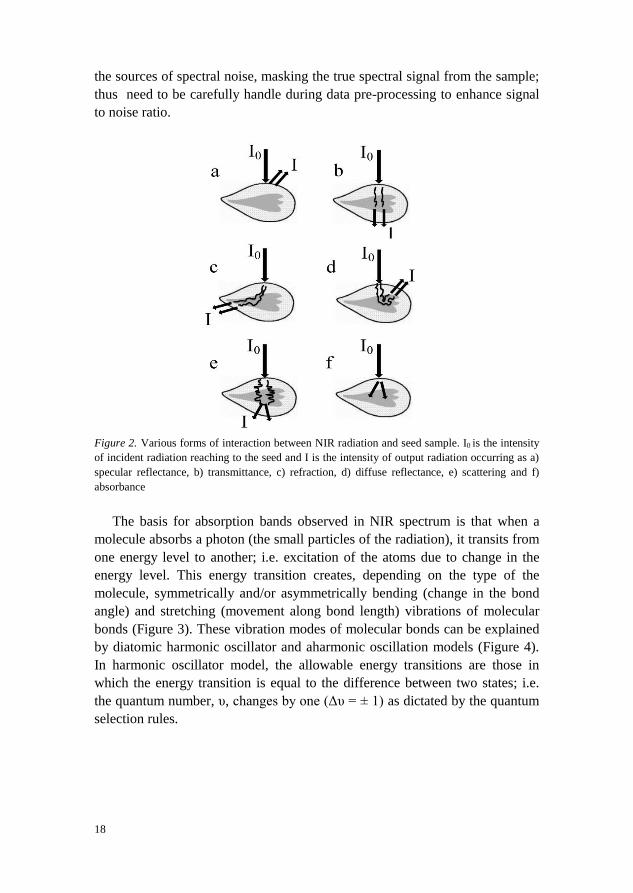
energy level. This energy transition creates, depending on the type of the
molecule, symmetrically and/or asymmetrically bending (change in the bond
angle) and stretching (movement along bond length) vibrations of molecular
bonds (Figure 3). These vibration modes of molecular bonds can be explained
by diatomic harmonic oscillator and aharmonic oscillation models (Figure 4).
In harmonic oscillator model, the allowable energy transitions are those in
which the energy transition is equal to the difference between two states; i.e.
the quantum number, υ, changes by one (Δυ = ± 1) as dictated by the quantum
selection rules.
19
Figure 3. Different modes of bond vibration for Hydrogen atoms in water molecule
The intensity of vibration is directly related to the bond length and the
vibration type. Stretching of the bond needs more energy than bending; thus
stretching happens at higher frequency while bending occurs at lower
frequency (Davies, 2005; Burns & Ciurczak, 2008). Mathematically,
vibrational frequency of the bond, v , in harmonic oscillator (Figure 4) is
expressed as:
𝑣 = 1
2𝜋 √𝑘
(1
𝑚1+
1𝑚2
)
where m1 and m2 are the mass of atom 1 and 2, respectively and k is a force
constant which is dependent on bonds. The bigger the mass of the atoms is, the
lower the vibrational frequency will be.
Discrete vibrational energy of a molecule, EVIB, in order to jump from one
energy level to another is expressed as:
𝐸𝑉𝐼𝐵 = ℎ𝑣(𝜐 +1
2)
where h is Plank’s constant and υ stands for quantum number or overtone with
integer values of 0, 1, 2 and so on (Burns & Ciurczak, 2008; Workman &
Weyer, 2012). The potential energy, V, in fundamental absorption bands for
harmonic oscillator can be calculated as follows:
20
𝑉 =1
2 𝑘 (𝑟 − 𝑟𝑒)2 =
1
2𝑘𝑞2
where r is the internuclear displacement during vibration, re is internuclear
distance in equilibrium position and q is a coordinate of displacement.
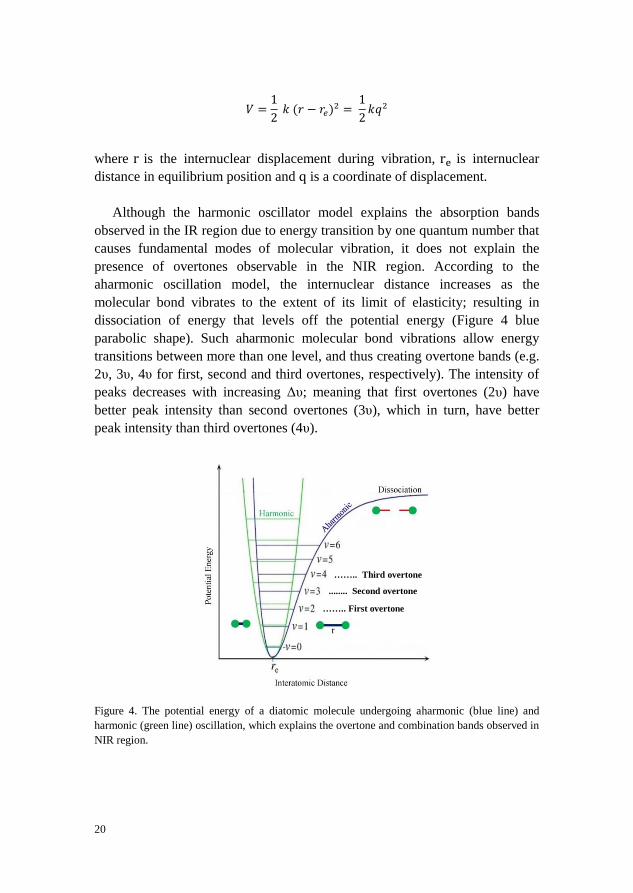
Although the harmonic oscillator model explains the absorption bands
observed in the IR region due to energy transition by one quantum number that
causes fundamental modes of molecular vibration, it does not explain the
presence of overtones observable in the NIR region. According to the
aharmonic oscillation model, the internuclear distance increases as the
molecular bond vibrates to the extent of its limit of elasticity; resulting in
dissociation of energy that levels off the potential energy (Figure 4 blue
parabolic shape). Such aharmonic molecular bond vibrations allow energy
transitions between more than one level, and thus creating overtone bands (e.g.
2υ, 3υ, 4υ for first, second and third overtones, respectively). The intensity of
peaks decreases with increasing Δυ; meaning that first overtones (2υ) have
better peak intensity than second overtones (3υ), which in turn, have better
peak intensity than third overtones (4υ).
Figure 4. The potential energy of a diatomic molecule undergoing aharmonic (blue line) and
harmonic (green line) oscillation, which explains the overtone and combination bands observed in
NIR region.
…….. First overtone
........ Second overtone
…….. Third overtone
21
The NIR spectrum is, thus, composed of both overtones and combination
bands from fundamental vibrational modes, and the main bands observed in the
NIR regions correspond to hydrogen bonds containing light atoms, such as C –
H, O – H, N – H and S – H; because light atoms can easily vibrate upon
irradiation by NIR radiation source and deviate from harmonic to aharmonic
oscillation mode. These molecules are the major functional moieties in nearly
all organic samples. For example, the C – H bond vibration characterizes
methyl, methylene and carbonyl groups in lipids whereas the O – H and N – H
bond vibrations characterize water and amide groups in a given sample,
respectively.
1.3.4 Computation of Absorbance values
For quantitative and qualitative analyses of organic samples by NIR
spectroscopy based on transmittance or diffuse reflectance measurements, one
needs to know the fraction of radiant energy absorbed by the samples (also
known as absorbance value). According to Beer- Lambert’s law, the fraction of
radiant energy absorbed by infinitesimal thickness of a sample is directly
proportional to the concertation of the analyte at that thickness and the path
length; i.e.
𝐴 = 𝜀. 𝐶. 𝑙
Where A is absorbance value, ε is the molar absorptivity coefficient, 𝐶 is
the molar concentration of sample and 𝑙 is the path length that the incident
radiation travels through a given thickness of a sample. The amount of various
organic substances in a mixture of sample (e.g. seeds) can be determined by
measuring the relative amount of radiant energy absorbed at each frequency, as
different organic compounds absorb at different frequencies and exhibit
different absorption intensity. Thus, the transmittance (T) and diffuse
reflectance (R) measurements can be converted into absorbance values, A, as
follows:
𝐴 = 𝑙𝑜𝑔 (𝑇0
𝑇) 𝑜𝑟 𝐴 = 𝑙𝑜𝑔 (
1
𝑇)
𝐴 = 𝑙𝑜𝑔 (𝑅0
𝑅) 𝑜𝑟 𝐴 = 𝑙𝑜𝑔 (
1
𝑅)

22
Where To and Ro are reference transmittance and reflectance measurements,
and T and R are transmittance and diffuse reflectance measurements from a
sample, respectively.
1.3.5 Basic instrumentation
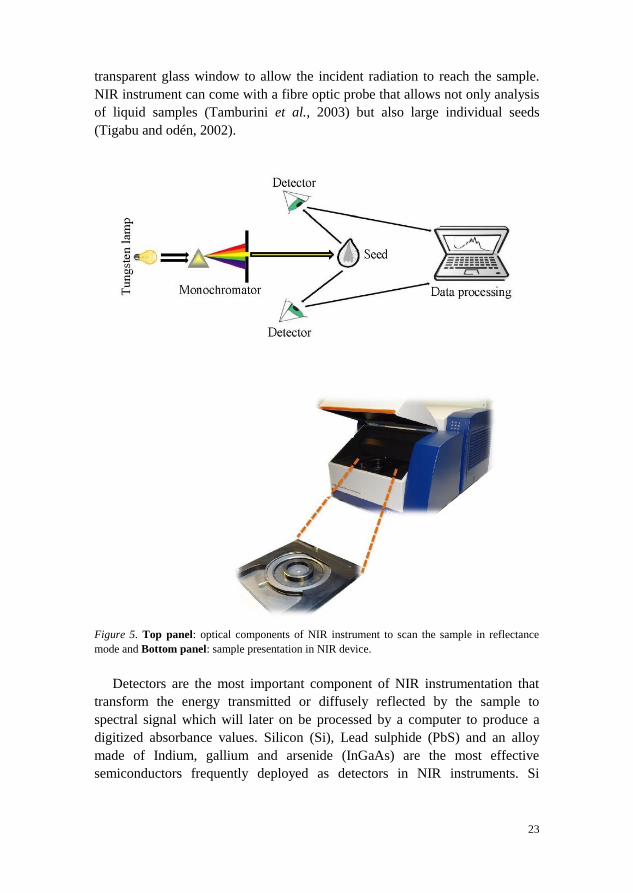
Any NIR spectrophotometer is assembled from five main parts: radiation
source, wavelength selector/modulator, sample cell, detector and signal
processor (Figure 5, upper part). A variety of radiation sources has been used
in the development of NIR instruments, including light emitting diodes (LED),
super-luminescent light-emitting diodes (SLED) also called tuneable diode
lasers and tungsten-halogen lamps. Today, the tungsten-halogen lamp is the
dominant source of radiant energy for advanced NIR instruments with high
energy output over 300 – 2600 nm wavelength interval. The advantage of using
this lamp lies on the cooling-effect of the halogen inside the lamp; thereby
avoiding overheating of the instrument. Similarly, a variety of devices has been
developed over the years for wavelength selection or modulation; notably
prisms, Acousto-optically tuneable filter (AOTF), interferometric and non-
thermal systems (Garini et al., 2006; Balas, 2009; Burns & Ciurczak, 2008;
Agelet, 2011; Zhang et al., 2011). While prism and AOTF angularly disperse
the radiation into different wavelengths using large prism and radio wave
frequency, respectively, the interferometric system is a non-dispersive system,
in which filters are used for wavelength selection. The notable interferometric
systems are the Michelson interferometer, Fabry-Perot filter and Fourier
transform NIR instruments (for more details see Osborne et al., 1993;
McClure, 1994). The non-thermal system involves the use of light emitting
diodes and lasers that can emit radiation in a narrow range of wavelengths.
Most of NIR instruments used in laboratories and in industries today utilize
diffraction gratings and detection arrays for wavelength selection, which are
proven suitable for detection of the full spectrum.
Sample cells for NIR analysis can be of different types, depending on the
nature of the sample and the instrument; for example seeds can be scanned
individually or in bulk. For single seed analysis, each individual seed can be
placed directly into the scanning window of the instrument (as in the case XDS
Rapid Content Analyzer; FOSS NIRSystems, Inc., used in this thesis) or single
seed adapters (as in the case 1225 Infratec analyser; FOSS Tecator, Sweden);
whereas bulk seed samples can be analysed using the standard sample cups
supplied by the manufacturer together with the instrument (see the lower part
of Figure 5). The standard sample cup is made of silica or quartz with
23
transparent glass window to allow the incident radiation to reach the sample.
NIR instrument can come with a fibre optic probe that allows not only analysis
of liquid samples (Tamburini et al., 2003) but also large individual seeds
(Tigabu and odén, 2002).
Figure 5. Top panel: optical components of NIR instrument to scan the sample in reflectance
mode and Bottom panel: sample presentation in NIR device.
Detectors are the most important component of NIR instrumentation that
transform the energy transmitted or diffusely reflected by the sample to
spectral signal which will later on be processed by a computer to produce a
digitized absorbance values. Silicon (Si), Lead sulphide (PbS) and an alloy
made of Indium, gallium and arsenide (InGaAs) are the most effective
semiconductors frequently deployed as detectors in NIR instruments. Si
24
sensors are effective in the 400 – 1100 nm while PbS detectors are effective in
the 1100-2500 nm, and InGaAs in 1000 – 1800 nm with better sensitivity than
the former two (Burns & Ciurczak, 2008). Sequentially arranged Si and PbS
sensors are used for acquiring spectral information over the visible + NIR
region (400 – 2500 nm). As the detector may influence the signal-to-noise ratio
(SNR) due to its positioning (should be 45° against samples), each sample
should be successively scanned several times, for example 32 times and then
average values recorded. Finally, computers are vital component of NIR
instrument configuration for capturing spectral data, for process monitoring
and data analysis.
1.4 Multivariate analysis of NIR spectra
NIR spectroscopic data are not usually amenable for direct analysis due to
several reasons. First, the spectra contain unwanted systematic variations that
arise from light scattering, base line shift, instrumental drift, and path length
differences. Such unwanted spectral noise should be carefully handled to
enhance the signal from the chemical compounds analysed by using
appropriate spectral pre-treatment (also called spectral filter) techniques.
Second, spectroscopic data are multidimensional by nature, recorded at several
hundred wavelength channels; thus it is not always easy to select a few
wavelengths to analyse the chemical compound of interest in a sample due to
the overlapping nature of spectral peaks. On top of that, spectroscopic data are
highly collinear; i.e., some of the variables can be written approximately as
linear functions of other variables. Thus, the first step in analysing NIR
spectral data is to perform spectral filtering, followed by multivariate data
analysis (MVDA) to extract the valuable information from the spectra than
univariate analysis (Næs et al., 2002). In the subsequent sections, the
commonly applied spectral pre-processing techniques and multivariate method
for analysis of NIR spectral data are presented.
1.4.1 Spectral pre-processing
The particle size and shape of the sample induce multiplicative and/or additive
scattering effects on the NIR spectra; thereby reducing signal to noise ratio of
the spectra. This scatter effects are larger for bigger particles than smaller ones
and varies from sample to sample because of path length differences.
Multiplicative effect perturbs the slope of each spectrum while additive effect
leads to shifts in the baseline compared to a reference. Therefore, the spectra
25
include information irrelevant for the property of interest and mask the
biochemical signals from the sample. To improve the spectral signal and get rid
of these noises, a variety of spectral pre-treatment have been developed.
Spectral pre-treatments or spectral filters are mathematic functions for handling
unwanted interferences in order to avoid its dominance over the chemical
signal. The commonest data pre-treatment techniques in NIR spectroscopy are
derivatives (Savitzky & Golay 1964), multiplicative signal correction (Geladi
et al., 1985), standard normal variate transformation (Barnes et al., 1989) and
orthogonal signal correction (Wold et al., 1998), which were used in the thesis,
as deem necessary.
Derivatives are simple signal pre-processing methods for correcting
additive baseline (first derivative) and scatter (second derivatives) effects. In
addition, the method can remove overlapping peaks by separating them;
thereby making interpretation of spectral signal easier. The first derivative is
the slope at each point of the original spectrum, which can be computed as the
difference between adjacent points as follows:
𝑥′ = 𝑥𝑤 − 𝑥𝑤−1
where xˈ and xw denote absorbance value in the first derivative and original
spectrum at wavelength w in the sequence, respectively.
Second derivative (x'') is the slope of first derivative (xw'), and computed as
the difference of two adjacent first derivatives as follows:
𝑥′′ = 𝑥𝑤′ − 𝑥𝑤−1
′ = 𝑥𝑤−1 − 2 × 𝑥𝑤 + 𝑥𝑤+1
Although derivatives are simple to compute, they should be used cautiously as
they cause noise inflation and signal reduction (low SNR).
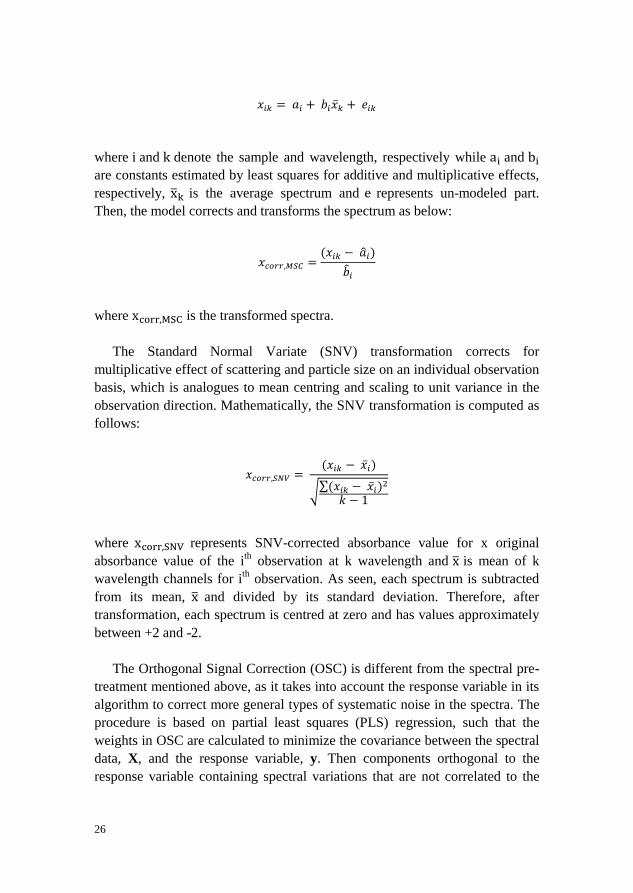
The Multiplicative Signal Correction (MSC) approach is another mostly
used spectral-filtering technique in NIR spectroscopy data where scatter effect
is the main source of variability. This can be done by plotting the spectrum of
each sample against average one. MSC reduces model dimensionality by
successfully removing the scatter effects originating from both multiplicative
and additive components in two steps: firstly it determines the correction
coefficients mathematically as given below:
26
𝑥𝑖𝑘 = 𝑎𝑖 + 𝑏𝑖��𝑘 + 𝑒𝑖𝑘
where i and k denote the sample and wavelength, respectively while ai and bi
are constants estimated by least squares for additive and multiplicative effects,
respectively, xk is the average spectrum and e represents un-modeled part.
Then, the model corrects and transforms the spectrum as below:
𝑥𝑐𝑜𝑟𝑟,𝑀𝑆𝐶 =(𝑥𝑖𝑘 − ��𝑖)
��𝑖
where xcorr,MSC is the transformed spectra.
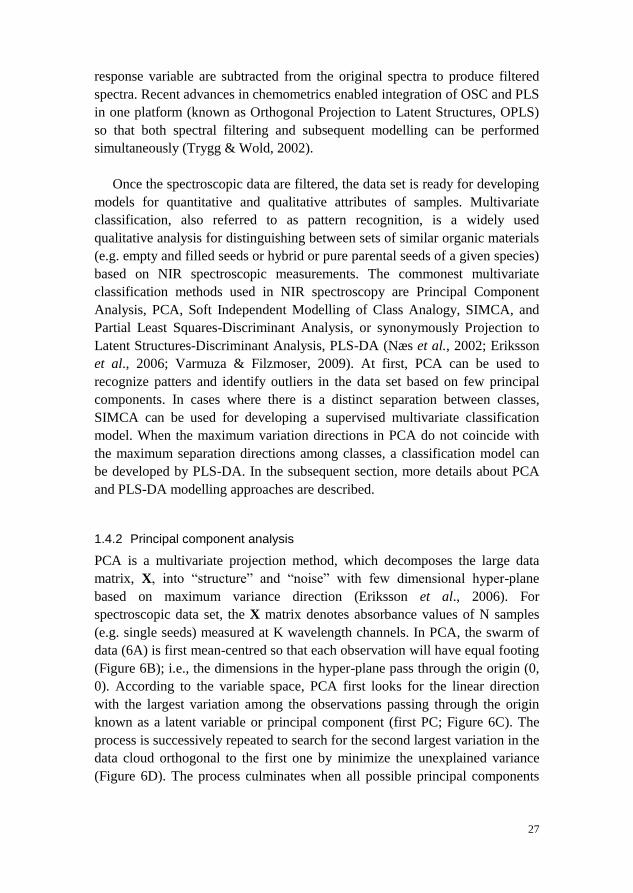
The Standard Normal Variate (SNV) transformation corrects for
multiplicative effect of scattering and particle size on an individual observation
basis, which is analogues to mean centring and scaling to unit variance in the
observation direction. Mathematically, the SNV transformation is computed as
follows:
𝑥𝑐𝑜𝑟𝑟,𝑆𝑁𝑉 = (𝑥𝑖𝑘 − ��𝑖)
√∑(𝑥𝑖𝑘 − ��𝑖)2
𝑘 − 1
where xcorr,SNV represents SNV-corrected absorbance value for x original
absorbance value of the ith observation at k wavelength and x is mean of k
wavelength channels for ith
observation. As seen, each spectrum is subtracted
from its mean, x and divided by its standard deviation. Therefore, after
transformation, each spectrum is centred at zero and has values approximately
between +2 and -2.
The Orthogonal Signal Correction (OSC) is different from the spectral pre-
treatment mentioned above, as it takes into account the response variable in its
algorithm to correct more general types of systematic noise in the spectra. The
procedure is based on partial least squares (PLS) regression, such that the
weights in OSC are calculated to minimize the covariance between the spectral
data, X, and the response variable, y. Then components orthogonal to the
response variable containing spectral variations that are not correlated to the
27
response variable are subtracted from the original spectra to produce filtered
spectra. Recent advances in chemometrics enabled integration of OSC and PLS
in one platform (known as Orthogonal Projection to Latent Structures, OPLS)
so that both spectral filtering and subsequent modelling can be performed
simultaneously (Trygg & Wold, 2002).
Once the spectroscopic data are filtered, the data set is ready for developing
models for quantitative and qualitative attributes of samples. Multivariate
classification, also referred to as pattern recognition, is a widely used
qualitative analysis for distinguishing between sets of similar organic materials
(e.g. empty and filled seeds or hybrid or pure parental seeds of a given species)
based on NIR spectroscopic measurements. The commonest multivariate
classification methods used in NIR spectroscopy are Principal Component
Analysis, PCA, Soft Independent Modelling of Class Analogy, SIMCA, and
Partial Least Squares-Discriminant Analysis, or synonymously Projection to
Latent Structures-Discriminant Analysis, PLS-DA (Næs et al., 2002; Eriksson
et al., 2006; Varmuza & Filzmoser, 2009). At first, PCA can be used to
recognize patters and identify outliers in the data set based on few principal
components. In cases where there is a distinct separation between classes,
SIMCA can be used for developing a supervised multivariate classification
model. When the maximum variation directions in PCA do not coincide with
the maximum separation directions among classes, a classification model can
be developed by PLS-DA. In the subsequent section, more details about PCA
and PLS-DA modelling approaches are described.
1.4.2 Principal component analysis
PCA is a multivariate projection method, which decomposes the large data
matrix, X, into “structure” and “noise” with few dimensional hyper-plane
based on maximum variance direction (Eriksson et al., 2006). For
spectroscopic data set, the X matrix denotes absorbance values of N samples
(e.g. single seeds) measured at K wavelength channels. In PCA, the swarm of
data (6A) is first mean-centred so that each observation will have equal footing
(Figure 6B); i.e., the dimensions in the hyper-plane pass through the origin (0,
0). According to the variable space, PCA first looks for the linear direction
with the largest variation among the observations passing through the origin
known as a latent variable or principal component (first PC; Figure 6C). The
process is successively repeated to search for the second largest variation in the
data cloud orthogonal to the first one by minimize the unexplained variance
(Figure 6D). The process culminates when all possible principal components
28
are computed, and finally the observations are project onto the new dimensions
of the hyper-plane (Figure 6E). The maximum number of PCs is equal to N-1
observations or K variables, depending on which one is smaller.
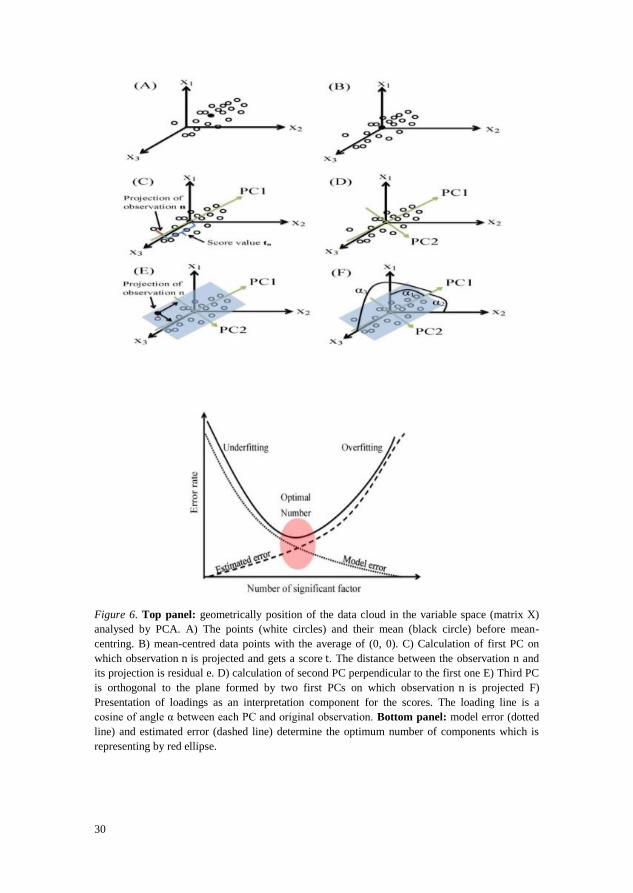
The more PCs are extracted, the higher the variance explained by the PCA
model and the less residual will be (Figure 6; bottom part). On the other hand,
the dimensionality of the model increases dramatically if more PCs are
calculated; thereby causing model complexity and increase in prediction error.
Thus computing more PCs will result in overfitting of the model, whereas few
PCs result in underfitted model with very high error rate. In addition, higher
order PCs explains small variation; thus fewer significant PCs should be
determined. This can be done using the eigenvalue criterion or cross-
validation. According to the eigenvalue criterion, a PC is considered significant
if its normalized eigenvalue is larger than 2; or if the predictive power
according to cross-validation is larger than a significant limit (Eriksson et al.,
2006).
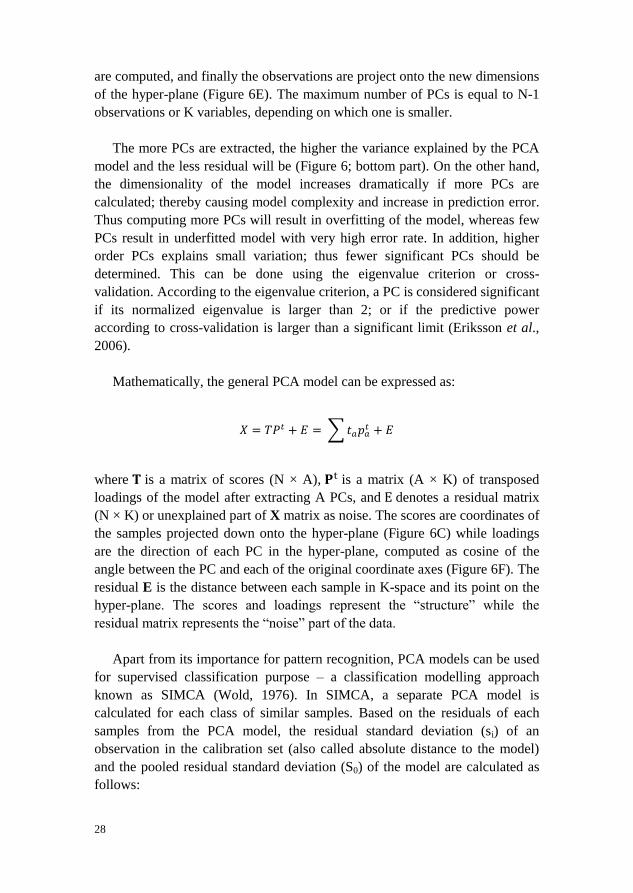
Mathematically, the general PCA model can be expressed as:
𝑋 = 𝑇𝑃𝑡 + 𝐸 = ∑ 𝑡𝑎𝑝𝑎𝑡 + 𝐸
where 𝐓 is a matrix of scores (N × A), 𝐏t is a matrix (A × K) of transposed
loadings of the model after extracting A PCs, and E denotes a residual matrix
(N × K) or unexplained part of X matrix as noise. The scores are coordinates of
the samples projected down onto the hyper-plane (Figure 6C) while loadings
are the direction of each PC in the hyper-plane, computed as cosine of the
angle between the PC and each of the original coordinate axes (Figure 6F). The
residual E is the distance between each sample in K-space and its point on the
hyper-plane. The scores and loadings represent the “structure” while the
residual matrix represents the “noise” part of the data.
Apart from its importance for pattern recognition, PCA models can be used
for supervised classification purpose – a classification modelling approach
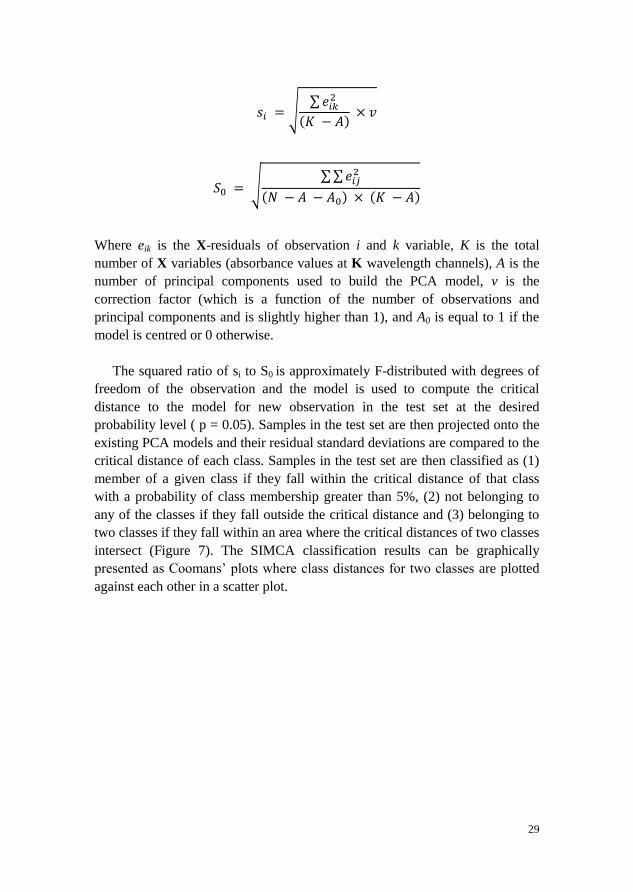
known as SIMCA (Wold, 1976). In SIMCA, a separate PCA model is
calculated for each class of similar samples. Based on the residuals of each
samples from the PCA model, the residual standard deviation (si) of an
observation in the calibration set (also called absolute distance to the model)
and the pooled residual standard deviation (S0) of the model are calculated as
follows:
29
𝑠𝑖 = √∑ 𝑒𝑖𝑘
2
(𝐾 − 𝐴) × 𝑣
𝑆0 = √∑ ∑ 𝑒𝑖𝑗
2
(𝑁 − 𝐴 − 𝐴0) × (𝐾 − 𝐴)
Where eik is the X-residuals of observation i and k variable, K is the total
number of X variables (absorbance values at K wavelength channels), A is the
number of principal components used to build the PCA model, v is the
correction factor (which is a function of the number of observations and
principal components and is slightly higher than 1), and A0 is equal to 1 if the
model is centred or 0 otherwise.
The squared ratio of si to S0 is approximately F-distributed with degrees of
freedom of the observation and the model is used to compute the critical
distance to the model for new observation in the test set at the desired
probability level ( p = 0.05). Samples in the test set are then projected onto the
existing PCA models and their residual standard deviations are compared to the
critical distance of each class. Samples in the test set are then classified as (1)
member of a given class if they fall within the critical distance of that class
with a probability of class membership greater than 5%, (2) not belonging to
any of the classes if they fall outside the critical distance and (3) belonging to
two classes if they fall within an area where the critical distances of two classes
intersect (Figure 7). The SIMCA classification results can be graphically
presented as Coomans’ plots where class distances for two classes are plotted
against each other in a scatter plot.
30
Figure 6. Top panel: geometrically position of the data cloud in the variable space (matrix X)
analysed by PCA. A) The points (white circles) and their mean (black circle) before mean-
centring. B) mean-centred data points with the average of (0, 0). C) Calculation of first PC on
which observation n is projected and gets a score t. The distance between the observation n and
its projection is residual e. D) calculation of second PC perpendicular to the first one E) Third PC
is orthogonal to the plane formed by two first PCs on which observation n is projected F)
Presentation of loadings as an interpretation component for the scores. The loading line is a
cosine of angle α between each PC and original observation. Bottom panel: model error (dotted
line) and estimated error (dashed line) determine the optimum number of components which is
representing by red ellipse.

31
Figure 7. Coomans’ plot illustrating the distances of samples from two classes based on PCA
model. The dotted lines correspond to the critical distance of each class. “overlap” region shows
the samples belong to both classes, panel “no class” represents the samples predicted with no
class membership.
1.4.3 Projection to Latent Structures – Discriminant Analysis
PLS-DA is another approach to develop multivariate classification models
when the maximum variation directions in PCA do not coincide with the
maximum separation directions among classes. It is a regression approach that
establishes a relationship between the predictor X-matrix (e.g. NIR spectra)
and the response matrix through an inner linear relation of their scores
(Eriksson et al., 2006). The response matrix, Y, is composed of dummy
variables (1 for samples belonging to the class, 0 otherwise), which indicates
class membership (Figure 8A). The predictor, X and response, Y, matrices are
then decomposed into “structure” and “noise” as follows:
𝑿 = 𝑻𝑷𝑡 + 𝑬
𝒀 = 𝑼𝑸𝑡 + 𝑭
Where T, Pt and E denote scores, loadings and residuals of the predictor data
matrix, X; and U, Qt and F denote scores, loadings and residuals of the
response matrix, Y (Figure 8B). PLS calculates the linear relation between the
inner variables, T and U by maximizing their covariance. For each PLS
component, a weight vector, w*, that describes the contribution of each
predictor variable to the explanation of the response variables is computed.
Thus, the matrix of weights, W*, over all PLS components contain the
structure in the predictor matrix that maximizes the covariance between T and
U.
The PLS model can thus be expressed as:
32
𝒀 = 𝑿𝑾∗ 𝑸′ = 𝑿𝑩 + 𝑭
B is a matrix of regression coefficients. The prediction equation for new
sample 𝑛 can be expressed as:
𝑦𝑛 = 𝑏0 + 𝑏𝑛𝑥𝑛𝑇
where b0 is the intercept, bn is the regression coefficient.
The goodness of fit, a measure of model performance and relevance, is
evaluated by computing the explained variation of the predictor matrix (R2X)
and the response (R2Y) as follows
𝑅2𝑋 = 1 − 𝑅𝑆𝑆𝑋[𝐴]/𝑆𝑆𝑋[0]
𝑅2𝑌 = 1 − 𝑅𝑆𝑆𝑌[𝐴]/𝑆𝑆𝑌[0]
where RSSX[A] and RSSY[A] are the sum of squares of the X- and Y-
residuals after extracting A components, respectively, and SSX[0] and SSY[0]
are the total explained variation of X and Y matrices, respectively.
The goodness of prediction, a measure of the prediction ability of the
computed model, can be evaluated using a parameter called predictive power
(Q2) based on cross-validation or test sets. The fraction of the total variation in
the response, Y, that can be predicted by a component, Q2, is computed as
𝑄2 = 1 − 𝑃𝑅𝐸𝑆𝑆/𝑆𝑆𝑌
PRESS is the predictive residual sum of squares of the response Y, [∑(y −
y)2] and SSY is the residual sum of squares of the previous dimension. The
cumulative Q2 for all significant components needed to build the model is
computed as:
𝑄𝑐𝑢𝑚2 = [1.0 − ∏(𝑃𝑅𝐸𝑆𝑆/𝑆𝑆)𝑎] a = 1, 2,…, A
where ∏(PRESS/SS)a is the product of PRESS/SS for each component, a. A
model with large cumulative Q2
value for a given response indicates that the
model for that response is good. As a rule of thumb, a model with a Q2 > 0.5 is
considered as good and a Q2 > 0.9 as excellent (Eriksson et al., 2006).
33
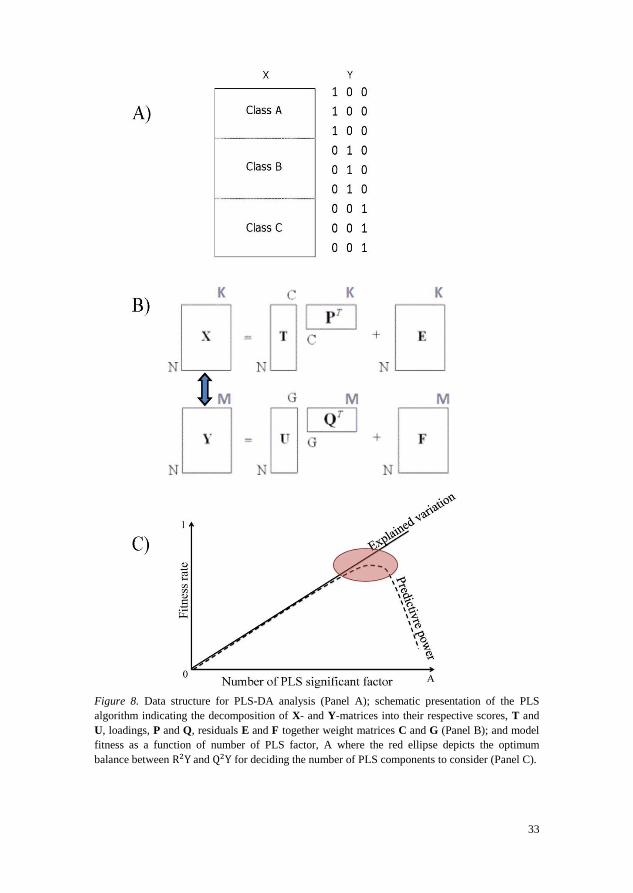
Figure 8. Data structure for PLS-DA analysis (Panel A); schematic presentation of the PLS
algorithm indicating the decomposition of X- and Y-matrices into their respective scores, T and
U, loadings, P and Q, residuals E and F together weight matrices C and G (Panel B); and model
fitness as a function of number of PLS factor, A where the red ellipse depicts the optimum
balance between R2Y and Q2Y for deciding the number of PLS components to consider (Panel C).
34
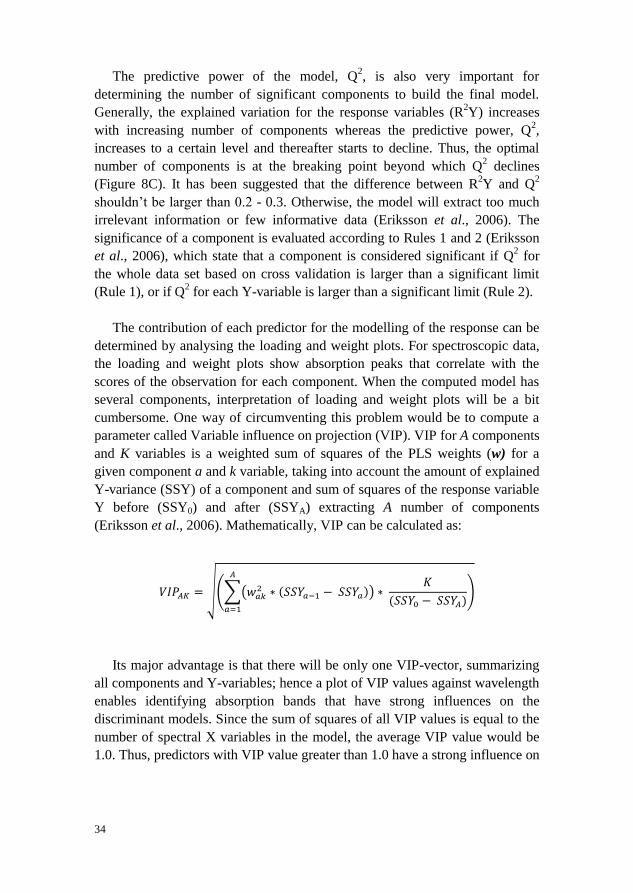
The predictive power of the model, Q2, is also very important for
determining the number of significant components to build the final model.
Generally, the explained variation for the response variables (R2Y) increases
with increasing number of components whereas the predictive power, Q2,
increases to a certain level and thereafter starts to decline. Thus, the optimal
number of components is at the breaking point beyond which Q2 declines
(Figure 8C). It has been suggested that the difference between R2Y and Q
2
shouldn’t be larger than 0.2 - 0.3. Otherwise, the model will extract too much
irrelevant information or few informative data (Eriksson et al., 2006). The
significance of a component is evaluated according to Rules 1 and 2 (Eriksson
et al., 2006), which state that a component is considered significant if Q2 for
the whole data set based on cross validation is larger than a significant limit
(Rule 1), or if Q2 for each Y-variable is larger than a significant limit (Rule 2).
The contribution of each predictor for the modelling of the response can be
determined by analysing the loading and weight plots. For spectroscopic data,
the loading and weight plots show absorption peaks that correlate with the
scores of the observation for each component. When the computed model has
several components, interpretation of loading and weight plots will be a bit
cumbersome. One way of circumventing this problem would be to compute a
parameter called Variable influence on projection (VIP). VIP for A components
and K variables is a weighted sum of squares of the PLS weights (w) for a
given component a and k variable, taking into account the amount of explained
Y-variance (SSY) of a component and sum of squares of the response variable
Y before (SSY0) and after (SSYA) extracting A number of components
(Eriksson et al., 2006). Mathematically, VIP can be calculated as:
𝑉𝐼𝑃𝐴𝐾 = √(∑(𝑤𝑎𝑘2 ∗ (𝑆𝑆𝑌𝑎−1 − 𝑆𝑆𝑌𝑎)) ∗
𝐾
(𝑆𝑆𝑌0 − 𝑆𝑆𝑌𝐴)
𝐴
𝑎=1
)
Its major advantage is that there will be only one VIP-vector, summarizing
all components and Y-variables; hence a plot of VIP values against wavelength
enables identifying absorption bands that have strong influences on the
discriminant models. Since the sum of squares of all VIP values is equal to the
number of spectral X variables in the model, the average VIP value would be
1.0. Thus, predictors with VIP value greater than 1.0 have a strong influence on
35
the model, but a cut-off around 0.7 – 0.8 has been suggested to discriminate
between relevant and irrelevant predictors (Eriksson et al., 2006).
Interpretation of NIR absorption bands is not usually straightforward due to
the overlapping nature of absorption peaks of several compounded in a sample
and the complex chemical composition of the sample (e.g. seeds). However,
the chemical ‘fingerprints’ of the peaks can be characterized and interpreted
based on previous studies and assignment of bands to functional groups
(Osborne et al., 1993; Shenk et al., 2001; Workman & Weyer, 2012), and
knowledge of seed chemical composition; particularly the storage reserves in
the seeds. In this thesis, the interpretation of absorption bands was based on
these approaches.
1.4.4 Orthogonal Projections to Latent Structures – Discriminant Analysis
OPLS-DA is a variant of PLS-DA, which has gained increasing popularity as a
classification modelling approach in recent years (Pinto et al., 2012). Unlike
PLS-DA, the OPLS-DA modelling approach integrates facilities for both data
pre-processing to remove unwanted systematic noise in the spectra and
subsequent modelling. Basically, OPLS-DA modelling separates predictive
from non-predictive (Y-orthogonal) variations in the spectra and uses only the
predictive variations for fitting the model. To do this, it uses information in the
categorical response matrix Y (a matrix of dummy variables) to decompose the
X matrix (the NIR spectral data) into three distinct parts: (1) the predictive
score matrix and its loading matrix for X, (2) the corresponding Y-orthogonal
score matrix and its loading matrix, and (3) the residual matrix of X (Trygg &
Wold, 2002). Unlike other spectral pre-processing methods, OPLS-DA
provides dimensionally less complex models (i.e., few components to build the
model), and additional facilities for interpretation of inter- and intra-class
variability, causes of unwanted systematic variations in the spectra and spectral
variations relevant for class discrimination by examining the score and loading
plots of predictive and orthogonal components (Pinto et al., 2012; Daneshvar et
al., 2015).
In this thesis, the different spectral pre-processing techniques as well as
SIMCA, PLS-DA and OPLS-DA modelling approaches were applied, as
deemed necessary.

36

37
2 Objectives
The main objective of the studies presented in this thesis was to evaluate the
application of visible and near infrared spectroscopy combined with
multivariate modelling as a fast and non-destructive method for seed sorting
and seed certification in order to upgrade and ensure overall seed lot quality of
tree species that are of great importance in reforestation in boreal and
temperate ecosystems. The specific objectives and hypotheses were:
Sorting viable, empty and petrified seeds of Larix sibirica (Paper- I)
Hypothesis: filled-viable seeds have more storage reserves than empty
seeds but lower moisture content than petrified seeds, which can be
detected by NIR spectroscopy as a basis for discriminating them.
Evaluating the feasibility of visible and NIR spectroscopy for
verification of hybrid larch, Larix × eurolepis, seeds (Paper- II)
Hypothesis: Variations in colour and storage reserve compounds like
lipids and proteins as well as moisture content exist in seeds of hybrid
and pure parental seeds that can be detected by visible and NIR
spectroscopy as a basis for discriminating them.
Identifying two birch species and their families by using VIS + NIR
spectra of single seeds (Paper- III)
Hypothesis: Silver and downy birch seeds differ in colour and
chemical compositions of seed storage reserves that can be detected
by NIR spectroscopy as a basis for discriminating between species.

38
Seeds from different families within species also differ in their
chemical composition due to genetic effect.
Authenticating the origin of Picea abies seed lots (Paper- IV)
Hypothesis: Seeds from different origins vary with respect to seed
storage reserves due to genetic and maternal environment effects,
which can be detected by NIR spectroscopy as a basis for
authentication of seed origin.
39
3 Material and methods
3.1 Tree species, seed samples and preparation
The feasibility of NIR spectroscopy for seed sorting and identification of seed
lots were investigated using different seed lots from temperate and boreal tree
species. The tree species included in the studies presented in this thesis were
Larix sibirica Ledeb., Larix kaempferi (Lamb.) Carr., Larix decidua Mill, L. ×
eurolepis Henry, Betula pendula Roth, Betula pubescens Ehrh., and Picea
abies (L.) Karst. Interests in growing Larix species (commonly known as larch)
in the Northern hemisphere, particularly Fenno-Scandinavia, have grown over
the past few decades owing to their better juvenile growth, high timber quality,
adaptation to the harsh climate and relatively strong resistance to wind throw
and root- and butt rot (Polubojarinov et al., 2000; Karlman et al., 2011). Larix
sibirica Ledeb. is one of the promising timber species for planting in the boreal
ecosystem while L. × eurolepis is highly preferred for planting in the
temperate zone of southern Sweden. The hybrid larch exhibits heterotic vigor in growth performance (Matyssek & Schulze, 1987; Pâques, 1992; Baltunis, et
al., 1998) and is considered as a fast growing conifer possessing high quality
wood and suitable for reforestation purposes (Pâques, 1989).
Betula species (birch as common name) are regarded as pioneer species
growing typically in the northern hemisphere, over northern temperate and
boreal ecosystems. Birch can rapidly colonize gaps created by disturbance,
clear-cuttings and promote secondary succession owing to their vigorous seed
production and fast juvenile growth capacities (Fischer et al., 2002). They also
serve as nurse-trees for other late-successional species with more economic
traits (Renou-Wilson et al., 2010). Among Betula species, silver birch (Betula
pendula Roth) and downy birch (Betula pubescens Ehrh.) are commercially
important species in northern Europe, which look similar in their general
40
morphological appearance. Regarding the taxonomy of these birch species,
there has been scientific debates for a long time since its genetic and biological
variation within-family and between species is not always clear (Lundgren et
al., 1995; Atkinson et al., 1997; Fischer et al., 2002; Feehan et al., 2008;
Hynynen et al., 2010; Ashburner & McAllister, 2013). P. abies (Norway
spruce) is widely distributed in northern and central Europe where its stands
are managed mainly for timber production (Koski et al., 1997; Szymański,
2007).
For the discrimination of L. sibirica seed lot according to its viability
(Study I), four seed lots obtained from the Forest Research Institute, Sävar,
Sweden were used. The seed lots were first sorted into filled, empty and
petrified seeds by digital X-ray analysis (MX-20 Cabinet X-ray System;
Faxitron X-ray LLC, Lincolnshire, IL 600069) based on the international seed
testing rule (ISTA, 2003). Seeds with visible embryonic cavity and
megagametophyte (storage organ) were considered as viable; seeds without
any content (megagametophyte and embryo) were considered as empty while
seeds without embryonic axis and with purely white hardened content were
considered as petrified. In addition, the petrified seeds show a tube-like
structure possessing two lateral wings with no clear septa (Lycksell, 1993). In
total, 675 seed samples from four different seed lots were sorted into 225
filled-viable, empty and petrified seeds each and employed for NIR analysis.
To identify hybrid larch seeds from that of pure parent species (Study II),
seed lots of European larch produced in 2010 by controlled pollination of
known maternal (D02V983) and paternal (S21K9780044) clones, Japanese
larch produced by open pollination of known maternal clone (S08N1001) but
unknown paternal clone in 1995 and their hybrid (S21K9580102 ×
S21K9580032) produced by controlled pollination in 2010 were obtained from
clonal archive of the Swedish Forest Research Institute at Ekebo, Sweden. The
seeds were stored in a freezer (-4° C) from the time of harvest, and a total of
336 seed samples, 112 samples per species, were randomly drawn from the
total seed lots of each species to serve as working sub-samples for NIR
analysis.
To distinguish between B. pendula and B. pubescens as well as families
within species, seeds from three families of B. pendula (S21H1030038,
S21H0930014 and S21H0930019) and B. pubescens (S21H0030013,
S21H0030017 and S21H0030019), each were obtained from a clonal archive
of the Swedish Forest Research Institute at Ekebo, Sweden. The seeds were
41
produced by controlled crossings of known maternal and paternal parents in
year 2000 for B. pubescens and in 2009/2010 for B. pendula. The parental
material were all selected as plus-trees from stands in southern Sweden and
Finland to be used for long-termed breeding, and were at that time (1989-1991)
differentiated by morphological characters and later on also checked by
chemical markers using phenolic bark contents, particularly the B. pubescens
parents (Lundgren et al., 1995). The seed samples were continuously kept in a
freezer at -4℃ until the study was conducted. A total of 600 seed samples, 100
samples per family and species, were randomly drawn from each seed lot as a
working sub-sample.
To identify the origin of P. abies seed lots, five seed lots originating from
Sweden, Finland, Norway, Poland and Lithuania were used. The seed lots were
obtained from the Forest Research Institute, Sävar, Sweden. The seeds were
collected from stands, except the Lithuanian origin which was collected from a
seed orchard in Typevenai, and all seed lots had a germination capacity of
more than 92%. Each seed lot was divided into sub-samples, and a random
sample of 150 seeds per origin was taken for NIR analysis.
3.2 NIR spectral acquisition
In all the studies presented in this thesis, NIR reflectance spectra in the form of
log (1/R) were collected on individual seeds using XDS Rapid Content
Analyzer (FOSS NIRSystems, Inc.) from 400 – 2498 nm at 0.5 nm resolution.
The equipment had Silicon and InGaAS detectors with a tungsten-halogen
lamp as a radiation source. To acquire a spectrum, each single seed was placed
at the centre of the scanning glass window of the instrument with 9 mm
aperture at stationary module and then covered with the instrument’s lid with a
black background. Prior to collecting the NIR spectrum of single seed,
reference reflectance measurement was taken using the standard built-in
reference of the instrument. In addition, reference measurements were taken
after every 20 scans to reduce the effects of possible instrumental “drift”. For
every seed, 32 monochromatic scans were made and the average value
recorded.
3.3 Data analysis
The spectral data collected by NIR spectrometer were exported from Vision
Software (FOSS NIRSytems, Inc. VISION 3.5) as NSAS file and imported into
Simca-P+ software (Version 13.0.0.0, Umetrics AB, Sweden) for developing
42
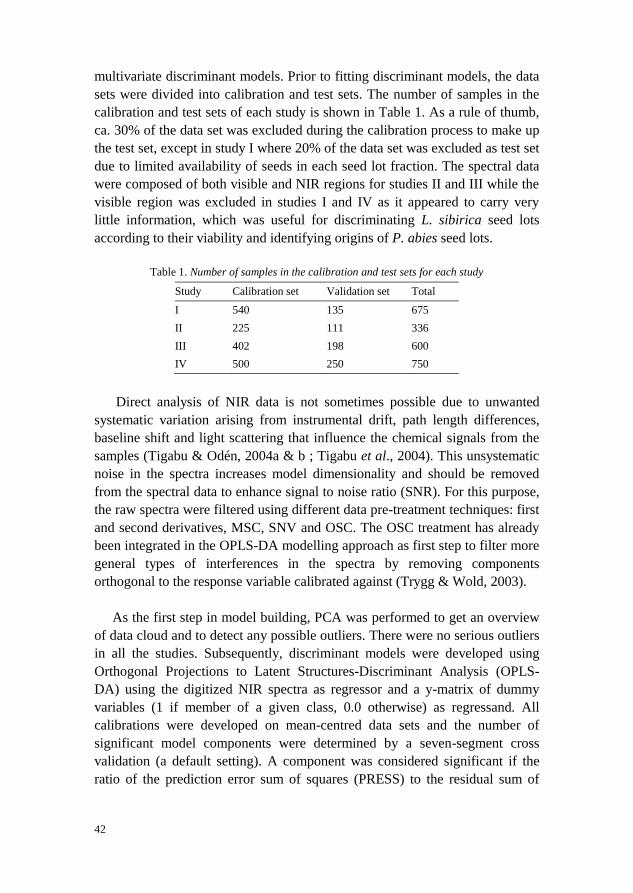
multivariate discriminant models. Prior to fitting discriminant models, the data
sets were divided into calibration and test sets. The number of samples in the
calibration and test sets of each study is shown in Table 1. As a rule of thumb,
ca. 30% of the data set was excluded during the calibration process to make up
the test set, except in study I where 20% of the data set was excluded as test set
due to limited availability of seeds in each seed lot fraction. The spectral data
were composed of both visible and NIR regions for studies II and III while the
visible region was excluded in studies I and IV as it appeared to carry very
little information, which was useful for discriminating L. sibirica seed lots
according to their viability and identifying origins of P. abies seed lots.
Table 1. Number of samples in the calibration and test sets for each study
Study Calibration set Validation set Total
I 540 135 675
II 225 111 336
III 402 198 600
IV 500 250 750
Direct analysis of NIR data is not sometimes possible due to unwanted
systematic variation arising from instrumental drift, path length differences,
baseline shift and light scattering that influence the chemical signals from the
samples (Tigabu & Odén, 2004a & b ; Tigabu et al., 2004). This unsystematic
noise in the spectra increases model dimensionality and should be removed
from the spectral data to enhance signal to noise ratio (SNR). For this purpose,
the raw spectra were filtered using different data pre-treatment techniques: first
and second derivatives, MSC, SNV and OSC. The OSC treatment has already
been integrated in the OPLS-DA modelling approach as first step to filter more
general types of interferences in the spectra by removing components
orthogonal to the response variable calibrated against (Trygg & Wold, 2003).
As the first step in model building, PCA was performed to get an overview
of data cloud and to detect any possible outliers. There were no serious outliers
in all the studies. Subsequently, discriminant models were developed using
Orthogonal Projections to Latent Structures-Discriminant Analysis (OPLS-
DA) using the digitized NIR spectra as regressor and a y-matrix of dummy
variables (1 if member of a given class, 0.0 otherwise) as regressand. All
calibrations were developed on mean-centred data sets and the number of
significant model components were determined by a seven-segment cross
validation (a default setting). A component was considered significant if the
ratio of the prediction error sum of squares (PRESS) to the residual sum of
43
squares of the previous dimension (SS) was statistically smaller than 1.0 (Næs
et al., 2002; Eriksson et al., 2006). The discriminant models were then used to
discriminate test set samples, which were excluded during the calibration
process. An observation was considered as a member of a given class if
predicted values were greater than a discrimination threshold (Ypred ≥ 0.5),
otherwise considered as non-member. The classification accuracy for test set
samples, expressed in percentage, was computed as the proportion of seeds
predicted correctly as member of a given class to the total number of seeds in
the test set for that class.
In study IV, classification models were also developed using Soft
Independent Modelling of Class Analogy (SIMCA) approach, which is a
supervised multivariate classification method based on a disjoint principal
component analysis (PCA) for each class of similar observations (Erickson et
al., 2006). Based on the residuals of each samples from the PCA model, the
residual standard deviation (si) of an observation in the calibration set (also
called absolute distance to the model) and the pooled residual standard
deviation (S0) of the model were calculated. This, in turn, was used to calculate
the confidence interval or the critical distance to the model with an
approximate F-test with degrees of freedom of the observation and the model
at the 5% probability level. Samples in the test sets were then projected onto
the existing PCA models and their residual standard deviations were compared
to the critical distance of each class. Samples in the test set were classified as
(1) member of a given class if they fall within the critical distance of that class
with a probability of class membership greater than 5%, (2) not belonging to
any of the classes if they fall outside the critical distance and (3) belonging to
two classes if they fall within an area where the critical distances of two classes
intersect. The SIMCA classification results were graphically presented as
Coomans’ plots where class distances for two classes were plotted against each
other in a scatter plot.

44
45
4 Results and Discussion
4.1 Discrimination of Larix sibirica seed lots according to viability class
The OPLS-DA model developed to simultaneously discriminate filled-viable,
empty and petrified seeds had two predictive and 13 Y-orthogonal components
(A = 2 + 13). The total spectral variation described by the model was 100%; of
which the predictive variation (R2XP) accounted for 26.7% and the Y-
orthogonal spectral variation (R2Xo) constituted 73.3%. The predictive spectral
variation, in turn, modelled 84.2% of the class variation (R2Y) in the
calibration set with 82.0% prediction accuracy (Q2cv) according to cross
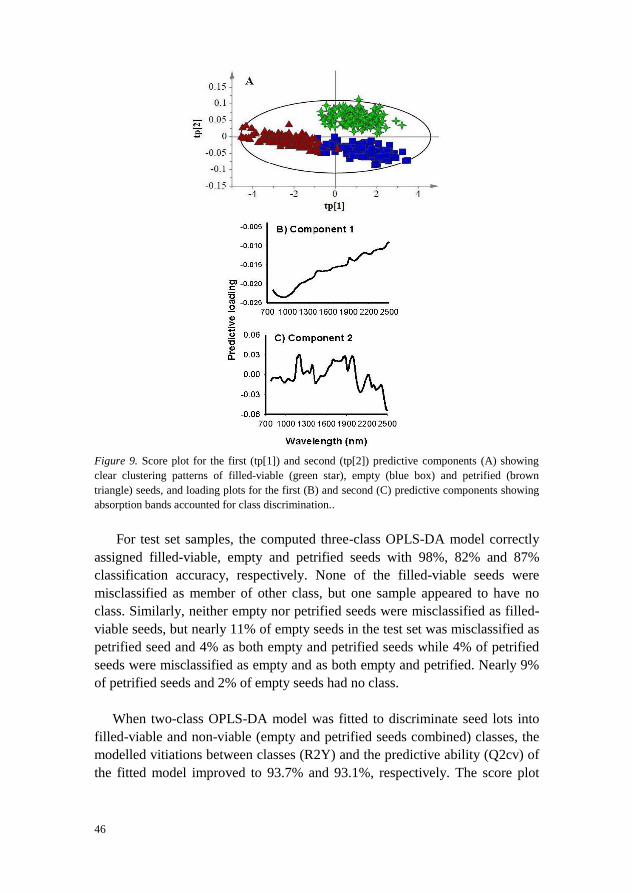
validation. The score plot for the predictive components (Figure 9A) showed
clear separation of petrified seeds from filled-viable and empty seeds along the
first component (tp[1]) and filled-viable seeds from the other two seed lot
fractions along the second component (tp[2]). The corresponding predictive
loading plot revealed that the absorption band in 780 – 1100 nm with a broad
peak centred at 970 nm was attributed to separating petrified seeds from filled-
viable and empty seeds (Figure 9B). Whereas absorption bands in 1140 – 1256
nm, 1268 – 1418 nm, 1590 – 2035 nm with major peaks at 1196 nm, 1390 nm,
1706 nm, 1859 nm, 1878 nm and 1986 nm were attributed to discriminate
filled-viable seeds from petrified and empty seeds (Figure 9C).
46
Figure 9. Score plot for the first (tp[1]) and second (tp[2]) predictive components (A) showing
clear clustering patterns of filled-viable (green star), empty (blue box) and petrified (brown
triangle) seeds, and loading plots for the first (B) and second (C) predictive components showing
absorption bands accounted for class discrimination..
For test set samples, the computed three-class OPLS-DA model correctly
assigned filled-viable, empty and petrified seeds with 98%, 82% and 87%
classification accuracy, respectively. None of the filled-viable seeds were
misclassified as member of other class, but one sample appeared to have no
class. Similarly, neither empty nor petrified seeds were misclassified as filled-
viable seeds, but nearly 11% of empty seeds in the test set was misclassified as
petrified seed and 4% as both empty and petrified seeds while 4% of petrified
seeds were misclassified as empty and as both empty and petrified. Nearly 9%
of petrified seeds and 2% of empty seeds had no class.
When two-class OPLS-DA model was fitted to discriminate seed lots into
filled-viable and non-viable (empty and petrified seeds combined) classes, the
modelled vitiations between classes (R2Y) and the predictive ability (Q2cv) of
the fitted model improved to 93.7% and 93.1%, respectively. The score plot
47
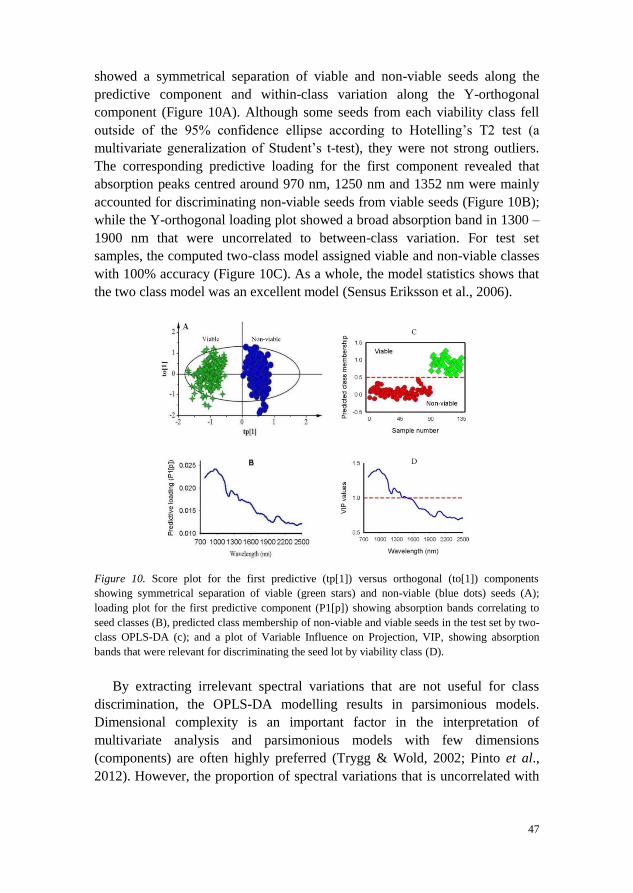
showed a symmetrical separation of viable and non-viable seeds along the
predictive component and within-class variation along the Y-orthogonal
component (Figure 10A). Although some seeds from each viability class fell
outside of the 95% confidence ellipse according to Hotelling’s T2 test (a
multivariate generalization of Student’s t-test), they were not strong outliers.
The corresponding predictive loading for the first component revealed that
absorption peaks centred around 970 nm, 1250 nm and 1352 nm were mainly
accounted for discriminating non-viable seeds from viable seeds (Figure 10B);
while the Y-orthogonal loading plot showed a broad absorption band in 1300 –
1900 nm that were uncorrelated to between-class variation. For test set
samples, the computed two-class model assigned viable and non-viable classes
with 100% accuracy (Figure 10C). As a whole, the model statistics shows that
the two class model was an excellent model (Sensus Eriksson et al., 2006).
Figure 10. Score plot for the first predictive (tp[1]) versus orthogonal (to[1]) components
showing symmetrical separation of viable (green stars) and non-viable (blue dots) seeds (A);
loading plot for the first predictive component (P1[p]) showing absorption bands correlating to
seed classes (B), predicted class membership of non-viable and viable seeds in the test set by two-
class OPLS-DA (c); and a plot of Variable Influence on Projection, VIP, showing absorption
bands that were relevant for discriminating the seed lot by viability class (D).
By extracting irrelevant spectral variations that are not useful for class
discrimination, the OPLS-DA modelling results in parsimonious models.
Dimensional complexity is an important factor in the interpretation of
multivariate analysis and parsimonious models with few dimensions
(components) are often highly preferred (Trygg & Wold, 2002; Pinto et al.,
2012). However, the proportion of spectral variations that is uncorrelated with

48
class discrimination is larger than the predictive variation. This might be
attributed to spectral redundancy. As the absorbance values were measured at
0.5 nm wavelength interval, it is legitimate to expect a high degree of
redundancy in the absorbance values at this scale of resolution. In addition,
variations in size and moisture content among individual seeds induce path
length difference and light scattering, which in turn are uncorrelated to class
discrimination (Tigabu & Odén, 2004b). This is further evidenced from the Y-
orthogonal score plot where few samples from each class positioned far away
from the bulk of the samples while the corresponding orthogonal loading plot
showed a major absorption peak at 970 nm, which is attributed to water
(Lestander & Odén, 2002). Thus, variation in moisture content among
individual seeds could be a source of unwanted spectral variation that had no
correlation with class discrimination. Nevertheless, NIR spectroscopy is highly
sensitive in detecting subtle differences as low as 0.1% of the total
concentration of the analyte (Osborne et al., 1993) while multivariate analysis
is powerful in extracting such information from the spectra (Eriksson et al.,
2006).
The VIP plot shows that absorbance in 780 – 1300 nm with a major peak
centred around 970 nm, and a smaller peak at 1256 nm as well as a small bump
at 1350 nm had a strong influence on the discrimination of filled-viable and
non-viable seeds (VIP > 1; Figure 10D). The spectral region between 1414 nm
and 1644 nm with a broad absorption band also accounted for class
discrimination. Other regions of interest in the longer wavelength range
appeared at 2080 nm that contributed well for class discrimination (VIP =
0.81). The absorption peaks together with functional groups responsible for
absorption and the tentative compounds are given in Table 2. The absorption
band in 780 – 1100 nm with a broad peak centred at 970 nm was positively
correlated with petrified seeds. This region is characterized by O – H stretching
second overtone where absorption spectra of aliphatic and aromatic hydroxyl
groups as well as starch and water overlap (Osborne et al., 1993; Workman &
Weyer, 2012). Lestander and Odén (2002) found the absorption peak at 970
nm useful to detect moisture difference between filled-viable and dead-filled
seeds of Scots pine. As petrified seeds dry slowly and maintain fairly high
moisture content than empty seeds during drying, the origin of spectral
differences between petrified and empty seeds could be attributed to
divergence in moisture content between these seed lot fractions.
For discriminating filled-viable seeds from empty and petrified seeds, the
model utilized spectral information in the longer wavelength regions with
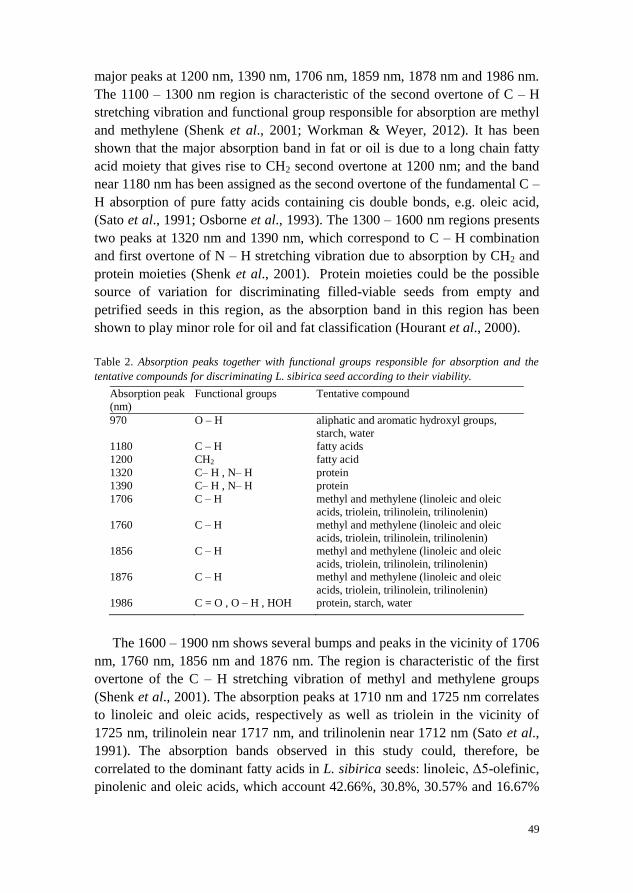
49
major peaks at 1200 nm, 1390 nm, 1706 nm, 1859 nm, 1878 nm and 1986 nm.
The 1100 – 1300 nm region is characteristic of the second overtone of C – H
stretching vibration and functional group responsible for absorption are methyl
and methylene (Shenk et al., 2001; Workman & Weyer, 2012). It has been
shown that the major absorption band in fat or oil is due to a long chain fatty
acid moiety that gives rise to CH2 second overtone at 1200 nm; and the band
near 1180 nm has been assigned as the second overtone of the fundamental C –
H absorption of pure fatty acids containing cis double bonds, e.g. oleic acid,
(Sato et al., 1991; Osborne et al., 1993). The 1300 – 1600 nm regions presents
two peaks at 1320 nm and 1390 nm, which correspond to C – H combination
and first overtone of N – H stretching vibration due to absorption by CH2 and
protein moieties (Shenk et al., 2001). Protein moieties could be the possible
source of variation for discriminating filled-viable seeds from empty and
petrified seeds in this region, as the absorption band in this region has been
shown to play minor role for oil and fat classification (Hourant et al., 2000).
Table 2. Absorption peaks together with functional groups responsible for absorption and the
tentative compounds for discriminating L. sibirica seed according to their viability.
Absorption peak
(nm)
Functional groups Tentative compound
970 O – H aliphatic and aromatic hydroxyl groups,
starch, water
1180 C – H fatty acids
1200 CH2 fatty acid
1320 C– H , N– H protein
1390 C– H , N– H protein
1706 C – H methyl and methylene (linoleic and oleic
acids, triolein, trilinolein, trilinolenin)
1760 C – H methyl and methylene (linoleic and oleic
acids, triolein, trilinolein, trilinolenin)
1856 C – H methyl and methylene (linoleic and oleic
acids, triolein, trilinolein, trilinolenin)
1876 C – H methyl and methylene (linoleic and oleic
acids, triolein, trilinolein, trilinolenin)
1986 C = O , O – H , HOH protein, starch, water
The 1600 – 1900 nm shows several bumps and peaks in the vicinity of 1706
nm, 1760 nm, 1856 nm and 1876 nm. The region is characteristic of the first
overtone of the C – H stretching vibration of methyl and methylene groups
(Shenk et al., 2001). The absorption peaks at 1710 nm and 1725 nm correlates
to linoleic and oleic acids, respectively as well as triolein in the vicinity of
1725 nm, trilinolein near 1717 nm, and trilinolenin near 1712 nm (Sato et al.,
1991). The absorption bands observed in this study could, therefore, be
correlated to the dominant fatty acids in L. sibirica seeds: linoleic, Δ5-olefinic,
pinolenic and oleic acids, which account 42.66%, 30.8%, 30.57% and 16.67%
50
of the total seed fatty acids, respectively (Wolff et al., 1997). The 1850 – 2050
nm region shows one absorption band, centred near 1986 nm that arises from C
= O stretch second overtone, combination of O – H stretch and HOH
deformation, as well as O – H bend second overtone. Several compounds,
notably protein, starch and water, show characteristic absorption in this region
(Shenk et al., 2001). The absorption band in this region presumably correlates
more to water than to other compounds because viable seeds often retain more
bound water than empty seeds. As a whole, the discriminant models utilized
spectral difference attributed to seed moisture content, seed coat chemical
compositions coupled with storage reserves as a basis to discriminate filled-
viable, empty and petrified seeds.
4.2 Identification of hybrid larch seeds
Both PLS-DA and O2PLS-DA models were developed using raw and pre-
treated data set in the Vis + NIR (400 – 2500 nm) and NIR (780 – 2500 nm)
regions to distinguish hybrid larch seeds from pure parental seeds. The PLS-
DA models fitted to Vis + NIR spectra required 9 to 15 significant components
(A) to describe 91% – 94% of the class variation (R2Y) in the calibration set,
depending on the data set. The prediction power of the models according to
cross-validation (Q2
cv) ranged from 85% to 87%. For samples in the test set,
the accuracy of predicted class membership for L × eurolepis was 100% across
all data sets, except the 2nd derivative data set where one seed sample was
rejected as a non-member. Similarly, the accuracy of predicted class
membership for L. decidua seeds was 97% – 100%; and that of L. kaempferi was 95% – 97%. For PLS-DA models fitted to NIR region alone, the number
of significant components to build the model was slightly lower than the
models built using Vis + NIR region. However, the computed models still
explained 86% – 94% of the class variation for the calibration set with 80% –
87% prediction ability according to cross-validation. For samples in the
prediction set, the classification accuracy of pure and hybrid larch seeds did not
change much compared to the model built using Vis + NIR region, except the
1st derivative data set that resulted in 13% less classification accuracy for L. kaempferi (cf. 84% in NIR and 97% in Vis + NIR).
The O2PLS-DA models developed using the Vis + NIR had two predictive
and 7 – 14 Y-orthogonal components, depending on the data set (e.g. A = 2 +
10 for untreated data set). The predictive spectral variation (R2XP) accounted
for 9% – 46% of the total spectral variation of the pure and hybrid seed classes
while the Y-orthogonal spectral variation (R2Xo) constituted 47% – 82%,
depending on the data set. The predictive spectral variations (R2XP), in turn,
modelled more than 90% of the variation between pure and hybrid seed classes
(R2Y) in the calibration set for all but raw data set, with 83% – 90% prediction
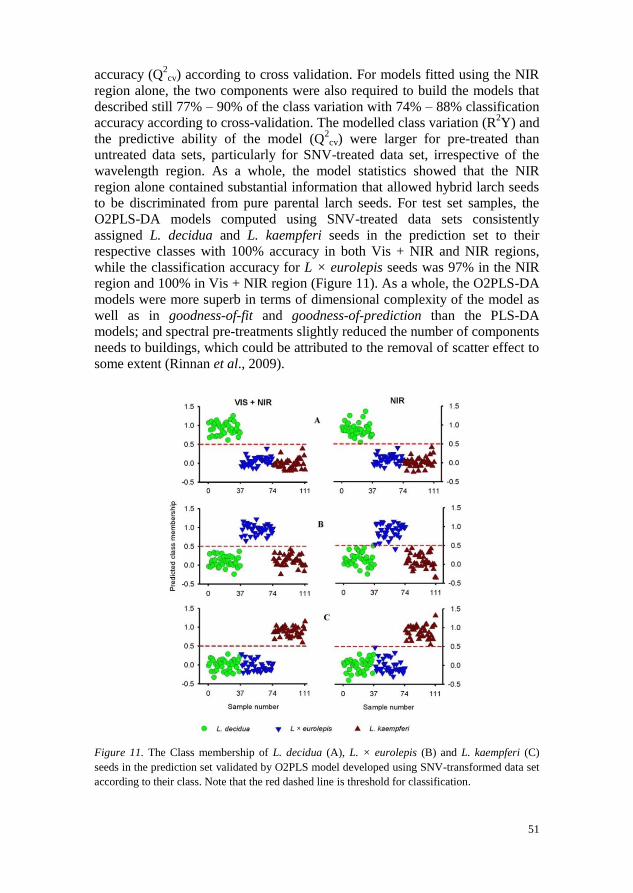
51
accuracy (Q2cv) according to cross validation. For models fitted using the NIR
region alone, the two components were also required to build the models that
described still 77% – 90% of the class variation with 74% – 88% classification
accuracy according to cross-validation. The modelled class variation (R2Y) and
the predictive ability of the model (Q2
cv) were larger for pre-treated than
untreated data sets, particularly for SNV-treated data set, irrespective of the
wavelength region. As a whole, the model statistics showed that the NIR
region alone contained substantial information that allowed hybrid larch seeds
to be discriminated from pure parental larch seeds. For test set samples, the
O2PLS-DA models computed using SNV-treated data sets consistently
assigned L. decidua and L. kaempferi seeds in the prediction set to their
respective classes with 100% accuracy in both Vis + NIR and NIR regions,
while the classification accuracy for L × eurolepis seeds was 97% in the NIR
region and 100% in Vis + NIR region (Figure 11). As a whole, the O2PLS-DA
models were more superb in terms of dimensional complexity of the model as
well as in goodness-of-fit and goodness-of-prediction than the PLS-DA
models; and spectral pre-treatments slightly reduced the number of components
needs to buildings, which could be attributed to the removal of scatter effect to
some extent (Rinnan et al., 2009).
Figure 11. The Class membership of L. decidua (A), L. × eurolepis (B) and L. kaempferi (C)
seeds in the prediction set validated by O2PLS model developed using SNV-transformed data set
according to their class. Note that the red dashed line is threshold for classification.
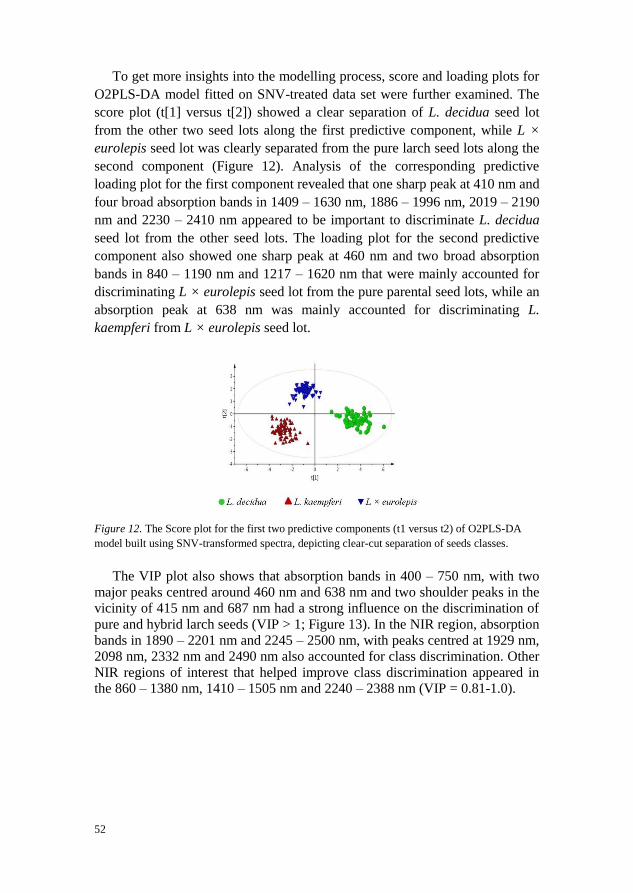
52
To get more insights into the modelling process, score and loading plots for
O2PLS-DA model fitted on SNV-treated data set were further examined. The
score plot (t[1] versus t[2]) showed a clear separation of L. decidua seed lot
from the other two seed lots along the first predictive component, while L ×
eurolepis seed lot was clearly separated from the pure larch seed lots along the
second component (Figure 12). Analysis of the corresponding predictive
loading plot for the first component revealed that one sharp peak at 410 nm and
four broad absorption bands in 1409 – 1630 nm, 1886 – 1996 nm, 2019 – 2190
nm and 2230 – 2410 nm appeared to be important to discriminate L. decidua
seed lot from the other seed lots. The loading plot for the second predictive
component also showed one sharp peak at 460 nm and two broad absorption
bands in 840 – 1190 nm and 1217 – 1620 nm that were mainly accounted for
discriminating L × eurolepis seed lot from the pure parental seed lots, while an
absorption peak at 638 nm was mainly accounted for discriminating L.
kaempferi from L × eurolepis seed lot.
Figure 12. The Score plot for the first two predictive components (t1 versus t2) of O2PLS-DA
model built using SNV-transformed spectra, depicting clear-cut separation of seeds classes.
The VIP plot also shows that absorption bands in 400 – 750 nm, with two
major peaks centred around 460 nm and 638 nm and two shoulder peaks in the
vicinity of 415 nm and 687 nm had a strong influence on the discrimination of
pure and hybrid larch seeds (VIP > 1; Figure 13). In the NIR region, absorption
bands in 1890 – 2201 nm and 2245 – 2500 nm, with peaks centred at 1929 nm,
2098 nm, 2332 nm and 2490 nm also accounted for class discrimination. Other
NIR regions of interest that helped improve class discrimination appeared in
the 860 – 1380 nm, 1410 – 1505 nm and 2240 – 2388 nm (VIP = 0.81-1.0).
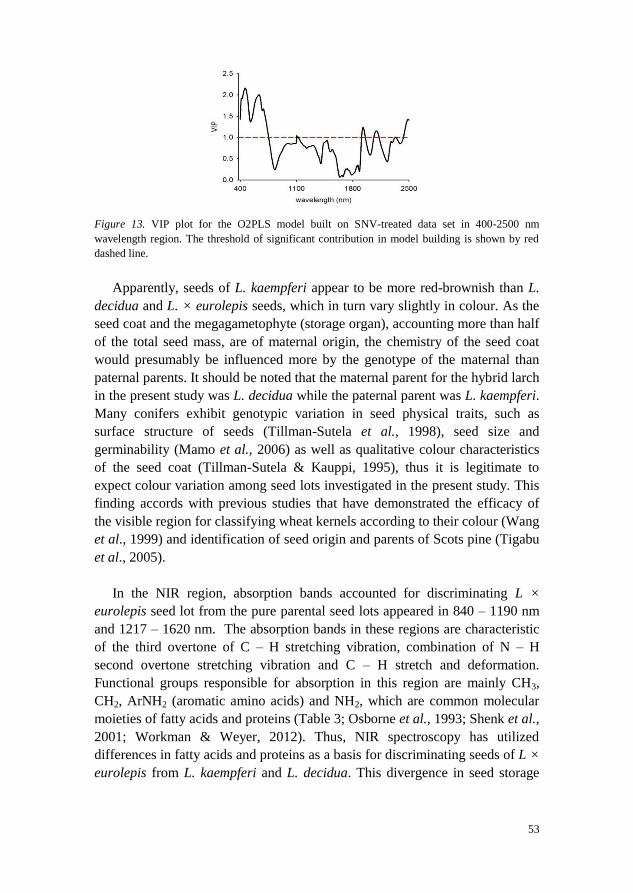
53
Figure 13. VIP plot for the O2PLS model built on SNV-treated data set in 400-2500 nm
wavelength region. The threshold of significant contribution in model building is shown by red
dashed line.
Apparently, seeds of L. kaempferi appear to be more red-brownish than L.
decidua and L. × eurolepis seeds, which in turn vary slightly in colour. As the
seed coat and the megagametophyte (storage organ), accounting more than half
of the total seed mass, are of maternal origin, the chemistry of the seed coat
would presumably be influenced more by the genotype of the maternal than
paternal parents. It should be noted that the maternal parent for the hybrid larch
in the present study was L. decidua while the paternal parent was L. kaempferi.
Many conifers exhibit genotypic variation in seed physical traits, such as
surface structure of seeds (Tillman-Sutela et al., 1998), seed size and
germinability (Mamo et al., 2006) as well as qualitative colour characteristics
of the seed coat (Tillman-Sutela & Kauppi, 1995), thus it is legitimate to
expect colour variation among seed lots investigated in the present study. This
finding accords with previous studies that have demonstrated the efficacy of
the visible region for classifying wheat kernels according to their colour (Wang
et al., 1999) and identification of seed origin and parents of Scots pine (Tigabu
et al., 2005).
In the NIR region, absorption bands accounted for discriminating L ×
eurolepis seed lot from the pure parental seed lots appeared in 840 – 1190 nm
and 1217 – 1620 nm. The absorption bands in these regions are characteristic
of the third overtone of C – H stretching vibration, combination of N – H
second overtone stretching vibration and C – H stretch and deformation.
Functional groups responsible for absorption in this region are mainly CH3,
CH2, ArNH2 (aromatic amino acids) and NH2, which are common molecular
moieties of fatty acids and proteins (Table 3; Osborne et al., 1993; Shenk et al.,
2001; Workman & Weyer, 2012). Thus, NIR spectroscopy has utilized
differences in fatty acids and proteins as a basis for discriminating seeds of L ×
eurolepis from L. kaempferi and L. decidua. This divergence in seed storage
54
reserves between hybrid and pure parental (particularly L. kaempferi) seeds is
expected because the contribution of the paternal parent (which is L. kaempferi
in this study) to the total seed mass is much lower than that of the maternal
parent. The embryo (a smaller fraction of the seed mass) is derived from both
parents while more than half of the seed mass is of maternal origin. Maternal
variation in seed storage reserves is also evident as reproductive allocation in
plants is generally governed by the genetic constitution (see review, Bazzaz et
al., 2000). Tigabu et al. (2005) have found maternal variation in storage
reserves as the basis for identifying among maternal parents of Scots pine
using NIR spectra.
The absorption bands in 1409 – 1630 nm, 1886 – 1996 nm, 2019 – 2190 nm
and 2230 – 2410 nm were highly relevant for discriminating L. decidua seeds
from L × eurolepis and L. kaempferi seeds. The absorption peaks together with
functional groups responsible for absorption and the tentative compounds are
given in Table 3. The 1409 – 1630 nm region of the NIR reflectance spectra
presents two broad peaks at 1480 nm and 1550 nm, which corresponds to first
overtone of O – H and N – H and combination band of C – H vibration of
various functional groups; notably ROH, starch, H2O and protein moieties
(Workman & Weyer, 2012). The absorption band in 1900 – 2000 nm with
absorption peak centred at 1929 nm arises from C = O stretch second overtone,
combination of O – H stretch and HOH deformation, and O – H bend second
overtone. Molecular moieties of protein, starch and water show overlapping
absorption peaks in this region (Shenk et al., 2001; Workman & Weyer, 2012).
The absorption bands in 2019 – 2190 nm and 2230 – 2410 nm are
characteristic of CH2 stretch-bend combinations as well as other vibrational
modes of molecular bonds (Workman & Weyer, 2012). Several fatty acids,
notably polyunsaturated fatty acids, in several oil crops have shown positive
correlation to absorption bands in these regions (Osborne et al., 1993; Hourant
et al., 2000). Tigabu and Oden (2003a) also found correlations between
absorbance values in these spectral regions and major fatty acids as a basis for
discrimination of viable and empty seeds of Pinus patula.
Thus, it appears that NIR spectroscopy detected differences in the amount
of reserve compounds, mainly lipids, and proteins, as well as seed moisture
content to distinguish seeds of L. decidua from seeds of L × eurolepis and L.
kaempferi. Fatty acids such as linoleic, Δ5-olefinic, pinolenic and oleic acids
were the major composition in seeds of larch species that contributed to the
discrimination of filled-viable, empty and insect-attacked seeds of three larch
species in a previous study (Tigabu & Oden, 2004b). It should be noted that

55
lipids are the dominant reserve compounds in seeds of many conifers including
those of larch; and the major fatty acids include linoleic, Δ5-olefinic, pinolenic
and oleic acids that account for 43.1%, 30.6%, 27.4% and 18.8% of the total
fatty acids, respectively in L. decidua seeds while linoleic acid accounts for
45.5%, Δ5-olefinic acid for 28.9%, pinolenic acid for 25.8% and oleic acids for
18.4% of the total fatty acids in seed lipids of L. kaempferi (Wolff et al., 1997
& 2001).
Table 3. Absorption bands and peaks together with functional groups responsible for absorption
and the tentative compounds accounted for identification of hybrid larch seeds
Bands/peaks (nm) Functional groups Tentative compound
840 – 1190 C – H , N – H fatty acids and proteins
1217 – 1620 C – H , N – H fatty acids and proteins
1480 O – H , N – H , C – H ROH, starch, H2O and protein
1550 O – H , N – H , C – H ROH, starch, H2O and protein
1929 C = O, O – H protein, starch and water
2019 – 2190 CH2 fatty acids
2230 – 2410 CH2 fatty acids
4.3 Discrimination between two birch species and their families
OPLS-DA models were developed to distinguish between B. pubescens and B.
pendula based on Vis + NIR, visible and NIR spectra of single seed. The
model developed using the Vis + NIR region had one predictive and 10 Y-
orthogonal components (A = 1 + 10). The total spectral variation described by
the model was 97.2%; of which the predictive spectral variation (R2XP)
accounted for 16.8% and the spectral variation uncorrelated to the classes
(R2Xo) constituted 80.3%. This small proportion of predictive spectral variation
modelled 93.6% of the variation between species (R2Y) with 91.9% predictive
power (Q2cv) according to cross validation. When the model was fitted on
either visible or NIR spectra alone, both the proportion of modelled variation
between species and the predictive power according to cross-validation were
decreased, but still the models explained 75.9% - 84.9% of the variation
between species.
The score and loading plots of OPLS-DA model fitted on Vis + NIR
spectral data were examined to get insights into the modelling process and to
understand which phenomena were irrelevant for distinguishing between B.
pendula and B. pubescens (Figure 14). The score plot for the first predictive
and orthogonal components (tp[1] versus to[1]) showed symmetrical separation
of B. pubescens and B. pendula in the calibration set (X-axis) while the
orthogonal scores revealed within species variation (Y-axis), particularly vivid
56
for B. pubescens (Figure 14A). There were few samples of B. pubescens that
fell outside the 95% confidence ellipse according to Hotelling’s T2 test (a
multivariate generalization of Student’s t-test), but these samples were
moderate outliers and excluding them from the calibration set did not improve
the model. The corresponding predictive loading plot (Figure 14B) revealed
that B. pendula seeds had high absorbance values in the visible region with
absorption maxima at 465 nm while B. pubescens seeds had high absorbance
values in both visible and NIR regions with shoulder peaks at 643 nm, 1410
nm, 1700 nm, 1895 nm, 2045 nm and 2250 nm. The orthogonal loading plot
showed one major absorption maxima at 690 nm and several shoulder peaks in
both visible and NIR regions that were irrelevant for the classification of birch
species (Figure 14C). Note that the narrow peak at 1100 nm was due to a shift
in the detection system from Silicon-detector in 780 – 1100 nm to InGaAs-
detector in 1100 – 2500 nm.
For samples in the test set, the OPLS-DA model fitted on Vis + NIR spectra
assigned B. pubescens and B. pendula to their respective classes except for one
B. pendula sample that was misclassified as B. pubescens (Figure 14D). The
overall prediction accuracy of class membership was 100% for B. pubescens
and 99% for B. pendula. Similarly, the discriminant model developed using the
visible region alone resulted in 99% classification accuracy for both birch
species (Figure 14E), while the model developed in the NIR region alone
distinguished B. pubescens and B. pendula with 98% and 94% accuracy,
respectively (Figure 14F).
Similarly discriminant models were fitted on Vis + NIR spectra to
distinguish among three families of each birch species; and the computed
models described 83% of the variation among B. pendula families (R2Y) with
80.6% predictive power (Q2cv) according to cross validation using 52.3% of the
spectral variation. The model fitted on visible spectra alone had slightly lower
explained variation among B. pendula families and the predictive power while
the model fitted on NIR spectral alone had slightly higher the explained
variation and the predictive power of the model than full spectra model. For B.
pubescens, the modelled variation among families was 93.7% and the
predictive power of the model was 91% for the Vis + NIR region, but these
values decreased slightly when the model was fitted on either visible or NIR
region alone. As a whole, the model statistics highlight the feasibility of Vis +
NIR spectroscopy for identifying seeds by genotypes.
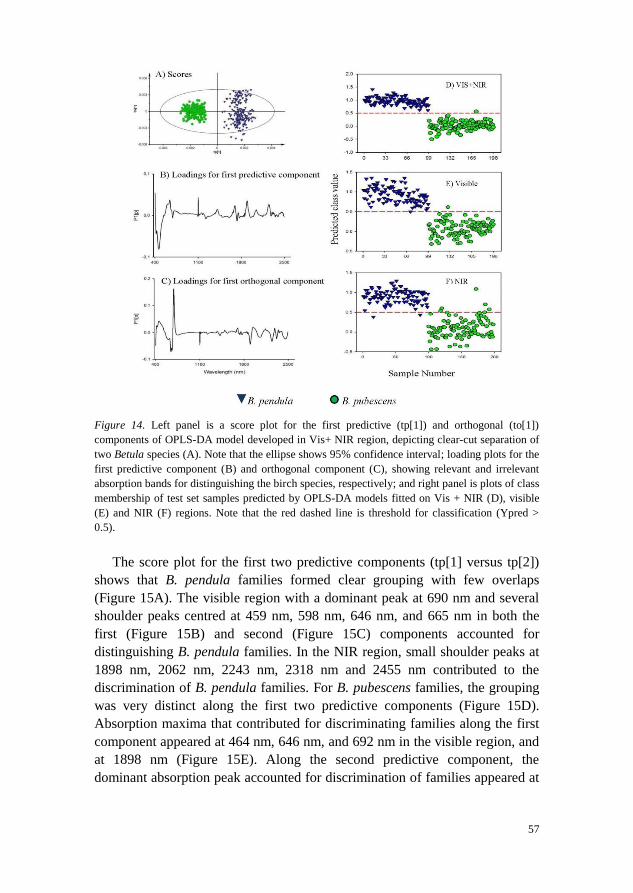
57
Figure 14. Left panel is a score plot for the first predictive (tp[1]) and orthogonal (to[1])
components of OPLS-DA model developed in Vis+ NIR region, depicting clear-cut separation of
two Betula species (A). Note that the ellipse shows 95% confidence interval; loading plots for the
first predictive component (B) and orthogonal component (C), showing relevant and irrelevant
absorption bands for distinguishing the birch species, respectively; and right panel is plots of class
membership of test set samples predicted by OPLS-DA models fitted on Vis + NIR (D), visible
(E) and NIR (F) regions. Note that the red dashed line is threshold for classification (Ypred >
0.5).
The score plot for the first two predictive components (tp[1] versus tp[2])
shows that B. pendula families formed clear grouping with few overlaps
(Figure 15A). The visible region with a dominant peak at 690 nm and several
shoulder peaks centred at 459 nm, 598 nm, 646 nm, and 665 nm in both the
first (Figure 15B) and second (Figure 15C) components accounted for
distinguishing B. pendula families. In the NIR region, small shoulder peaks at
1898 nm, 2062 nm, 2243 nm, 2318 nm and 2455 nm contributed to the
discrimination of B. pendula families. For B. pubescens families, the grouping
was very distinct along the first two predictive components (Figure 15D).
Absorption maxima that contributed for discriminating families along the first
component appeared at 464 nm, 646 nm, and 692 nm in the visible region, and
at 1898 nm (Figure 15E). Along the second predictive component, the
dominant absorption peak accounted for discrimination of families appeared at
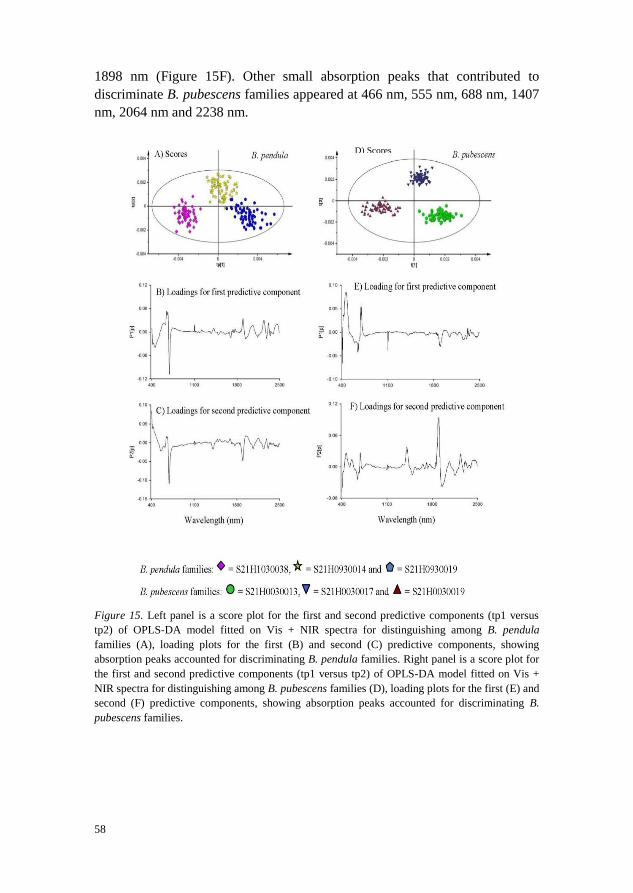
58
1898 nm (Figure 15F). Other small absorption peaks that contributed to
discriminate B. pubescens families appeared at 466 nm, 555 nm, 688 nm, 1407
nm, 2064 nm and 2238 nm.
Figure 15. Left panel is a score plot for the first and second predictive components (tp1 versus
tp2) of OPLS-DA model fitted on Vis + NIR spectra for distinguishing among B. pendula
families (A), loading plots for the first (B) and second (C) predictive components, showing
absorption peaks accounted for discriminating B. pendula families. Right panel is a score plot for
the first and second predictive components (tp1 versus tp2) of OPLS-DA model fitted on Vis +
NIR spectra for distinguishing among B. pubescens families (D), loading plots for the first (E) and
second (F) predictive components, showing absorption peaks accounted for discriminating B.
pubescens families.
D) Scores
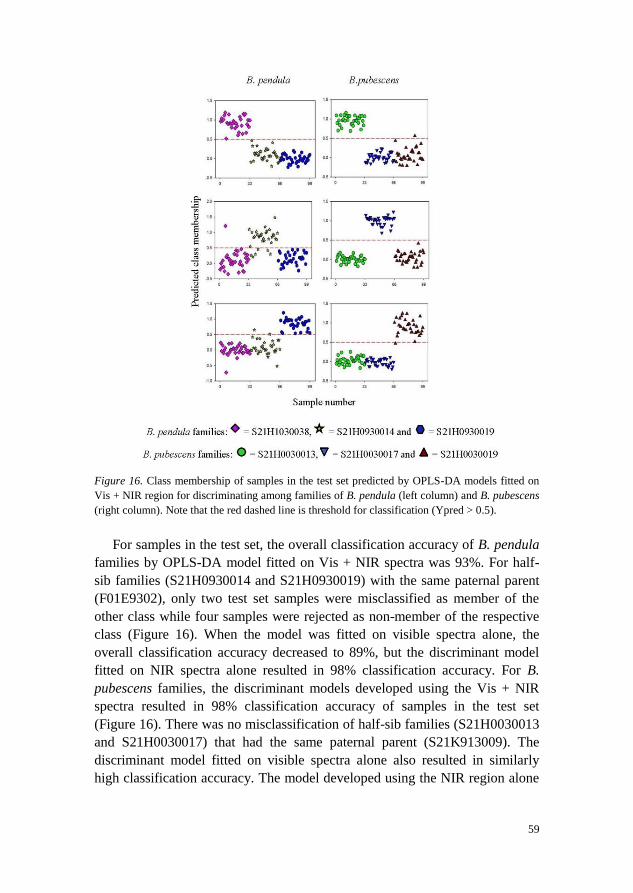
59
Figure 16. Class membership of samples in the test set predicted by OPLS-DA models fitted on
Vis + NIR region for discriminating among families of B. pendula (left column) and B. pubescens
(right column). Note that the red dashed line is threshold for classification (Ypred > 0.5).
For samples in the test set, the overall classification accuracy of B. pendula
families by OPLS-DA model fitted on Vis + NIR spectra was 93%. For half-
sib families (S21H0930014 and S21H0930019) with the same paternal parent
(F01E9302), only two test set samples were misclassified as member of the
other class while four samples were rejected as non-member of the respective
class (Figure 16). When the model was fitted on visible spectra alone, the
overall classification accuracy decreased to 89%, but the discriminant model
fitted on NIR spectra alone resulted in 98% classification accuracy. For B.
pubescens families, the discriminant models developed using the Vis + NIR
spectra resulted in 98% classification accuracy of samples in the test set
(Figure 16). There was no misclassification of half-sib families (S21H0030013
and S21H0030017) that had the same paternal parent (S21K913009). The
discriminant model fitted on visible spectra alone also resulted in similarly
high classification accuracy. The model developed using the NIR region alone
60
had slightly lower classification accuracy, particularly for one family, than the
other models, albeit overall high classification accuracy.
Analysis of VIP plot revealed that the absorption band in 400 – 750 nm,
with two major absorption peaks centred at 465 nm and 643 nm and two
shoulder peaks at 422 nm and 613 nm were highly relevant for distinguishing
B. pendula and B. pubescens (VIP > 1; Figure 17A). In the NIR region,
absorption peaks centred at 1697 nm, 1895 nm and 2247 nm were highly
relevant for discrimination of the two birch species. Other absorption peaks in
the NIR region which were relevant for species discrimination appeared at
1407 nm, 1730 nm, and 2045 nm (VIP = 0.8 – 1.0). For discriminating B.
pendula families, the most relevant absorption peaks in the visible region were
observed at 482 nm, 664 nm and 689 nm while peaks at 1898 nm, 2242 nm and
2317 nm were highly relevant for discriminating families in the NIR region
(Figure 17B). Other peaks in the NIR region that contributed to discrimination
of families appeared at 1413 nm, 1697 nm, 1943 nm, 2060 nm, 2140 nm, 2285
nm and 2468 nm. For B. pubescens, absorption peaks accounted for
discrimination of families appeared at 464 nm, 643 nm and 690 nm in the
visible region and 1407 nm, 1897 nm, 1950 nm and 2239 nm in the NIR region
(Figure 17C). Other absorption peaks that contributed to family-discrimination
of this species were also found at 595 nm, 2156 nm, 2307 nm and 2458 nm.
From the loading plot, it can be seen that the absorption peak at 465 nm
correlates positively with B. pendula whereas the peak at 643 nm correlates
positively with B. pubescens. Apparently, seeds of B. pubescens appear to be
more red-brownish than B. pendula seeds, which in turn vary among families
within each species. This finding is consistent with previous studies that have
demonstrated the usefulness of reflectance spectra in the visible region for
identification of seed origin and parents of Scots pine (Tigabu et al., 2005) as
well as for seeds of hybrid larch and its’ parental species (Farhadi et al., 2015).
In NIR region, absorption bands in 1350 – 1450 nm, 1660 – 1740 nm, 1800 –
1930 nm and 2000 – 2270 nm were highly relevant for discriminating B.
pendula from B. pubescens, and the spectral signature was dominantly
emanated from B. pubescens seeds as evidenced from the positive loadings in
these regions.
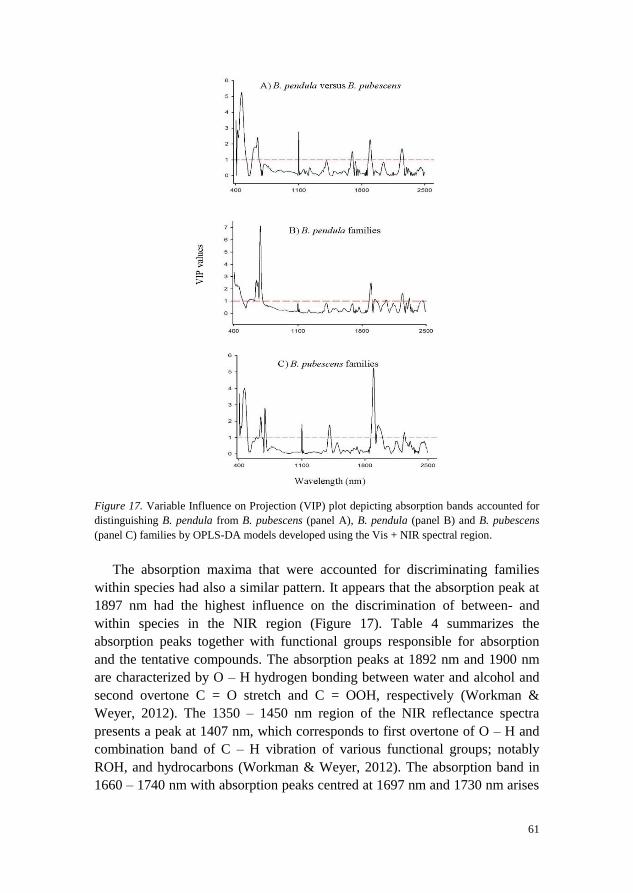
61
Figure 17. Variable Influence on Projection (VIP) plot depicting absorption bands accounted for
distinguishing B. pendula from B. pubescens (panel A), B. pendula (panel B) and B. pubescens
(panel C) families by OPLS-DA models developed using the Vis + NIR spectral region.
The absorption maxima that were accounted for discriminating families
within species had also a similar pattern. It appears that the absorption peak at
1897 nm had the highest influence on the discrimination of between- and
within species in the NIR region (Figure 17). Table 4 summarizes the
absorption peaks together with functional groups responsible for absorption
and the tentative compounds. The absorption peaks at 1892 nm and 1900 nm
are characterized by O – H hydrogen bonding between water and alcohol and
second overtone C = O stretch and C = OOH, respectively (Workman &
Weyer, 2012). The 1350 – 1450 nm region of the NIR reflectance spectra
presents a peak at 1407 nm, which corresponds to first overtone of O – H and
combination band of C – H vibration of various functional groups; notably
ROH, and hydrocarbons (Workman & Weyer, 2012). The absorption band in
1660 – 1740 nm with absorption peaks centred at 1697 nm and 1730 nm arises
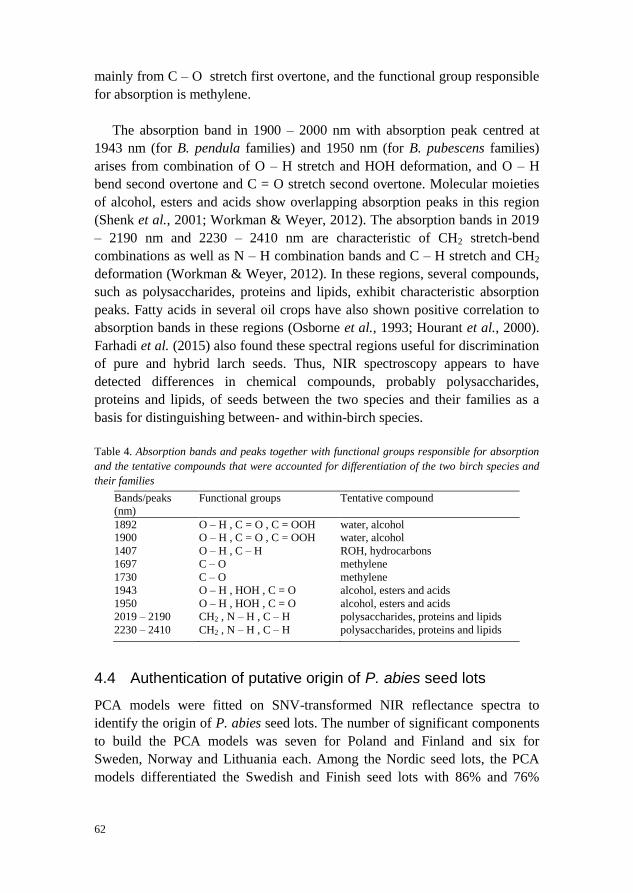
62
mainly from C – O stretch first overtone, and the functional group responsible
for absorption is methylene.
The absorption band in 1900 – 2000 nm with absorption peak centred at
1943 nm (for B. pendula families) and 1950 nm (for B. pubescens families)
arises from combination of O – H stretch and HOH deformation, and O – H
bend second overtone and C = O stretch second overtone. Molecular moieties
of alcohol, esters and acids show overlapping absorption peaks in this region
(Shenk et al., 2001; Workman & Weyer, 2012). The absorption bands in 2019
– 2190 nm and 2230 – 2410 nm are characteristic of CH2 stretch-bend
combinations as well as N – H combination bands and C – H stretch and CH2
deformation (Workman & Weyer, 2012). In these regions, several compounds,
such as polysaccharides, proteins and lipids, exhibit characteristic absorption
peaks. Fatty acids in several oil crops have also shown positive correlation to
absorption bands in these regions (Osborne et al., 1993; Hourant et al., 2000).
Farhadi et al. (2015) also found these spectral regions useful for discrimination
of pure and hybrid larch seeds. Thus, NIR spectroscopy appears to have
detected differences in chemical compounds, probably polysaccharides,
proteins and lipids, of seeds between the two species and their families as a
basis for distinguishing between- and within-birch species.
Table 4. Absorption bands and peaks together with functional groups responsible for absorption
and the tentative compounds that were accounted for differentiation of the two birch species and
their families
Bands/peaks
(nm)
Functional groups Tentative compound
1892 O – H , C = O , C = OOH water, alcohol
1900 O – H , C = O , C = OOH water, alcohol
1407 O – H , C – H ROH, hydrocarbons
1697 C – O methylene
1730 C – O methylene
1943 O – H , HOH , C = O alcohol, esters and acids
1950 O – H , HOH , C = O alcohol, esters and acids
2019 – 2190 CH2 , N – H , C – H polysaccharides, proteins and lipids
2230 – 2410 CH2 , N – H , C – H polysaccharides, proteins and lipids
4.4 Authentication of putative origin of P. abies seed lots
PCA models were fitted on SNV-transformed NIR reflectance spectra to
identify the origin of P. abies seed lots. The number of significant components
to build the PCA models was seven for Poland and Finland and six for
Sweden, Norway and Lithuania each. Among the Nordic seed lots, the PCA
models differentiated the Swedish and Finish seed lots with 86% and 76%
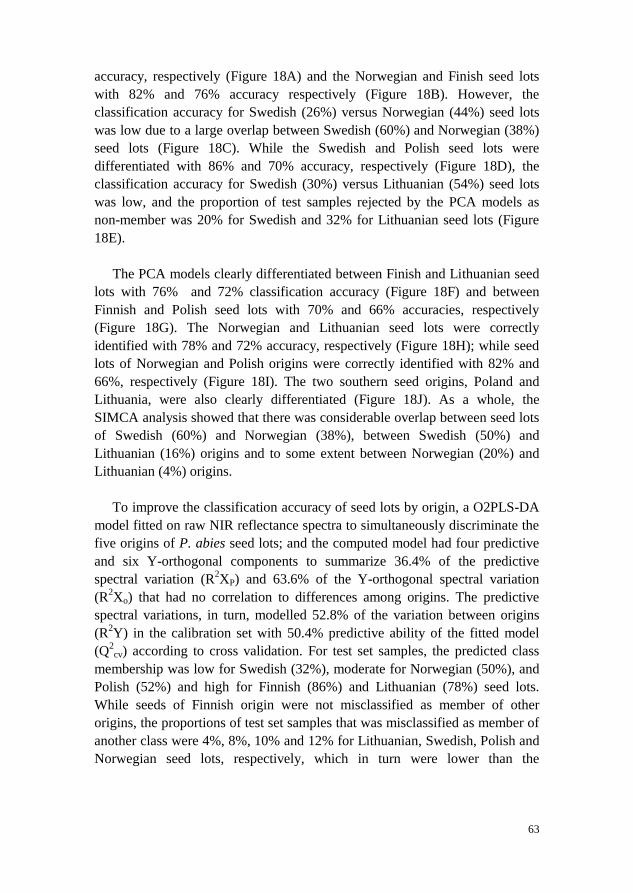
63
accuracy, respectively (Figure 18A) and the Norwegian and Finish seed lots
with 82% and 76% accuracy respectively (Figure 18B). However, the
classification accuracy for Swedish (26%) versus Norwegian (44%) seed lots
was low due to a large overlap between Swedish (60%) and Norwegian (38%)
seed lots (Figure 18C). While the Swedish and Polish seed lots were
differentiated with 86% and 70% accuracy, respectively (Figure 18D), the
classification accuracy for Swedish (30%) versus Lithuanian (54%) seed lots
was low, and the proportion of test samples rejected by the PCA models as
non-member was 20% for Swedish and 32% for Lithuanian seed lots (Figure
18E).
The PCA models clearly differentiated between Finish and Lithuanian seed
lots with 76% and 72% classification accuracy (Figure 18F) and between
Finnish and Polish seed lots with 70% and 66% accuracies, respectively
(Figure 18G). The Norwegian and Lithuanian seed lots were correctly
identified with 78% and 72% accuracy, respectively (Figure 18H); while seed
lots of Norwegian and Polish origins were correctly identified with 82% and
66%, respectively (Figure 18I). The two southern seed origins, Poland and
Lithuania, were also clearly differentiated (Figure 18J). As a whole, the
SIMCA analysis showed that there was considerable overlap between seed lots
of Swedish (60%) and Norwegian (38%), between Swedish (50%) and
Lithuanian (16%) origins and to some extent between Norwegian (20%) and
Lithuanian (4%) origins.
To improve the classification accuracy of seed lots by origin, a O2PLS-DA
model fitted on raw NIR reflectance spectra to simultaneously discriminate the
five origins of P. abies seed lots; and the computed model had four predictive
and six Y-orthogonal components to summarize 36.4% of the predictive
spectral variation (R2XP) and 63.6% of the Y-orthogonal spectral variation
(R2Xo) that had no correlation to differences among origins. The predictive
spectral variations, in turn, modelled 52.8% of the variation between origins
(R2Y) in the calibration set with 50.4% predictive ability of the fitted model
(Q2
cv) according to cross validation. For test set samples, the predicted class
membership was low for Swedish (32%), moderate for Norwegian (50%), and
Polish (52%) and high for Finnish (86%) and Lithuanian (78%) seed lots.
While seeds of Finnish origin were not misclassified as member of other
origins, the proportions of test set samples that was misclassified as member of
another class were 4%, 8%, 10% and 12% for Lithuanian, Swedish, Polish and
Norwegian seed lots, respectively, which in turn were lower than the
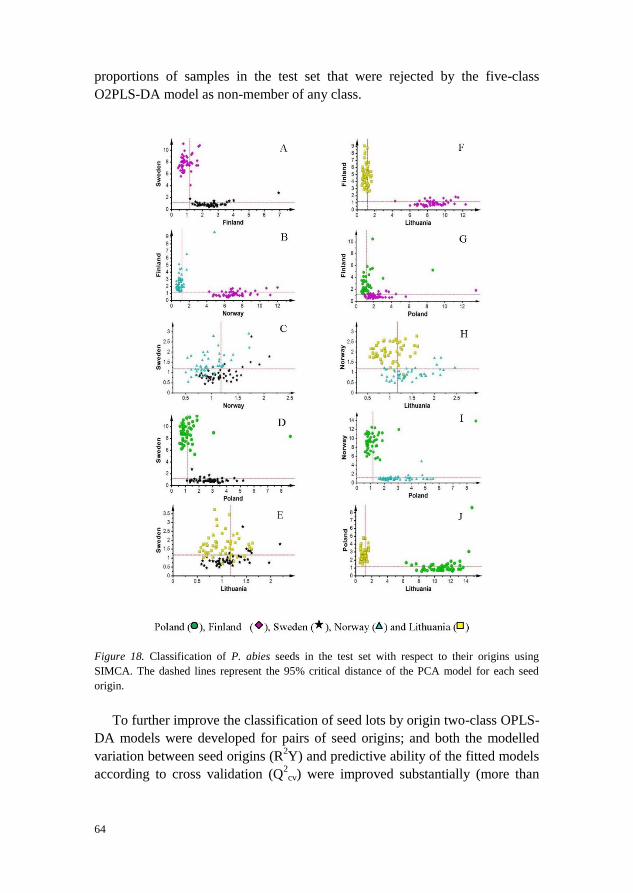
64
proportions of samples in the test set that were rejected by the five-class
O2PLS-DA model as non-member of any class.
Figure 18. Classification of P. abies seeds in the test set with respect to their origins using
SIMCA. The dashed lines represent the 95% critical distance of the PCA model for each seed
origin.
To further improve the classification of seed lots by origin two-class OPLS-
DA models were developed for pairs of seed origins; and both the modelled
variation between seed origins (R2Y) and predictive ability of the fitted models
according to cross validation (Q2cv) were improved substantially (more than
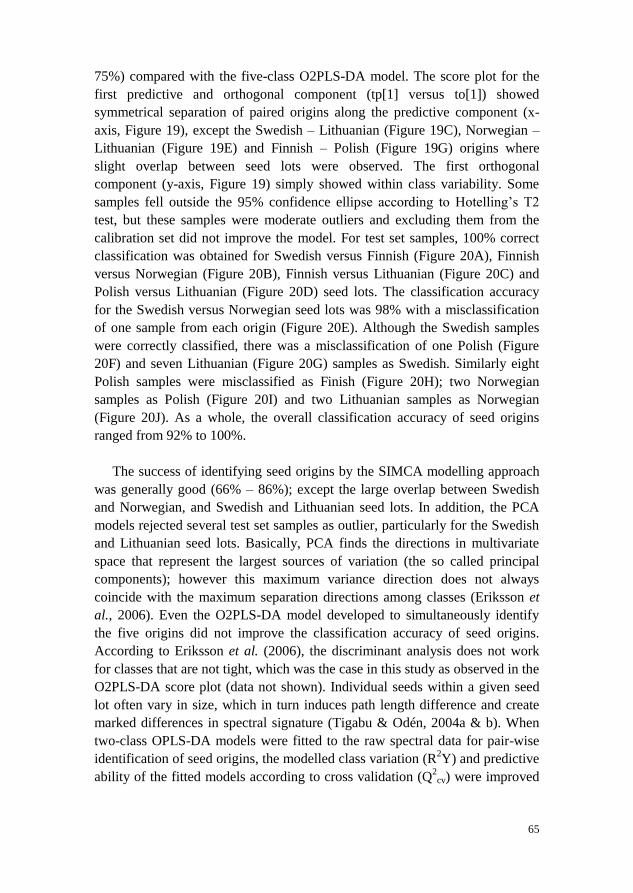
65
75%) compared with the five-class O2PLS-DA model. The score plot for the
first predictive and orthogonal component (tp[1] versus to[1]) showed
symmetrical separation of paired origins along the predictive component (x-
axis, Figure 19), except the Swedish – Lithuanian (Figure 19C), Norwegian –
Lithuanian (Figure 19E) and Finnish – Polish (Figure 19G) origins where
slight overlap between seed lots were observed. The first orthogonal
component (y-axis, Figure 19) simply showed within class variability. Some
samples fell outside the 95% confidence ellipse according to Hotelling’s T2
test, but these samples were moderate outliers and excluding them from the
calibration set did not improve the model. For test set samples, 100% correct
classification was obtained for Swedish versus Finnish (Figure 20A), Finnish
versus Norwegian (Figure 20B), Finnish versus Lithuanian (Figure 20C) and
Polish versus Lithuanian (Figure 20D) seed lots. The classification accuracy
for the Swedish versus Norwegian seed lots was 98% with a misclassification
of one sample from each origin (Figure 20E). Although the Swedish samples
were correctly classified, there was a misclassification of one Polish (Figure
20F) and seven Lithuanian (Figure 20G) samples as Swedish. Similarly eight
Polish samples were misclassified as Finish (Figure 20H); two Norwegian
samples as Polish (Figure 20I) and two Lithuanian samples as Norwegian
(Figure 20J). As a whole, the overall classification accuracy of seed origins
ranged from 92% to 100%.
The success of identifying seed origins by the SIMCA modelling approach
was generally good (66% – 86%); except the large overlap between Swedish
and Norwegian, and Swedish and Lithuanian seed lots. In addition, the PCA
models rejected several test set samples as outlier, particularly for the Swedish
and Lithuanian seed lots. Basically, PCA finds the directions in multivariate
space that represent the largest sources of variation (the so called principal
components); however this maximum variance direction does not always
coincide with the maximum separation directions among classes (Eriksson et
al., 2006). Even the O2PLS-DA model developed to simultaneously identify
the five origins did not improve the classification accuracy of seed origins.
According to Eriksson et al. (2006), the discriminant analysis does not work
for classes that are not tight, which was the case in this study as observed in the
O2PLS-DA score plot (data not shown). Individual seeds within a given seed
lot often vary in size, which in turn induces path length difference and create
marked differences in spectral signature (Tigabu & Odén, 2004a & b). When
two-class OPLS-DA models were fitted to the raw spectral data for pair-wise
identification of seed origins, the modelled class variation (R2Y) and predictive
ability of the fitted models according to cross validation (Q2
cv) were improved
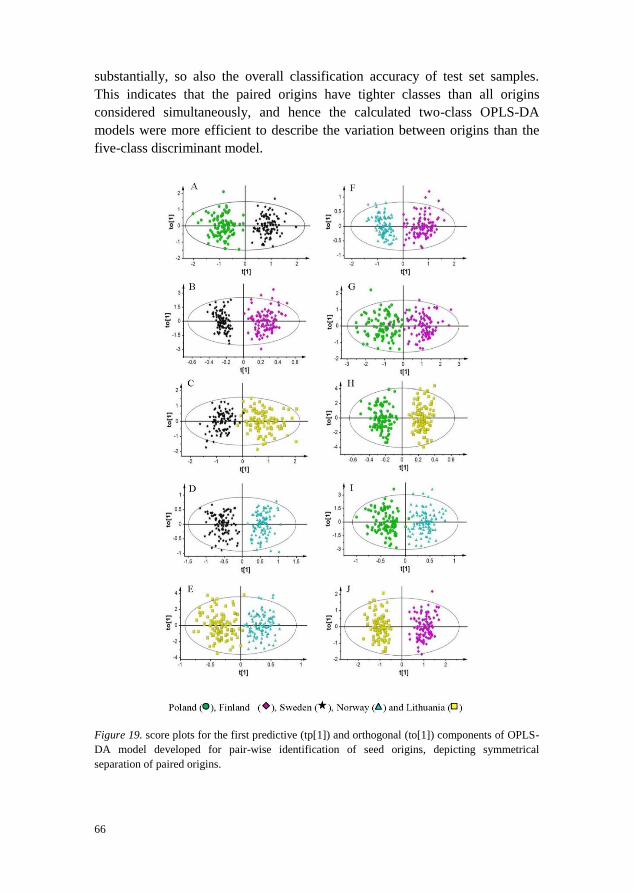
66
substantially, so also the overall classification accuracy of test set samples.
This indicates that the paired origins have tighter classes than all origins
considered simultaneously, and hence the calculated two-class OPLS-DA
models were more efficient to describe the variation between origins than the
five-class discriminant model.
Figure 19. score plots for the first predictive (tp[1]) and orthogonal (to[1]) components of OPLS-
DA model developed for pair-wise identification of seed origins, depicting symmetrical
separation of paired origins.
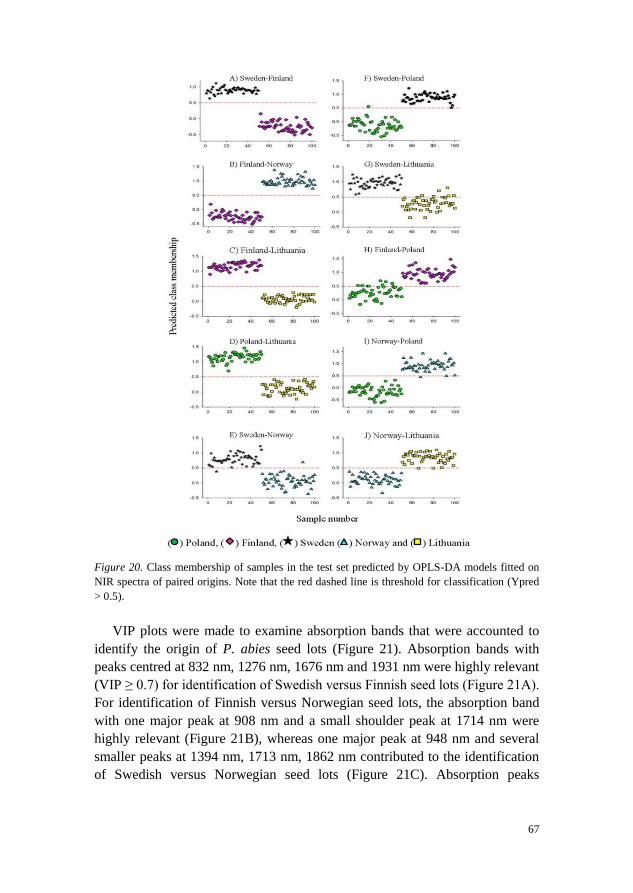
67
Figure 20. Class membership of samples in the test set predicted by OPLS-DA models fitted on
NIR spectra of paired origins. Note that the red dashed line is threshold for classification (Ypred
> 0.5).
VIP plots were made to examine absorption bands that were accounted to
identify the origin of P. abies seed lots (Figure 21). Absorption bands with
peaks centred at 832 nm, 1276 nm, 1676 nm and 1931 nm were highly relevant
(VIP ≥ 0.7) for identification of Swedish versus Finnish seed lots (Figure 21A).
For identification of Finnish versus Norwegian seed lots, the absorption band
with one major peak at 908 nm and a small shoulder peak at 1714 nm were
highly relevant (Figure 21B), whereas one major peak at 948 nm and several
smaller peaks at 1394 nm, 1713 nm, 1862 nm contributed to the identification
of Swedish versus Norwegian seed lots (Figure 21C). Absorption peaks
68
accounted for distinguishing between Swedish and Polish seed lots appeared at
1408 nm and 1927 nm (Figure 21D), between Swedish and Lithuanian at 843
nm, 1279 nm and 1706 nm (Figure 21E), between Finnish and Lithuanian at
839 nm, 1276 nm, 1712 nm (Figure 21F), between Finnish and Polish at 1377
nm, 1709 nm and 1864 nm (Figure 21G), between Norwegian and Lithuanian
at 1931 nm (Figure 21H), between Norwegian and Polish at 1925 nm (Figure
21I), and between Polish and Lithuanian at 1470 nm, 1927 nm and 2427 nm
(Figure 21J).
Absorption peaks together with functional groups responsible for absorption
and the tentative compounds accounted for identifying seed origins are
summarizes in Table 5. Absorption maxima in the shorter NIR region (780 –
1100 nm) that appeared to have a strong influence on the identification of
origins were found at 832 nm, 839 nm, 843 nm and 948 nm. These peaks are
characteristic of the third overtone of C – H stretching vibration and second
overtone N – H and C – H stretching vibrations (Workman & Weyer, 2012).
Molecules responsible for absorption in this region are lipid and protein
moieties like CH3, CH2, ArNH2 (aromatic amino acids) and NH2. A broad
shoulder peak centred at 1276 nm was also observed, which is characteristic of
the second overtone of C – H stretching vibration of various functional group,
such as –CH2 ,CH3, –CH ═ CH– (Shenk et al., 2001; Workman & Weyer,
2012). According to Osborne et al. (1993), long chain fatty acid moiety gives
rise to CH2 second overtone at 1200 nm. The two very weak shoulder peaks
around 1394 nm and 1408 nm correspond to C – H combination and first
overtone of N – H stretching vibration due to absorption by CH2 and protein
moieties (Shenk et al., 2001; Workman & Weyer, 2012). The absorption band
in 1600 – 1800 nm presents two weak peaks in the vicinity of 1676 nm and
1710, which are characteristic of the first overtone of the C – H stretching
vibration of methyl and methylene groups. Previous studies have shown that
the absorption bands at 1710 and 1725 nm correlate with linoleic and oleic
acids (Hourant et al., 2000; Kim et al., 2007; Ribeiro et al., 2013) and
implicated as a basis for identification of origin Scots pine seeds within
Sweden (Tigabu et al., 2005).
The dominant peak at 1931 nm arises from O – H stretch/ HOH
deformation combination and O – H bend second overtone and C = O stretch
second overtone due to absorption by several functional groups, notably H2O,
starch and –CO2R (Osborne et al., 1993; Shenk et al., 2001; Workman &
Weyer, 2012). Pure water has absorption peaks at 1940 nm due to O – H
stretch first overtone and combination bands involving O – H stretch and O –
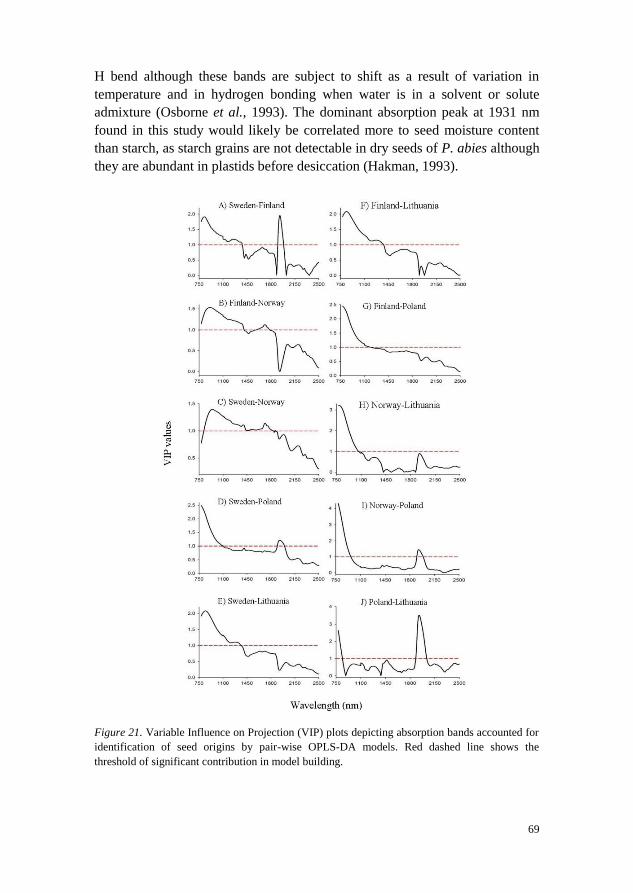
69
H bend although these bands are subject to shift as a result of variation in
temperature and in hydrogen bonding when water is in a solvent or solute
admixture (Osborne et al., 1993). The dominant absorption peak at 1931 nm
found in this study would likely be correlated more to seed moisture content
than starch, as starch grains are not detectable in dry seeds of P. abies although
they are abundant in plastids before desiccation (Hakman, 1993).
Figure 21. Variable Influence on Projection (VIP) plots depicting absorption bands accounted for
identification of seed origins by pair-wise OPLS-DA models. Red dashed line shows the
threshold of significant contribution in model building.

70
As a whole, it appears that NIR spectroscopy has detected the subtle
differences in chemical compounds, probably seed storage reserves, like lipids
and proteins, as well as moisture content of seeds from different origins. It
should be noted that lipids are the dominant reserve compounds in seeds of
many conifers including P. abies seeds, which vary between 21.3% and 31.6%
with higher amount towards the northern origin (Tigabu et al., 2004). Previous
studies have also shown that oleic, linoleic and 5,9,12-octadecatrienoic acids
are the most abundant fatty acids in the triacylglycerol of P. abies seeds
(Tillman-Sutela et al., 1995); and Δ5 unsaturated polymethylene interrupted
fatty acids (UPIFAs) constitute 27% of P. abies seeds (Lísa et al., 2007).
Furthermore, the total protein content of P. abies seeds varies between 15.7%
and 18.7%; being significantly higher for Finnish than Swedish origin (Tigabu
et al., 2004).
Table 5. Absorption peaks together with functional groups responsible for absorption and the
tentative compounds accounted for identifying putative origin of P. abies seed lots
Absorption peak
(nm)
Functional groups Tentative compound
832 C – H , N – H lipid and protein
839 C – H , N – H lipid and protein
843 C – H , N – H lipid and protein
948 C – H , N – H lipid and protein
1276 C – H fatty acid
1394 C – H , N – H CH2 and protein
1408 C – H , N – H CH2 and protein
1676 C – H methyl and methylene
1710 C – H methyl and methylene
1931 O – H water

71
5 Conclusion and Recommendations
The studies presented in this thesis provide evidence about the feasibility of
NIR spectroscopy as a robust technique for sorting seed lots according to their
viability and certification of seed lots. Based on the findings, the following
conclusion can be made: 1) NIR spectroscopy discriminates filled-viable and
non-viable seeds of Larix sibirica with 100% accuracy; 2) Vis + NIR
spectroscopy differentiates hybrid and pure parental larch seeds with 100%
accuracy; thus the result demonstrates the feasibility of Vis + NIR
spectroscopy as a powerful non-destructive method for certification of hybrid
larch seeds, 3) Multivariate modelling of Vis + NIR spectra of single seeds
distinguishes B. pubescens from B. pendula with 100% and 99% accuracy,
respectively; as well as families with B. pendula and B. pubescens with 93%
and 98% accuracies, respectively; demonstrating the feasibility of NIR
spectroscopy as taxonomic tool for classification of species that have
morphological resemblance as well as seed verification, and 4) NIR
spectroscopy correctly classified Picea abies seed lots according to their
origins with 92% - 100% accuracy; attesting the potential of the technique for
monitoring putative seed origin and seed certification. It appears that Vis +
NIR spectroscopy has detected differences in seed colour and chemical
compounds, probably reserve compounds like polysaccharides, lipids and
proteins as well as moisture content differences, as a basis for characterizing
the various seed fractions investigated in this thesis.
The power of the NIR spectroscopy heavily depends on the data analysis
techniques. In this thesis, SIMCA, PLS-DA and OPLS-DA modelling
approaches were used for developing classification models. The OPLS-DA
modelling approach appears to be superb in the development of parsimonious
models with few dimensions as well as in providing additional information that
allow within-class variation to be explained.

72
From practical point of view, NIR spectroscopy can be used as a rapid
diagnostic tool to estimate the viability of seed crop and guide decisions during
seed collection. It can also offer a unique opportunity for seed orchard
managers to rapidly estimate the hybrid seed yield from open pollinated mixed
species seed orchards. In addition, breeders can benefit from use of the NIR
technique to assess the efficiency of artificial pollination in seed orchard
management research. Apart from its taxonomic importance, NIR spectroscopy
can be used as a research tool to rapidly identify distinct elite families from
natural stands for future breeding works. The possibility of tracing the origin of
seed lots by NIR spectroscopy reduces growth anomalies in future tree crops;
thereby boosting the confidence of forest owners. In addition, with known
genotypes and by producing homogenous products, genetic diversity of seed
orchards is easily manageable and can also be maintained (McKeand et al.,
2003). The regulatory authorities can also adopt this method to monitor seed
transactions. Thus, further research is recommended to expand the calibration
database by testing several seed lots, species and hybrids. Further study is also
recommended to standardize the technique for routine seed testing purpose, as
it has the potential to replace some of the existing methods, such as X- ray
analysis, cutting and biochemical tests of viability.
From commercial point of view, non-destructive whole seed NIR analysis is
more attractive from perspectives of cost per seed and non-invasiveness;
thereby enhancing efficiency in bulk seed handling. Today, on-line sorting
system based on NIR spectroscopy for tree seed lots does not exist. For cereals,
Near Infrared Transmittance (NIT)-based technique is available for sorting
wheat, durum wheat and barley according to protein contents, hardness,
virtuousness, pearling yield, vigour/viability, and fusarium-infected kernel with
substantially high throughput, 1000 kernels per minute (IQ SEED SORTER,
www.bomill.com). Thus, concerted efforts should be made to scale-up the
technique to on-line sorting system for large-scale tree seed handling
operations.
73
References
Acheré, V., Faivre Rampant, P., Pâques, L.E. & Prat, D. (2004). Chloroplast and mitochondrial
molecular tests identify European × Japanese larch hybrids. Theoretical and Applied Genetics
108, 1643-1649.
Agelet, E.L. (2011). Single seed discriminative applications using near infrared technologies,
PhD Dissertation, Iowa State University, Department of Agricultural and Biosystems
Engineering, Iowa.
Agelet, L.E. & Hurburgh, C.R. (2014). Limitations and current applications of Near Infrared
Spectroscopy for single seed analysis. Talanta 121, 288-299.
Alander, J.T., Bochko, V., Martinkauppi, B., Saranwong, S. & Mantere, T. (2013). A review of
Optical Nondestructive Visual and Near-Infrared methods for food quality and safety.
International Journal of Spectroscopy, Article ID 341402.
Almqvist, C., Wennström, U. & Karlsson, B. (2010). Improved forest regeneration material 2010-
2050. Supply and needs, and measures to minimize shortage and maximize genetic gain.
Redogörelse nr 3, Skogforsk. [In Swedish].
Anonymous, (2011). Statistical Yearbook of Forestry. Official Statistics of Sweden. National
Board of Forestry: Jönköping.
Ashburner, K. & McAllister, H.A. (2013). The genus Betula: a taxonomic revision of birches,
Royal Botanic Gardens: Kew.
Atkinson, M.D. & Codling, A.N. (1986). A reliable method for distinguishing between Betula
pendula and B. pubescens. Watsonia 16, 75-76.
Atkinson, M.D., Jervis, A.P. & Sangha, R.S. (1997). Discrimination between Betula pendula,
Betula pubescens and their hybrids using near-infrared spectroscopy. Canadian journal of
forest research 27, 1896-1900.
Balas, C. (2009). Review of biomedical optical imaging - a powerful, non-invasive, nonionizing
technology for improving in-vivo diagnosis. Measurement Science Technology 20, 1-12.
74
Baltunis, B.S., Greenwood, M.S. & Eysteinsson, T. (1998). Hybrid vigour in Larix: growth of
intra- and interspecific hybrids of Larix decidua, L. laricina, and L. kaempferi after 5 years.
Silvae Genetica 47, 288-293.
Barnes, B.J., Dhanoa, M.S. & Lister, S.J. (1989). Standard normal variate transformation and de-
trending of near infrared diffuse reflectance spectra. Applied Spectroscopy 43, 772-777.
Barnett, J.P. (1971). Flotation in ethanol reduced storability of Southern pine seeds. Forest
Science 17, 50-54.
Bates, S.L., Lait, C.G., Borden, J.H. & Kermode, A.R. (2001). Effect of feeding by the western
conifer seed bug, Leptoglossus occidentalis, on the major storage reserves of developing seeds
and on seedling vigour of Douglas-fir. Tree Physiology 21, 481-487.
Bauriegel, E. & Herppich, W.B. (2014). Hyperspectral and Chlorophyll Fluorescence Imaging for
Early Detection of Plant Diseases, with Special Reference to Fusarium spec. Infections on
Wheat. Agriculture 4, 32-57.
Bazzaz, F.A., Ackerly, D.D. & Reekie, E.G. (2000). Reproductive allocation in plants. In: Fenner,
M. (Ed.) Seeds: the ecology of regeneration in plant communities. Wallingford: New York, pp
1-29.
Bergsten, U. & Wiklund, K. (1987). Some physical conditions for removal of mechanically
damaged Pinus sylvestris L. seeds by using the PREVAC method. Scandinavian Journal of
Forest Research 2, 315-323.
Besnard, G., Acheré, V., Jeandroz, S., Johnsen, Ø., Rampant, F.P., Baumann, R., Müller-Starck,
G., Skrøppa, T. & Favre, J-M. (2008). Does maternal environmental condition during
reproductive development induce genotypic selection in Picea abies? Annals of Forest
Science 65, paper no. 109.
Bittner, D.R. & Norris, K.H. (1968). Optical properties of selected fruits VS maturity.
Transaction of the American Society of Agricultural Engineers 11, 534-536.
Blanco, M. & Villarroya, I. (2002). NIR spectroscopy: a rapid-response analytical tool. Trends in
Analytical Chemistry 21, 240-250.
Burns, D.A. & Ciurczak, E.W. (2008). Handbook of Near-Infrared Analysis. 3rd
edition, CRC
Press: Boka Raton.
Choquette, S.J., Travis, J.C., Changjiang, Z. & Duewer, D.L. (2006). Wavenumber Standards for
Near-infrared Spectrometry. In: Chalmers, J.M. & Griffiths, P.R. (Eds.) Handbook of
Vibrational Spectroscopy, John Wiley & Sons Ltd: Chichester.
Daneshvar, A., Tigabu, M., Karimidoost, A. & Odén, P.C. (2015). Single seed Near Infrared
Spectroscopy discriminates viable and non-viable seeds of Juniperus polycarpos. Silva
Fennica 49, article id 1334.
Davies, A.M.C. (1990). Letter to the Editor: Subdivisions of the infrared region. Applied
Spectroscopy 44, 14A.
75
Davies, A.M.C. (2005). An introduction to near infrared spectroscopy. NIR News 16, 9-21.
Deleuran, L.C., Olesen, M.H., Shetty, N., Gislum, R. & Boelt, B. (2011). Importance of Seed
Quality for the Fresh-cut Chain, In: Nicola, S. (Ed.) II ISHS International Conference on
Quality Management of Fresh Cut Produce: Convenience Food for a Tasteful Life, Turin.
Demelash, L., Tigabu, M. & Odén, P.C. (2002). Separation of empty and dead-filled seeds from a
seed lot of Pinus patula with IDS technique. Seed Science and Technology 30, 677-681.
Demelash, L., Tigabu, M. & Odén, P.C. (2003). Enhancing germinability of Schinus molle L.
seed lot from Ethiopia with specific gravity and IDS techniques. New Forests 26, 33-41.
Downie, B. & Bergsten, U. (1991). Separating germinable and non-germinable seeds of eastern
white pine (Pinus strobes L.) and white spruce (Picea glauca (Moebch) Voss) by the IDS
technique. Forestry Chronicle 67, 393-396.
Downie, B. & Wang, B.S.P. (1992). Upgrading germinability and vigour of jack pine, logdepole
pine, and white spruce by the IDS technique. Canadian Journal of Forest Research 22, 1124-
1131.
Dryden, G.McL. (2003). Near Infrared reflectance spectroscopy: Applications in deer nutrition.
Publication No W03/007, RIRDC: Queensland .
Ekö, P.M., Larsson-Stern, M. & Albrektson, A. (2004). Growth and Yield of Hybrid Larch (Larix
× eurolepis A. Henry) in Southern Sweden. Scandinavian Journal of Forest Research 19,
320-328.
Eriksson, L., Johansson, E., Kettaneh-Wold, N., Trygg, J., Wikström, C. & Wold, S. (2006).
Multi- and megavariate data analysis. Basic Principles and Applications. Second revised and
enlarged edition, Umetrics Academy: Umeå.
Falleri, E. & Pacella, R. (1997). Applying the IDS method to remove empty seeds in Platanus ×
acerifolia, Canadian Journal of Forest Research 27, 1311-1315.
Farhadi, M., Tigabu, M., Stener, L-G., Odén, P.C. (2015). Feasibility of Vis + NIR spectroscopy
for non-destructive verification of European × Japanese larch hybrid seeds. New Forests,
published online (http://dx.doi.org/10.1007/s11056-015-9514-4).
Feehan, J., O'Donovan, G., Renou-Wilson, F. & Wilson, D. (2008). The Bogs of Ireland - an
introduction to the natural, cultural and industrial heritage of Irish peatlands. 2nd
edition,
Digital Format: Dublin.
Fischer, A., Lindner, M., Abs, C. & Lasch, P. (2002). Vegetation dynamics in central European
forest ecosystems (near-natural as well as managed) after storm events. Folia Geobotanica 37,
17-32.
Fries, J. (1964). Vårtbjörkens produktion I Svealand och södra Norrland. [Our Birch production
in Svealand and southern Norrland in Sweden] Studia Forestalia Suecia 14.
Garini, Y., Young, I.T. & McNamara, G. (2006). Spectral imaging: Principles and applications.
Cytometry 69A, 735-747.

76
Geladi, P., MacDougall, D. & Martens, H. (1985). Linearization and scatter-correction for near-
infrared reflectance spectra of meat. Applied Spectroscopy 39, 491-500.
Hakman, I. (1993). Embryology in Norway spruce (Picea abies). An analysis of the composition
of seed storage proteins and deposition of storage reserves during seed development and
somatic embryogenesis. Physiologia Plantarum 87, 148-159.
Halmer, P. (2000). Commercial seed treatment technology. In: Black, M. & Bewley, J.D. (Eds.)
Seed technology and its biological basis, CRC Press: London, pp. 257-286.
Hampton, J.G. (2002). What is seed quality? Seed Science and Technology 30, 1-10.
Hampton, J.G. & TeKrony, D.M. (1995). Handbook of Vigour Test Methods. International Seed
Testing Association: Zurich.
Harmond, J.E., Brandenburgh, N.R. & Klein, L.M. (1968). Mechanical seed cleaning and
handling, Agriculture Handbook No. 354, ARC: Washington DC.
Hodgson, T.J. (1977). Effects of organic flotation media on the germination of Pinus elliottii, P.
patula and P. taeda seed. South Africa Forestry Journal 102, 17-21.
Hourant, P., Baeten, V., Morales, M.T., Meurens, M. & Aparicio, R. (2000). Oil and fat
classification by selected bands of Near-Infrared Spectroscopy. Applied spectroscopy 54,
1168-1174.
Hynynen, J., Niemistö, P., Viherä-Aarnio, A., Brunner, A., Hein, S. & Velling, P. (2010).
Silviculture of birch (Betula pendula Roth and Betula pubescens Ehrh.) in northern Europe.
Forestry 83, 103-119.
International Seed Testing Association. (2003). International Rules for Seed Testing. International
Seed Testing Association. Bassersdorf: Switzerland.
International Seed Testing Association. (2010). International Seed Testing Association,
International Rules for Seed Testing. Ch-8303, Bassersdorf: Switzerland.
Isidorov, V., Szczepaniak, L., Wróblewska, A., Piroznikow, E. & Vetchinnikova, L. (2014). Gas
chromatographic-mass spectrometric examination of chemical composition of two Eurasian
birch (Betula L.) bud exudates and its taxonomical implication. Biochemical Systematics and
Ecology 52, 41-48.
Jalink, H., van der Schoor, R., Frandas, A., van Pijlen, J.G. & Bino, R.J. (1998). Chlorophyll
fluorescence of Brassica oleracea seeds as a non-destructive marker for seed maturity and
seed performance. Seed Science Research 8, 437-443.
Johnsen, Ø. & Ostreng, G. (1994). Effects of plus tree selection and seed orchard environment on
progenies of Picea abies. Canadian Journal of Forest Research 24, 32-38.
Johnsen, Ø., Skrøppa, T., Haug, G., Apeland, I. & Ostreng, G. (1995). Sexual reproduction in a
greenhouse and reduced autumn frost-hardiness of Picea abies progenies. Tree Physiology 15,
551-555.
77
Johnsen, Ø., Skrøppa, T., Junttila, O. & Dæhlen, O.G. (1996). Influence of the female flowering
environment on autumn frost-hardiness of Picea abies progenies. Theoretical and Applied
Genetics 92, 797-802.
Jørgensen, A. (2000). Clustering excipient near infrared spectra using different chemometric
methods, Technical report, Department of Pharmacy: Helsinki.
Kaliniewicz, Z., Markowski, P., Anders, A., Rawa, T., Liszewski, A. & Fura, S. (2012).
Correlations between the germination capacity and selected attributes of European larch seeds
(Larix Decidua Mill.). Technical Sciences 15, 229-242.
Keinänen, M., Julkunen-Tiitto, R., Rousi, M. & Tahvanainen, J. (1999). Taxonomic implications
of phenolic variation in leaves of birch (Betula L.) species. Biochemical Systematics and
Ecology 27, 243-354.
Karlman, L., Fries, A., Martinsson, O. & Westin, J. (2011). Juvenile growth of provenances and
open pollinated families of four Russian larch species (Larix Mill.) in Swedish field tests.
Silvae Genetica 60, 165-177.
Karrfalt, R.P. (2011). Producing the target seed: seed collection, treatment, and storage. In: Riley,
L.E., Haase, D.L. & Pinto, J.R., (Technical coordinators) National Proceedings: Forest and
Conservation Nursery Associations. Proceedings RMRS-P-65. USDA, Rocky Mountain
Research Station, pp 67-73.
Kenanoglu, B.B., Demir, I. & Jalink, H. (2013). Chlorophyll fluorescence sorting
method to improve quality of capsicum pepper seed lots produced from different maturity
fruits. HortScience 48, 965-968.
Kim, K.S., Park, S.H., Choung, M.G. & Jang, Y.S. (2007). Use of Near-Infrared Spectroscopy
for Estimating Fatty Acid Composition in Intact Seeds of Rapeseed. Journal of Crop Science
Biotechnology 10, 15-20.
Kohmann, K. & Johnsen, Ø. (1994). The timing of bud-set in seedlings of Picea abies from seed
crops of a cool versus a warm summer. Silvae Genetica 43, 328-332.
Konstantinova, P., Van der Schoor, R., Van den Bulk, R. & Jalink, H. (2002). Chlorophyll
fluorescence sorting as a method for improvement of barley (Hordeum vulgare L.) seed health
and germination. Seed Science and Technology 30, 411-421.
Koski, V., Skrøppa, T., Paule, L., Wolf, H. & Turok, J. (1997). Technical guidelines for genetic
conservation of Norway spruce (Picea abies (L.) Karst.). International Plant Genetic
Resources Institute: Rome.
Kwong, F.Y., Sellman, R. L., Jalink, H. & van der Schoor, R. (2005). Flower seed cleaning and
grading. In: McDonald, M.B. & Kwong, F.Y. (Eds.) Flower seeds: Biology and technology..
CAB International: Wallingford, pp. 225-247.
Laitinen, M.-L., Julkunen-Tiitto, R., Tahvanainen, J., Heinonen, J. & Rousi, M. (2005). Variation
in birch (Betula pendula) shoot secondary chemistry due to genotype, environment and
ontogeny. Journal of Chemical Ecology 31, 697-717.

78
Lestander, T. & Bergsten, U. (1985). PREVAC-en metod för att avlägsna mekaniskt skadat frö.
[PREVAC- a method for the removal of mechanically damaged seeds]. Sverige
Skogsvårdsförbunds Tidskrift 1, 35-42.
Lestander, T.A. & Odén, P.C. (2002). Separation of viable and non-viable filled Scots pine seeds
by differentiating between drying rates using single seed near infrared transmittance
spectroscopy. Seed Science and Technology 30, 383-392.
Lísa, M., Holcapek, M., Rezanka, T. & Kabátová, N. (2007). High-performance liquid
chromatography-atmospheric pressure chemical ionization mass spectrometry and gas
chromatography-flame ionization detection characterization of Δ5-polyenoic fatty acids in
triacylglycerols from conifer seed oils. Journal of Chromatography A 1146, 67-77.
Lundgren, L.N., Pan, H., Theander, O., Eriksson, H., Johansson, U. & Svenningsson, M. (1995).
Development of a new chemical method for distinguishing between Betula pendula and
Betula pubescens in Sweden, Canadian Journal of Forest Research 25, 1097-1102.
Lycksell, S. (1993). Seed conditioning of Larix sukaczewii (Ledeb.) using PREVAC, IDS and
floatation technique. MSc thesis, Swedish University of Agricultural Sciences, Department of
Silviculture, Umeå.
Mamo, N., Mihretu, M., Fekadu, M., Tigabu, M. & Teketay, D. (2006). Variation in seed and
germination characteristics among Juniperus procera populations in Ethiopia. Forest Ecology
and Management 225, 320-327.
Matyssek, R. & Schulze, E.D. (1987). Heterosis in hybrid larch (Larix decidua × leptolepis). II.
Growth characteristics. Trees 1, 225-231.
McClure, W.F. (1994). Near-Infrared Spectroscopy: the giant is running strong. Analytical
Chemistry 66, 43A-53A.
McKeand, S., Mullin, T., Byram, T. & White, T. (2003). Deployment of genetically improved
loblolly and slash pines in the south. Journal of Forestry 101, 32-37.
Næs, T., Isaksson, T., Fearn, T. & Davies, T. (2002). A User-Friendly Guide to Multivariate
Calibration and Classification. NIR Publications: Chichester.
Norris, K.H. (1962). Instrumentation of infrared radiation. Transaction of the American Society
of Agricultural Engineers 5, 17-20.
Norris, K.H. (1964). Reports on the design and development of a new moisture meter.
Agricultural Engineering 45, 370-372.
Norris, K.H. & Hart, J.R. (1965). Direct spectrophotometric determination of moisture content of
grain and seeds. In: Waxler, A. (Ed.) Principles and Methods of Measuring Moisture Content
in Liquids and Solids. Reinhold Publishing Corporation: New York, pp. 19-25.
Norris, K.H. & Rowan, J.D. (1962). Automatic detection of blood in eggs. Agricultural
Engineering 43, 154-159.

79
Ooms, D. & Destain, M.F. (2011). Evaluation of chicory seeds maturity by chlorophyll
fluorescence imaging. Biosystems Engineering 110, 168-177.
Osborne, B.G., Fearn, T. & Hindle, P.H. (1993). Practical NIR Spectroscopy with Applications in
Food and Beverage Analysis. 2nd
edition, Longman Scientific and Technical: Harlow.
Owens, J.N. (1995). Constraints to seed production: temperate and tropical forest trees. Tree
Physiology 15, 477-484.
Ozaki, Y. (2012). Near-infrared spectroscopy - its versatility in analytical chemistry. Analytical
sciences 28, 545-563.
Pâques, L.E. (1989). A critical review of larch hybridization and its incidence on breeding
strategies. annales des sciences foresti��res 46, 141-153.
Pâques, L.E. (1992). Performance of vegetatively propagated Larix decidua, L. kaempferi and L.
laricina hybrids. annales des sciences foresti��res 49, 63-74.
Pâques, L.E. (2000). Interspecific hybridisation in larch: the long way to get outstanding varieties,
In: Dungey, H.S., Dieters, M.J. & Nikles D.G. (Compilers) Hybrid Breeding and Genetics of
Forest Trees. Proceeding of QFRI/CRC-SPF Symposium, Queensland, pp. 373-385.
Pâques, L.E. (2009). Purity control of seed lots or seedling batches of hybrid larch (Larix decidua
× L. kaempferi). Available at: http://treebreedex.eu/IMG/doc/qualitycontrollarch.doc.
Accessed 10 July 2015.
Pasquini, C. (2003). Near Infrared Spectroscopy: fundamentals, practical aspects and analytical
applications. Journal of the Brazilian Chemical Society14, 198-219.
Philipson, J.J. (1996). Effects of girdling and gibberellin A4/7 on flowering of European and
Japanese larch grafts in an outdoor clone bank. Canadian Journal of Forest Research 26, 355-
359.
Pinto, R.C., Trygg, J. & Gottfries, J. (2012). Advantages of orthogonal inspection in
chemometrics. Journal of Chemometrics 26, 231-235.
Polubojarinov, O.I., Chubinsky, A.N. & Martinsson, O. (2000). Decay resistance of Siberian larch
wood. Ambio 29, 352-353.
Poulsen, K.M. (1995). Application of the IDS-method to Pinus caribaea seed. Seed Science and
Technology 23, 269-275.
Pritam, S. & Singh, P. (1997). Forest tree seed pathogens and their management in sustainable
forestry. Journal of Mycology and Plant Pathology 27, 138-147.
Raal, A., Boikov, T. & Püssa, T. (2015). Content and Dynamics of Polyphenols in Betula spp.
Leaves Naturally Growing in Estonia. Records of Natural Products 9, 41-48.
Renou-Wilson, F., Pöllanen, M., Byrne, K., Wilson, D. & Farrell, E.P. (2010). The potential of
birch afforestation as an after-use option for industrial cutaway peatlands. SUO, 61, 59-76.

80
Ribeiro, L.F., Peralta-Zamora, P.G., Maia, B.H.L.N.S., Ramos, L.P. & Pereira-Netto, A.B.
(2013). Prediction of linolenic and linoleic fatty acids content in flax seeds and flax seeds
flours through the use of infrared reflectance spectroscopy and multivariate calibration. Food
Research International 51, 848-854.
Rinnan, A., van den Berg, F. & Engelsen, S.B. (2009). Review of the most common pre-
processing techniques for near-infrared spectra. Trends in Analytical Chemistry 28, 1201-
1222.
Sato, T., Kawano, S. & Iwamoto, M. (1991). Near-Infrared Spectral Patterns of Fatty Acid
Analysis from Fats and Oils. Journal of American Oil Chemists Society 68, 827-833.
Savitzky, A. & Golay, M.J.E. (1964). Smoothing and differentiation of data by simplified least
squares procedures. Analytical Chemistry 36, 1627-1639.
Shenk, J.S., Workman, J.J. & Westerhaus, M.O. (2001). Application of NIR spectroscopy to
agricultural products. In: Burns, D.A. & Ciurczak, E.W. (Eds.) Handbook of near-infrared
spectroscopy, Marcel Dekker Inc.: New York, pp. 419-474.
Simak, M. (1973). Separation of forest seed through flotation. In: Seed Problems: International
Symposium on Seed Processing. Bergen, paper no.16.
Simak, M. (1981). Bortsortering av matat-dött frö ur ett fröparti. [Removal of filled-dead seeds
from a seed bulk.]. Sverige Skogsvårdsförbunds Tidskrift 5, 31-36.
Simak, M. (1984). A method for the removal of filled-dead seeds from a sample of Pinus
contorta. Seed Science and Technology 12, 767-775.
Singh, R.V. & Vozzo, J.A. (1994). Application of the Incubation, Drying and Separation method
to Pinus roxburghii seeds. General Technical report, SO-101, South forest experiment station:
New Orleans.
Sivakumar, V., Anandalakshmi, R., Warrier, R.R., Singh, B.G., Tigabu, M. & Odén, P.C. (2007).
Petroleum flotation technique upgrades the germinability of Casuarina equisetifolia seed lots.
New Forests 34, 281-291.
Skrøppa, T., Nikkanen, T., Routsalainen, S. & Johnsen, Ø. (1994). Effects of sexual reproduction
at different latitudes on performance of the progeny of Picea abies. Silvae Genetica 43, 297-
303.
Slobodník, B. & Gutternberger, H. (2000). Ovule, megaspores and female gametophyte formation
in Larix decidua Mill. (Pinaceae). Acta Biologica Cracoviensia 42, 93-100.
Soltani, A., Lestander, T.A., Tigabu, M. & Odén, P.C. (2003). Prediction of viability of oriental
beechnuts, Fagus orientalis using near infrared spectroscopy and partial least squares
regression. Journal of Near Infrared Spectroscopy 11, 357-364.
Szymański, S. (2007). Silviculture of Norway Spruce. In: Tjoelker, M.G., Boratyński, A. &
Bugała W. (Eds.) Biology and Ecology of Norway Spruce, Forestry Sciences 78, 295-307.
81
Tamburini, E., Vaccari, G., Tosi, S. & Trilli, A. (2003). Near-infrared spectroscopy: A tool for
monitoring submerged fermentation processes using an immersion optical-fiber probe.
Applied Spectroscopy 57, 132-138.
Tigabu, M. & Odén, P.C. (2002). Multivariate classification of sound and insect-infested seeds of
a tropical multipurpose tree, Cordia africana, with near infrared reflectance spectroscopy.
Journal of Near Infrared Spectroscopy 10, 45-51.
Tigabu, M. & Odén, P.C. (2003a). Classification of viable and empty seeds of Pinus patula
Schiede & Deppe with near-infrared spectroscopy and multivariate analysis. New Forests 25,
163-176.
Tigabu, M. & Odén, P.C. (2003b). Near infrared spectroscopy-based method for separation of
sound and insect-damaged seeds of Albizia schimperiana, a multipurpose legume. Seed
Science and Technology 31, 317-328.
Tigabu, M. & Odén, P.C. (2004a). Rapid and non-destructive analysis of vigour of Pinus patula
seeds using single seed near infrared transmittance spectra and multivariate analysis. Seed
Science and Technology 32, 593-606
Tigabu, M. & Odén, P.C. (2004b). Simultaneous detection of filled, empty and insect-infested
seeds of three Larix species with single seed near infrared transmittance spectroscopy. New
Forests 27, 39-53.
Tigabu, M., Odén, P.C. & Lindgren, D. (2005). Identification of seed sources and parents of
Pinus sylvestris L. using visible-near infrared reflectance spectra and multivariate analysis.
Trees 19, 468-476.
Tigabu M., Odén, P.C. & Shen, T.Y. (2004). Application of near infrared spectroscopy for the
detection of internal insect infestation in Picea abies seed lots. Canadian Journal of Forest
Research 34, 76-84.
Tigabu, M., Fjellström, J., Odén, P.C. & Teketay, D. (2007). Germination of Juniperus procera
seeds in response to stratification and smoke treatments, and detection of insect-damaged
seeds with VIS + NIR spectroscopy. New Forests 33, 155-169.
Tillman-Sutela, E. & Kauppi, A. (1995). The significance of structure for the imbibition in seeds
of the Norway spruce, Picea abies (L.) Karst. Trees 9, 269-278.
Tillman-Sutela, E., Johansson, A., Laakso, P., Mattila, T. & Kallio, H. (1995). Triacylglycerols in
the seeds of northern Scots pine, Pinus sylvestris L., and Norway spruce, Picea abies (L.)
Karst. Trees 10, 40-45.
Tillman-Sutela, E., Kauppi, A. & Sahlén, K. (1998). Effect of disturbed photoperiod on the
surface structures of ripening Scots pine (Pinus sylvestris L.) seeds. Trees 12, 499-506.
Trygg, J. & Wold, S. (2002). Orthogonal projections to latent structures (O-PLS). Journal of
Chemometrics 16, 119-128.
82
Trygg, J. & Wold, S. (2003). O2-PLS, a two-block (X-Y) latent variable regression (LVR)
method with an integral OSC filter. Journal of Chemometrics 17, 53-64.
Van der Berg, H.H. & Hendricks, R. (1980). Cleaning flower seeds. Seed Science and Technology
8, 505-22.
Varmuza, K. & Filzmoser, P. (2009). Introduction to multivariate statistical analysis in
chemometrics. CRC Press: Boca Raton.
Wang, D., Dowell, F.E., & Lacey, R.E. (1999). Single wheat kernel colour classification using
near-infrared reflectance spectra. Cereal Chemistry 76, 30-33.
Williams, P.C. & Norris, K.H. (2001). Near-Infrared Technology in the Agricultural and Food
Industries. 2nd
edition, American Association of Cereal Chemists: Minnesota.
Winsa, H. & Bergsten, U. (1994). Direct seeding of Pinus sylvestris using microsite preparation
and invigorated seed lots of different quality: 2-year results. Canadian Journal of Forest
Research 24, 77-86.
Winsa, H. & Sahlén, K. (2001). Effects of seed invigoration and microsite preparation on seedling
emergence and establishment after direct sowing of Pinus sylvestris L. at different dates.
Scandinavian Journal of Forest Research 16, 422-428.
Wold, S. (1976). Pattern recognition by means of disjoint principal components models. Pattern
Recognition 8, 127-139.
Wold, S., Antii, H., Lindgren, F. & Öhman, J. (1998). Orthogonal signal correction of near-
infrared spectra. Chemometrics and Intelligent Laboratory Systems 44, 175-185.
Wolff, R.L., Comps, B. & Marpeau, A.M. (1997). Taxonomy of Pinus species based on the seed
oil fatty acid composition. Trees 12, 113-118.
Wolff, R.L., Lavialle, O., Pédrono, F., Pasquier, E., Deluc, L.G., Marpeau, A.M. & Aitzetmüller,
K. (2001). Fatty Acid Composition of Pinaceae as taxonomic Markers. Lipids 36, 439-451.
Workman, J. & Weyer, L. (2012). Practical Guide and Spectral Atlas for Interpretive Near-
Infrared Spectroscopy. 2nd
edition, CRC Press: Boca Raton.
Zhang, C., Wang, H. & Qiu, Y. (2011). Analysis of the Spectral Resolution of a TeO2 based
Noncollinear Acousto-Optic Tunable Filter. Engineering 3, 233-235.

83
Acknowledgments
A wise man once said:
Tough times never last, but tough people do!
After long and hard days, I am still standing through the life with God’s
help and the prayers of good people who believe in me. All praise and thanks
are to You who created these highly complicated and coordinated systems
around us that amazed laymen and scientists alike, are a constant testimony of
your being unique and peerless. You bestowed me with strength and courage to
lead my plans towards success. You always grant me more that I deserve. Far
be it from You all the descriptions that belittle You and blind are the eyes that
cannot see You. You are the only one, the omnipresent, You the greatest: You
Allah.
I would like to sincerely thank my main supervisor Prof. Per Christer Odén
who has, from many points of view, supported me all the way from the
beginning of my study to its end with passion and patience, and kept me
conscious and focused during the tough times I experienced during my PhD.
The skills I have gained in scientific thinking and writing and professional
manners are priceless. I extend my immense thanks to my co-supervisor Assoc.
professor Mulualem Tigabu for introducing me to the exciting world of NIR
spectroscopy and multivariate analysis as well as his kind support,
encouragement and constructive criticism, which guided me to practical
research. Working with you is really fruitful. I would like also to thank Dr.
Lars-Göran Stener, at Skogforsk in Eköbo, for fruitful collaboration. I am
equally indebted to Erik Walfredsson and Monica Lundström at Skogforsk in
Sävar for their assistance with X-ray analysis of seeds.
My appreciation thoroughly goes to Profs. Matts Lindbladh, Eric Agestam,
Magnus Löf and Jonas Rönnberg for their great help in lightening up those

84
moments when I could not see the end of my PhD, to Violeta and Desiree for
giving me general advice about life in Sweden, to Kent for providing technical
assistance, to Margareta and Zhanna for economic issues. I feel deeply grateful
to have had a network of friends and colleagues working in the Southern
Swedish Forest Research Centre who helped me in so many ways and taught
me so many things. I thank them all for the passionate and constructive
arguments about scientific matters.
I also wish to thank my other good friends, Dr. Abolfazl Daneshvar, Dr.
Masoud Ahmadi Afzadi for beneficial scientific discussion and having
enjoyable time besides studying. I have learnt a lot from you. I also thank the
Karl Erik Önnesjös Foundation for providing funding for this research.
My respectful aunt Zahra, I am obliged to thank you for your effective
support. Even if I wasn’t in Iran, you were there for me during the most
distressing times and made accurately all the things done. Definitely, I owe
you. My especial gratitude goes to my dear sister, Elham and brother-in-law
Mahmood, for their considerable favour to accommodate me and my family.
They made everything easy at the beginning of my stay in Sweden.
I also want to dedicate the fruit of my effort to my father who may God
have him resting in peace and was an incredible support to be raised up. Oh!
My dear father, I wish you were alive to see this success because this was your
desire. I heartily want to thank my mother for her prayer and support all the
times who undoubtedly gives me strength, for her unconditional faith on me
and words of encouragement. My mother, forgive me if I left you alone. I hope
I can make you proud.
As ever, I am deeply and heartily indebted to my dear wife, Tahmineh and
my sweat daughter, Paniz for believing in me and accompanying me in my
decision to pursue my PhD in Sweden although they tolerated tough times.
Tahmineh, this milestone would not have been possible without your endless
love, support and patience.