applied investment management (aim) program aim class of ... · 1/26/2018 · dividend discount...
TRANSCRIPT

Marquette University AIM Class 2018 and 2019 Equity Reports Spring 2018 Page 1
Applied Investment Management (AIM) Program
AIM Class of 2018 and Class of 2019 Equity Fund Reports Spring 2018
Date: Friday, January 26th | Time: See Schedule Below | Location: AIM Research Room 488
9:00 AM Presenter Company Name Ticker Sector Page
Gregory Anderson Regency Centers Corporation REG Real Estate 2
Louisa Steinhafel Nomad Foods Ltd. NOMD Intl Consumer Staples 5
Philip Suess Hannon Armstrong Sustainable
Infrastructure Capital, Inc. HASI Financial Services 8
3:00 PM Presenter Company Name Ticker Sector Page
Jacob Schwister Adamas Pharmaceuticals ADMS Healthcare 11
Grant Runnoe Michael Kors Holdings Ltd KORS Intl Consumer Discretionary
14
Joe Flynn Oaktree Specialty Lending Corp OCSL Financial Services 17
Kyran Young Masimo Corporation MASI Healthcare 20
1/19 Presenter Company Name Ticker Sector Page
Joe Flynn Gannett, Co., Inc. GCI Consumer Discretionary 23
These student presentations are an important element of the applied learning experience in the AIM program. The students conduct fundamental equity research and present their recommendations in written and oral format – with the goal of adding their stock to the AIM Equity Fund. Your comments and advice add considerably to their educational experience and is greatly appreciated. Each student will spend about 5-7 minutes presenting their formal recommendation, which is then followed by about 8-10 minutes of Q & A. David S. Krause, PhD Director, Applied Investment Management Program Marquette University College of Business Administration, Department of Finance 436 Straz Hall, PO Box 1881 Milwaukee, WI 53201-1881 mailto: [email protected] Website: MarquetteBuz/AIM AIM Blog: AIM Program Blog Twitter: Marquette AIM Facebook: Marquette AIM
Marquette University AIM Class 2018 and 2019 Equity Reports Spring 2018 Page 2
Regency Centers Corporation (REG) January 26, 2018
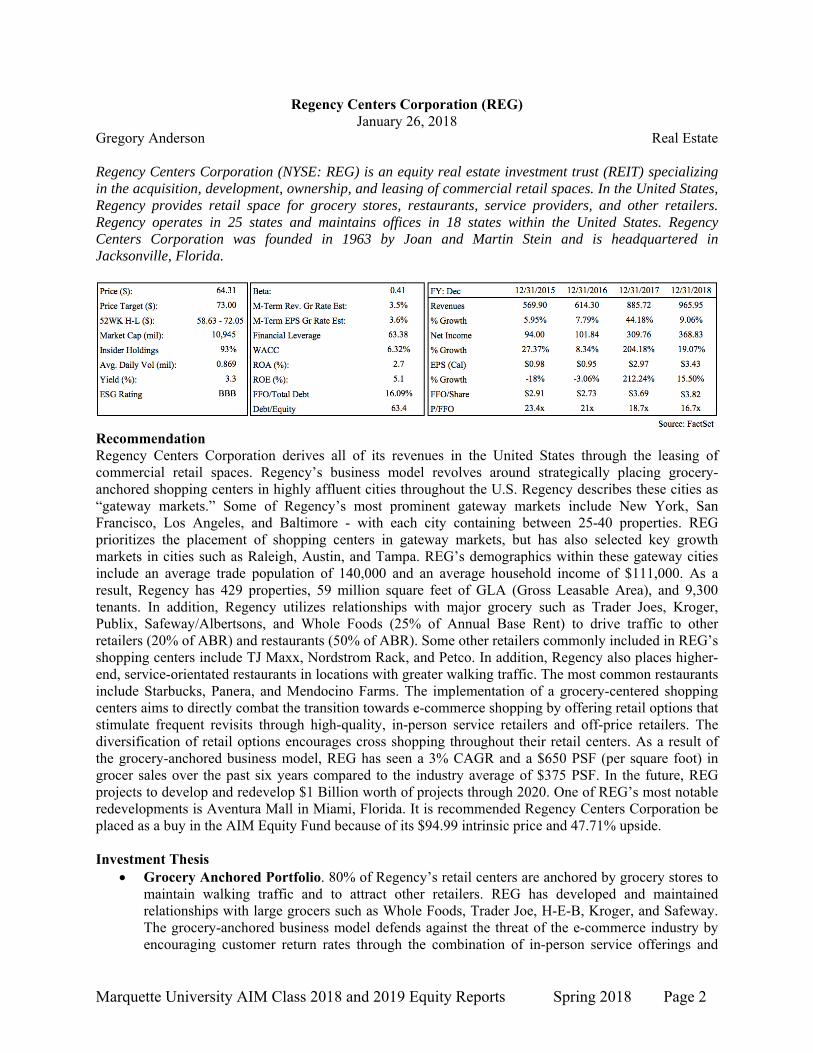
Gregory Anderson Real Estate Regency Centers Corporation (NYSE: REG) is an equity real estate investment trust (REIT) specializing in the acquisition, development, ownership, and leasing of commercial retail spaces. In the United States, Regency provides retail space for grocery stores, restaurants, service providers, and other retailers. Regency operates in 25 states and maintains offices in 18 states within the United States. Regency Centers Corporation was founded in 1963 by Joan and Martin Stein and is headquartered in Jacksonville, Florida.
Recommendation Regency Centers Corporation derives all of its revenues in the United States through the leasing of commercial retail spaces. Regency’s business model revolves around strategically placing grocery-anchored shopping centers in highly affluent cities throughout the U.S. Regency describes these cities as “gateway markets.” Some of Regency’s most prominent gateway markets include New York, San Francisco, Los Angeles, and Baltimore - with each city containing between 25-40 properties. REG prioritizes the placement of shopping centers in gateway markets, but has also selected key growth markets in cities such as Raleigh, Austin, and Tampa. REG’s demographics within these gateway cities include an average trade population of 140,000 and an average household income of $111,000. As a result, Regency has 429 properties, 59 million square feet of GLA (Gross Leasable Area), and 9,300 tenants. In addition, Regency utilizes relationships with major grocery such as Trader Joes, Kroger, Publix, Safeway/Albertsons, and Whole Foods (25% of Annual Base Rent) to drive traffic to other retailers (20% of ABR) and restaurants (50% of ABR). Some other retailers commonly included in REG’s shopping centers include TJ Maxx, Nordstrom Rack, and Petco. In addition, Regency also places higher-end, service-orientated restaurants in locations with greater walking traffic. The most common restaurants include Starbucks, Panera, and Mendocino Farms. The implementation of a grocery-centered shopping centers aims to directly combat the transition towards e-commerce shopping by offering retail options that stimulate frequent revisits through high-quality, in-person service retailers and off-price retailers. The diversification of retail options encourages cross shopping throughout their retail centers. As a result of the grocery-anchored business model, REG has seen a 3% CAGR and a $650 PSF (per square foot) in grocer sales over the past six years compared to the industry average of $375 PSF. In the future, REG projects to develop and redevelop $1 Billion worth of projects through 2020. One of REG’s most notable redevelopments is Aventura Mall in Miami, Florida. It is recommended Regency Centers Corporation be placed as a buy in the AIM Equity Fund because of its $94.99 intrinsic price and 47.71% upside. Investment Thesis
Grocery Anchored Portfolio. 80% of Regency’s retail centers are anchored by grocery stores to maintain walking traffic and to attract other retailers. REG has developed and maintained relationships with large grocers such as Whole Foods, Trader Joe, H-E-B, Kroger, and Safeway. The grocery-anchored business model defends against the threat of the e-commerce industry by encouraging customer return rates through the combination of in-person service offerings and

Marquette University AIM Class 2018 and 2019 Equity Reports Spring 2018 Page 3
high-quality tenants. In addition, by offering a combination of high-end grocers and service retailers, REG has seen a 3% CAGR in grocer sales year-by-year for the past 6 years.
Market Foothold. REG is the largest grocery-centered REIT in the country after its acquisition of Equity One, Inc., a retail real estate development firm, for approximately $16 billion during the first quarter of 2017. The merger effectively combined both portfolios for a total of 429 properties. Since the acquisition, REG is poised to expand on their size in new growth markets through $1 billion in new development and redevelopments at a 7-8% ROIC by 2020.
Acquisition Process. REG utilizes a process that divides prospective and existing assets into four categories: premier plus, premier, quality core, and non-core assets. Each asset class makes up 21%, 54%, 20%, and 5% of REG’s total assets, respectively, and determines quality of the asset. An asset is placed into a category based upon population density, income growth, and household income. This streamlined process has given REG the ability to evaluate and determine purchase criteria, further allowing them to abide by their company objectives of providing high-end, grocery-anchored shopping centers in affluent markets across the United States.
Valuation In order to reach a final intrinsic value, both a Price to Funds From Operations (P/FFO) model and a Dividend Discount Model (DDM) were performed. The P/FFO model was used because its ability to incorporate property sales, in addition to net income, depreciation, and amortization. Once a historical and peer average value were calculated, a 50/50 weighting was used. A six-year period (2016-2021) was utilized, as the 2017 10K has not yet been released, resorting 2016 as the base year. The P/FFO model resulted with a $107.82 intrinsic value. The DDM model utilized a 3.5-4.3% dividend growth rate between 2017 and 2022 and utilized a 6.32% WACC. An intrinsic value of $82.26 resulted with a 27.91% upside. Once both intrinsic values were calculated, a 50/50 weighting was utilized, resulting in a $94.99 intrinsic value with a 47.7% upside. The firm’s dividend yields 3.3%. Risks
E-commerce Disruption. The presence of retail e-commerse is a constant threat to the success of Regency Centers. While Regency uses a business revolving around grocers, off-price retailers, and restaurants, there is the inevitable possibility that future sales will be lost if current tenants lose market share from e-commerce retail suppliers.
Ability to Execute Strategy. Regency’s ability to execute on future project in the pipeline is paramount to their success. In addition, REG’s future upside is dependent on their ability to identify new gateway markets and growth cities, as well as their timing of their capital deployments on development and redevelopment projects.
Inability to Obtain Capital. REG’s success relies on their ability to obtain capital to fund acquisitions. If selling off properties proves to be troublesome, especially when a downturn in the economy is in effect, then REG would be forced to raise additional capital through the issuance of equity securities. Further issuances of capital are an unfavorable strategy to REG because it would dilute the interest of current shareholder’s equity.
Management Martin Stein is the Chairman and CEO of Regency Center Corporation and has been on the board for 25 years since its inception with Lisa Palmer, the President and CFO. Mrs. Palmer has 22 years of experience on the board. Regency has 13 members on the board, 10 of which have over 10 years of experience on the board. REG also has 11 independent trustees whom most have been with REG for over 15 years. The longest active board member is Christian Leavitt, who has been on the board for 34 years.

Marquette University AIM Class 2018 and 2019 Equity Reports Spring 2018 Page 4

Marquette University AIM Class 2018 and 2019 Equity Reports Spring 2018 Page 5
Nomad Foods Ltd. (NOMD) January 26, 2018
Louisa Steinhafel International Consumer Staples Nomad Foods Ltd. (NYSE: NOMD) is a holding company that manufactures and sells frozen foods, including fish, vegetables, poultry, and ready meals. Based on net sales values, the firm is the leading manufacturer and distributor of frozen foods in Western Europe – the firm operates under one business segment. NOMD’s brands include Birds Eye, Iglo, and Findus which they sell in about 60 different countries. Their top sources of revenue derive from the UK, Italy, Germany, Sweden, and France. NOMD products are sold primarily through large grocery retailers and supermarkets. Their vision is to create a global portfolio of best-in-class food companies and brands. NOMD was founded in April 2014 by Noam Gottesman and Martin Franklin and they are headquartered in Middlesex, U.K. Price ($): 17.15 Beta: 0.77 FY: Dec 12/31/2016 12/31/2017 12/31/2018 12/31/2019
Price Target ($): 20.55 M-Term Rev. Gr Rate Est: 20.51% Revenue (Mil) 2,133.60 2,390.00 2,557.30 2,710.7452WK H-L ($): 17.32 - 10.05 M-Term EPS Gr Rate Est: 15.07% % Growth -7% 12% 7% 6%Market Cap (mil): 3,010 Debt/Equity: 77.41 Oper Inc 149.20 227.00 243.00 241.10Insider Holdings 12.17% Debt/EBITDA (ttm): 4.85 % Growth -159% 52% 7% -1%Avg. Daily Vol (mil): 0.77 WACC 8.25 Op Margin 7% 10% 10% 9%Yield (%): 0.0 ROA (%): 2.32 EPS* $0.22 $1.11 1.11 1.23ESG Rating N/A ROE (%): 7.63 P/E (Cal) 78.0 15.5 15.45 13.94
ROIC (%): 3.93 EV/EBITDA 6.9 6.0 5.77 5.38 Recommendation Nomad Foods Ltd. completed their IPO on April 15, 2014 and has quickly risen to become the leading manufacturer and distributor of frozen food brands in Western Europe. They began by acquiring household names that have respected the brand histories and local heritage. The firm holds a 13.8% market share of the $30 billion Western European savory frozen food market, which is stable at a 5-year CAGR of 1.1%. NOMD also has nine well-invested manufacturing facilities located throughout Europe that are strategically placed in key markets to create a more efficient supply chain and assist with future growth in core categories. Throughout the past year, NOMD has been releasing encouraging results for Q1 – Q3. Q3 of 2017 was the third consecutive quarter this year with organic revenue growth sitting at 5.9%, snapping back from decelerating sales in previous quarters. Germany is the leading market at 19.3%, with France at 11% and Italy at 7.5%. Due to better prices and promotional efforts, gross margins have expanded 120 bps and NOMD expects to see continued growth. Throughout 2017, they have had improving sales trends and positive results from rebranding and market penetration efforts. Including the UK, 10 out of their 13 core countries saw organic revenue growth during Q3 of this year ranging from 2.5% - 19.3%. As the global food market continues to change, NOMD is coming from a position of strength with holding such a significant portion of the frozen food market. From their acquisitions of Findus Group and Iglo Foods Group, they have been able to unify their brands which allowed them to introduce new meal options, increase marketing initiatives, and drive innovation. NOMD has a high level of confidence that they can deliver a potential of $52 - $58 million in synergies by the end of 2018 from the Findus acquisition and they have already recognized about $15 million as of 2016. For those reasons, it is recommended that Nomad Foods Ltd. be added to the AIM International Equity Fund with a price target of $20.12, which represents a 17.30% upside. The firm does not presently pay a dividend. Investment Thesis
Pizza Party. On January 17, 2018, NOMD announced that they were going to be acquiring Green Isle Foods Ltd., trading as Goodfellas Pizza Inc., for $275.2 million. The frozen pizza category should complement their existing business well and contribute to increased sales. NOMD has a strategic initiative focused on finding best-in-class food companies and brands that will help expand their geographic footprint within the frozen food category. According to UBS research,

Marquette University AIM Class 2018 and 2019 Equity Reports Spring 2018 Page 6
frozen foods are more conducive to cost synergies and typically have more reliable returns than other food categories. With their already strong platform throughout Europe, brand recognition, and 13.8% of the frozen food market in Western Europe, NOMD stands to benefit significantly from integrating strategic target acquisitions into their brand portfolio.
Iconic Brands, Strong Heritage. NOMD’s brands are household names within their respective markets and have strong local heritage. The Birds Eye brand can be traced back to the original Clarence Birdseye products from the 1920s. Their strong brand recognition drives consumer trust and demand. NOMD has placed a new emphasis on “Must Win Battles” which focuses on revamping their core icons in order to create distinctive brands, break through penetration barriers, and execute the right display/promotional efficiency. They recently relaunched all key segments with improved packaging which, in combination with their already strong platform, aims to increase brand awareness to new consumers. These “Must Win Battles” have already begun driving organic revenue growth from -6.1% in Q1 of 2016 to 10.2% as of Q3 in 2017.
Increased Demand for Convenience Food. Analysts at Technavio expect the frozen food market in Europe to grow this coming period at a CAGR of 4% which they attribute to the rising demand for convenience foods, increased product shelf life, and innovate packaging. Consumers are trending towards healthier, ready-to-eat foods that reduce cooking time. The appeal of increased shelf life for foods that can be enjoyed all year while still maintaining quality, nutritional value, and natural flavor makes frozen foods incredibly favorable. Adding to the convenience factor is the trend of producers towards easy packaging that requires no preparation, utensils, or transfer of food due to heat-resistant trays and ready to cook containers.
Valuation In order to reach an intrinsic value for NOMD, a five year DCF model was constructed. Using a terminal growth rate of 2.25% and a WACC of 8.25%, an intrinsic value of $19.65 was reached. Additionally, a P/E multiple valuation was calculated. Using a 2018E EPS of $1.11 and utilizing a blended average P/E mutplie of 20.59x, resulted in an intrinsic value of $22.87. Finally, an EV/EBITDA multiple valuation was conducted using a blended average EV/EBITDA multiple of 13.22x, resulting in an intrinsic value of $17.16. By weighing the three models 50/30/20, a price target of $20.12 was reached, resulting in a 17.30% potential upside. NOMD presently does not pay a dividend. Risks
Integration of Acquisitions. Despite their confidence in strategically finding beneficial acquisitions and integrating them, there is always the risk that they will be unable to effectively do so. In such cases, there could be a negative effect on savings and profitability for future years.
Economic Trends. During the last fiscal period, 81% of NOMD’s revenue was sourced from the UK, Germany, France, Italy, Sweden, and Norway. They are particularly influenced by the economic conditions in these countries which could negatively impact demand for premium food products, thus lowering sales and potentially the prices of their products.
Customer Mix. NOMD’s top 10 customers account for 37.7% of sales and should they start to prefer other retailers or private labels with better margins over NOMD, they may be forced to lower prices in order to compete.
Management Stefan Descheemaeker has been CEO and Executive Director of NOMD since its inception. Stefan also serves as a director for Anheuser-Busch InBev SA/NV. Tania Howarth is the CIO at NOMD and has previously held the same position at PricewaterhouseCoopers LLP, Sun Microsystems, Inc., and Walkers Snack Foods Ltd. Jason Ashton recently replaced Paul Kenyon as CFO as of August 31, 2017.

Marquette University AIM Class 2018 and 2019 Equity Reports Spring 2018 Page 7
Source: FactSet
TickerRevenues
(mil)ROE % ROA % Debt/Equity
Est 5 yr NI
growthNOMD 2,169 7.63 2.32 76 -LANC 1,209 21.13 16.81 0.00 3.88CPB 7,961 56.10 11.40 216.00 3.33JJSF 1,084 11.99 9.48 0.18 7.90
Sprouts Famers Markets, Inc. SFM 4,506 16.62 7.94 57.18 -CAG 7,821 13.93 4.57 75.08 2.80
Peer Averages 4,516 23.96 10.04 69.69 4.48Source: Bloomberg
Peer Fundamentals
Conagra Brands, Inc.
Name
Nomad Foods Ltd.Lancaster Colony CorporationCampbell Soup CompanyJ & J Snack Foods Corp.
TickerMarket Cap
(mil)P/S P/E
EV/EBITDA
P/B
NOMD 2,984 1.39 25.62 12.90 1.33LANC 3,553 2.94 31.89 14.82 6.02CPB 14,324 1.83 16.66 9.78 8.53JJSF 2,795 2.60 35.57 14.40 4.10SFM 3,601 0.82 27.90 13.10 5.84CAG 15,133 1.98 22.47 14.27 4.09
6,068 2.03 26.90 13.27 5.72Source: Bloomberg
Nomad Foods Ltd.
Conagra Brands, Inc.
Lancaster Colony CorporationCampbell Soup CompanyJ & J Snack Foods Corp.Sprouts Farmers Markets, Inc.
Peer Analysis
Name

Marquette University AIM Class 2018 and 2019 Equity Reports Spring 2018 Page 8
Hannon Armstrong Sustainable Infrastructure Capital, Inc. (HASI) January 26, 2018
Philip Suess Domestic Financial Services Hannon Armstrong Sustainable Infrastructure Capital, Inc. (HASI) is a real estate investment trust engaging in debt and equity investments for renewable energy projects. They have an annual investment target of $1 billion. Their investments are focused in energy efficiency projects and sources of renewable energy across the United States with large concentrations in California and on the East Coast. They have approximately 170 current investments representing an average deal size of $12 million. The firm’s current $2 billion investment portfolio consists of solar energy (43%), wind energy (28%), sustainable infrastructure (7%), and energy efficiency projects (22%). Within their debt portfolio, 99% of their investments are rated investment grade and all of their revenue is derived within the United States. The company was founded as Hannon Armstrong Capital, LLC in 1980 and went public in April 2013 as Hannon Armstrong Sustainable Infrastructure Capital, Inc. HASI is based in Annapolis Maryland.
Recommendation HASI has been successful growing their investment portfolio and increasing their top line revenue in recent years as evidenced by their 5-year CAGR of 39.22%. From the end of 2013 to Q3 of 2017, HASI has increased their total assets by over 300% from $571 million to $2.31 billion. HASI has been able to achieve this growth by maintaining a 12-month investment pipeline of over $2.5 billion and consistently meeting their annual investment target. The demand for cleaner and renewable energy has increased each of the last three years and is expected to continue to increase. The International Energy Agency expects renewable electricity to increase 43% by 2022 with the United States being among the global leaders. This expected growth may be bolstered by the possibility of a new trillion-dollar infrastructure spending bill. The demand forecast for renewable energy is being driven by decreases in the levelized cost of renewable energy and global support for sustainable infrastructure. Ultimately, global spending on new wind and solar energy is projected to reach 44% of new power capacity spending representing $1.92 trillion over the next ten years. Due to the company’s proven track record in the renewable energy field and the favorable industry outlook, it recommended that HASI be added to the AIM Small Cap Equity Fund with a target price of $27.71 representing a 26.88% upside. Investment Thesis
Decreasing Costs of Renewable Energy. Over the past decade, cost savings generated from investments in renewable energy and sustainable infrastructure have increased considerably due to the decreasing levelized costs of wind and solar energy. Since 2009, the cost of wind energy and solar energy have fallen by 66% and 85% respectively. Additionally, the possible implementation of blockchain enabled platforms which are able to absorb excess power generated from energy grids by transferring energy into battery storage systems has the potential to further decrease the cost of renewable energy through increased power grid efficiency.
Commitments to Clean Energy and Reducing GHG. Demand for renewable energy and sustainable infrastructure projects is expected to increase due to commitments by both government entities and corporations looking to reduce greenhouse gases. Over 100 corporations have joined the RE100 campaign which consists of global companies committed to achieving

Marquette University AIM Class 2018 and 2019 Equity Reports Spring 2018 Page 9
100% renewable power for their operations. State and local governments have demonstrated their commitment through goals aimed at reducing greenhouse gas emissions. Currently, 20 states have established greenhouse gas reduction targets. These commitments from governments and corporations are expected to drive future increases in demand for renewable energy.
Established Business Relationships. HASI’s established business relationships from over 35 years of experience are expected to provide a competitive advantage in capturing increases in demand. HASI has been able to establish positive working relationships with global energy service and renewable energy manufacturer companies including: Honeywell International, Ingersoll Rand, Johnson Controls, Schneider Electric, Siemens, United Technologies, and EDF Renewable Energy. These relationships are expected to increase the number of investment opportunities in HASI’s pipeline and drive revenue growth.
Valuation To arrive at an intrinsic value for HASI, a dividend discount model was constructed as well as a price to earnings multiple and a price to book multiple. Using a weighted average cost of capital of 7.06% and a terminal growth rate of 3%, an intrinsic value of $30.03 was reached via the dividend discount model. Peer averages resulted in PE and PB multiples of 28.24x and 2.01x respectfully yielding relative valuations of $21.78 and $26.69. Weighting the DDM 60% and each relative valuation 20%, a price target of $27.71 was reached representing an upside of 26.88%. HASI pays a current dividend yield of 6.04%. Risks
Volatile Energy Prices. Demand for sustainable energy projects is greatly impacted by the costs of alternative sources of energy. The current cost of natural gas poses a risk to the demand outlook for renewable energy and sustainable infrastructure. While there are many advantages to renewable energy and sustainable infrastructure, the cost effectiveness of these projects significantly impacts demand. Since 2010, the cost of natural gas has trended downward from nearly $5.83 per million Btu to $2.81 per million Btu. This shift in price has increased natural gas’ cost competitiveness with renewable energy.
Rising Interest Rate Environment. This past year, the Federal Reserve has increased rates three times and is expected to increase rates three more times in 2018. As the cost of capital increases, HASI’s margins may decrease and negatively impact earnings. Management attempted to address this risk in 2017 by committing 94% of their debt to fixed rates and increasing their level debt of outstanding. Despite increasing fixed rate debt, a rate rising environment is a considerable risk to REITs as they have a continuous need to raise capital.
Changes in Government Regulation. The current administration has voiced support for sources of nonrenewable energy which has the potential to harm future demand for renewable energy and sustainable infrastructure. Additionally, any policy changes impacting current government incentives for renewable energy have the potential to increase the cost of green energy and decrease demand for new projects. A decrease in government support would be detrimental to HASI’s growth opportunities as 44% of their portfolio is backed by government obligors.
Management Jeffrey W. Eckel serves as the president, CEO, and chairman of the board of Directors. Prior to his current position, Mr. Eckel served as president and CEO of Hannon Armstrong’s predecessor from 2000-2013. He currently sits on several renewable energy focused boards including: Alliance to Save Energy, the Cornell University Program in Infrastructure Policy advisory board, and the John Hopkins Environmental Energy, Sustainability and Health Institute advisory council. With over 30 years of experience financing, owning, and operating infrastructure and energy assets, Mr. Eckel has successful grown the firm to manage over $4.5 billion in assets.

Marquette University AIM Class 2018 and 2019 Equity Reports Spring 2018 Page 10
Marquette University AIM Class 2018 and 2019 Equity Reports Spring 2018 Page 11
Adamas Pharmaceuticals (ADMS) January 26, 2018
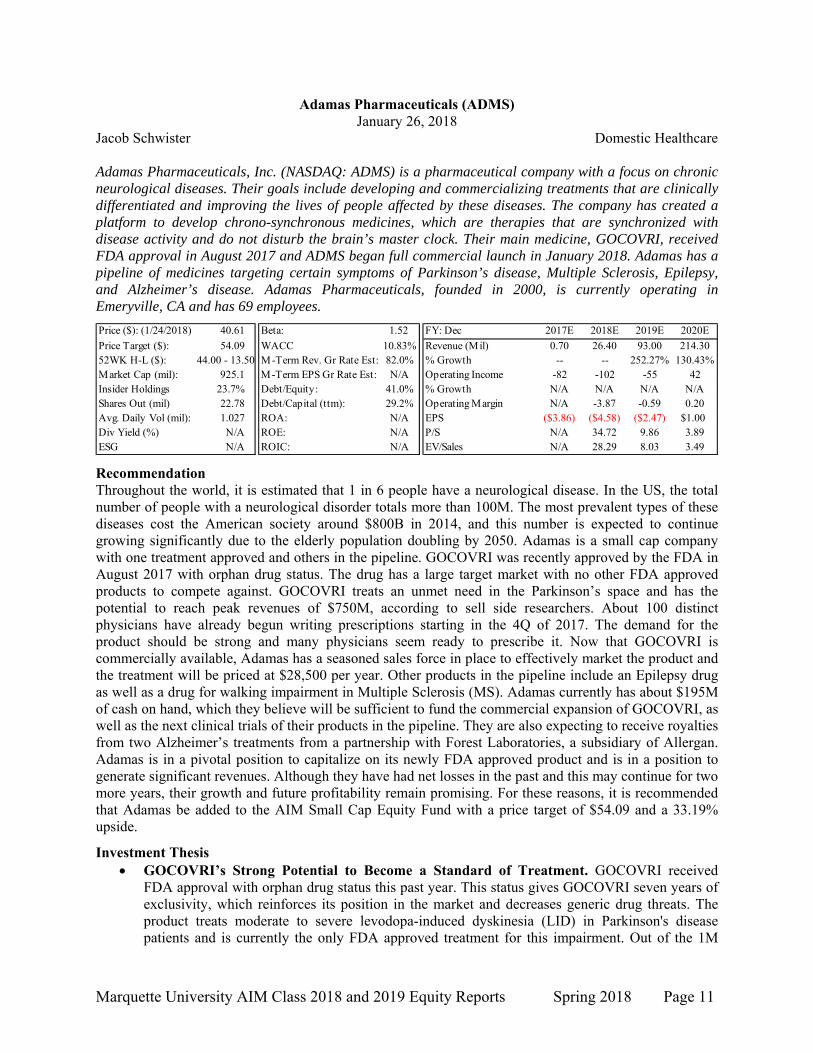
Jacob Schwister Domestic Healthcare Adamas Pharmaceuticals, Inc. (NASDAQ: ADMS) is a pharmaceutical company with a focus on chronic neurological diseases. Their goals include developing and commercializing treatments that are clinically differentiated and improving the lives of people affected by these diseases. The company has created a platform to develop chrono-synchronous medicines, which are therapies that are synchronized with disease activity and do not disturb the brain’s master clock. Their main medicine, GOCOVRI, received FDA approval in August 2017 and ADMS began full commercial launch in January 2018. Adamas has a pipeline of medicines targeting certain symptoms of Parkinson’s disease, Multiple Sclerosis, Epilepsy, and Alzheimer’s disease. Adamas Pharmaceuticals, founded in 2000, is currently operating in Emeryville, CA and has 69 employees.
Price ($): (1/24/2018) 40.61 Beta: 1.52 FY: Dec 2017E 2018E 2019E 2020E
Price Target ($): 54.09 WACC 10.83% Revenue (Mil) 0.70 26.40 93.00 214.3052WK H-L ($): 44.00 - 13.50 M-Term Rev. Gr Rate Est: 82.0% % Growth -- -- 252.27% 130.43%Market Cap (mil): 925.1 M-Term EPS Gr Rate Est: N/A Operating Income -82 -102 -55 42Insider Holdings 23.7% Debt/Equity: 41.0% % Growth N/A N/A N/A N/AShares Out (mil) 22.78 Debt/Capital (ttm): 29.2% Operating Margin N/A -3.87 -0.59 0.20Avg. Daily Vol (mil): 1.027 ROA: N/A EPS ($3.86) ($4.58) ($2.47) $1.00Div Yield (%) N/A ROE: N/A P/S N/A 34.72 9.86 3.89ESG N/A ROIC: N/A EV/Sales N/A 28.29 8.03 3.49
Recommendation Throughout the world, it is estimated that 1 in 6 people have a neurological disease. In the US, the total number of people with a neurological disorder totals more than 100M. The most prevalent types of these diseases cost the American society around $800B in 2014, and this number is expected to continue growing significantly due to the elderly population doubling by 2050. Adamas is a small cap company with one treatment approved and others in the pipeline. GOCOVRI was recently approved by the FDA in August 2017 with orphan drug status. The drug has a large target market with no other FDA approved products to compete against. GOCOVRI treats an unmet need in the Parkinson’s space and has the potential to reach peak revenues of $750M, according to sell side researchers. About 100 distinct physicians have already begun writing prescriptions starting in the 4Q of 2017. The demand for the product should be strong and many physicians seem ready to prescribe it. Now that GOCOVRI is commercially available, Adamas has a seasoned sales force in place to effectively market the product and the treatment will be priced at $28,500 per year. Other products in the pipeline include an Epilepsy drug as well as a drug for walking impairment in Multiple Sclerosis (MS). Adamas currently has about $195M of cash on hand, which they believe will be sufficient to fund the commercial expansion of GOCOVRI, as well as the next clinical trials of their products in the pipeline. They are also expecting to receive royalties from two Alzheimer’s treatments from a partnership with Forest Laboratories, a subsidiary of Allergan. Adamas is in a pivotal position to capitalize on its newly FDA approved product and is in a position to generate significant revenues. Although they have had net losses in the past and this may continue for two more years, their growth and future profitability remain promising. For these reasons, it is recommended that Adamas be added to the AIM Small Cap Equity Fund with a price target of $54.09 and a 33.19% upside.
Investment Thesis GOCOVRI’s Strong Potential to Become a Standard of Treatment. GOCOVRI received
FDA approval with orphan drug status this past year. This status gives GOCOVRI seven years of exclusivity, which reinforces its position in the market and decreases generic drug threats. The product treats moderate to severe levodopa-induced dyskinesia (LID) in Parkinson's disease patients and is currently the only FDA approved treatment for this impairment. Out of the 1M

Marquette University AIM Class 2018 and 2019 Equity Reports Spring 2018 Page 12
people in the US living with Parkinson’s disease, about 150,000 – 200,000 have moderate to severe LID. Sell side estimates have GOCOVRI reaching $750M in peak sales based on the market and pricing. This product is a breakthrough in the Parkinson’s disease treatment market because it meets a critical unmet need. To prepare for the commercial launch, Adamas has hired six medical science liaisons, who have recruited 59 neurology account specialists to cover the 94% of targeted Parkinson’s disease doctors.
ADS-4101: Long-Term Driver. Adamas is in a Phase II clinical trial with ADS-4101, a high-dose lacosamide candidate for treatment of partial-onset seizures in Epilepsy patients. In this space there is presently a product called Vimpat which is distributed by UCB (a biopharmaceutical company based in Belgium). Vimpat is a widely used Anti-Epilepsy Drug (AED) with ~1.4M annual prescriptions written and $1B+ in sales; however, it is known for several tolerability limitations that can result in troublesome adverse events (AE), such as dizziness, headache, double vision, and impaired coordination. ADS-4101 has shown less AEs in the Phase I clinical trial and a potentially better efficacy profile. If this is the case, ADS-4101 could capitalize on the significant number of patients that have AEs with Vimpat. The commercial potential of ADS-4101 has a significant chance to take a substantial stake in a $1B+ market. Vimpat’s patent expires in early 2022, which is the anticipated release of ADS-4101.
Additional Pipeline Products and Royalties. Adamas will begin Phase III clinical trials of ADS-5102 in 1Q 2018, which is a treatment for walking impairment in MS. ADS-5102 has shown effectiveness and approval in the coming years could mean another top-line driver. ADS-5102 adds a differentiation aspect to Adamas’ pipeline. Also, Adamas is expecting royalty payments from Namenda XR starting in 2018 and Namzaric starting in 2020.
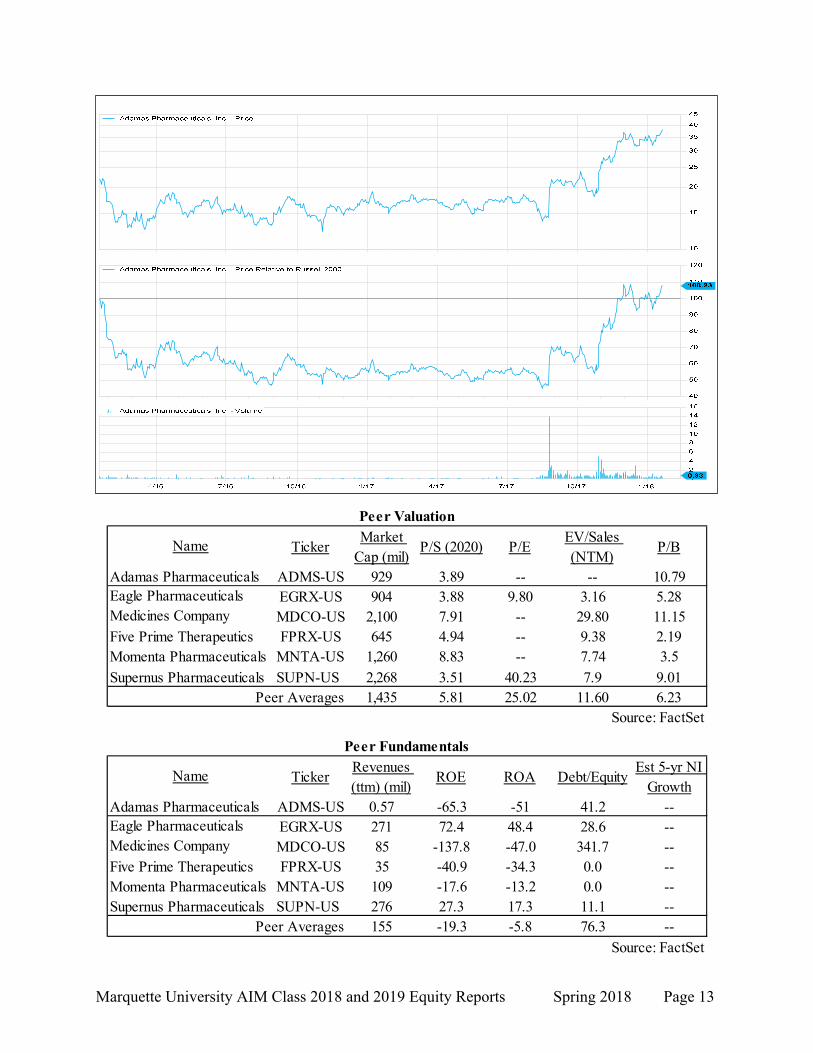
Valuation To reach an intrinsic value for ADMS, a six-year DCF and Price-to-Sales multiple analysis were conducted. Using a terminal growth rate of 2.5%, a WACC of 10.83%, an intrinsic value of $53.49 was reached. A sensitivity analysis on the terminal growth rate and WACC ranged from $47.16 - $61.63. Additionally, a 2020 Price-to-Sales multiple was conducted using a peer average of 5.81x and a sales per share value of $9.41, which resulted in a valuation of $54.69. By weighing the two valuations equally, a price target of $54.09 was reached, resulting in a 33.19% upside.
Risks Commercialization of GOCOVRI. Any failure in the commercial launch of GOCOVRI could
have a significant negative impact on the stock price. If commercial execution risks become elevated and the product’s launch underperforms the Street estimates, their recent price upswing could come to an end.
Clinical Approval of Pipeline Products. Any failure or delay in FDA product approval during clinical trials could have a significant effect on forward revenues and earnings. If ADS-4101 and ADS-5102 do not pass FDA approval, the company could endure significant research and development expenses to resolve the issue or may have to give up on the product entirely. It could also affect the company’s upside potential.
Cash Burn and Royalty Loan. Adamas has been operating with net losses for the past three years and is expecting net losses to continue through 2019. This can impair operations if not managed effectively. If Adamas does not meet revenue expectations for GOCOVRI, they may not be able to make their payment for the royalty-backed loan, which would increase their interest rates.
Management Adamas Pharmaceuticals was founded in 2000 by Dr. Gregory T. Went. Dr. Went is the current Chairman and CEO. Richard A. King serves as the COO and Alfred Merriweather serves as the CFO. Both have extensive backgrounds in the pharmaceutical industry. The CMO is Dr. Rajiv Patni, who previously held upper management positions at Novartis and Pfizer. Dr. Patni has been with the company for 3 years.
Marquette University AIM Class 2018 and 2019 Equity Reports Spring 2018 Page 13
TickerMarket
Cap (mil)P/S (2020) P/E
EV/Sales (NTM)
P/B
ADMS-US 929 3.89 -- -- 10.79EGRX-US 904 3.88 9.80 3.16 5.28MDCO-US 2,100 7.91 -- 29.80 11.15
Five Prime Therapeutics FPRX-US 645 4.94 -- 9.38 2.19Momenta Pharmaceuticals MNTA-US 1,260 8.83 -- 7.74 3.5
Supernus Pharmaceuticals SUPN-US 2,268 3.51 40.23 7.9 9.011,435 5.81 25.02 11.60 6.23
Source: FactSet
Medicines Company
Peer Averages
Name
Adamas PharmaceuticalsEagle Pharmaceuticals
Peer Valuation
TickerRevenues (ttm) (mil)
ROE ROA Debt/EquityEst 5-yr NI
GrowthADMS-US 0.57 -65.3 -51 41.2 --EGRX-US 271 72.4 48.4 28.6 --MDCO-US 85 -137.8 -47.0 341.7 --
Five Prime Therapeutics FPRX-US 35 -40.9 -34.3 0.0 --Momenta Pharmaceuticals MNTA-US 109 -17.6 -13.2 0.0 --Supernus Pharmaceuticals SUPN-US 276 27.3 17.3 11.1 --
155 -19.3 -5.8 76.3 --
Source: FactSet
Medicines Company
Peer Averages
Peer Fundamentals
Name
Adamas PharmaceuticalsEagle Pharmaceuticals

Marquette University AIM Class 2018 and 2019 Equity Reports Spring 2018 Page 14
Michael Kors Holdings Ltd (KORS) January 26, 2018
Grant Runnoe International Consumer Discretionary Michael Kors Holdings Ltd. (KORS) is a global luxury company (#1 ranked runway designer) with 35 years of experience. KORS engages in the design and distribution of handbags (70% of Rev), Women’s Apparel (10%), Footwear (11%), Men’s (3%), Watches (5%), other (1%). KORS currently has 827 stores and has recently acquired fashion shoe company, Jimmy Choo, “JC” (9% of Rev with 150 stores). The company operates its business through three segments: Retail (57% of Rev), wholesale (40%) and Licensing (3%). The Retail segment focuses on collection and lifestyle stores that are located in concessions and outlets. The Wholesale segment engages distribution to specialty retail, department stores, and travel shopping locations. The Licensing segment licenses its trademarks to products such as fragrances, cosmetics, eyewear, leather goods, jewelry, watches, coats, men's suits, swimwear and ties. Revenues are allocated to the Americas (66% of Rev), Europe (23%) and Asia (11%). KORS was founded in 2002 and is headquartered in London, United Kingdom.
Price ($): (1/24/2017) 67.27 WACC 9.1% FY: Mar 2017A 2018E 2019E 2020EPrice Target ($): 86.71 M-Term Rev. Gr Rate Est: 6.0% Revenue (Mil) 4,493.70 4,715.65 5,046.11 5,300.2352WK H-L ($): 32.38-65.37 M-Term EPS Gr Rate Est: 10.1% % Growth -4.6% 4.9% 7.0% 5.0%Market Cap (mil): 9,861 Debt/Equity: 0.0% Operating Income 888.70 824.48 962.22 1121.19Insider Holding 4.5% Net Debt/Equity -6.4% Operating Margin 19.8% 17.5% 19.1% 21.2%Avg. Daily Vol (Thou): 2,325 FCF/Total Debt 6.49x EPS (Cal) $3.33 $4.09 $4.80 $5.45Dividend ($): $0.00 ROA: 21.7% FCF/Share $4.63 $4.84 $5.22 $5.87ESG BB ROE: 32.9% P/E (Cal) 26.1x 21.2x 18.0x 15.9xBeta: 1.03 ROIC: 12.3% EV/EBITDA (Cal) 9.4x 10.6x 9.1x 8.3x
Recommendation The retail environment has encountered a significant change over the past three years with the “Amazon effect” looming over consumers’ and investors’ minds. Many brick and mortar retailers have been victims of engaging in intense promotional pricing with the hope of surviving the price transparency that ecommerce has created. As a result, many retailers have been downgraded and are seen as attractive value plays. Michael Kors has been able to maintain gross margins of nearly 60% and has been an active player in the market; maintaining a strong balance sheet (net cash), and acquiring market-leading Red Carpet brands (Oscars, Emmys, Cannes film festival), and JC. Despite KORS recent success, they are still in the early innings of their ‘turnaround’ plan. Management is strategically focusing on expanding their current portfolio into lifestyle brands introducing new products representing a 40% turnover in the current portfolio. Currently, 70% of revenue comes from handbags and leather goods; however, Runway 2020 aims to shift this segment to 62% of revenue with an emphasis on increasing Women’s Ready-to-Wear and increasing already accelerating Men’s Wear. KORS has also established in their initiatives the intent to rationalize stores; concentrating on ecommerce and renovating 100 stores, while shutting down underperforming stores over the next two years. Finally, Runway 2020 displays tremendous opportunity in the Chinese markets as this demographic represents $245M in sales. Asia is KORS least penetrated demographic, yet it’s fast growing with YoY revenues growing 30% with retail up 31%. Management indicates that their addressable market has the ability to reach $1B through store expansion, ecommerce and improved productivity. With Michael Kors Holding’s clean balance sheet and growth potential, it is recommended it be added into the AIM International Equity Fund at a target price of $86.71 yielding a 28.90% upside.
Investment Thesis ● Halfway Down the Runway: KORS is in the middle of restructuring many areas of the business:
product assortment, ecommerce, pricing, inventory normalization, geographic expansion and integration of JC. Through this restructuring margins will be under pressure with upfront cost before popping towards their normalized levels. Through product expansion/innovation, reducing promotional periods and ramping up the JC acquisition margins are set to expand. As an example, management has guided that last quarter’s launch of Bancoft. Women’s footwear and ready-to-

Marquette University AIM Class 2018 and 2019 Equity Reports Spring 2018 Page 15
wear has started gaining traction with room to run, posting double digit sales YoY. The Men’s segment, currently 3% of Rev, is targeted at 8% by 2020 through increasing product assortment of clothing and professional bags (Harrison brands). As a benchmark, Coach’s Men’s segment is 20% of revenue. Management mistakenly became overly promotional and has announced they will be reducing FY19 promotional days by 60% increasing margins and Average Retail Unit (AUR), maintaining its brand image. Ecommerce (est. 20% of Rev) is ready set to expand as KORS has renovated its website and launched its online dress shop. Aiding the initiative to become a lifestyle brand, JC was a strategic bolt-on acquisition which will become accretive in FY19, as the company is investing and marketing the new brand. Currently, $470M, KORS estimates it will reach $1B implementing 10 new stores per year in selective markets like Asia.
● Strolling into Asia: Asia, especially China, is KORS’s most underpenetrated geographic region currently occupying 30 cities with 111 store locations. China is an attractive venture as the middle class is expanding - along with its demographics of 140 cities with over 1 million people and 88 over 5 million, which has also seen an acceleration in urbanization as the government invests in infrastructure. KORS bought out, taking full ownership of its China segment, a lucrative play similar to what competitors have done. KORS has a small presence in China, holding only 54% brand awareness as compared to 92% in USA and 80% in Europe. In efforts to expand this figure, the company partnered last quarter with Yang Mi, a Chinese celebrity (with 70 million followers on Social Media). KORS created “The Walk,” an ecommerce-based video platform, working with social influencers customizing their personal styles.
● Growth Stock Weaved into a Value Play: KORS is poised for expanding margins as the company normalized revenue, reduces promotions, and introduces JC. In comparison to competitors’ trades below in both PE and EV/EBITDA while maintaining a cash flow yield of 13.5%/ $5.10 per share. KORS historically trades at EV/EBITDA at 14.2x although currently it sits at 8.9x. KORS is not properly credited for its well positioned balance sheet with net cash $700M and no long-term debt. The company has plans to continue to buy back stock as they feel the company is undervalued, a move they feel is most accretive to shareholders. Capital allocation ranks executing Runway 2020, buy backs, followed by potential of another bolt-on acquisition.
Valuation In order to reach an intrinsic value for KORS, a five-year DCF model was constructed. Using a terminal growth rate of 1.5%, WACC of 9.1%, an intrinsic value of $87.81 was reached. A sensitivity analysis on the terminal growth rate and WACC ranged from $97.80-74.99. Additionally, an EV/EBITDA multiple was used using a multiple of 11.85x a value of $85.62. Weighting the two valuation models 50/50, a price target of $86.71 was reached, yielding a 28.90% upside. KORS does not pay a dividend.
Risks ● Jimmy Choo’s Integration: China is main target for JC, nevertheless it has struggled in North
America prior to the acquisition (29% of Rev). KORS has renovated 45% of existing 150 stores and plans to renovate 10-15 per year to improve JC’s market share.
● Coach’s Presence in China: Top competitor, Coach, holds top market share in China as KORS showed up late to the party. In order to gain comps, KORS must build brand awareness (currently 54%) and/or steal market share from their main competitor.
● Watches in Decline: Although partnered with Google for KORS’s Sofie Access smartwatch, these wearables continue to be a competitive space and a declining revenue stream.
Management John Idol acquired KORS becoming the CEO in 2003 and BOD in 2010. He was previously at Ralph Lauren, CEO and chairman of Kasper ASL Ltd. Founder Michael Kors remains as CCO and BOD holding 2.9% share. As of 2017, Thomas Edwards joined KORS becoming CFO and COO.

Marquette University AIM Class 2018 and 2019 Equity Reports Spring 2018 Page 16

Marquette University AIM Class 2018 and 2019 Equity Reports Spring 2018 Page 17
Oaktree Specialty Lending Corp. (OCSL) January 26, 2018
Joe Flynn Domestic Financial Services Oaktree Specialty Lending Corporation (NYSE: OCSL) is a specialty finance company dedicated to providing customized, one-stop credit solutions to companies with limited access to public or syndicated capital markets. The company seeks to generate current income and capital appreciation by providing companies innovative financing solutions that include first and second lien loans, unsecured and mezzanine loans, and preferred equity. The firm’s investment portfolio totaled $1.5B at fair value on its September 2017 fiscal year-end, holding 125 companies across more than 40 industries. Debt Investments carrying a weighted average yield of 9.6% make up approximately 92% of the portfolio, of which 83.6% are floating rate. OCSL was founded in late 2007 and is regulated as a business development company (BDC) under the Investment Company Act of 1940. Following the new investment advisory agreement dated October 17, 2017, the company is externally managed by Oaktree Capital Management, L.P. Oaktree Capital Management manages $100B in assets and has been a premier credit manager and leader among alternative investment managers for more than 20 years; 70% of invested assets in credit strategies.
Price ($): 5.09 Beta: 0.50 FY: September 2016 2017 2018 2019
Price Target ($): 7.03 NII/sh Gr Rate Est -11.4% Investment Income 247,871.00 177,964.00 141,920.74 153,185.5652WK H-L ($): 5.90-3.90 Leverage - SBA 0.67 % Growth -7% -28% -20% 8%Market Cap (mil): 717.5 Management Base Fee % 1.50% NII 106727.00 72652.00 57839.58 65869.79Insider Holdings 19% FV % of Cost 88.00% % Margin 43% 41% 41% 43%Avg. Daily Vol (mil): 4.6 Non-Accrual % 4.4% FV of Investments 2165491.0 1768180.3 1626794.9 1687859.6Div Yield (%): 9.8 Efficiency % 43.4% % Yield 11.4% 10.1% 8.7% 9.1%Dividend Payout Ratio 95% ROE (%): 6.6% NAV/share 7.55 6.16 6.23 6.66Short Interest 0.6 Net Insider Buys - 6mo $1.86mm P/NAV 0.67 0.83 0.82 0.76
Recommendation Private equity fundraising was a record $453B in 2017, and it expected that investors will favor alternative investments in upcoming periods in search of higher yields. One problem is that it’s not easy for money to flow into private assets, so investors therefore must find a manger to put money to work. BDCs that offer direct lending to private businesses are one vertical that offer PE exposure, which caught the attention of Oaktree’s Howard Marks. Oaktree has been a net seller of investments in the recent past; however, Oaktree acquired two BDCs from former advisor First Street Asset Management FSAM), re-branding them as OCSL and OCSI. The legacy portfolio under the direction of FSAM delivered the worst investment track record in BDC history averaging over 5% annualized credit losses. The portfolio also had one of the highest number of non-accruals compared to the industry and has faced a declining NAV since 2007. Initially the acquisition came as a surprise given the poor performance, but Oaktree is following its mantra of being a buyer when no other buyers can be found, which provides re-assurance to investors. Oaktree will re-position the portfolio by restructuring/exiting names and by adding positions that align with their credit investing process. Going forward, top line growth through rotation and credit stability will occur given that Oaktree marked the book down by 14% in 4Q17. Repositioning efforts should lead to some temporary deleveraging and uneven investment income, but the portfolio is expected to return to growth in 2019. Dividends are expected to fluctuate as well, but if the payout is 95-100% of NII, a 10% yield is likely. Once the portfolio is successfully repositioned, OCSL will eventually earn an ROE consistent with the BDC space of around 8-10% and trade at the peer average of 1x of the estimated 2018 NAV. Oaktree will be prudent investors and not rush growth initiatives, but once the portfolio is trading at NAV, look for OCSL to start raising equity to build up dry powder. OCSL would then be able to capitalize on investments trading at a bargain when the credit cycle finally turns and generate stronger returns. It is recommended OCSL be added to the AIM fund with a price target of $7.00 (an upside of nearly 40%) also offering a backdoor play on Oaktree.
Investment Thesis

Marquette University AIM Class 2018 and 2019 Equity Reports Spring 2018 Page 18
Oaktree’s First Order of Business: Reposition Portfolio. Oaktree’s distressed debt and restructuring track record make the team amongst the best suited to preserve and recover the value of the legacy FSC book. The company is actively rotating out/restructuring its high level of non-accruals (16.4% of the portfolio at cost) and other challenged investments as part of its portfolio repositioning strategy. Oaktree intends manage the legacy portfolio down to a core set of high conviction investments and will reduce exposure to loans < $10mm. The size of individual investments will represent 2.5% of the portfolio or balances of $35-$40M with an upper limit of 5% now in place to avoid concentrated losses from any individual investment.
The Oaktree Difference. Oaktree has invested over $10B in direct lending since 2005 that will be co-invested in negotiated transactions alongside OCSL after recently getting approval from the SEC. The company will leverage the scale and relationships of Oaktree’s Strategic Credit Team beginning in 2018, which includes 250 experienced professionals with significant origination, structuring, and underwriting expertise. Oaktree is a trusted partner to many financial sponsors and management teams, serving most of the largest pension funds. Extensive origination capabilities will lead to greater ability to source quality investments, provide opportunities for increased deal flow, and give the company first looks at possible investments that FSAM was unable to provide.
Capitalize on Middle Market Direct Lending Opportunities. Middle market companies with EBITDA of $10M to $50M represent 1/3 of private sector GDP and provide a significant opportunity for direct lending. Commercial banks have decreased lending to middle market companies and currently account for only 10% of lending. Oaktree will approach the direct lending void left by banks through multiple strategies, but primarily through strategic credit & US Private Debt that have a combined AUM of $4.5B, after adding $2.5B from OCSL. The new non-traditional lenders that entered the space do not have the same experience in direct lending and investing across credit cycles as Oaktree, giving OCSL the upper-hand to capitalize on a market that remains robust.
Valuation The IV for OCSL was reached by using the expected value of 80% base case 2018 PT and 20% upside case 2020 PT. The 2018 PT is based on 1.0x NAV, which is in line with BDC universe, and assumes OCSL’s portfolio re-positioning is on track and good asset management met with gratitude by investors. The upside case price PT is 11x NII, which assumes 10% ROE. It also is based on Oaktree growing portfolio by the same amount of current non-accruals, adding 10% interest of interest income, justifiying the slight discount to peers. The final result is a price target of $7.00, providing an upside of $35.5%
Risks Credit Risk. Risky investments can be impacted by adverse global economic trends and middle
market compaies are generally more cyclical affecting their ability to repay debt. Investors lose patience. Oaktree is a patient investor who is willing to sacrifice returns in today’s
environment by waiting out strategies may lose the attention of it’s investors if the bull market continues. Oaktree has underperformed recently and may take longer than anticipated to re-position the portfolio depending on where we are at in the cycle. Concentration Risk & Exposure to healthcare. The company has a concentretated investment portfolio. Investments in top five obligors account for 20% of the total cost value, and about 30% of investment portfolio have exposure to healthcare
Management The re-branded BDC attracted new board members upon the resignation of all former board members, excluding one director. Oaktree’s Vice Chairman John Frank, became the new chairman of the board in 2017. Edgar Lee was appointed CEO. Lee founded Oaktree’s strategic credit strategies, which have grown from $250M to $3B in only 5 years under his leadership.

Marquette University AIM Class 2018 and 2019 Equity Reports Spring 2018 Page 19
$4
$4
$5
$5
$6
$6
$7Oaktree Specialty Lending Corporation - Price
50
60
70
80
90
100
110
120Oaktree Specialty Lending Corporation - Total Return Relative to Russell 2000
4/16 7/16 10/16 1/17 4/17 7/17 10/17 1/18
0
2
4
6
8
10
12
14
16Oaktree Specialty Lending Corporation - Volume
TickerMarket Cap
(mil)Div Yield P/NAV P/NII* Leverage
GCI 718 9.80 0.83 8.60 0.78AINV 1,312 9.90 0.89 9.60 0.59ARCC 6,915 9.40 0.98 10.30 0.66BKCC 479 10.90 0.82 7.90 0.42GLAD 260 8.50 1.16 11.40 0.65GSBD 878 8.20 1.20 11.10 0.64
1,969 9.38 1.01 10.06 0.59*2017 Estimates
Name
Ares Capital CorporationBlackRock Capital Investment Cor
Apollo Investment Corporation
Peer AveragesGoldman Sachs BDC, Inc.Gladstone Capital Corporatoin
Oaktree Specialty Lending Corp.
Shares % Out25,911,000 18.38
7,974,000 5.667,159,000 5.085,582,000 3.964,286,000 3.04
Source: FactSet
Muzinich & Co., Inc. Fuller & Thaler Asset Management, Inc,
Top 5 ShareholdersHolderOaktree Capital Management LPSpringhouse Capital ManagementSenvest Management LLC
TickerMarket Cap
(mil)Div Yield P/NAV P/NII* Leverage
GCI 718 9.80 0.83 8.60 0.78AINV 1,312 9.90 0.89 9.60 0.59ARCC 6,915 9.40 0.98 10.30 0.66BKCC 479 10.90 0.82 7.90 0.42GLAD 260 8.50 1.16 11.40 0.65GSBD 878 8.20 1.20 11.10 0.64
1,969 9.38 1.01 10.06 0.59*2017 Estimates
Name
Ares Capital CorporationBlackRock Capital Investment Cor
Apollo Investment Corporation
Peer AveragesGoldman Sachs BDC, Inc.Gladstone Capital Corporatoin
Oaktree Specialty Lending Corp.

Marquette University AIM Class 2018 and 2019 Equity Reports Spring 2018 Page 20
Masimo Corporation (MASI) January 26, 2018
Kyran Young Domestic Healthcare Masimo Corporation (NASDAQ: MASI) produces and distributes an array of non-invasive patient monitoring systems, medical devices, and a variety of sensors to hospitals, emergency medical services (EMS) providers, long-term care facilities, physician offices, veterinarians, and consumers. Masimo’s core business deals with pulse oximetry monitoring. Their Signal Extraction Technology (SET) pulse oximetry overcomes the restrictions of traditional pulse oximetry by increasing the accuracy of their measurements in the presence of movement, low perfusion, and weak signal situations. Since launching their SET pulse oximetry technology, MASI has continued to innovate and produce non-invasive products that record additional measurements. They continue to expand their technologies to non-invasively monitor brain functioning, capnography, gas monitoring, and tissue and cerebral oximetry. In 2016, Masimo recorded 70.1% of their revenue from the US, 16.9% from Europe, the Middle East, and Africa, 10% from Asia, and 3% from South America. They were founded in 1989 and are headquartered in Irvine, California.
Recommendation Since going public in 2000, MASI has experienced consistent revenue growth with revenues approaching $700 million. MASI SET sensors use infrared and red LEDs to send signals through the blood stream. These lights then convert into a percentage of hemoglobin molecules with oxygen, ultimately measuring oxygen saturation. Their SET technology has differentiated MASI by significantly improving their measurements during patient movement and low perfusion and the sensitivity to improve true alarm detection. This has resulted in effectively improving patient care and reducing false alarms. Their Rainbow SET, another monitoring platform, is the only technology capable of non-invasively monitoring methemoglobin and carboxyhemoglobin. Through MASI’s many collaborations and partnerships, they have been able to significantly grow the company. Masimo collaborates with Cercacor, an independent entity spun off from Masimo in 1998. MASI permits Cercacor rights to use their SET technology and in return, they license from Cercacor to produce and distribute products that use Masimo’s rainbow technology. By expanding their SET pulse oximeter products and continuing to innovate their various monitoring technologies, Masimo has grown their product revenue to $663.85 in 2016 from $464.93 in 2012, representing a 5 year CAGR of 7.38%. MASI generates strong cash flows and operates with a 3.42% cost of debt. They have a 5 year average ROE of 33.13% compared to the industry average of 11.76%. The pulse oximetry market is expected to be valued at $2,778.2 million by 2020: $497.3 million in Asia Pacific, $650 million in Europe, and $1,576.5 million in North America. Due to the expected growth of the pulse oximetry market and the increasing use of non-invasive monitors, it is recommended that Masimo Corporation be added to the AIM Small Cap Fund with a price target of $104.32 per share and a 16.51% upside. MASI has not paid a dividend the past 6 years. Investment Thesis

Marquette University AIM Class 2018 and 2019 Equity Reports Spring 2018 Page 21
Expanding their Market Share in the Pulse Oximetry Market. Hospitals, doctors and nurses are paid based on the quality of the services they provide. Given the accuracy, efficiency, and the overall improvement of patient’s health when using Masimo’s technologies, they can expect an increase in demand for their products. In addition, they hope to expand their market by monitoring post-surgical patients in hopes of reducing adverse drug events with the use of opioid drugs. As the opioid crisis in America is continuing to grow, monitoring patients post-surgery can significantly improve patient health and reduce the number of transfers to intensive care units and deaths related to opioid induced respiratory depression.
FDA cleared the home-use of the Rad-97 Pulse CO-Oximeter. On January 9th, 2018, MASI announced clearance for home use of the Rad-97 Pulse CO-Oximeter. With an increasing number of patients receiving home care, the home approval of the Rad-97 provides a significant opportunity for MASI. Through its Bluetooth and WiFi capabilities, doctors are able to interact with the patients through live video and audio. In addition, it wirelessly connects to other patient monitoring systems and allows doctors to automatically transfer data to hospital EMR systems.
Partnership with Royal Philips NV. Royal Philips focuses on improving patient’s health through the use of monitoring systems. They have an extensive product that ranges from bedside monitors to wearable patient monitors. Philips represents more than half of the market and monitors approximately 150 million patients each year. MASI and Philips have agreed to incorporate each others technologies within their products, which is also expected to expand Masimo’s market in the future.
Valuation To reach an intrinsic value for MASI, a five year DCF model was constructed. Using a terminal growth rate of 3.5% and a WACC of 7.18%, an intrinsic value of $114.41 was reached. Additionally, a P/E multiple valuation was calculated. Using a 2016 EPS of $2.83, a comparable average P/E multiple of 40.70x and 35.44x, and a 5-year historical average P/E ratio of 29.09x, an intrinsic value of $98.84 was reached. An EV/EBITDA multiple was calculated using a target EV/EBITDA mulitple of 19.44x. An EV target of $4,591.46 was calculated by multiplying MASI’s EBITDA by the EV/EBITDA target. A price target of $81.56 was reached by subtracting cash from the EV target and dividing it by the number of shares outstanding. Weighting the DCF 60%, the P/E multiple valuation 20%, and the EV/EBITDA multiple valuation 20%, an intrinsic value of $104.32 was reached, resulting in a 16.51% upside. Risks
The Consolidation of Group Purchasing Organizations (GPOs). Masimo’s performance is dependent on their ability to establish new contracts with GPOs and various health networks. Over the past few years, GPOs have been consolidating in the healthcare industry to strengthen buyer power. As a result, this could put significant pressure on the prices and sales of Masimo’s products.
Repayment from the Governmental and Third-Party Payers. Some payers have expressed an unwillingness to pay for procedures that use Masimo’s products. In addition, some payers are still investigating Masimo’s products to determine if they will reimburse them for their products used. Failure to work with and receive reimbursements from payers could decrease both their prices and market share in the long run.
Management Joe Kiani founded Masimo in 1989 and serves as the Chairman and CEO of the company. Mr. Kiani has successfully taken Masimo public and is dedicated to patient safety as he started the Patient Safety Movement Foundation in 2012 and the World Patient Safety, Science and Technology Summit. He is also the Chairman and CEO of Cercacor Labs, a spinoff from Masimo Corporation.

Marquette University AIM Class 2018 and 2019 Equity Reports Spring 2018 Page 22

Marquette University AIM Class 2018 and 2019 Equity Reports Spring 2018 Page 23
Gannett, Co., Inc. (GCI) January 19, 2018
Joe Flynn Domestic Consumer Discretionary Gannett, Co. Inc. (NYSE: GCI) is a leading media and marketing company currently undergoing a strategic transformation to become a ‘digital first’ newsroom. The company operates within two segments: Publishing and ReachLocal. GCI owns USA Today, which is the #1 ranked newspaper in the US with 4 million daily circulation (14% market share). GCI is also well-diversified across 109 local media organizations in the US - and they have more than 160 local media brands in the UK. ReachLocal was acquired in 2Q16 and offers digital marketing solutions to businesses primarily in local markets. ReachLocal’s platform consists of digital advertising, web presence, and software-as-a-service products and services. Gannett was founded in 2014 following a spin off from now TEGNA to separate broadcasting and newspaper businesses. It is headquartered in McLean, VA.
Price ($): 11.98 Beta: 0.95 FY: Dec 2016 2017 2018 2019
Price Target ($): 17.70 M-Term Rev. Gr Rate Est: -1.4% Print Revenue (Mil) 2,279,251.83 2,174,201.41 2,003,987.49 1,877,925.3552WK H-L ($): 12.38 - 7.36 M-Term EPS Gr Rate Est: 1.3% % Growth 2% -5% -8% -6%Market Cap (mil): 1,318 Debt/Equity: 43.4 Digital Revenue 704973.37 1028771.78 1090070.59 1165393.85Insider Holdings 52% Debt/EBITDA (ttm): 1.15 % Growth 20% 46% 6% 7%Avg. Daily Vol (mil): 1.1 WACC 12.00 EBITDA* 349613.0 361389.8 358039.1 375752.7Yield (%): 5.4 FCF Yield 17.00 % Margin 11% 11% 12% 12%ESG Rating ROE (%): 9% EPS* 1.22 0.89 0.80 0.92
ROIC (%): 4.01 P/E* 9.82 13.49 14.92 12.98
Recommendation Changing consumer preferences for news has limited the effectiveness of print newspapers and supported the rise of digital advertising; ultimately leading to significant consolidation within the industry to offset print losses. GCI effectively used an M&A strategy to expand their footprint making four acquisitions at low multiples in the 3.5x-5x EBITDA range from 2014-2016. GCI added core newspapers in favorable economic areas and acquired companies already investing in digital solutions, such as Milwaukee-based Journal Media Group (JMG). The strategy improved GCI’s cost base substantially with same store COGS decreasing by an average 15% YoY and which helped stabilize top line print revenue declines of -10%. It is anticipated that efforts made to maximize efficiency will continue to reduce costs and increase profitability in the near to mid-term, despite the continued softness of traditional advertising and circulation. GCI has been building up a strong online presence that has flown under the radar over this time. It is estimated 40% of internet users’ access content on USA Today Network Platforms daily with 50% of the views coming from millennials. GCI will continue to leverage its scale and roll-out of ReachLocal into the existing local markets, which will drive the majority of digital growth and shift negative perceptions of the stock. GCI’s local presence in 109 markets makes it the largest local-to-national news network in the US, giving the company an advantage over other newspapers in competing for the remaining advertising share in order to survive. Expansion of the USA Today Network to additional publications could also lead to revenue upside and improve earnings at a faster rate due to higher-than-expected pricing leverage. At the national level, USA Today is already transitioning to digital nicely with over 50% of advertising revenues coming from digital - 70% of which are from mobile platform GCI will have the resources to close the gap brought on by declining print revenues over the next 18-24 months. Total digital revenues are approaching $1B this year, and digital advertising will exceed print advertising revenue by 2019. EBITDA margin will also expand to +12% in 2018, and grow organically from there on out. It is recommended GCI is added to the AIM fund with a price target of $17.70, representing a 48% upside. GCI also pays a quarterly dividend yielding 6% (30% FCF), and carries a strong FCF yield of 18%.
Investment Thesis Roll-Out of Reach Local into the USA Today Network. GCI’s trusted relationships and
portfolio of news sites across the USA Today Network will enable Reach Local to leverage its technology and scale up significant local business leads. 70% of local advertising revenues is print based, but the benefits of digital advertising have garnered significant interest from

Marquette University AIM Class 2018 and 2019 Equity Reports Spring 2018 Page 24
customers after being rolled out during the second quarter. The segment already announced 36 campaigns within 3 months, and 96% of clients stated that the technology improved performance retention, while lowering their cost per click. 3Q17 results showed its growth potential after the successful rollout into Milwaukee markets with ReachLocal EBITDA margins of 6%, expanding 400 bps during the quarter. Integration into GCI’s local markets is still in its early stages, but it is expected to accelerate revenue growth of 12-15% YoY and on a quarterly basis, and provide additional future cross selling opportunities. Margins are expected to approach 9-10% over the next 18 months, as well.
Digital Content is King. Lower-rate digital ads can offset print advertising declines with digital content that can increase page views, as shown by USA Today’s organic growth in 2016. GCI improved its mobile content significantly, and started utilizing premium strategies such as native, programmatic, and video for advertising. These strategies will grow digital publishing revenues and increase the company’s CPM over time – first step to alleviate concern of under monetized content experienced in previous periods. CPMs typically fall in the range of $10-30 for video content compared to traditional display advertising of <$10. GCI witnessed record level page views in 2017 by increasing videos per day across its network from +50/day in 2016 to around +150/day, increasing video revenue by 30%.
Real Estate and Print Assets Protect Downside. GCI’s capacity allows them to continuously harvest cash flow from print assets - and centralized printing and sales operations will help keep print declines in check. Additional revenue can be gained by outsourcing printing equipment to competitors as well. GCI also operates a real estate portfolio consisting of 153 owned properties of 11.2mm sq. /ft. and 307 leased properties of 33.7mm sq. /ft. GCI has generated strong FCF of around $20M/year from discrete property sales at fair value, but information pertaining to the real estate business has been withheld by the company. The 2016 Acquisitions gave rise to additional new real estate assets, like the Tennessean’s Nashville headquarters that GCI recently agreed to sell for $55M in 2Q17. Often overlooked, the understated real estate is a key source of unlocked value to the stock, and provides a solid margin of safety that can protect downside losses.
Valuation To reach an intrinsic value for GCI a sum of the parts valuation was conducted using estimates for the operating segments and corporate EBITDA represneting allocated costs. To reach an enterprise value for the publishing a segment, an 2017E EBITDA implied a 15% margin in line with management guidance was used against peer median 7x multiple.The ReachLocal segment EV was determined by a 2018E sales based on 12% revenue growth, and a 2x EV/Sales multiple. For the corporate segment, a terminal value was reached assuming a 2017E EBITDA and discount rate of 10%. The final result was a summed total EV of $2.99B, and after subtracting net debt and the $678M underfunded pension, a price target of $17.70 per share was reached, representng 48% upside.
Risks Poor M&A A bad acquisition could significantly undermine GCI’s stable strategy to grow its
digital business. It already once tried to acquire Tribune Media for $15/share at 6x EV/EBITDA, and overpaying for the company could destroy shareholder value. Management is always under pressure to grow the business, but needs to maintain disciplined by looking for technology assets and following their strategy for M&A on the print side in cities with populations in the range of 50,000 to 300M.
Prolonged Negative Sentiment. If print advertising declines faster than expected at +18% on a same store basis it would likely impede on the digital growth story. Weakness in circulation and continued erosion in subscriber volumes also presents a clear risk.
Management Bob Dickey became the CEO after previously serving as president of local publishing division prior to the split. Sharon T. Rowland is the President of USA Today Network Marketing Solutions.

Marquette University AIM Class 2018 and 2019 Equity Reports Spring 2018 Page 25
$6
$8
$10
$12
$14
$16
$18
$20Gannett Co., Inc. - Price
4/16 7/16 10/16 1/17 4/17 7/17 10/17 1/18
30
40
50
60
70
80
90
100
110
0
2
4
6
8
10
12
14Gannett Co., Inc. - Total Return Relative to Russell 2000 Gannett Co., Inc. - Volume
TickerMarket Cap
(mil)EV/Sales P/E FY 1
EV/EBITDA
P/B
GCI 1,318 0.49 12.54 4.49 1.53NEWM 891 0.85 -86.59 6.61 1.33TRNC 604 0.51 24.14 nm 8.81NYT 3,218 1.63 25.49 10.67 3.50MDP 3,027 2.32 21.23 11.50 2.98TIME 1,842 0.96 17.20 7.00 1.34
1,935 1.25 22.01 8.95 3.59
Name
tronc, Inc.New York Times Com
New Media Investme
Time, Inc.Meredith Corporation
Gannett Co., Inc.
Ticker Revenue FY1 ROE* ROAEBITDA
Margin %*DEBT/EBITDA
FY1GCI 3,149 12.00 1.62 11.00% 1.0
NEWM 1,312 -1.81 -0.99 11.15 2.2TRNC 1,513 28.73 2.88 10.12 2.1NYT 1,665 11.44 4.57 14.61 1.0MDP 1,690 19.19 6.91 24.12 2.2TIME 2,782 -0.16 -0.05 14.29 3.1
Peer Averages 1,793 11.5 2.7 14.86 2.1*Non-GAAP Source: FactSet
Name
Gannett Co., Inc.New Media Investmetronc, Inc.New York Times ComMeredith CorporationTime, Inc.