applied learning student questionnaire: overall analysis
TRANSCRIPT

Applied Learning Student Questionnaire 2018 Omnibus Report
1
Applied Learning Student
Questionnaire: Overall Analysis
Executive Summary
The Applied Learning Student Questionnaire (ALSQ) is designed to measure pre- and post-gains related
to student problem solving and communication skills. The ALSQ is a self-report questionnaire that
includes 36 items to assess students’ attitudes on five survey constructs: Intrinsic Motivation, Self-
Management/Self-Regulation, Intent to Persist, Problem-Solving, and Implementation Activities.1 In May
2018, 151 students across three Innovation Fund programs completed the Applied Learning Student
Questionnaire (ALSQ). The programs include Carroll County Step into STEM and Full STEAM Ahead,
Gwinnett County Gear Up for Graduation, and Hall County/TCSG Career Pathways.
Key findings include:
• Overall, students showed statistically significant increases in Intrinsic Motivation, Self-
Management/Self-Regulation, and Intent to Persist.
• Across all constructs, the largest effect size observed was for Intrinsic Motivation, which suggests
that the programs were effective at enhancing student interest in learning and seeing value in the
course content.
• Each of the three programs showed statistically significant increases in Intrinsic Motivation, Self-
Management/Self-Regulation, and Intent to Persist.
• The “now” score for Intrinsic Motivation was the only construct that met the optimal average of
4.00, which means programs may need additional work in establishing an inquiry-based learning
environment and increasing student exposure to and interest in STEM.
• The average program rating across all programs exceeded the optimal 4.00 average, with an
average of 4.44, suggesting that students generally viewed the programs positively.
• Student ratings indicate that increasing student exposure to STEM professionals and real-world
problems may enhance student interest in pursuing STEM education and careers in the future.
1 Intent to Persist refers to aspirations, plans, and goals to pursue additional education and a career in STEM (Science,
Technology, Engineering, and Math). Implementation Activities refer to hands-on activities designed to increase exposure to
STEM topics and real-world application.
Applied Learning Student Questionnaire 2018 Omnibus Report
2
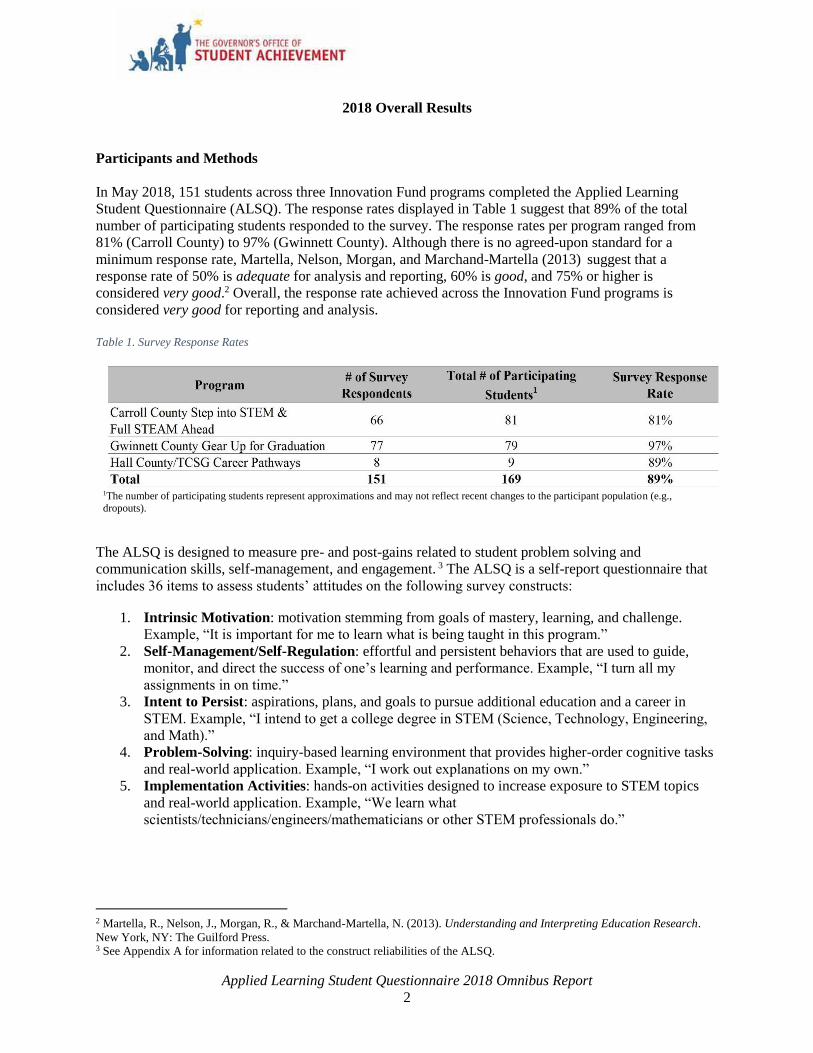
2018 Overall Results
Participants and Methods
In May 2018, 151 students across three Innovation Fund programs completed the Applied Learning
Student Questionnaire (ALSQ). The response rates displayed in Table 1 suggest that 89% of the total
number of participating students responded to the survey. The response rates per program ranged from
81% (Carroll County) to 97% (Gwinnett County). Although there is no agreed-upon standard for a
minimum response rate, Martella, Nelson, Morgan, and Marchand-Martella (2013) suggest that a
response rate of 50% is adequate for analysis and reporting, 60% is good, and 75% or higher is
considered very good.2 Overall, the response rate achieved across the Innovation Fund programs is
considered very good for reporting and analysis.
Table 1. Survey Response Rates
1The number of participating students represent approximations and may not reflect recent changes to the participant population (e.g.,
dropouts).
The ALSQ is designed to measure pre- and post-gains related to student problem solving and
communication skills, self-management, and engagement. 3 The ALSQ is a self-report questionnaire that
includes 36 items to assess students’ attitudes on the following survey constructs:
1. Intrinsic Motivation: motivation stemming from goals of mastery, learning, and challenge.
Example, “It is important for me to learn what is being taught in this program.”
2. Self-Management/Self-Regulation: effortful and persistent behaviors that are used to guide,
monitor, and direct the success of one’s learning and performance. Example, “I turn all my
assignments in on time.”
3. Intent to Persist: aspirations, plans, and goals to pursue additional education and a career in
STEM. Example, “I intend to get a college degree in STEM (Science, Technology, Engineering,
and Math).”
4. Problem-Solving: inquiry-based learning environment that provides higher-order cognitive tasks
and real-world application. Example, “I work out explanations on my own.”
5. Implementation Activities: hands-on activities designed to increase exposure to STEM topics
and real-world application. Example, “We learn what
scientists/technicians/engineers/mathematicians or other STEM professionals do.”
2 Martella, R., Nelson, J., Morgan, R., & Marchand-Martella, N. (2013). Understanding and Interpreting Education Research.
New York, NY: The Guilford Press. 3 See Appendix A for information related to the construct reliabilities of the ALSQ.

Applied Learning Student Questionnaire 2018 Omnibus Report
3
Results and Discussion
ALSQ Survey Constructs
Table 2 summarizes students’ responses to the ALSQ survey constructs across all programs. In aggregate,
students showed statistically significant increases in Intrinsic Motivation, Self-Management/Self-
Regulation, and Intent to Persist. In addition to assessing statistical significance from “before” to “now,”
effect sizes—a measure of the magnitude of an intervention on students’ attitudes—were computed.
Specifically, effect sizes were computed using Cohen’s d and are intended to measure the practical
importance of a significant finding.4 Cohen (1988) classified effect sizes as small, d < 0.2; medium,
0.2 ≤ d ≤ 0.8; and large, d > 0.8.5 Table 2 suggests large effect sizes were found for Intrinsic Motivation,
and medium effect sizes were found for Self-Management/Self-Regulation and Intent to Persist. The
largest effect size observed was for Intrinsic Motivation (d=0.89). This suggests that the programs were at
least moderately effective in enhancing student interest in learning and deriving value from the material
taught. For example, after participating in the programs, 79% of students said they think what they are
learning in the programs is interesting, compared to 49% before the programs. See Tables 5-9 for more
information.
To maximize impact, students’ average scores should exceed 4.00 on a 5-point Likert scale (1, Strongly
Disagree to 5, Strongly Agree). The Intrinsic Motivation construct was the only one to have a “now”
score that reached or exceeded the optimal average of 4.00. The construct with the lowest “now” score
was Intent to Persist. Figure 1 suggests that all constructs need additional focus by all programs,
particularly developing student interest in STEM fields.
Table 2. Summary of Results by Construct6
1Reference lines are set at 3.5 and 4. 2Note: Only students with matched Pre and Post data were assessed for significance. Desired statistically
significant changes are highlighted in green. Negatively worded statements were reverse coded for mean computations. **p<0.001, *p<0.01, †p<0.05. See Tables 5-9 for more detailed information. 3Effect size (Cohen's d): Small (<.2); Medium (.2 to .8); Large (>.8). Small effect sizes
are highlighted in light red; medium effect sizes are highlighted in dark orange; large effect sizes are highlighted in dark green.
4 Effect sizes were calculated using Stata. 5 Cohen, J. (1988). Statistical Power Analysis for the Behavioral Sciences (2nd ed). Hillsdale, NJ: Lawrence Earlbaum Associates. 6 As indicated by the n size, all students did not answer all questions in the constructs and demographics sections.

Applied Learning Student Questionnaire 2018 Omnibus Report
4
Figure 1. Constructs
Note. A paired samples t-test was used to compute the p-value. **p<0.001, *p<0.01, †p<0.05.
ALSQ Survey Constructs by Program
After disaggregating the data by program, all programs showed statistically significant increases in
Intrinsic Motivation, Self-Management/Self-Regulation, and Intent to Persist. All programs exhibited their
largest effect size in Intrinsic Motivation. Two programs had large effect sizes for Intrinsic Motivation
and Self-Management/Self-Regulation. All other programs and constructs had medium effect sizes. These
data suggest that the individual programs were moderately effective at enhancing students’ motivations to
succeed and their intent to persist in STEM education and careers.
Table 3. Summary of Results by Constructs per Program
Note: Only students with matched Pre and Post data were assessed for significance. Desired statistically significant changes are highlighted in
green. Negatively worded statements were reverse coded for mean computations. **p<0.001, *p<0.01, †p<0.05. See Tables 5-9 for more
detailed information. Effect size (Cohen's d): Small (<.2); Medium (.2 to .8); Large (>.8). Small effect sizes are highlighted in light red; medium effect sizes are highlighted in dark orange; large effect sizes are highlighted in dark green. Additionally, note that the sample size for
Hall County’s Career Pathways program is only 8 students.

Applied Learning Student Questionnaire 2018 Omnibus Report
5
For programs to maximize their effectiveness, “now” scores should reach or exceed the optimal average
of 4.00 on a 5-point Likert scale (1, Strongly Disagree to 5, Strongly Agree). Figures 2-6 display “now”
scores for each program and construct. For example, Figure 2 indicates that two programs met or
exceeded the optimal average for Intrinsic Motivation, but one program fell short of the optimal average.
In general, programs not reaching or exceeding the red horizontal line may need additional attention. For
instance, at least two programs did not reach the optimal average for Self-Management/Self-Regulation
(Figure 3), Intent to Persist (Figure 4), Problem Solving (Figure 5), and Implementation Activities (Figure
6). It is important to take caution when interpreting the results for the Hall County/TCSG Career
Pathways program given the small sample size (n=8).
Figure 2. Intrinsic Motivation (“Now” Scores)
Figure 3. Self-Management/Self-Regulation (“Now” Scores)
Figure 4. Intent to Persist (“Now” Scores)
Figure 5. Problem Solving (“Now” Scores)
Figure 6. Implementation Activities (“Now” Scores)
Figure 7. Overall Program Ratings

Applied Learning Student Questionnaire 2018 Omnibus Report
6
Program Rating
Across all programs, students’ ratings of their programs exceeded the optimal average of 4.00. On a 5-
point Likert scale where 1 signifies Very Poor and 5 signifies Excellent, the average score was 4.44. All
programs were rated above the optimal average. These ratings suggest that students viewed the programs
positively.
Table 4. Program Rating
1Reference lines are set at 3.5 and 4.0. Assessment: Good = Above 4.0; Attention = Below 4.0; Action = Below 3.5. Highest percentages are highlighted in gray.
Areas for Further Improvement
Intrinsic Motivation (4.04) was the only construct to exceed the optimal average of 4.00 on a 5-point
Likert scale, despite the statistically significant gains in the Self-Management/Self-Regulation and Intent
to Persist constructs. All sub-items in Intrinsic Motivation showed statistically significant increases, but
two sub-items still had “now” scores below the optimal mean:
• Preference for challenging classwork (3.64), and
• Ability to use knowledge from this program in other classes (3.98).
All sub-items in Self-Management/Self-Regulation showed statistically significant increases except “I
miss class often” and “I am often late for class.” These negatively worded items did show decreases, but
the decreases were not statistically significant.
Though the “now” means for Implementation Activities and Problem Solving constructs were both above
3.80, certain items within those constructs require attention. Within the Problem Solving construct,
particular areas of concern include:
• Students working out explanations on their own (3.59),
• Students planning and doing their own projects and experiments (3.68), and
• Teachers letting students choose their own topics or projects to investigate (3.70).
Within the Implementation Activities construct, areas requiring attention include:
• Students interacting with STEM professionals (3.73),
• Students working in groups (3.75), and
• Students learning what STEM professionals do (3.80).
The construct with the lowest “now” mean was Intent to Persist (3.56), though all sub-items in this
category showed statistically significant increases. The lowest rated items refer to the students
envisioning themselves in a STEM career. The students’ ratings suggest that programs should enhance the
inquiry-based learning environment to promote student motivation and interest in STEM. Giving students
more agency over their own work and increasing exposure to STEM professionals and real-world
problems may enhance students’ intentions to persist in STEM education and careers.

Applied Learning Student Questionnaire 2018 Omnibus Report
7
Table 5. Intrinsic Motivation

Applied Learning Student Questionnaire 2018 Omnibus Report
8
Table 6. Self-Management / Self-Regulation

Applied Learning Student Questionnaire 2018 Omnibus Report
9
Table 7. Intent to Persist

Applied Learning Student Questionnaire 2018 Omnibus Report
10
Table 8. Problem Solving (Now Only)

Applied Learning Student Questionnaire 2018 Omnibus Report
11
Table 9. Implementation Activities (Now Only)

Applied Learning Student Questionnaire 2018 Omnibus Report
12
Table 10. Educational Plans
Table 11. Demographics – Gender
Table 12. Demographics – Ethnicity
Table 13. Demographics – Grade

Applied Learning Student Questionnaire 2018 Omnibus Report
13
Table 14. Length of Participation
Table 14. Summer Participation

Applied Learning Student Questionnaire 2018 Omnibus Report
14
Appendix A. Construct Reliabilities
Table A1. Construct Reliabilities (Omnibus, December 2018)
Cronbach’s Alpha Reliability Key: Cronbach’s alpha is a measure of the internal consistency of items
in a construct. This statistic ranges from 0 to 1; the higher the value the better. An alpha of 0.80 or higher
is considered to have achieved very good measurement reliability; an alpha of 0.65 is considered
acceptable (Field, 2009).
Reliability Interpretation
0.90 and above Excellent reliability; at the level of the best measures
0.80 – 0.90 Very good
0.70 – 0.80 Good; in the range of most. There are probably a few items which could be
improved.
0.60 – 0.70 Somewhat low. This measure needs to be supplemented by other measure
(e.g., more surveys) to determine outcomes. There are probably some items
which could be improved.
0.50 – 0.60 Suggests need for revision of measure, unless it is quite short (ten or fewer
items). The test definitely needs to be supplemented by other measure (e.g.,
more tests).
0.50 or below Questionable reliability. This measure should not contribute heavily to the
outcomes and needs revision.
From: J. C. Nunnally, Psychometric Theory. New York: McGraw-Hill, 1967, pp. 172-235.
Reference:
Field, A. (2009). Discovering Statistics Using SPSS, 3rd Edition. Thousand Oaks, CA: Sage Publications.