applied soft computing - mathworks · pdf fileapplied soft computing 23 (2014) 122–127...
TRANSCRIPT

As
Sa
b
a
ARRAA
KEGHIT
I
asomstltot
ttttgaid
h1
Applied Soft Computing 23 (2014) 122–127
Contents lists available at ScienceDirect
Applied Soft Computing
j ourna l ho me page: www.elsev ier .com/ locate /asoc
novel context sensitive multilevel thresholding for imageegmentation
warnajyoti Patraa,∗, Rahul Gautamb, Anshu Singlab
Department of Computer Science and Engineering, Tezpur University, Tezpur 784028, IndiaSchool of Mathematics and Computer Applications, Thapar University, Patiala 147004, India
r t i c l e i n f o
rticle history:eceived 12 July 2013eceived in revised form 8 May 2014ccepted 11 June 2014vailable online 19 June 2014
a b s t r a c t
Most of the traditional histogram-based thresholding techniques are effective for bi-level thresholdingand unable to consider spatial contextual information of the image for selecting optimal threshold. Inthis article a novel thresholding technique is presented by proposing an energy function to generatethe energy curve of an image by taking into an account the spatial contextual information of the image.The behavior of this energy curve is very much similar to the histogram of the image. To incorporate
eywords:ntropyenetic algorithmistogram
mage segmentationhresholding
spatial contextual information of the image for threshold selection process, this energy curve is used asan input of our technique instead of histogram. Moreover, to mitigate multilevel thresholding problemthe properties of genetic algorithm are exploited. The proposed algorithm is evaluated on the number ofdifferent types of images using a validity measure. The results of the proposed technique are comparedwith those obtained by using histogram of the image and also with an existing genetic algorithm basedcontext sensitive technique. The comparisons confirmed the effectiveness of the proposed technique.
ntroduction
Image segmentation plays an important role in image analysisnd computer vision. It is often used to partition an image intoeparate regions, which ideally correspond to different real-worldbjects. Thresholding is one of the most important and effectiveethod for image segmentation. Due to the advantage of smaller
torage space, fast processing speed and ease in manipulation,hresholding techniques have drawn a lot of attention during theast couple of decades. Since thresholding is a well-researched field,here exist many algorithms for determining an optimal thresholdf the image. A survey of thresholding methods and their applica-ions exist in literature [1].
Thresholding techniques can be divided into bi-level and mul-ilevel category, depending on the number of thresholds requiredo be detected. In bi-level thresholding, an image is segmented intowo different regions depending on a threshold value selected fromhe histogram of the image [2–10]. The pixels with gray values
reater than the threshold value are assigned into object region,nd the rest are assigned into background. Multilevel threshold-ng segments a gray level image into several distinct regions byetecting more than one thresholds [11–13]. Otsu’s method [2] is∗ Corresponding author. Tel.: +91 9434996199.E-mail address: [email protected] (S. Patra).
ttp://dx.doi.org/10.1016/j.asoc.2014.06.016568-4946/© 2014 Elsevier B.V. All rights reserved.
© 2014 Elsevier B.V. All rights reserved.
one of the popular histogram thresholding method that choosesan optimal threshold by maximizing the between class variance.The minimum error thresholding methods [3,4] defined a criterionbased on the assumption that the object and background pixelsare normally distributed and the optimum threshold is achievedby optimizing a criterion function related to the Bayes risk. In Pun’smethod [5], as modified by Kapur et al. [6], the threshold is deter-mined by maximizing the entropy of the object and backgroundpixels. Kwon’s [7] proposed a threshold selection method based onthe cluster analysis. In [8] a thresholding criterion is formulated byexploring the knowledge about intensity contrast. Huang and Wang[9] introduced fuzzy entropy measure to select optimum thresholdfrom the histogram. In [10], Liu et al. proposed a thresholding tech-nique that selects an optimal threshold based on a fuzzy entropymeasure which considers both inter class distinctness and intraclass variation.
Traditional thresholding techniques based on histogram of theimage suffered two major limitations [2,3,6,9]: (i) Unable to con-sider contextual information for selecting optimum threshold. (ii)Inefficient for multilevel thresholding as computationally demand-ing and complicated to implement. To mitigate the first limitation,
an energy function is proposed. This energy function computes theenergy of an image at each gray value by taking into an account thespatial contextual information of the image. The characteristics ofthis energy curve is similar to the histogram of an image i.e., if theenergy curve of an image includes peaks, we can separate it into a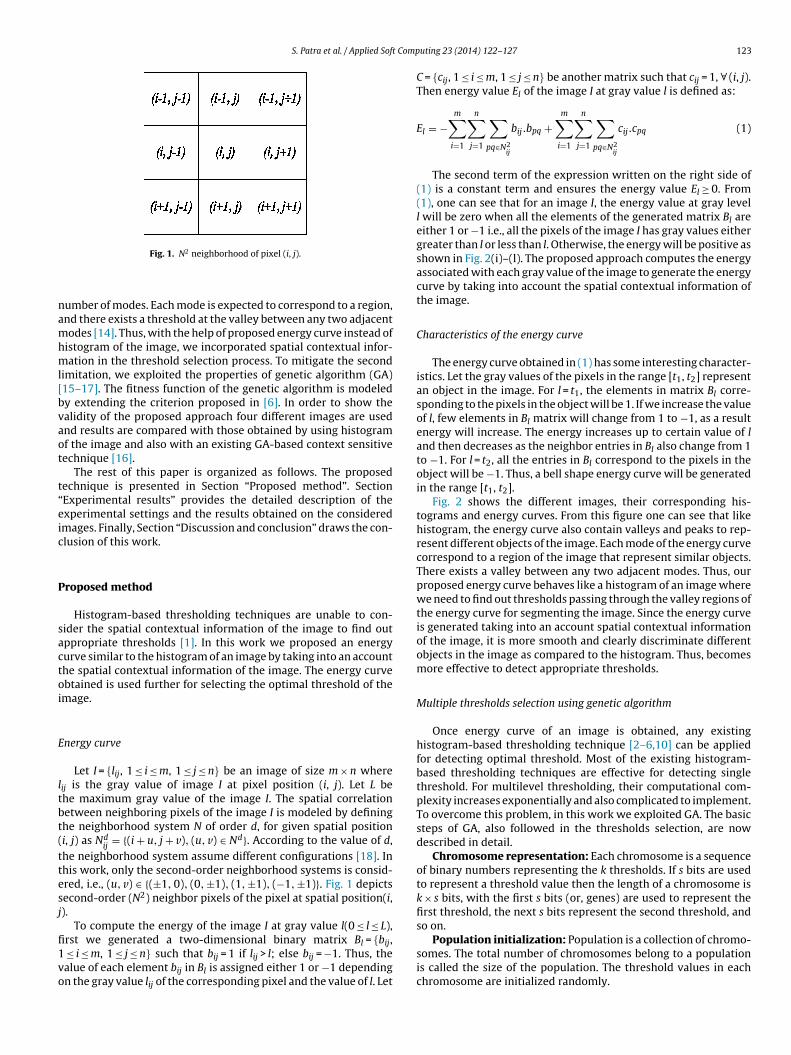
S. Patra et al. / Applied Soft Comp
namhml[bvaot
t“eic
P
sactoi
E
ltbt(ttesj
fi1vo
so on.Population initialization: Population is a collection of chromo-
Fig. 1. N2 neighborhood of pixel (i, j).
umber of modes. Each mode is expected to correspond to a region,nd there exists a threshold at the valley between any two adjacentodes [14]. Thus, with the help of proposed energy curve instead of
istogram of the image, we incorporated spatial contextual infor-ation in the threshold selection process. To mitigate the second
imitation, we exploited the properties of genetic algorithm (GA)15–17]. The fitness function of the genetic algorithm is modeledy extending the criterion proposed in [6]. In order to show thealidity of the proposed approach four different images are usednd results are compared with those obtained by using histogramf the image and also with an existing GA-based context sensitiveechnique [16].
The rest of this paper is organized as follows. The proposedechnique is presented in Section “Proposed method”. SectionExperimental results” provides the detailed description of thexperimental settings and the results obtained on the consideredmages. Finally, Section “Discussion and conclusion” draws the con-lusion of this work.
roposed method
Histogram-based thresholding techniques are unable to con-ider the spatial contextual information of the image to find outppropriate thresholds [1]. In this work we proposed an energyurve similar to the histogram of an image by taking into an accounthe spatial contextual information of the image. The energy curvebtained is used further for selecting the optimal threshold of themage.
nergy curve
Let I = {lij, 1 ≤ i ≤ m, 1 ≤ j ≤ n} be an image of size m × n whereij is the gray value of image I at pixel position (i, j). Let L behe maximum gray value of the image I. The spatial correlationetween neighboring pixels of the image I is modeled by defininghe neighborhood system N of order d, for given spatial positioni, j) as Nd
ij= {(i + u, j + v), (u, v) ∈ Nd}. According to the value of d,
he neighborhood system assume different configurations [18]. Inhis work, only the second-order neighborhood systems is consid-red, i.e., (u, v) ∈ {(±1, 0), (0, ±1), (1, ±1), (−1, ±1)}. Fig. 1 depictsecond-order (N2) neighbor pixels of the pixel at spatial position(i,).
To compute the energy of the image I at gray value l(0 ≤ l ≤ L),rst we generated a two-dimensional binary matrix B = {bij,
l≤ i ≤ m, 1 ≤ j ≤ n} such that bij = 1 if lij > l; else bij = −1. Thus, thealue of each element bij in Bl is assigned either 1 or −1 dependingn the gray value lij of the corresponding pixel and the value of l. Let
uting 23 (2014) 122–127 123
C = {cij, 1 ≤ i ≤ m, 1 ≤ j ≤ n} be another matrix such that cij = 1, ∀ (i, j).Then energy value El of the image I at gray value l is defined as:
El = −m∑
i=1
n∑j=1
∑pq∈N2
ij
bij.bpq +m∑
i=1
n∑j=1
∑pq∈N2
ij
cij.cpq (1)
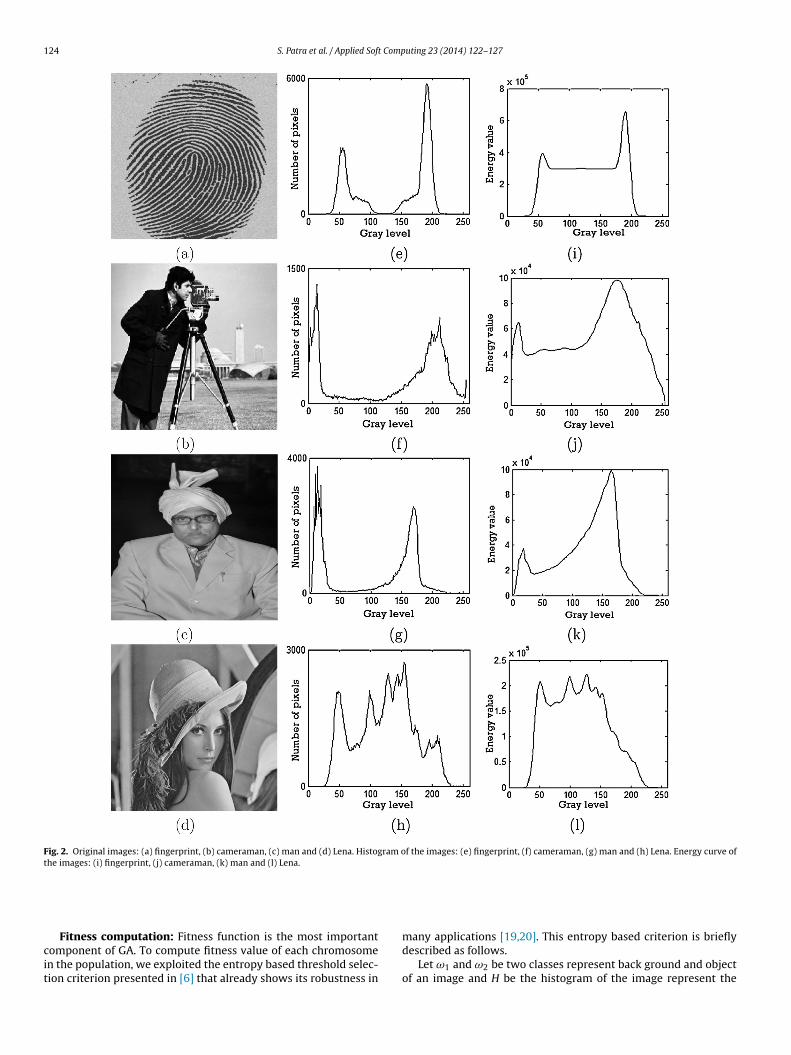
The second term of the expression written on the right side of(1) is a constant term and ensures the energy value El ≥ 0. From(1), one can see that for an image I, the energy value at gray levell will be zero when all the elements of the generated matrix Bl areeither 1 or −1 i.e., all the pixels of the image I has gray values eithergreater than l or less than l. Otherwise, the energy will be positive asshown in Fig. 2(i)–(l). The proposed approach computes the energyassociated with each gray value of the image to generate the energycurve by taking into account the spatial contextual information ofthe image.
Characteristics of the energy curve
The energy curve obtained in (1) has some interesting character-istics. Let the gray values of the pixels in the range [t1, t2] representan object in the image. For l = t1, the elements in matrix Bl corre-sponding to the pixels in the object will be 1. If we increase the valueof l, few elements in Bl matrix will change from 1 to −1, as a resultenergy will increase. The energy increases up to certain value of land then decreases as the neighbor entries in Bl also change from 1to −1. For l = t2, all the entries in Bl correspond to the pixels in theobject will be −1. Thus, a bell shape energy curve will be generatedin the range [t1, t2].
Fig. 2 shows the different images, their corresponding his-tograms and energy curves. From this figure one can see that likehistogram, the energy curve also contain valleys and peaks to rep-resent different objects of the image. Each mode of the energy curvecorrespond to a region of the image that represent similar objects.There exists a valley between any two adjacent modes. Thus, ourproposed energy curve behaves like a histogram of an image wherewe need to find out thresholds passing through the valley regions ofthe energy curve for segmenting the image. Since the energy curveis generated taking into an account spatial contextual informationof the image, it is more smooth and clearly discriminate differentobjects in the image as compared to the histogram. Thus, becomesmore effective to detect appropriate thresholds.
Multiple thresholds selection using genetic algorithm
Once energy curve of an image is obtained, any existinghistogram-based thresholding technique [2–6,10] can be appliedfor detecting optimal threshold. Most of the existing histogram-based thresholding techniques are effective for detecting singlethreshold. For multilevel thresholding, their computational com-plexity increases exponentially and also complicated to implement.To overcome this problem, in this work we exploited GA. The basicsteps of GA, also followed in the thresholds selection, are nowdescribed in detail.
Chromosome representation: Each chromosome is a sequenceof binary numbers representing the k thresholds. If s bits are usedto represent a threshold value then the length of a chromosome isk × s bits, with the first s bits (or, genes) are used to represent thefirst threshold, the next s bits represent the second threshold, and
somes. The total number of chromosomes belong to a populationis called the size of the population. The threshold values in eachchromosome are initialized randomly.
124 S. Patra et al. / Applied Soft Computing 23 (2014) 122–127
Fig. 2. Original images: (a) fingerprint, (b) cameraman, (c) man and (d) Lena. Histogram of the images: (e) fingerprint, (f) cameraman, (g) man and (h) Lena. Energy curve ofthe images: (i) fingerprint, (j) cameraman, (k) man and (l) Lena.
cit
Fitness computation: Fitness function is the most importantomponent of GA. To compute fitness value of each chromosomen the population, we exploited the entropy based threshold selec-ion criterion presented in [6] that already shows its robustness in
many applications [19,20]. This entropy based criterion is brieflydescribed as follows.
Let ω1 and ω2 be two classes represent back ground and objectof an image and H be the histogram of the image represent the
Comp
ptr
whphatItfo
e.
E
E
itfi
mrb
ecg
pi
pm
pivh
S. Patra et al. / Applied Soft
robability of occurrence of gray level l as pl. Assuming a threshold, the entropies of classes ω1 and ω2 (donated as ENω1 and ENω2 ,espectively) are computed as follows:
ENω1 = −t∑
l=0
pl
Pω1
log2
(pl
Pω1
)
ENω2 = −L−1∑
l=t+1
pl
Pω2
log2
(pl
Pω2
),
(2)
here Pω1 =∑t
l=0pl and Pω2 = 1 − Pω1 . To select a threshold on theistogram that properly discriminate the back ground and objectixels in an image (i.e., passes through the valley region of theistogram), the entropies of classes ω1 and ω2 are computed byssuming all possible values of the threshold t. Then, the optimalhreshold is selected by maximizing the total entropy ENω1 + ENω2 .f the image contains multiple objects with different gray valueshen we need to find out multiple thresholds to separate one objectrom other. Here we extended this criterion for multilevel thresh-lding as follows.
Let ω1, ω2, . . ., ωk are the k objects of an image separated fromach other by defining thresholds t1, t2, . . ., tk−1, where t1 < t2 < t3,
. ., < tk−1. The entropy of jth object is computed as:
Nωj=
⎧⎪⎪⎪⎪⎪⎪⎪⎪⎪⎪⎪⎪⎨⎪⎪⎪⎪⎪⎪⎪⎪⎪⎪⎪⎪⎩
−tj∑
l=0
pl
Pωj
log2pl
Pωj
, if j = 1
−tj∑
l=tj−1+1
pl
Pωj
log2pl
Pωj
, if 1 < j < k
−L−1∑
l=tj+1
pl
Pωj
log2pl
Pωj
, if j = k
Then the total entropy will be:
N =k∑
j=1
ENωj(3)
In the proposed method we used energy function defined in (1)n place of histogram to compute the probability pl at l. Then thehresholds represented by a chromosome are used to compute itstness value using (3).
Selection: The selection process select chromosomes from theating pool directed by the survival of the fittest concept of natu-
al genetic systems. The selection strategy ’stochastic uniform’ haseen adopted here.
Crossover: Crossover exchanges information between two par-nt chromosomes for generating two child chromosomes. Thehromosomes of length k × s, the crossover points are randomlyenerated in the range [1, k × s − 1].
Mutation: Each chromosome undergoes mutation with a fixedrobability. Chromosomes in the population, a bit position (or gene)
s mutated by simply flipping its value.Termination criterion: The processes of fitness value com-
utation, selection, crossover, and mutation are executed for aaximum number of iterations.
After termination criterion is satisfied, the chromosome in theopulation that has maximum fitness value is considered for select-ng the optimal thresholds. Then depending on these thresholdalues the image is segmented for discriminating the differentomogeneous regions of the image.
uting 23 (2014) 122–127 125
Experimental results
Experimental study presented here provides an evidence ofthe effectiveness of the proposed technique. Below we reporteda details description of the experimental setup and then analyzedthe results.
Description of the experiments
In order to asses the effectiveness of the proposed method,the results of this method are compared with those obtained byusing histogram of the image (we may refer this as histogram-based technique) and also an existing GA-based context sensitive(GACS) technique [16]. The GA-based technique presented in [16]is a clustering technique. To adopt this technique for solving imagesegmentation problem, first the input patterns are generated cor-responding to each pixel of the image. The generated input patternsincluded neighboring pixels information in order to take contextualinformation of the image. In this experiment 1st order neighbor-hood is considered. The input vectors contain two components,the gray value of the pixel and the average gray value of its fourneighboring pixels. After generating the input patterns, the GACStechnique presented in [16] is used to find out the cluster repre-sentatives for segmenting the image.
For all the considered images, the population size of GA is takenas twenty and stochastic selection strategy is used to select fittestchromosomes from the matting pool. The crossover and mutationprobability is set as 0.8 and 0.01, respectively, and number of iter-ations set as terminating criterion of GA is taken as 1000. All theseparameters of GA are set manually by varying their values in a widerange, where results are not changed significantly.
In order to evaluate the segmented results obtained by differentapproaches, a validity measure called Davies Bouldin (DB) index isused. It is a function of the ratio of the sum of within-object scatterto between-object separation. Let ω1, ω2, . . ., ωk be the k objectsdefined by thresholds t1 < t2 < t3, . . ., < tk−1. Then the DB index isdefined as:
Rij =�2
i+ �2
j
d2ij
Ri = maxj=1,...,k.,i /= j
{Rij}
DB = 1k
k∑i=1
Ri,
(4)
where �2i
and �2j
are the variances of object ωi and ωj, respectively,
and d2ij
is the distance of object centers ωi and ωj. Because a lowscatter/variance and a high distance between objects lead to smallvalues of Rij, as a result small value of DB correspond to objectsthat are compact and have centers far away from each other. So thesmaller the DB value, the better the segmentation is. All the algo-rithms presented in this paper have been implemented in Matlab(R2012b).
Analysis of results
In the present experiment four different images: the fingerprint,the cameraman, the man and the Lena are used for the experi-mental validation. Fig. 2 shows the original images, correspondinghistograms and energy curves. From these figures one can see that
the behavior of the energy curve is similar to the histogram of theimage (explained in Section “Characteristics of the energy curve”).Moreover, the generated energy curve is much smoother than thehistogram of an image. This may help us to select better thresholdsby considering energy curve of the image instead of histogram.
126 S. Patra et al. / Applied Soft Computing 23 (2014) 122–127
Table 1Quantitative results obtained by using proposed energy-based, histogram-based and GACS techniques. Smaller DB values indicate better performance
Image Energy Histogram GACS
Selected thresholds DB Selected thresholds DB Cluster representatives DB
Fingerprint 124 .029 154 .057 {(64.1, 93.3),(186.8,168.2)} .06297, 151 .164 87, 168 .266 {(62.0,90.9),(157.5,158.2),(191.8,169.8)} .60683, 122, 162 .111 107, 141, 178 .154 {(60.4,90.1),(94.6,139.7),(180.5,158.9),(194.1,192.8)} .357
Cameraman 125 .049 167 .154 {(21.2, 24.7),(196.2,193.9)} .04880, 160 .148 47, 141 .142 {(16.8, 21.0),(157.9,157.6),(211.9,208.2)} .22762, 128, 190 .171 37, 126, 180 .183 {(10.9, 10.7),(77.2,88.2),(171.6,161.3),(206.4,205.0)} .252
Man 101 .033 138 .105 {(21.7, 40.2),(161.9, 147.3)} .06971, 132 .121 33, 113 .164 {(19.1,38.9),(169.2,105.3),(161.1,161.2)} .39967, 124, 181 .159 38, 121, 183 .179 {(14.1,65.1),(18.5,18.1),(140.8,105.6),(166.8,161.7)} .332
etbtohtfpto1
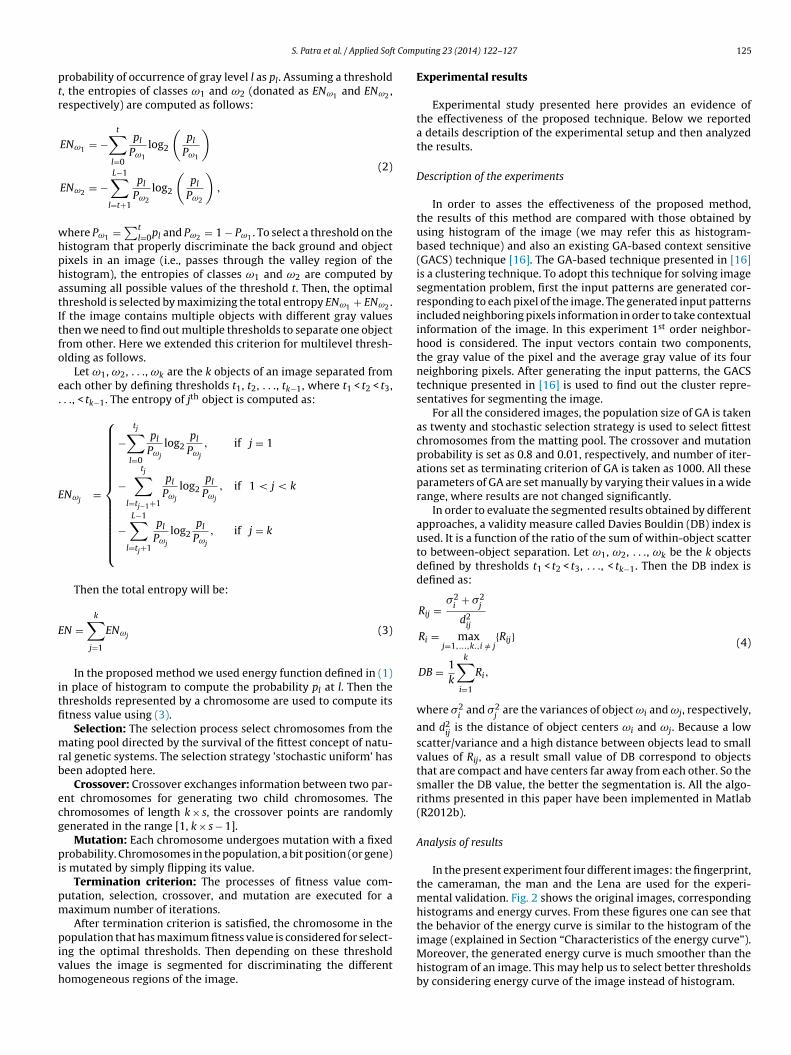
FG
Lena 131 .239 123
99,164 .181 97, 164
83, 131, 178 .160 91, 129, 178
Table 1 reported the quantitative results obtained by usingnergy-based, histogram-based and GACS techniques. From theable one can see that except the Lena image, the DB values obtainedy the proposed energy-based method are always better or similaro the DB values obtained by the histogram-based and GACS meth-ds. Moreover by analyzing the results reported in Table 1 and theistogram of the images shown in Fig. 2(e)–(h), one can concludehat for bi-level thresholding/segmentation, except the Lena image,
or all the other images the proposed energy-based method out-erformed than both the existing methods. For example considerhe results of the fingerprint image shown in Table 1. The thresh-ld selected by the proposed and the histogram-based method is24 and 154, respectively. From Fig. 2(e) one can see that 124 is aig. 3. Bi-level segmented images obtained for fingerprint, cameraman, man and Lena imaACS methods.
.219 {(73.8, 74.1),(155.7,154.9)} .202
.181 {(62.9,63.6),(130.7,129.9),(186.4,185.4)} .194
.164 {(56.7,57.3),(98.9,98.9),(146.2,145.5),(203.7,201.9)} .165
better threshold than 154 to segment the fingerprint image. This isalso confirmed by obtaining smaller DB value 0.029 associated withthe threshold value 124 compared to the DB value 0.057 associatedwith the threshold value 154. The GACS method selected two clus-ter representatives (64.1,93.3) and (186.8,168.2) for segmentingthe fingerprint image and obtained 0.062 DB value which is largerthan the DB value produced by the proposed technique (i.e., 0.029).Since the histogram of the Lena image is multimodal, (see Fig. 2(h))
the proposed technique failed to produce better result for bi-levelthresholding. When the number of segments increased it producedbetter results compared to the other two existing techniques. Fora visual qualitative analysis, Fig. 3 shows the bi-level segmentedresults obtained on the fingerprint, the cameraman, the man andges by applying (a)–(d) proposed energy-based, (e)–(h) histogram-based and (i)–(l)
Comp
tGt
D
uoImfvothuitG
wutoe
R
[
[
[
[
[
[
[
[
[
networks, IEEE Trans. Geosci. Remote Sens. 45 (3) (2007) 778–789.
S. Patra et al. / Applied Soft
he Lena images by applying energy-based, histogram-based andACS techniques. From these segmented images one can see that
he proposed technique always produced satisfactory results.
iscussion and conclusion
Histogram-based traditional thresholding techniques arenable to consider spatial contextual information for selecting theptimum threshold and are effective only for bi-level thresholding.n this article a novel thresholding technique is presented that
itigate both these limitations. First, we proposed an energyunction to compute the energy value of the image at each grayalue by taking into an account the spatial contextual informationf the image. This energy value is computed in such a way thathe characteristic of the energy curve becomes similar to theistogram of the image. Thus, by using the energy curve instead ofsing histogram, we incorporated spatial contextual information
n threshold selection process. Second, to mitigate multilevelhresholding problem, GA is exploited. The fitness function of theA is modeled by extending the criterion proposed in [6].
To empirically assess the effectiveness of the proposed method,e compared it with two other methods exist in the literature bysing four different images. In this comparison, we observed thathe proposed method provided better results as compared to thether techniques. As a future developments of this work, we plan toxtend it for finding optimal number of thresholds automatically.
eferences
[1] M. Sezgin, B. Sankur, Survey over image thresholding techniques and quanti-tative performance evaluation, J. Electron. Imaging 13 (1) (2004) 146–165.
[2] N. Otsu, A threshold selection method from gray level histograms, IEEE Trans.Syst. Man Cybernet. 9 (1979) 62–66.
[
[
uting 23 (2014) 122–127 127
[3] J. Kittler, J. Illingworth, Minimum error thresholding, Pattern Recogn. 19 (1)(1986) 41–47.
[4] S. Cho, R. Haralick, S. Yi, Improvement of Kittler and Illingworth, minimum errorthresholding, Pattern Recogn. 22 (5) (1989) 609–617.
[5] T. Pun, A new method gray-level picture thresholding using the entropy of thehistogram, Signal Process. 2 (1980) 223–237.
[6] J.N. Kapur, P.K. Sahoo, A.K.C. Wong, A new method for gray-level picture thresh-olding using the entropy of the histogram, Comput. Vision Graphics ImageProcess. 29 (3) (1985) 273–285.
[7] S.H. Kwon, Threshold selection based on cluster analysis, Pattern Recogn. Lett.25 (2004) 1045–1050.
[8] Y. Qiaoa, Q. Hua, G. Qiana, S. Luob, W.L. Nowinskia, Thresholding based onvariance and intensity contrast, Pattern Recogn. 40 (2007) 596–608.
[9] L.K. Huang, M.J.J. Wang, Image thresholding by minimizing the measures offuzziness, Pattern Recogn. 28 (1995) 41–51.
10] D. Liu, Z. Jiang, H. Feng, A novel fuzzy classification entropy approach to imagethresholding, Pattern Recogn. Lett. 27 (2006) 1968–1975.
11] S.K. Pal, D. Dutta Majumder, Fuzzy Mathematical Approach to Pattern Recog-nition, John Wiley, Halsted Press, New York, 1986.
12] C.C. Chang, L.L. Wang, A fast multilevel thresholding method based on lowpassand highpass filter, Pattern Recogn. Lett. 18 (1997) 1469–1478.
13] L.K. Huang, M.J.J. Wang, Thresholding technique with adaptive windowselection for uneven lighting image, Pattern Recogn. Lett. 26 (2005)801–808.
14] H.D. Cheng, X.H. Jiang, J. Wang, Color image segmentation based on homogramthresholding and region merging, Pattern Recogn. 35 (2002) 373–393.
15] D.E. Goldberg, Genetic Algorithms in Search, Optimization and Machine Learn-ing, Addison-Wesley, New York, 1989.
16] U. Maulik, S. Bandyopadhyay, Genetic algorithm-based clustering technique,Pattern Recogn. 33 (2000) 1455–1965.
17] Y. Liang, K.-S. Leung, Genetic algorithm with adaptive elitist-population strate-gies for multimodal function optimization, Appl. Soft Comput. 11 (2) (2011)2017–2034.
18] S. Ghosh, L. Bruzzone, S. Patra, F. Bovolo, A. Ghosh, A context-sensitivetechnique for unsupervised change detection based on Hopfield-type neural
19] P.L. Rosin, E. Ioannidis, Evaluation of global image thresholding for changedetection, Pattern Recogn. Lett. 24 (2003) 2345–2356.
20] S. Patra, S. Ghosh, A. Ghosh, Histogram thresholding for unsupervised changedetection of remote sensing images, Int. J. Remote Sens. 32 (21) (2011)6071–6089.