applying laboratory thermal desorption data in an ...sro.sussex.ac.uk/48681/1/mnras-b.pdf ·...
TRANSCRIPT
Applying laboratory thermal desorption data in an interstellar context: sublimation of methanol thin films
Article (Published Version)
http://sro.sussex.ac.uk
Green, Simon D, Bolina, Amandeep S, Chen, Rui, Collings, Mark P, Brown, Wendy A and McCoustra, Martin R S (2009) Applying laboratory thermal desorption data in an interstellar context: sublimation of methanol thin films. Monthly Notices of the Royal Astronomical Society, 398 (1). 357 - 367. ISSN 0035-8711
This version is available from Sussex Research Online: http://sro.sussex.ac.uk/48681/
This document is made available in accordance with publisher policies and may differ from the published version or from the version of record. If you wish to cite this item you are advised to consult the publisher’s version. Please see the URL above for details on accessing the published version.
Copyright and reuse: Sussex Research Online is a digital repository of the research output of the University.
Copyright and all moral rights to the version of the paper presented here belong to the individual author(s) and/or other copyright owners. To the extent reasonable and practicable, the material made available in SRO has been checked for eligibility before being made available.
Copies of full text items generally can be reproduced, displayed or performed and given to third parties in any format or medium for personal research or study, educational, or not-for-profit purposes without prior permission or charge, provided that the authors, title and full bibliographic details are credited, a hyperlink and/or URL is given for the original metadata page and the content is not changed in any way.
Mon. Not. R. Astron. Soc. 398, 357–367 (2009) doi:10.1111/j.1365-2966.2009.15144.x
Applying laboratory thermal desorption data in an interstellar context:
sublimation of methanol thin films⋆
Simon D. Green,1 Amandeep S. Bolina,2 Rui Chen,3 Mark P. Collings,1†Wendy A. Brown2 and Martin R. S. McCoustra1
1School of Engineering and Physical Sciences, Heriot-Watt University, Edinburgh EH14 4AS2Department of Chemistry, University College London, 20 Gordon Street, London WC1H 0AJ3Address at time of contribution to this work: School of Chemistry, University of Nottingham, University Park, Nottingham NG7 2RD
Accepted 2009 May 26. Received 2009 April 23; in original form 2008 December 2
ABSTRACT
Methods by which experimental measurements of thermal desorption can be applied in astro-physical environments have been developed, using the sublimation of solid methanol as anexample. The temperature programmed desorption of methanol from graphitic, amorphous sil-ica and polycrystalline gold substrates was compared, with the kinetic parameters of desorptionextracted by either a leading edge analysis or by fitting using a stochastic integration method.At low coverages, the desorption shows a substrate-dependent fractional order. However, athigher coverages methanol desorption is zeroth order with kinetic parameters independentof substrate. Using a kinetic model based on the stochastic integration analyses, desorptionunder astrophysically relevant conditions can be simulated. We find that the chemical andmorphological nature of the substrate has relatively little impact on the desorption tempera-ture of solid methanol, and that the substrate independent zeroth-order kinetics can provide asatisfactory model for desorption in astrophysical environments. Uncertainties in the heatingrate and the distribution of grain sizes will have the largest influence on the range of desorptiontemperature. These conclusions are likely to be generally applicable to all species in dust grainice mantles.
Key words: astrochemistry – molecular data – molecular processes – methods: laboratory –ISM: molecules.
1 IN T RO D U C T I O N
Thermal desorption is one of several mechanisms by whichmolecules that have been frozen out on the surface of an interstellardust grain, or reactively formed within the accreted ice mantle, canbe returned to the gas phase (Roberts et al. 2007). In regions ofstar formation, where dust grains are close enough to a protostar tobe warmed, this thermal mechanism may dominate the desorptionof ice mantles (Markwick et al. 2002). Viti and co-workers (Viti &Williams 1999; Viti et al. 2004) have demonstrated that although thetime taken for the pre-stellar core to warm from its initial tempera-ture to beyond that at which the ice mantles have completely sub-limed is relatively short on astrophysical time scales, the desorptioncannot be treated as instantaneous within astrochemical models.Therefore, inclusion of thermal desorption processes in chemicalmodels of such regions is necessary if we are to elucidate the rolesplayed by molecules in the physics and chemistry of star formation.
⋆In memory of Rui Chen.†E-mail: [email protected]
The difficulties in combining grain surface processes with gas phasechemical models are well known (Herbst & Shematovich 2003), andtherefore simplifications and assumptions must inevitably be made.However, the validity of these assumptions can only be assured bydeveloping a thorough understanding of the physicochemical pro-cesses occurring in the grain mantle. Such an understanding can beobtained through laboratory experimentation.
Because of its relative simplicity as a technique, temperature pro-grammed desorption (TPD) has always been a mainstay of the fieldof surface science (King 1975). TPD studies of astrophysicallyrelevant systems have been published in the surface science andchemical physics literature for many years. More recently, thermaldesorption studies by numerous research groups that specifically ad-dress astrophysical questions have also appeared in the astrophysicsliterature (for example Acharyya et al. 2007; Galvez et al. 2007).No laboratory experiment can exactly reproduce the conditions ofthermal desorption from an interstellar dust grain, particularly withregard to the rate of heating. Other parameters, such as the depo-sition temperature, and the chemical composition and morphologyof the dust grain mimic may also vary between experiments. Var-ious research groups have performed experiments using differing
C© 2009 The Authors. Journal compilation C© 2009 RAS
at University of Sussex on July 21, 2014
http://mnras.oxfordjournals.org/
Dow
nloaded from
358 S. D. Green et al.
techniques under differing conditions, producing a range of, and attimes contradictory, results. In this paper, we have examined someof the issues regarding the application of laboratory thermal desorp-tion experiments to astrophysical environments using new data, andsome previously published results (Bolina, Wolff & Brown 2005,hereafter BWB05), for the desorption of solid methanol (CH3OH).
Methanol is observed as a common component of molecular icesalong many lines of sight towards molecularly rich regions (for ex-ample Dartois et al. 1999; Pontoppidan et al. 2003; Pontoppidan,van Dishoeck & Dartois 2004). Typically characterized observa-tionally by its 3.53 µm (CH3 symmetric stretch) band, methanol ishypothesized to be formed in grain mantles via the hydrogenationof carbon monoxide on grain surfaces (Tielens & Whittet 1997;Watanabe & Kouchi 2008). Consequently, methanol, after waterand carbon monoxide, is commonly the next most abundant com-ponent of molecular ices. Indeed in some lines of sight, observa-tions suggest that methanol may have an abundance of up to 0.25relative to water (Pontoppidan et al. 2004). Although methanol isnot likely to exist as a pure solid in astrophysical environments,understanding its behaviour is an essential step towards predict-ing the behaviour of icy mantles. Several experimental studies ofthe thermal desorption of solid methanol in an astrophysical con-text have been published (Sandford & Allamandola 1993; Collingset al. 2004; BWB05). Furthermore, desorption from codepositedmixtures and layered deposits of water and methanol (Collingset al. 2004; Brown et al. 2006; Wolff, Carlstedt & Brown 2007;Bahr, Toubin & Kempter 2008) and carbon dioxide and methanol(Mate et al. 2009) have also been studied. Since methanol is alsoan industrially important species and can be condensed at temper-atures attainable with conventional liquid nitrogen cooling, thereare numerous examples where its desorption from multilayers de-posited on single crystal metal and metal oxide surfaces appear inthe surface science literature (Sexton 1981; Christmann & Demuth1982, Rendulic & Sexton 1982; Sexton, Rendulic & Hughes 1982,Hrbek, dePaola & Hoffmann 1984; Sexton & Hughes 1984, Attardet al. 1989; Peremans et al. 1990, 1994; Zhang & Gellman 1991;Wu, Truong & Goodman 1993; Harris et al. 1995; Jenniskens et al.1996; Nishimura, Gibbons & Tro 1998; Gunster et al. 2000; Pratt,Escott & King 2003). Here, we have combined the work of twoindependent research groups, studying TPD of solid methanol fromgraphitic, silica and gold surfaces in three separate experimental ap-paratus, with varied deposition temperatures and heating rates. Wecompare the analysis of TPD data by direct leading edge analysiswith fitting using a stochastic integration package.
2 EX P ERIM ENTA L
Experiments were performed in three separate ultrahigh vacuum(UHV) chambers at either Heriot-Watt University (HWU) or Uni-versity College London (UCL). Methanol (Fischer, research grade– HWU or BDH, 99.9 per cent – UCL) was subjected to multiplefreeze-pump-thaw cycles to remove impurities prior to use.
Chamber 1, which was located at UCL, has been described indetail elsewhere (Bolina 2005; BWB05). This is a turbomolecularand ionization pumped UHV chamber with a base pressure of 2 ×
10−10 mbar. The highly oriented pyrolitic graphite (HOPG) samplewas mounted on a liquid nitrogen cold finger, which allowed coolingto a temperature of 89 K. Methanol was deposited by backfilling thechamber to pressures of up to 1 × 10⁻⁷ mbar. The sample was heatedresistively by W-Re wires. The temperature was measured by anN-type (Nicrosil-Nisil) thermocouple wedged between the sample
and the mounting plates. TPD was performed with a linear heatingramp of 0.5 K s−1.
Chamber 2, which was located at HWU, has also been describedin detail elsewhere (Fraser, Collings & McCoustra 2002), althoughsome changes have recently been made. It remains a diffusionpumped UHV chamber with a base pressure of 1 × 10⁻¹⁰ mbar.The sample was an oxygen free high conductivity copper block,which was coated by films of either polycrystalline gold or amor-phous silica. This sample was mounted on a cold finger which wascooled by a closed cycle helium cryostat, and during the experi-ments reported here reached a base temperature of 18 K. Methanolwas deposited from an effusive doser directed at the sample surfacefrom a distance of roughly 40 mm. Deposition was measured bya pre-calibrated quartz crystal microbalance (QCM). The samplewas heated by a cartridge heater inserted into a cavity in the sampleblock. TPD was performed with variable heating rates, with temper-ature measured by a KP-type (Au-Chromel) thermocouple wedgedunder mounting screws at the corner of the sample. With the goldsubstrate, the liquid nitrogen cooled line-of-sight mass spectrome-ter was mounted in its original angled configuration (Fraser et al.2002). With the silica substrate, it was mounted in a horizontalconfiguration, with slightly improved sensitivity.
Chamber 3, which was located at HWU, has been described indetail elsewhere (Oakes 1994; Thrower et al. 2009). It is a diffusionpumped UHV chamber with a base pressure of 2 × 10⁻¹⁰ mbar.The silica coated stainless steel substrate was mounted on a liquidnitrogen cooled cold finger, which allowed cooling to a temperatureof 118 K. Methanol was deposited by backfilling the chamber topressures of up to 5 × 10⁻⁷ mbar. Deposition was calculated bysimple collision theory (Woodruff & Delcher 1994), assuming asticking probability of unity. The sample was heated resistivelyby tantalum wires. The temperature was measured by a K-type(Chromel-Alumel) thermocouple spot welded to the side of thesubstrate. TPD was performed at a constant heating rate of 0.1 K s−1.
Silica (SiO2) was deposited onto sample substrates in a separatehigh vacuum chamber at HWU, by electron beam evaporation ofthe bulk material. A film thickness of roughly 200 nm was measuredby a QCM close to the sample during the deposition. The substrateswere at room temperature during the deposition, and the resultingfilm has an amorphous and porous morphology, which has beencharacterized by atomic force microscopy (Thrower et al. 2009).
The unit cell of the α-crystalline phase of methanol at 113 K,which contains two methanol molecules, has dimensions of4.53 × 4.69 × 4.91 Å (Sandford & Allamandola 1993). Fromthese dimensions, values of 1.91 × 10²² molecules cm−3 and7.16 × 1014 molecules cm−2 can be estimated for the bulk den-sity, ρb, and surface density, ρs, respectively. Coverage is quotedin units of equivalent monolayers (MLeq) where 1 MLeq = ρs. Es-timates of the thickness of the methanol layer are also made usingthese values, assuming a non-porous crystalline structure.
3 R ESULTS AND DI SCUSSI ON
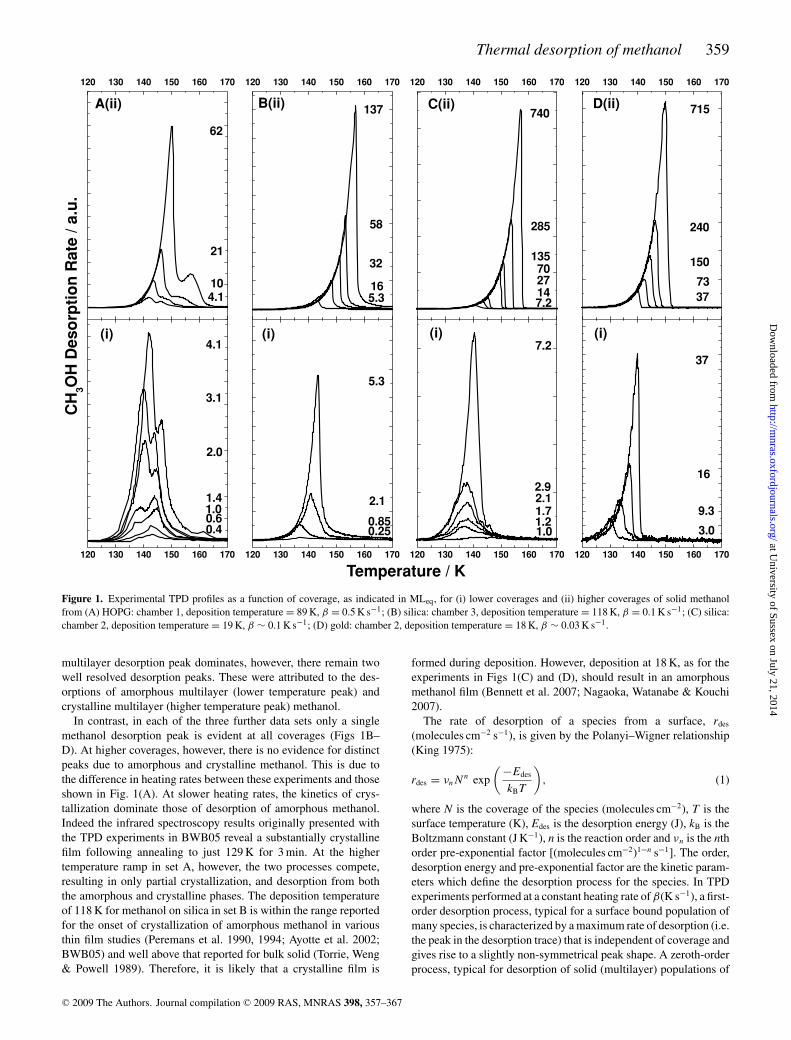
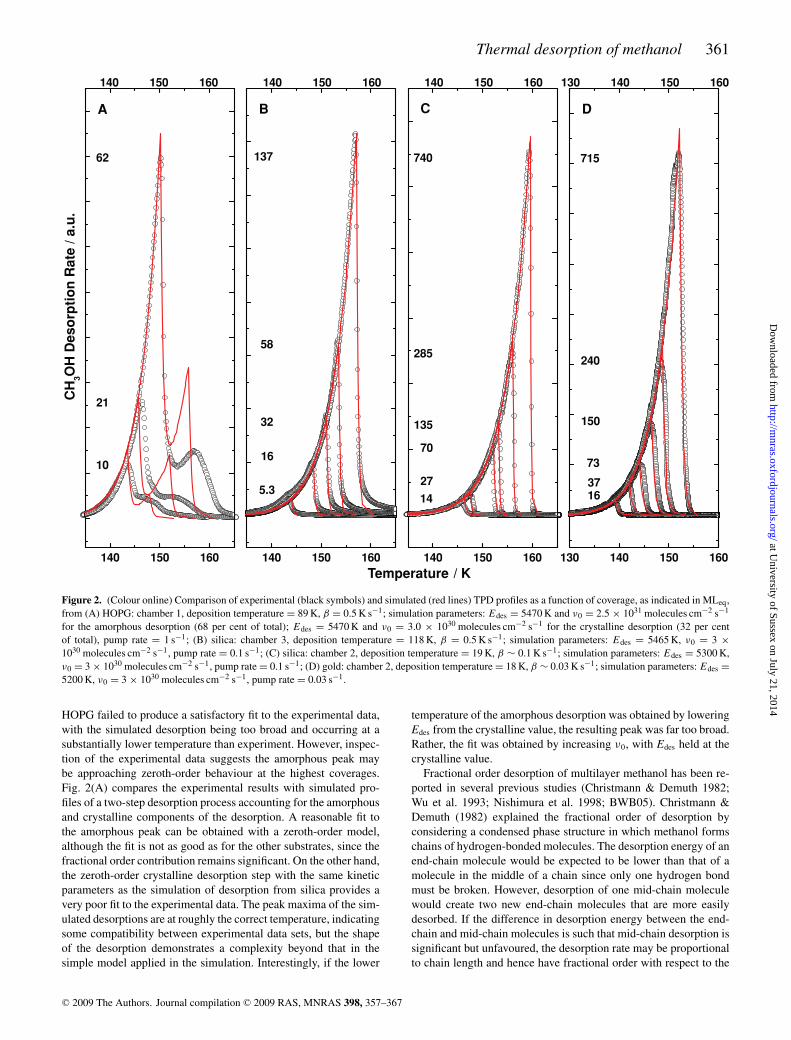
Four sets of TPD traces for methanol desorption under varyingconditions are shown in Fig. 1. Even a brief inspection of the foursets reveals that there are significant differences in behaviour.
Two peaks are evident for desorption of methanol from HOPGat lower coverages (Fig. 1A i). In the previous analysis of thisdata (BWB05), these peaks were attributed to interfacial (highertemperature peak) and amorphous multilayer (lower temperaturepeak) methanol desorptions. At higher coverages (Fig. 1A ii) the
C© 2009 The Authors. Journal compilation C© 2009 RAS, MNRAS 398, 357–367
at University of Sussex on July 21, 2014
http://mnras.oxfordjournals.org/
Dow
nloaded from
Thermal desorption of methanol 359
120 130 140 150 160 170
120 130 140 150 160 170 120 130 140 150 160 170
120 130 140 150 160 170
120 130 140 150 160 170
120 130 140 150 160 170
120 130 140 150 160 170
120 130 140 150 160 170
(i)
0.60.4
1.01.4
2.0
3.1
4.1
CH
3O
H D
eso
rpti
on
Rate
/ a
.u.
A(ii)
(i)
4.110
21
62
B(ii)
5.316
32
58
137
0.850.25
2.1
5.3
Temperature / K
C(ii)
7.2142770
135
285
740
(i)
1.01.21.72.12.9
7.2
D(ii)
37
73
150
240
715
(i)
3.0
9.3
16
37
Figure 1. Experimental TPD profiles as a function of coverage, as indicated in MLeq, for (i) lower coverages and (ii) higher coverages of solid methanolfrom (A) HOPG: chamber 1, deposition temperature = 89 K, β = 0.5 K s−1; (B) silica: chamber 3, deposition temperature = 118 K, β = 0.1 K s−1; (C) silica:chamber 2, deposition temperature = 19 K, β ∼ 0.1 K s−1; (D) gold: chamber 2, deposition temperature = 18 K, β ∼ 0.03 K s−1.
multilayer desorption peak dominates, however, there remain twowell resolved desorption peaks. These were attributed to the des-orptions of amorphous multilayer (lower temperature peak) andcrystalline multilayer (higher temperature peak) methanol.
In contrast, in each of the three further data sets only a singlemethanol desorption peak is evident at all coverages (Figs 1B–D). At higher coverages, however, there is no evidence for distinctpeaks due to amorphous and crystalline methanol. This is due tothe difference in heating rates between these experiments and thoseshown in Fig. 1(A). At slower heating rates, the kinetics of crys-tallization dominate those of desorption of amorphous methanol.Indeed the infrared spectroscopy results originally presented withthe TPD experiments in BWB05 reveal a substantially crystallinefilm following annealing to just 129 K for 3 min. At the highertemperature ramp in set A, however, the two processes compete,resulting in only partial crystallization, and desorption from boththe amorphous and crystalline phases. The deposition temperatureof 118 K for methanol on silica in set B is within the range reportedfor the onset of crystallization of amorphous methanol in variousthin film studies (Peremans et al. 1990, 1994; Ayotte et al. 2002;BWB05) and well above that reported for bulk solid (Torrie, Weng& Powell 1989). Therefore, it is likely that a crystalline film is
formed during deposition. However, deposition at 18 K, as for theexperiments in Figs 1(C) and (D), should result in an amorphousmethanol film (Bennett et al. 2007; Nagaoka, Watanabe & Kouchi2007).
The rate of desorption of a species from a surface, rdes
(molecules cm−2 s−1), is given by the Polanyi–Wigner relationship(King 1975):
rdes = νnNn exp
(
−Edes
kBT
)
, (1)
where N is the coverage of the species (molecules cm−2), T is thesurface temperature (K), Edes is the desorption energy (J), kB is theBoltzmann constant (J K−1), n is the reaction order and νn is the nthorder pre-exponential factor [(molecules cm−2)1−n s−1]. The order,desorption energy and pre-exponential factor are the kinetic param-eters which define the desorption process for the species. In TPDexperiments performed at a constant heating rate of β(K s−1), a first-order desorption process, typical for a surface bound population ofmany species, is characterized by a maximum rate of desorption (i.e.the peak in the desorption trace) that is independent of coverage andgives rise to a slightly non-symmetrical peak shape. A zeroth-orderprocess, typical for desorption of solid (multilayer) populations of
C© 2009 The Authors. Journal compilation C© 2009 RAS, MNRAS 398, 357–367
at University of Sussex on July 21, 2014
http://mnras.oxfordjournals.org/
Dow
nloaded from
360 S. D. Green et al.
most species, is characterized by a highly non-symmetrical peakshape with a maximum that rises in temperature with increasingcoverage. However, a series of TPD traces for different coveragesof a zeroth-order desorption process will have coincident leadingedges. The kinetic parameters can be extracted by analysis of theleading edge (King 1975). The Polanyi–Wigner relationship can berewritten as
ln {rdes} = ln {νnNn} −
Edes
kBT. (2)
Therefore, from a series of TPD experiments with varying initialcoverages, a plot of ln {rdes} versus ln {N} for a fixed value oftemperature, T , is linear with a gradient of n. Furthermore, a plot ofln {rdes} versus 1/T for the leading edge of each desorption traceyields a straight line with a gradient of −Edes/kB, and y-intercept ofn ln {νnN 0}, where N0 is the initial coverage. Therefore, values canbe determined for the desorption energy and, providing n is known,the pre-exponential factor.
Kinetic parameters were previously determined for the interfa-cial and amorphous multilayer desorption peaks of methanol fromHOPG using a leading edge analysis (BWB05). The desorption or-ders were found to be 1.23 ± 0.14 and 0.35 ± 0.21, respectively.Using these values, the desorption energies were both found to varywith coverage, increasing from 4000 to 5800 K (33–48 kJ mol−1) forinterfacial methanol and from 3700 to 4900 K (31–41 kJ mol−1) foramorphous multilayer methanol. Kinetic parameters could not bedetermined for the crystalline multilayer desorption feature sincethe leading edge of the peak is never free from overlap with theamorphous desorption peak. Inspection of the peak shows that itsmaximum increases in temperature from roughly 147 to 157 K asthe coverage increases from 10 to 62 MLeq, which would be con-sistent with a desorption order of close to zero. However, the moresymmetrical shape of the peak is inconsistent with zeroth-order ki-netics, and suggests greater complexity to this desorption step thancan be determined from a simple analysis.
The interaction of methanol with the amorphous silica surfacewill be described in detail in a future publication. Briefly, however,at low coverages there is evidence of pore filling behaviour on therough surface (not shown). This is in agreement with results re-cently obtained for benzene on this surface (Thrower et al. 2009),which indicate that the surface area of the amorphous silica is fourto five times greater than its geometric surface area. For depositionat both 118 and 18 K, the methanol desorption appears to have frac-tional order up to a coverage of roughly 5 MLeq (Figs 1B i and C i).At the higher coverages (Figs 1B ii and C ii) the coincident lead-ing edges of the desorption traces and the shape of the desorptionpeaks are consistent with zeroth-order desorption. However, in thedata set for methanol deposition at 118 K, the desorption profilefor each coverage rises above the common leading edge in the lastfew degrees before the maximum (Fig. 1B i). This behaviour indi-cates that a more weakly adsorbed population of molecules, situatedclose to the substrate, is buried in the methanol film. The desorptionprofiles of higher coverages of methanol from the gold substrate(Fig. 1D ii) also show the common leading edge and shape consis-tent with zeroth-order kinetics. At lower coverages the desorptionprofiles retain the typical zeroth-order shape, but do not have co-incident leading edges, which instead shift to higher temperatureswith increasing coverage (Fig. 1D i).
It is clear that multiple desorption processes are simultaneouslycontributing to the leading edge of the desorption profile in data setB. This causes uncertainty in the interpretation of a ln (rdes) versusln (N ) plot in the leading edge analysis for desorption order. Fur-
thermore, there are small discontinuities in the leading edge due todesorption from the heating wires. Therefore, it is only possible toconclude from such an analysis that the desorption at higher cover-age is more or less consistent with zeroth-order kinetics. However,upon assuming zeroth-order desorption, the values determined forEdes and ν0 with conservative error limits from a plot of ln (rdes)versus 1/T are 5200 ± 240 K (43.0 ± 2.0 kJ mol−1) and 4.75 ×
1029±1 molecules cm−2 s−1, respectively, for methanol deposited athigh initial coverage (>5 MLeq) on silica at 118 K.
A constant heating rate is a requirement for the leading edge anal-ysis. Since the heating rate was not constant throughout each TPDexperiment performed in chamber 2, and varied slightly betweenexperiments, leading edge analyses of the results for methanol de-posited at low temperature on silica and gold (Figs 1C and D) arenot possible. An alternative method of extracting kinetic parame-ters that we have previously applied involves fitting the desorptiontraces with simulations created using a stochastic integration pack-age1 (Fraser et al. 2001; Collings et al. 2003; Thrower et al. 2009).For a simple desorption process, a two-step simulation is created:
Nice ⇒ Ngas, (3)
Ngas ⇒ Npumped, (4)
where the rates of each reaction are given by
−dNice
dt= νnN
nice exp
(
−Edes
kBT
)
, (5)
−dNgas
dt= νpumpedNgas. (6)
This method requires knowledge of the explicit surface coverageN ice (molecules cm−2). Furthermore, a value of the desorption or-der must be assumed, although inspection of the character of thedesorption traces can provide insight into this value. The remainingunknown parameters, νn, Edes and νpump, can be varied iterativelyuntil a good match to experimental results over a range of coveragesis obtained. The position, width and shape of the desorption profilesprovide sufficient parameter space to allow a unique fit to the exper-imental data. The advantages of this method include the ability toanalyse data with non-linear temperature ramps, and the ability tocombine multiple steps to analyse more complex desorption traces.
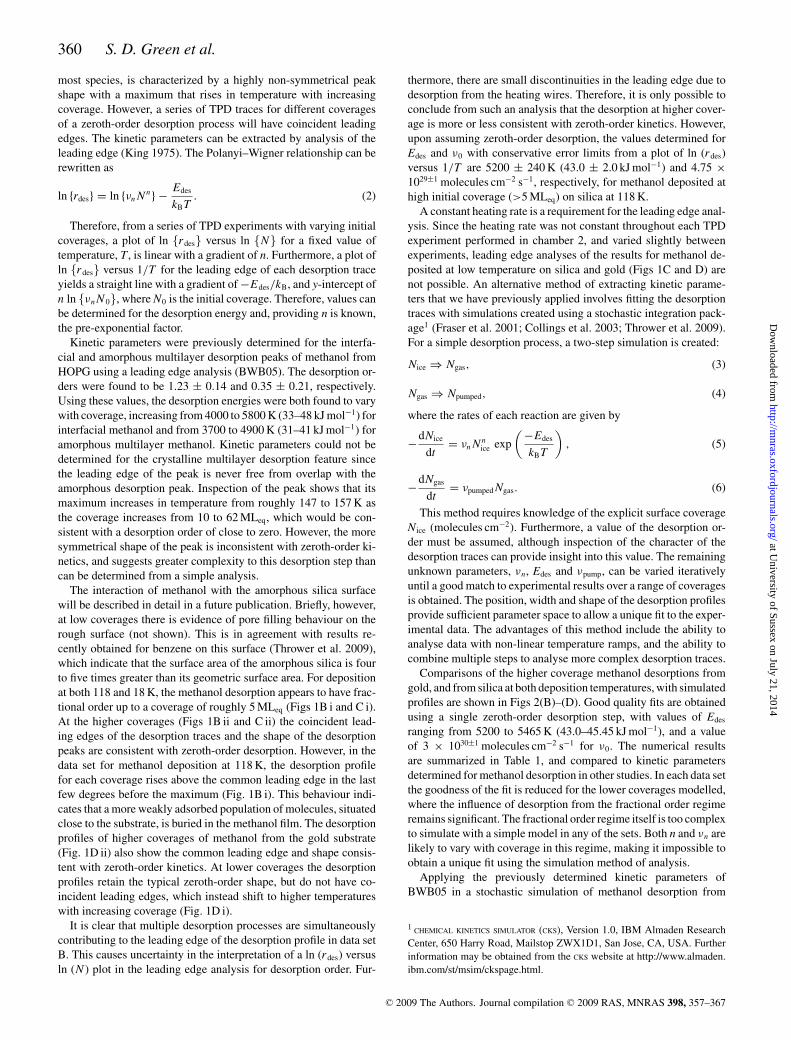
Comparisons of the higher coverage methanol desorptions fromgold, and from silica at both deposition temperatures, with simulatedprofiles are shown in Figs 2(B)–(D). Good quality fits are obtainedusing a single zeroth-order desorption step, with values of Edes
ranging from 5200 to 5465 K (43.0–45.45 kJ mol−1), and a valueof 3 × 1030±1 molecules cm−2 s−1 for ν0. The numerical resultsare summarized in Table 1, and compared to kinetic parametersdetermined for methanol desorption in other studies. In each data setthe goodness of the fit is reduced for the lower coverages modelled,where the influence of desorption from the fractional order regimeremains significant. The fractional order regime itself is too complexto simulate with a simple model in any of the sets. Both n and νn arelikely to vary with coverage in this regime, making it impossible toobtain a unique fit using the simulation method of analysis.
Applying the previously determined kinetic parameters ofBWB05 in a stochastic simulation of methanol desorption from
1 CHEMICAL KINETICS SIMULATOR (CKS), Version 1.0, IBM Almaden ResearchCenter, 650 Harry Road, Mailstop ZWX1D1, San Jose, CA, USA. Furtherinformation may be obtained from the CKS website at http://www.almaden.ibm.com/st/msim/ckspage.html.
C© 2009 The Authors. Journal compilation C© 2009 RAS, MNRAS 398, 357–367
at University of Sussex on July 21, 2014
http://mnras.oxfordjournals.org/
Dow
nloaded from
Thermal desorption of methanol 361
140 150 160
140 150 160
140 150 160
140 150 160
140 150 160
140 150 160
130 140 150 160
130 140 150 160
14
27
70
135
285
740
CA
10
21
62
CH
3O
H D
es
orp
tio
n R
ate
/ a
.u.
5.3
16
32
58
137
B
Temperature / K
1637
73
150
240
D
715
Figure 2. (Colour online) Comparison of experimental (black symbols) and simulated (red lines) TPD profiles as a function of coverage, as indicated in MLeq,from (A) HOPG: chamber 1, deposition temperature = 89 K, β = 0.5 K s−1; simulation parameters: Edes = 5470 K and ν0 = 2.5 × 1031 molecules cm−2 s−1
for the amorphous desorption (68 per cent of total); Edes = 5470 K and ν0 = 3.0 × 1030 molecules cm−2 s−1 for the crystalline desorption (32 per centof total), pump rate = 1 s−1; (B) silica: chamber 3, deposition temperature = 118 K, β = 0.5 K s−1; simulation parameters: Edes = 5465 K, ν0 = 3 ×
1030 molecules cm−2 s−1, pump rate = 0.1 s−1; (C) silica: chamber 2, deposition temperature = 19 K, β ∼ 0.1 K s−1; simulation parameters: Edes = 5300 K,ν0 = 3 × 1030 molecules cm−2 s−1, pump rate = 0.1 s−1; (D) gold: chamber 2, deposition temperature = 18 K, β ∼ 0.03 K s−1; simulation parameters: Edes =
5200 K, ν0 = 3 × 1030 molecules cm−2 s−1, pump rate = 0.03 s−1.
HOPG failed to produce a satisfactory fit to the experimental data,with the simulated desorption being too broad and occurring at asubstantially lower temperature than experiment. However, inspec-tion of the experimental data suggests the amorphous peak maybe approaching zeroth-order behaviour at the highest coverages.Fig. 2(A) compares the experimental results with simulated pro-files of a two-step desorption process accounting for the amorphousand crystalline components of the desorption. A reasonable fit tothe amorphous peak can be obtained with a zeroth-order model,although the fit is not as good as for the other substrates, since thefractional order contribution remains significant. On the other hand,the zeroth-order crystalline desorption step with the same kineticparameters as the simulation of desorption from silica provides avery poor fit to the experimental data. The peak maxima of the sim-ulated desorptions are at roughly the correct temperature, indicatingsome compatibility between experimental data sets, but the shapeof the desorption demonstrates a complexity beyond that in thesimple model applied in the simulation. Interestingly, if the lower
temperature of the amorphous desorption was obtained by loweringEdes from the crystalline value, the resulting peak was far too broad.Rather, the fit was obtained by increasing ν0, with Edes held at thecrystalline value.
Fractional order desorption of multilayer methanol has been re-ported in several previous studies (Christmann & Demuth 1982;Wu et al. 1993; Nishimura et al. 1998; BWB05). Christmann &Demuth (1982) explained the fractional order of desorption byconsidering a condensed phase structure in which methanol formschains of hydrogen-bonded molecules. The desorption energy of anend-chain molecule would be expected to be lower than that of amolecule in the middle of a chain since only one hydrogen bondmust be broken. However, desorption of one mid-chain moleculewould create two new end-chain molecules that are more easilydesorbed. If the difference in desorption energy between the end-chain and mid-chain molecules is such that mid-chain desorption issignificant but unfavoured, the desorption rate may be proportionalto chain length and hence have fractional order with respect to the
C© 2009 The Authors. Journal compilation C© 2009 RAS, MNRAS 398, 357–367
at University of Sussex on July 21, 2014
http://mnras.oxfordjournals.org/
Dow
nloaded from
362 S. D. Green et al.
Table 1. Kinetic parameters for desorption of solid methanol determined in varying experimental studies.
Substrate β Deposition n Edes/kB νn
(K s−1) temperature (K) (K)
Golda ∼0.03 18 0 5200 ± 120 3 × 1030±1 molecules cm−2 s−1
Silicaa ∼0.1 19 0 5300 ± 120 3 × 1030±1 molecules cm−2 s−1
Silicab (simulation) 0.1 118 0 5465 ± 120 3 × 1030±1 molecules cm−2 s−1
Silicab (leading edge) 0.1 118 0 5200 ± 240 4.75 × 1029±1 molecules cm−2 s−1
HOPGc,d,e (Leading edge) 0.5 89 0.35 ± 0.21 4900 ± 100 6 × 1025 (molecules cm−2)0.65 s−1
HOPGf (Simulation) 0.5 89 0 5470 ± 120 2.5 × 1031±1 molecules cm−2 s−1
Al2O3(0001)g 5 90 0.53 ± 0.12 5580 ± 250 3.1 × 1024 (molecules cm−2)0.47 s−1
CsIh – 10 0 4230 ± 24 2.0 × 1027 molecules cm−2 s−1
Pd(100)i 12 77 0.5 3600 –�H sub for bulk crystalline CH3OHg 5390
aThis work, chamber 2.bThis work, chamber 3.cBWB05.dBolina (2005).eBrown & Bolina (2007).f This work (analysis), chamber 1.gNishimura et al. (1998).hSandford & Allamandola (1993). These experiments measured desorption isothermally, therefore, the heating rate, β, is not applicable.iChristmann & Demuth (1982).
total coverage. However, this model of fractional order desorptionshould be applicable on all surfaces, whereas zeroth-order desorp-tion of multilayer methanol is also commonly observed. Nishimuraet al. (1998) favoured a morphological explanation for fractionalorder desorption, in which the multilayer forms microstructures.The population of molecules available for desorption, and hencethe desorption rate, is proportional to the surface area. Therefore, ifmicrostructures form that have surface area which changes as thecoverage is reduced during desorption, then the desorption rate willadopt a fractional order with respect to the coverage. Such islandingin the multilayer can occur when an adsorbate species does not wetthe surface, i.e. when the adsorbate molecule binds more stronglyto other adsorbate molecules than to the surface. Since methanolshows a different wetting character on each surface, this explana-tion can account for the observation of fractional order desorptionkinetics on some surfaces but not others.
Methanol is not expected to wet the surface of HOPG (Wanget al. 2002). Therefore, formation of three-dimensional structuresis a likely cause of the fractional order desorption from the amor-phous phase. Methanol has been shown to wet the well defined (110)and (111) single crystal gold surfaces, forming a stable monolayer(Outka & Madix 1987; Gong et al. 2008). However, there is noevidence of a resolved monolayer desorption peak at higher tem-perature from the poorly defined and uncleaned polycrystalline goldfilm in these experiments (Fig. 1D i). At the low deposition tem-perature of 18 K in this experimental set, the adsorption is ballistic,i.e. the molecules are adsorbed where they collide with the surface,and have limited ability to relax into more energetically favourableconfigurations. The desorption profiles for coverages of less than16 MLeq are consistent with the process of dewetting, whereby thefilm restructures from this as-deposited morphology to increaseinteractions between adsorbate molecules and reduce the interac-tions between adsorbate molecules and the surface, and in so doingcreates the microstructured surface from which fractional order des-orption is observed. Dewetting is inhibited as the thickness increases(Palmer et al. 2008), therefore, at higher coverages the desorptionis dominated by zeroth-order kinetics. At a deposition temperatureof 89 K, it is likely that methanol is mobile on the HOPG surface(Souda 2005). Therefore, the film will dewet as it is deposited, al-
lowing structuring at higher coverages than possible in a film thatdewets as it anneals. Thus, the desorption profiles in data set A arenot fully dominated by zeroth-order desorption even at the highestcoverage of 62 MLeq. Methanol is expected to wet the surface ofsilica (Sneh & George 1995). However, the intrinsic roughness ofthe amorphous silica substrate provides a three-dimensional sur-face upon which the surface area of the methanol film changesas it grows. Beyond a coverage of roughly 5 MLeq, this surfaceroughness is effectively ‘filled in’ and zeroth-order desorption fromlayer-by-layer growth of the methanol film results.
The TPD experiment provides information about the adsorbatefilm in the temperature range during which desorption occurs, andcannot reliably give information about the thermal history of thefilm. It is therefore commonly assumed that the deposition temper-ature of the film is not important provided that it is below the start ofsignificant desorption. Our interpretation of these results suggests,however, that due to the influence of effects such as dewetting,changes in deposition temperature may have measurable influenceson the behaviour of the fractional order desorption regime. The de-position temperature may also have other, more subtle, effects. Thestructure and porosity of amorphous solid water is well known tobe influenced by the temperature, rate and technique of deposition(Kimmel et al. 2001). A similar temperature dependency has beendemonstrated in methanol films (Souda 2005; Collings, Chen &McCoustra 2006). Upon annealing, the structure of the film maynot have the same structure as that of a film deposited at an equiv-alent temperature. This has also recently been demonstrated forammonia films (Dawes et al. 2007). The influence of such effectsis likely to be relatively small, and may be below the limit of sen-sitivity in many TPD experiments, but may nevertheless contributeto experimental uncertainty.
It is clear that methanol desorption shows a fractional orderregime at relatively low coverages on each of the substrates ex-amined, and that the behaviour of this regime is dependent on thesubstrate. However, it is also apparent that beyond this fractionalorder regime, a zeroth-order desorption regime grows. Compari-son of the kinetic parameters in Table 1 shows that, as expected,there is no evidence to suggest that the structure of the methanolfilm is influenced by the substrate once this zeroth-order regime is
C© 2009 The Authors. Journal compilation C© 2009 RAS, MNRAS 398, 357–367
at University of Sussex on July 21, 2014
http://mnras.oxfordjournals.org/
Dow
nloaded from
Thermal desorption of methanol 363
reached. Furthermore, the values of Edes obtained from desorptionexperiments are in good agreement with the value for the enthalpyof sublimation of bulk crystalline methanol estimated for an ap-propriate temperature (Nishimura et al. 1998). The values of Edes
reported for methanol desorption from CsI (Sandford & Allaman-dola 1993) and Pd(100) (Christmann & Demuth 1982), however,are substantially lower. In the former case, Edes was calculated basedon an estimated value of ν0, and in the latter case no value of ν0
was reported.Because the desorption of methanol in the various studies has
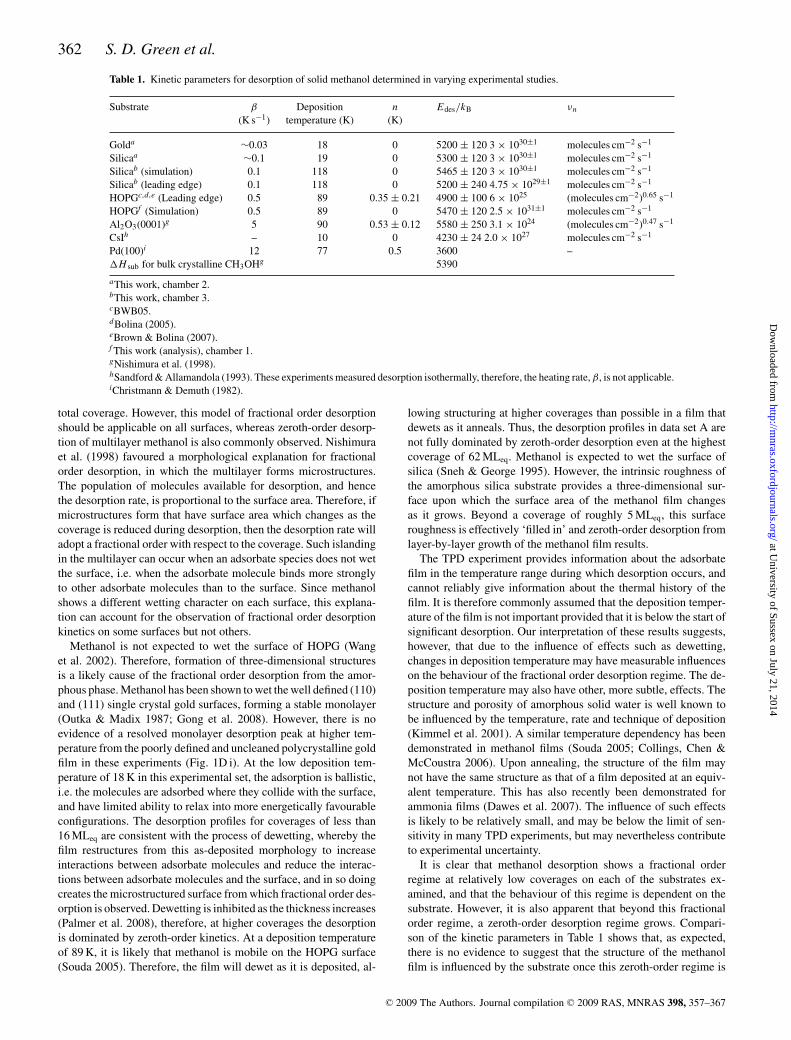
been performed under differing conditions, it is difficult to makedirect graphical comparisons of the results. However, the stochasticsimulation package can be used to generate methanol desorptionprofiles at a consistent set of ‘experimental’ conditions comparingdiffering sets of kinetic parameters. Fig. 3(A) compares simulations
made using kinetic parameters determined for the four data sets(Figs 1A–D) and two additional sets from the literature (Sandford& Allamandola 1993; Nishimura et al. 1998). The four profiles withpeaks in the 155 to 165 K range (Figs 3A i–iv) are due to desorptionof crystalline methanol. The range of peak temperatures reflectsuncertainties in the parameters. These uncertainties can arise fromsmall errors in temperature calibration of experiments, and moresignificantly, from errors in measuring the coverage of adsorbedmethanol, since the peak temperature for a zeroth-order desorptionprocess is dependent on coverage. While the values of Edes and ν0
reported by Sandford & Allamandola (1993) do differ from thosedetermined in this work, in combination they produce a consistentdesorption temperature. This demonstrates that the discrepancy inthe parameters of Sandford & Allamandola (1993) arises in theircalculation rather than the initial measurement of desorption rate.
100 110 120 130 140 150 160 170
75 80 85 90 95 100 105
0
1x10¹⁷
2x10¹⁷
3x10¹⁷
4x10¹⁷
5x10¹⁷ (iii)(ii)(i)(vi)(iv)(v)B
CH
3O
H D
es
orb
ed
/ m
cl
cm
-2
Temperature / K
CH
3O
H D
es
orp
tio
n R
ate
/ a
.u
(iii)
(vi)(v)
(ii)
(iv)
A (i)
Temperature / K
Figure 3. (Colour online) Simulated profiles of methanol desorption with various sets of experimentally measured kinetic parameters for a film of 5 ×
1017 molecules cm−2 (∼700 MLeq) at (A) typical laboratory conditions of β = 0.1 K s−1 and a pump rate = 0.3 s−1; and (B) with the temperature profile of a15 M⊙ protostar. Kinetic parameters for desorption from (i) gold, (ii) silica, deposition at 18 K and (iii) silica, deposition at 118 K from this work. The shadedregion shows the range in temperature of the desorption profile in (ii) based on the experimental error. Kinetic parameters for desorption from (iv) CsI fromSandford & Allamandola (1993), (v) HOPG from BWB05 and (vi) Al2O3 from Nishimura et al. (1998).
C© 2009 The Authors. Journal compilation C© 2009 RAS, MNRAS 398, 357–367
at University of Sussex on July 21, 2014
http://mnras.oxfordjournals.org/
Dow
nloaded from
364 S. D. Green et al.
The parameters determined for desorption of methanol from HOPGare known to relate to the amorphous phase, therefore, the peakoccurs at a much lower temperature of 135 K in the simulated pro-file (Fig. 3A v), as expected. The peak in the simulated profile formethanol desorption from Al2O3 also occurs at a lower temperature(Fig. 3A vi). The authors assumed that the solid methanol was crys-talline since the value of the desorption energy they determined wassimilar to the heat of sublimation of crystalline methanol. How-ever, the desorption temperature and calculated value of Edes areconsistent with amorphous desorption peak of from the graphitesurface (Fig. 3A v). The higher heating rate employed in these ex-periments would also favour desorption from the amorphous state,as discussed below.
4 A STRO P HYSICAL APPLICATIONS
The results in Fig. 1(A) show that at a heating rate of 0.5 K s−1 thesublimation of solid methanol is dominated by desorption from theamorphous phase. However, in slowing the heating rate to 0.1 K s−1
or less, as in Figs 1(B)–(D), crystallization of the amorphous phaseis complete prior to the onset of sublimation, so that only a singlepeak corresponding to the desorption of crystalline methanol is ob-served. Since the heating rate of icy mantles on dust grains close toprotostars is many orders of magnitude slower, still it seems reason-able to assume that the desorption kinetics of amorphous methanolare unlikely to be of relevance in slowly warming circumstellar en-vironments. However, this cannot be stated with certainty withouta detailed knowledge of the kinetics of crystallization. The crystal-lization process consists of two components, the nucleation and thepropagation of crystallites (Safarik & Mullins 2004). Nucleationcan potentially be favoured in bulk ice, or at either the substrateor vacuum interface, which creates the possibility of the rate ofcrystallization having a dependence on ice thickness. In the caseof water, the crystallization rate has been found to be satisfactorilyapproximated as a first order process (Kouchi et al. 1994). Watersimilarly shows a component of desorption from the amorphousphase at laboratory heating rates (for example Smith et al. 1997),but with the assumption of a first-order crystallization process, ther-mal desorption of water from the amorphous phase is not relevantat astrophysically relevant heating rates.
The temperature of thermal desorption of solid methanol underastrophysical conditions, such as in a warming nebula close to a pro-tostar, can be determined by running the stochastic simulations witha temperature profile appropriate to the environment. In Fig. 3(B),desorption profiles simulated with the same six sets of kinetic pa-rameters are compared, using the temperature profile of a 15 M⊙protostar (Viti et al. 2004). This temperature profile is in fact closeto a linear heating rate of 2.6 × 10⁻³ K yr−1. The pumping step inthe simulation model has been removed so that the output of thesimulation is a rise in the gas phase concentration of methanol. Forthe two profiles that simulate desorption of amorphous methanol(Figs 3B v and vi), the desorption again occurs at a markedly lowertemperature. However, as discussed above, it is unlikely that thermaldesorption occurs from the amorphous phase under astrophysicallyrelevant conditions. The profile simulated for desorption of crys-talline methanol from the parameters of Sandford & Allamandola(1993) shows desorption at a similarly low temperature. While theestimated value of ν0 and the measured value of Edes based on thisestimate can in combination be used to satisfactorily model des-orption under laboratory conditions, at the astrophysically relevantheating rate they no longer give a reliable prediction of desorptiontemperature. The remaining three desorption profiles (Figs 3B i–
iii) were obtained from the parameters determined for desorptionof crystalline methanol in our own experiments. Even so, the un-certainties in our measurements allow for a variation in desorptiontemperature of up to 5 K.
Modelling the desorption of a solid film from a surface as a zeroth-order process assumes that the population of molecules availablefor desorption is constant over time. While this assumption may bevalid for flat substrates under laboratory conditions, it is clearly notvalid for three-dimensional substrates such as dust grain mantles,where surface area must decrease over time as the mantle contracts.The relationship describing a zeroth-order desorption process canhence be rewritten as
ra = ν0A exp
(
−Edes
kBT
)
, (7)
where ra (molecules s−1) is the absolute desorption rate, and A
(cm2) is the time-dependent surface area from which molecules aredesorbing. Substituting the basic equations describing the geometryof a sphere of radius l (cm),
A = 4π l2, (8)
V =4
3π l3 =
P
ρb, (9)
where V (cm3) is the volume, P (molecules) is the number ofmolecules and ρb (molecules cm−3) is the bulk molecular density,to obtain the expression
ra = 4.836 ν0
(
P
ρb
)2/3
exp
(
−Edes
kBT
)
(10)
shows that a desorption process that is zeroth order on a flat samplehas a fractional order with a value of 2/3 on a spherical particle.When the contribution of the volume of a grain of radius lg (cm)to the dimensions of an icy mantle is taken into account, the rateexpression becomes
ra = 12.57 ν0
(
0.2387P
ρb+ lg
)2/3
exp
(
−Edes
kBT
)
. (11)
This is not an equation that can be solved using the stochastic in-tegration package applied here. However, the profile of desorptionfrom a mantle of uniform thickness adsorbed on a spherical grain isidentical to that of a spherical icy ball of the same total dimensions,up until the point where the icy mantle is completely desorbed.Therefore, the expression in equation (10) is satisfactory for deter-mining the desorption profiles of icy mantles from spherical grains,as has been done in the simulations described below.
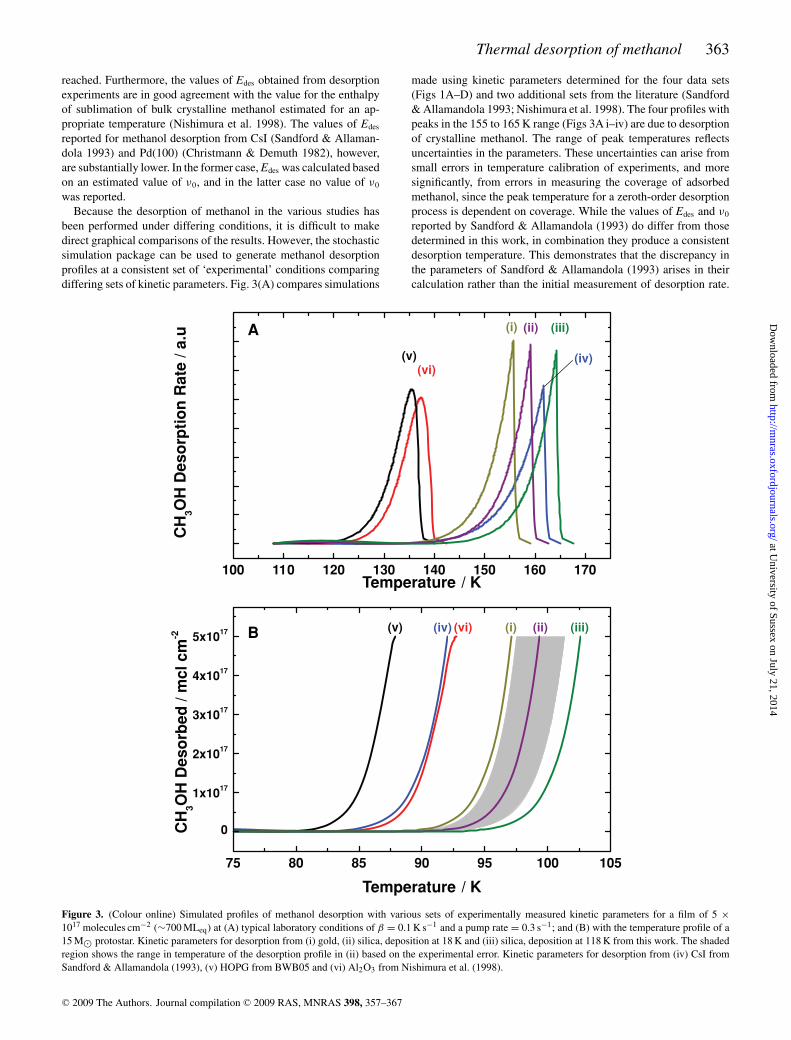
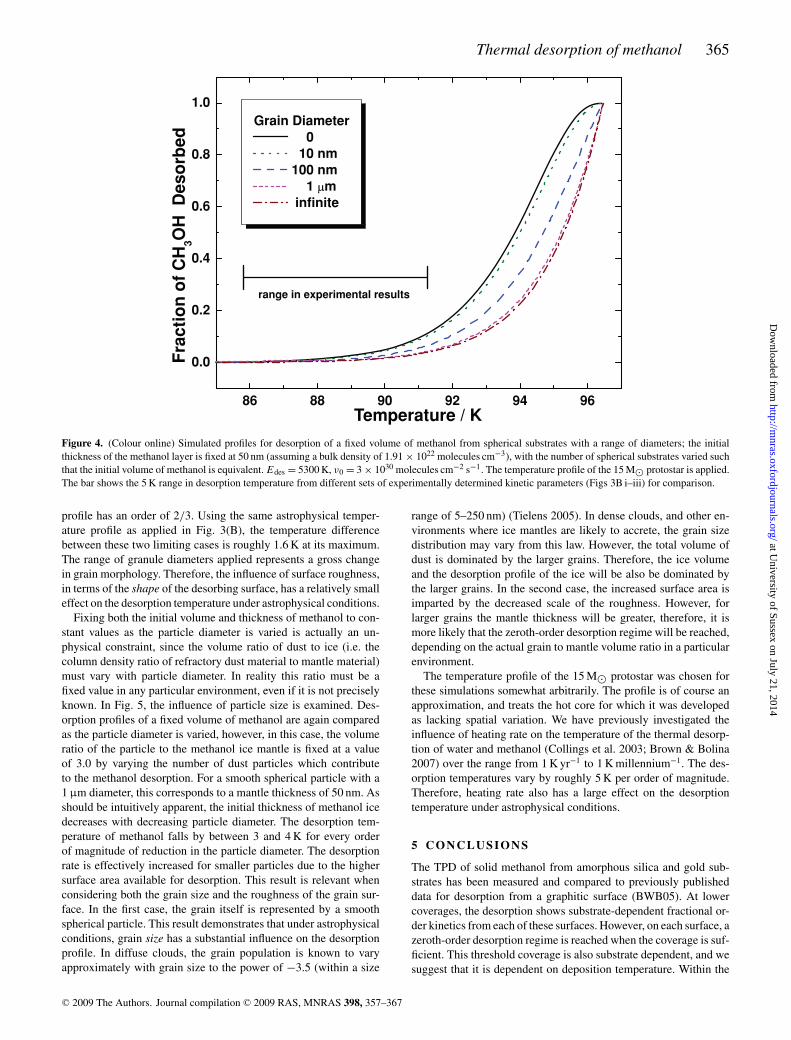
The experimental results show that substrate-dependent frac-tional order methanol desorption is observed up to coverages ofsignificance to mantle thicknesses on interstellar dust grains, dueto the surface roughness. The effects of surface roughness in astro-physical environments are investigated in Fig. 4. Here, we crudelyrepresent the rough surface as consisting of spherical ‘granules’.The size of these granules is varied in order to mimic differences inthe scale of the roughness. Desorption of an ice mantle from thesegranules therefore represents the fractional order desorption regime.The volume of methanol ice is the same for each simulation, andthe thickness of the ice layer has been fixed at 50 nm (134 MLeq ona flat surface), by varying the number of granules that contribute tothe desorption profile. The parameter that changes between the sim-ulations is the radius of curvature. For a granule of infinite diameter(i.e. a flat surface) the desorption profile is zeroth order, while for agranule of zero diameter (i.e. a spherical ball of ice) the desorption
C© 2009 The Authors. Journal compilation C© 2009 RAS, MNRAS 398, 357–367
at University of Sussex on July 21, 2014
http://mnras.oxfordjournals.org/
Dow
nloaded from
Thermal desorption of methanol 365
86 88 90 92 94 96
0.0
0.2
0.4
0.6
0.8
1.0
range in experimental results
Fra
cti
on
of
CH
3O
H
De
so
rbe
d
Temperature / K
Grain Diameter
0
10 nm
100 nm
1 µm
infinite
Figure 4. (Colour online) Simulated profiles for desorption of a fixed volume of methanol from spherical substrates with a range of diameters; the initialthickness of the methanol layer is fixed at 50 nm (assuming a bulk density of 1.91 × 10²² molecules cm−3), with the number of spherical substrates varied suchthat the initial volume of methanol is equivalent. Edes = 5300 K, ν0 = 3 × 1030 molecules cm−2 s−1. The temperature profile of the 15 M⊙ protostar is applied.The bar shows the 5 K range in desorption temperature from different sets of experimentally determined kinetic parameters (Figs 3B i–iii) for comparison.
profile has an order of 2/3. Using the same astrophysical temper-ature profile as applied in Fig. 3(B), the temperature differencebetween these two limiting cases is roughly 1.6 K at its maximum.The range of granule diameters applied represents a gross changein grain morphology. Therefore, the influence of surface roughness,in terms of the shape of the desorbing surface, has a relatively smalleffect on the desorption temperature under astrophysical conditions.
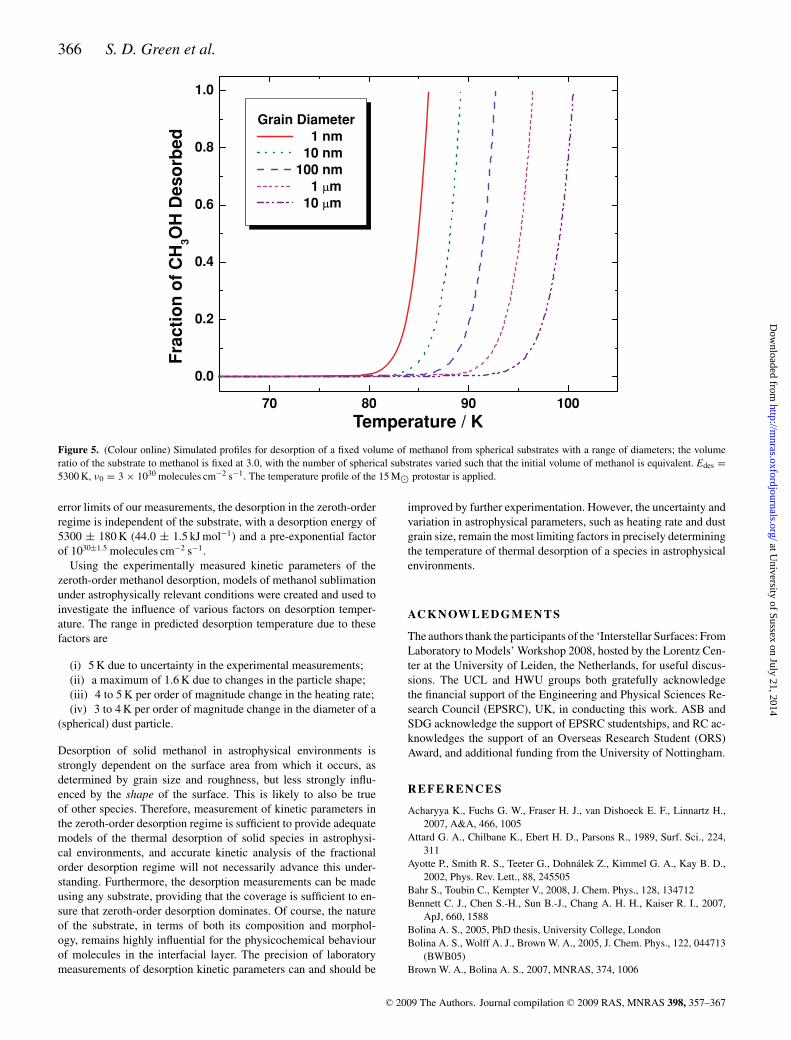
Fixing both the initial volume and thickness of methanol to con-stant values as the particle diameter is varied is actually an un-physical constraint, since the volume ratio of dust to ice (i.e. thecolumn density ratio of refractory dust material to mantle material)must vary with particle diameter. In reality this ratio must be afixed value in any particular environment, even if it is not preciselyknown. In Fig. 5, the influence of particle size is examined. Des-orption profiles of a fixed volume of methanol are again comparedas the particle diameter is varied, however, in this case, the volumeratio of the particle to the methanol ice mantle is fixed at a valueof 3.0 by varying the number of dust particles which contributeto the methanol desorption. For a smooth spherical particle with a1 µm diameter, this corresponds to a mantle thickness of 50 nm. Asshould be intuitively apparent, the initial thickness of methanol icedecreases with decreasing particle diameter. The desorption tem-perature of methanol falls by between 3 and 4 K for every orderof magnitude of reduction in the particle diameter. The desorptionrate is effectively increased for smaller particles due to the highersurface area available for desorption. This result is relevant whenconsidering both the grain size and the roughness of the grain sur-face. In the first case, the grain itself is represented by a smoothspherical particle. This result demonstrates that under astrophysicalconditions, grain size has a substantial influence on the desorptionprofile. In diffuse clouds, the grain population is known to varyapproximately with grain size to the power of −3.5 (within a size
range of 5–250 nm) (Tielens 2005). In dense clouds, and other en-vironments where ice mantles are likely to accrete, the grain sizedistribution may vary from this law. However, the total volume ofdust is dominated by the larger grains. Therefore, the ice volumeand the desorption profile of the ice will be also be dominated bythe larger grains. In the second case, the increased surface area isimparted by the decreased scale of the roughness. However, forlarger grains the mantle thickness will be greater, therefore, it ismore likely that the zeroth-order desorption regime will be reached,depending on the actual grain to mantle volume ratio in a particularenvironment.
The temperature profile of the 15 M⊙ protostar was chosen forthese simulations somewhat arbitrarily. The profile is of course anapproximation, and treats the hot core for which it was developedas lacking spatial variation. We have previously investigated theinfluence of heating rate on the temperature of the thermal desorp-tion of water and methanol (Collings et al. 2003; Brown & Bolina2007) over the range from 1 K yr−1 to 1 K millennium−1. The des-orption temperatures vary by roughly 5 K per order of magnitude.Therefore, heating rate also has a large effect on the desorptiontemperature under astrophysical conditions.
5 C O N C L U S I O N S
The TPD of solid methanol from amorphous silica and gold sub-strates has been measured and compared to previously publisheddata for desorption from a graphitic surface (BWB05). At lowercoverages, the desorption shows substrate-dependent fractional or-der kinetics from each of these surfaces. However, on each surface, azeroth-order desorption regime is reached when the coverage is suf-ficient. This threshold coverage is also substrate dependent, and wesuggest that it is dependent on deposition temperature. Within the
C© 2009 The Authors. Journal compilation C© 2009 RAS, MNRAS 398, 357–367
at University of Sussex on July 21, 2014
http://mnras.oxfordjournals.org/
Dow
nloaded from
366 S. D. Green et al.
70 80 90 100
0.0
0.2
0.4
0.6
0.8
1.0
Fra
cti
on
of
CH
3O
H D
es
orb
ed
Temperature / K
Grain Diameter
1 nm
10 nm
100 nm
1 µm
10 µm
Figure 5. (Colour online) Simulated profiles for desorption of a fixed volume of methanol from spherical substrates with a range of diameters; the volumeratio of the substrate to methanol is fixed at 3.0, with the number of spherical substrates varied such that the initial volume of methanol is equivalent. Edes =
5300 K, ν0 = 3 × 1030 molecules cm−2 s−1. The temperature profile of the 15 M⊙ protostar is applied.
error limits of our measurements, the desorption in the zeroth-orderregime is independent of the substrate, with a desorption energy of5300 ± 180 K (44.0 ± 1.5 kJ mol−1) and a pre-exponential factorof 1030±1.5 molecules cm−2 s−1.
Using the experimentally measured kinetic parameters of thezeroth-order methanol desorption, models of methanol sublimationunder astrophysically relevant conditions were created and used toinvestigate the influence of various factors on desorption temper-ature. The range in predicted desorption temperature due to thesefactors are
(i) 5 K due to uncertainty in the experimental measurements;(ii) a maximum of 1.6 K due to changes in the particle shape;(iii) 4 to 5 K per order of magnitude change in the heating rate;(iv) 3 to 4 K per order of magnitude change in the diameter of a
(spherical) dust particle.
Desorption of solid methanol in astrophysical environments isstrongly dependent on the surface area from which it occurs, asdetermined by grain size and roughness, but less strongly influ-enced by the shape of the surface. This is likely to also be trueof other species. Therefore, measurement of kinetic parameters inthe zeroth-order desorption regime is sufficient to provide adequatemodels of the thermal desorption of solid species in astrophysi-cal environments, and accurate kinetic analysis of the fractionalorder desorption regime will not necessarily advance this under-standing. Furthermore, the desorption measurements can be madeusing any substrate, providing that the coverage is sufficient to en-sure that zeroth-order desorption dominates. Of course, the natureof the substrate, in terms of both its composition and morphol-ogy, remains highly influential for the physicochemical behaviourof molecules in the interfacial layer. The precision of laboratorymeasurements of desorption kinetic parameters can and should be
improved by further experimentation. However, the uncertainty andvariation in astrophysical parameters, such as heating rate and dustgrain size, remain the most limiting factors in precisely determiningthe temperature of thermal desorption of a species in astrophysicalenvironments.
AC K N OW L E D G M E N T S
The authors thank the participants of the ‘Interstellar Surfaces: FromLaboratory to Models’ Workshop 2008, hosted by the Lorentz Cen-ter at the University of Leiden, the Netherlands, for useful discus-sions. The UCL and HWU groups both gratefully acknowledgethe financial support of the Engineering and Physical Sciences Re-search Council (EPSRC), UK, in conducting this work. ASB andSDG acknowledge the support of EPSRC studentships, and RC ac-knowledges the support of an Overseas Research Student (ORS)Award, and additional funding from the University of Nottingham.
REFERENCES
Acharyya K., Fuchs G. W., Fraser H. J., van Dishoeck E. F., Linnartz H.,2007, A&A, 466, 1005
Attard G. A., Chilbane K., Ebert H. D., Parsons R., 1989, Surf. Sci., 224,311
Ayotte P., Smith R. S., Teeter G., Dohnalek Z., Kimmel G. A., Kay B. D.,2002, Phys. Rev. Lett., 88, 245505
Bahr S., Toubin C., Kempter V., 2008, J. Chem. Phys., 128, 134712Bennett C. J., Chen S.-H., Sun B.-J., Chang A. H. H., Kaiser R. I., 2007,
ApJ, 660, 1588Bolina A. S., 2005, PhD thesis, University College, LondonBolina A. S., Wolff A. J., Brown W. A., 2005, J. Chem. Phys., 122, 044713
(BWB05)Brown W. A., Bolina A. S., 2007, MNRAS, 374, 1006
C© 2009 The Authors. Journal compilation C© 2009 RAS, MNRAS 398, 357–367
at University of Sussex on July 21, 2014
http://mnras.oxfordjournals.org/
Dow
nloaded from
Thermal desorption of methanol 367
Brown W. A., Viti S., Wolff A. J., Bolina A. S., 2006, Faraday Discuss.,133, 113
Christmann K., Demuth J. E., 1982, J. Chem. Phys., 76, 6308Collings M. P., Dever J. W., Fraser H. J., McCoustra M. R. S., 2003, Ap&SS,
286, 633Collings M. P., Anderson M. A., Chen R., Dever J. W., Viti S., Williams D.
A., McCoustra M. R. S., 2004, MNRAS, 354, 1133Collings M. P., Chen R., McCoustra M. R. S., 2006, in Kaiser R. I., Bernath
P., Osamura Y., Petrie S., Mebel A. M., eds, AIP Conf. Proc. Vol. 85, As-trochemistry: From Laboratory Studies to Astronomical Observations.Am. Inst. Phys., Melville, NY, p. 62
Dartois E., Schutte W., Geballe T. R., Demyk K., Ehrenfreund P.,d’Hendecourt L., 1999, A&A, 342, L32
Dawes A. et al., 2007, J. Chem. Phys., 126, 244711Fraser H. J., Collings M. P., McCoustra M. R. S., Williams D. A., 2001,
MNRAS, 327, 1165Fraser H. J., Collings M. P., McCoustra M. R. S., 2002, Rev. Sci. Instrum.,
73, 2161Galvez O., Ortega I. K., Mate B., Moreno M. A., Martın-Llorente B., Herrero
V. J., Escribano R., Gutierrez P. J., 2007, A&A, 472, 691Gong J., Flaherty D. W., Ojifinni R. A., White J. M., Mullins C. B., 2008, J.
Phys. Chem. C, 112, 5501Gunster J., Liu G., Stultz J., Krischok S., Goodman D. W., 2000, J. Phys.
Chem. B, 104, 5738Harris T. D., Lee D. H., Blumberg M. Q., Arumainayagam C. R., 1995, J.
Phys. Chem., 99, 9530Herbst E., Shematovich V. I., 2003, Ap&SS, 285, 725Hrbek J., dePaola R. A., Hoffmann F. M., 1984, J. Chem. Phys., 81, 2818Jenniskens H. G., Dorlandt P. W. F., Kadodwala M. F., Kleyn A. W., 1996,
Surf. Sci., 357, 624Kimmel G. A., Stevenson K. P., Dohnalek Z., Smith R. S., Kay B. D., 2001,
J. Chem. Phys., 114, 5284King D. A., 1975, Surf. Sci., 47, 384Kouchi A., Yamamoto T., Kozasa T., Kuroda T., Greenberg J. M., 1994,
A&A, 290, 1009Markwick A. J., Ilgner M., Millar T. J., Henning Th., 2002, A&A, 385, 632Mate B., Galvez O., Herrero V. J., Escribano R., 2009, ApJ, 690, 486Nagaoka A., Watanabe N., Kouchi A., 2007, J. Phys. Chem. A, 111,
3016Nishimura S. Y., Gibbons R. F., Tro N. J., 1998, J. Phys. Chem. B., 102,
6831Oakes D. J., 1994, PhD thesis, Univ. East AngliaOutka D. A., Madix R. J., 1987, J. Am. Chem. Soc., 109, 1708
Palmer J. S., Sivaramakrishnan S., Waggoner P. S., Weaver J. H., 2008, Surf.Sci., 602, 2278
Peremans A., Maseri F., Darville J., Gilles J.-M., 1990, J. Vac. Sci. Technol.A, 8, 3224
Peremans A., Dereux A., Maseri F., Darville J., Gilles J.-M., Vigneron J.-P.,1994, Phys. Rev. B, 45, 8598
Pontoppidan K. M., Dartois E., van Dishoeck E. F., Thi W.-F., d’HendecourtL., 2003, A&A, 404, L17
Pontoppidan K. M., van Dishoeck E. F., Dartois E., 2004, A&A, 426, 925Pratt S. J., Escott D. K., King D. A., 2003, J. Chem. Phys., 19, 10867Rendulic K. D., Sexton B. A., 1982, J. Catal., 78, 126Roberts J. F., Rawlings J. M. C., Viti S., Williams D. A., 2007, MNRAS,
382, 733Safarik D. J., Mullins C. B., 2004, J. Chem. Phys., 121, 6003Sandford S. A., Allamandola L. J., 1993, ApJ, 417, 815Sexton B. A., 1981, Surf. Sci., 102, 271Sexton B. A., Hughes A. E., 1984, Surf. Sci., 140, 227Sexton B. A., Rendulic K. D., Hughes A. E., 1982, Surf. Sci., 121, 181Smith R. S., Huang C., Wong E. K. L., Kay B. D., 1997, Phys. Rev. Lett.,
79, 909Sneh O., George S. M., 1995, J. Phys. Chem., 99, 4639Souda R., 2005, Phys. Rev. B, 72, 115414Thrower J. D., Collings M. P., Rutten F. J. M., McCoustra M. R. S., 2009,
MNRAS, 354, 1510Tielens A. G. G. M., 2005, The Physics and Chemistry of the Interstellar
Medium. Cambridge Univ. Press, CambridgeTielens A. G. G. M., Whittet D. C., 1997, in van Dishoeck E. F., ed.,
Molecules in Astrophysics. Kluwer, Dordrecht, p. 239Torrie B. H., Weng S. X., Powell B. M., 1989, Mol. Phys., 67, 575Viti S., Williams D. A., 1999, MNRAS, 305, 755Viti S., Collings M. P., Dever J. W., McCoustra M. R. S., Williams D. A.,
2004, MNRAS, 354, 1141Wang L., Song Y., Wu A., Li Z., Zhang B., Wang E., 2002, Appl. Surf. Sci.,
199, 67Watanabe N., Kouchi A., 2008, Prog. Surf. Sci., 83, 439Wolff A. J., Carlstedt C., Brown W. A., 2007, J. Phys. Chem. C., 111, 5990Woodruff D. P., Delcher T. A., 1994, Modern Techniques of Surface Science,
2nd edn. Cambridge Univ. Press, CambridgeWu M.-C., Truong C. M., Goodman D. W., 1993, J. Phys. Chem., 97, 9425Zhang R., Gellman A. J., 1991, J. Phys. Chem., 95, 7433
This paper has been typeset from a MS Word file perpared by the author.
C© 2009 The Authors. Journal compilation C© 2009 RAS, MNRAS 398, 357–367
at University of Sussex on July 21, 2014
http://mnras.oxfordjournals.org/
Dow
nloaded from