applying process control to gear manufacturing - march ... · applying process control to gear ......
TRANSCRIPT
22 GEAR
-------------- -- ------------------,
Applying ProcessControl to Gear- ~ f ·- ,-. - - , -I' 'I '. , ' "Manufacturing
Roben L. SebeticRoc1kwelllntern.a,ti,ona,l. Nlewark. OH
Introduction:A common goal of gear manufacturers is to
produce gearing that is competitively priced, thatmeets all quality requirements with the minimumamount of costin a timely manner, and thatsatisfies customers' expectations.
hi order to optimize this goal, the gear manu-facturer must thoroughly understand each manu-facturing process specified. the performance ca-pability of that process, and the effect of thatparticular process as it relates to the quality ofthemanufacturedgear. If I,he wrong series of pro-
cesses has been selected or a specific selectedprocessis not capable of producing a qual ity part,manufacturing costs are greatly increased,
The manufacturing of a desired quality levelof gearing is a function of many factors includ-ing, but certainly not limited to, the gear design,the manufacturing processes, the machine capa-bility, the gear material, Ilie machine operator,and the quality control methods employed, Inthis article we will make ome basic assumptionsabout the gear design, engineering specifica-tions, and the quality control methods employed,and concentrate mainly on the manufacturingprocesses, their control, and how they affect thegear quality produced.
AssumptionsIn order to concentrate primarily on the gear
manufacturing processes selected, their control,and how they affect gear quality, we have madeseveral basic assumptions:
I. The gear designs are good, tooth contactanalysis programs have been run, and motioncurves and displacement values are within de-sired limits. Product testing and evaluation havebeen completed and found acceptable.
TECHNOLOGY
2. Engineering standards for accuracy andtooth contacrlocation have been establishedaccording to design and testing requirements.
3, Acceptable quality control. inspeetionmethods are in place and GR&R studies (GageRepeatability and Reproducibility) have beenmade, and the measured gage error has beendeemed acceptable for all inspection measuringequipment and gages.
What Determines GearManufacturing Quality?
The quality level of a gear or gear set isdetermined during its manufacture by the spe-cific sequence of production operations followedand the capability of each process ..The processsequence selected for the manufacture of aspecifi.c gear is determined by the final gearaccuracies specified for that part.
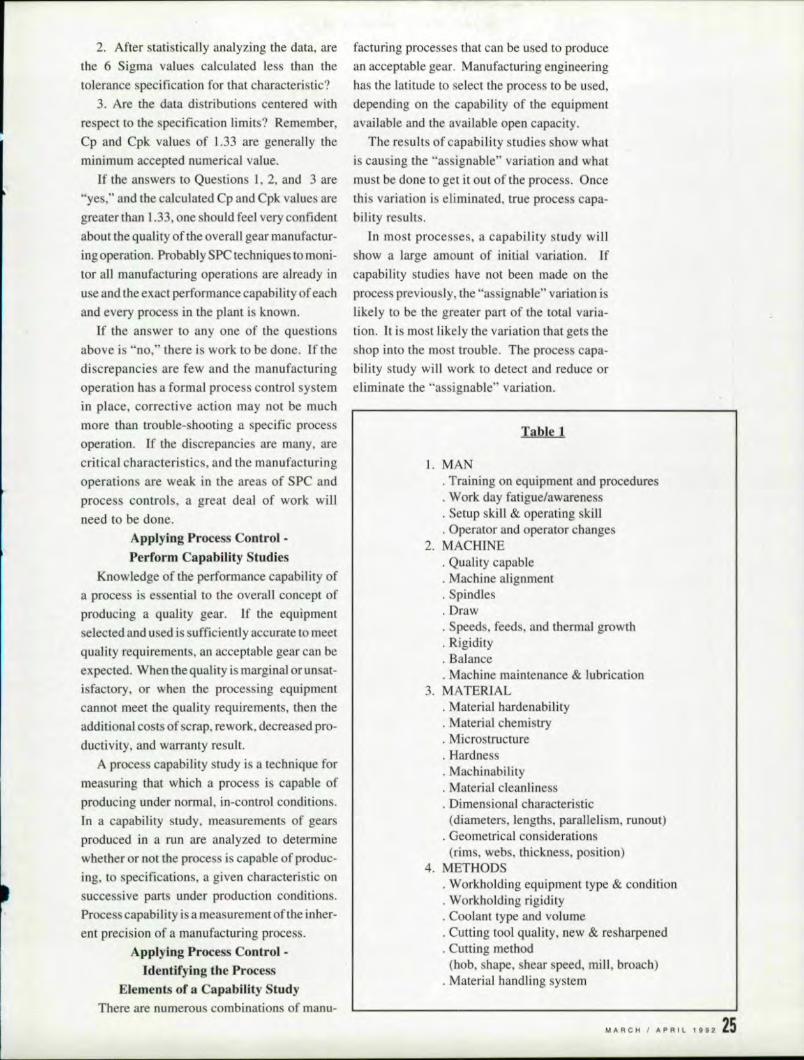
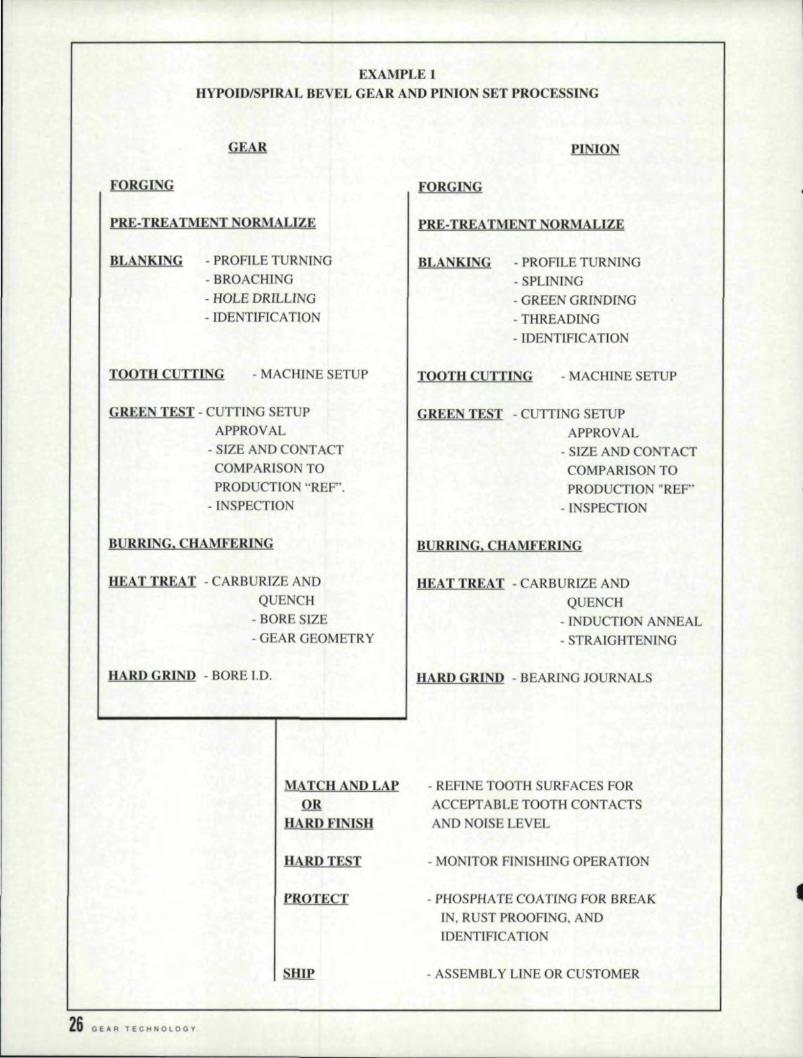
Two typical automotive/truck. axle gear pro-cess flow diagrams are shown in this article. Thetarget quality level of this type of gearing isgenerally set at AGMA 8. Example I (pg, 26)shows a general flow diagram of bevel gearing.Example 2 (pg. 27) is a general flow diagram ofspur and helical gearing.
Note that it is possible, by the addition of ahard profile finishing operation after the heattreating operations, to increase the gear qualityto AGMA 11 01' 12. Along with thi addedoperation, it may be necessary to tighten upsome of the current manufacturing tolerancesand to specify different workholding equip-ment This would be primarily for bearing andbore diameters and could very easily affect [heprocess capability of several different manu-facturing operations.
What is Process Control?Many gear manufacturers use process con-
trol techniques as a means of attaining the gearquality specified. AGMA defines process con-trol as a method by which gear accuracy isachieved and maintained through control ofmanufacturing equipment, methods, and pro-cesses. without resorting to the inspection ofindividualelements of every gear produced.
Process control. technique analyze the manu-facturing processes and quality control plans(METHODS), the gear steels used (MA TE-RIAt.), the machine capability (MACHlNE).and the operator (MAN). When these tech-niques are properly applied to a specific processand that proces i capable, then the gears manu-factured will be of uniform quality,
How is the Process Monitor,ed?'Data is collected on a specific characteri tic
for a specific process and then grouped in ahistogram to get lUI idea of the distribution sample.With collected data, we can make some statisti-cal calculations for the mean and the standarddeviation. What we find is that the disrributionswill vary in shape, spread. and location relativeto the tolerance. or any combination of'the three.
The mean is defined as the sum of a group ofnumbers divided by the total number of elementswithin the group. The standard deviation isdefined as the measure of di per ion ( cauer orspread) of a set of data around its mean.
Statistical process control (SPC) techniquesare excellent tools for evaluating a machineprocess. The results generated from an SPCevaluation give a "snap hot" picture of how theprocess is performing now and can be used topredict how it wiIl perform in the future. Theseresults can be u edto compare the performanceof other machines or processes and can be usedto determine if a machine or process is capable ofperforming a specific task.
When is a Process "In Control,"?There are two causes of variation in any pro-
cess. They are "common" and "assignable"causes. Common causes are random occur-rences that are inherent tothe process. Theycannot be removed without changing the pro-cess. Generally, they are responsible for 85 to90% of process variations. Assignable causesare non-random or patterned occurrences thatcan be identified and eliminated.
CHARTOFTHE
6
5
ueL
--+-- .....-_1__........-._+· ......'......__.. -t_ ...,_t_,_iii .....iiii~+ ...,iiiiiiii +-,I 2 3 4 5 6 7 8 9 10 11 12
SUBGROUPS
: I~----- UeL
I -~ I ---- ------- --- ---.- ----.--- --.--- --- R
I __ ~--~--~---~.-_~--~---~.--~ •• _~ •• -~---~ ~-
1 2 3 4 5 6 7 s 9 10 II 12SUBGROUPS
ici,
AVERA:GES 4
3(X)
2
RANGECHART
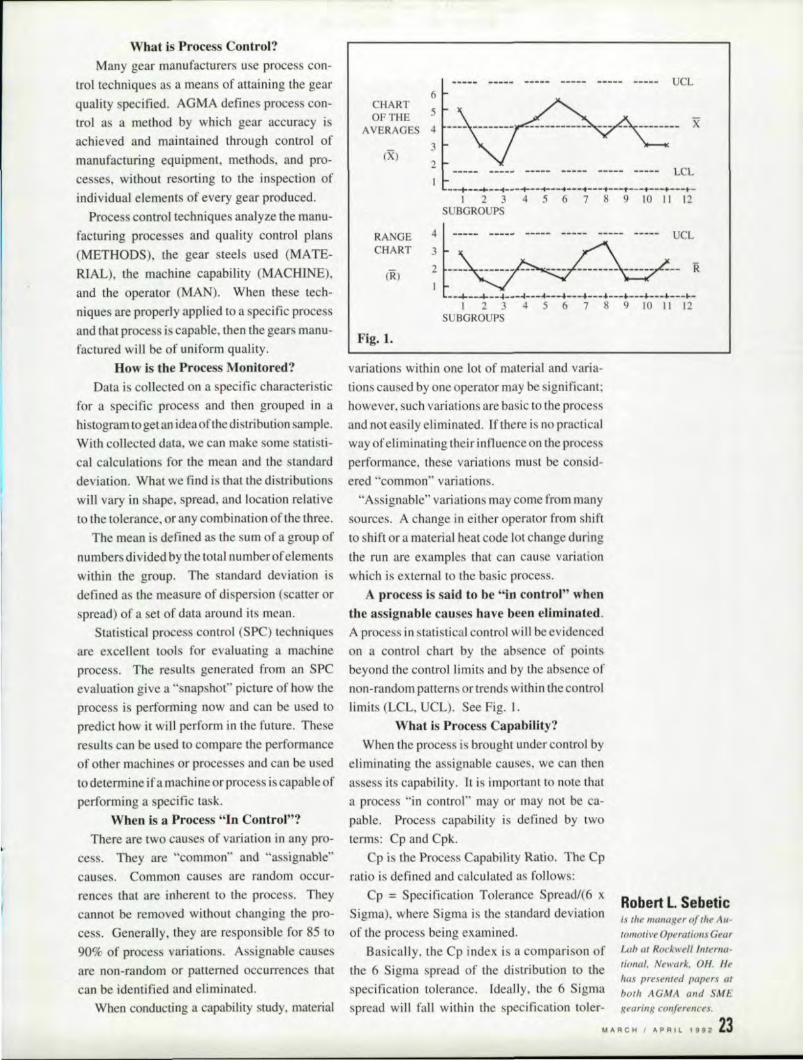
Fig. 1.
Robert L S:ebeticis 1111,' lIIallager of lilt! Au-tomotive Operations GearLab c1I Rockwell lnterna-tional, Newark. OH. Hehas presented papers atbot]: AGMA and SME
When conducting a capability study. material spread will fall within the specification toler- gearing conferences.
MARCH I APRIL 199223
variations within one lot of material and varia-tions caused by one operator may be ignificant;however. such variations are basic to the processand not easilyeliminated, If there isno practicalway of eliminating their influence 011 the processperformance, these variations must be consid-ered "common" variations.
"Assignable" variations may come from many. ources. A change in either operator from shiftto shift or a material heat code lo; change duringthe run are examples that can cause variationwhich is external to the basic process.
A process is said to be "in control" whenthe assignable causes have been eliminated.A process in statistical control wHl be evidencedon a control chart by the absence of pointsbeyond the control limits and by the absence ofnon-random panern or trends within the controllimits (LCt., uci,» See Fig. I.
What is Process Capability?When the process is brought under control by
eliminating the assignable causes, we can thenassess its capability. It is important to note thata process "in control" mayor may not be ca-pable. Process capability is defined by twoterms: Cp and Cpk,
Cp is the Process Capability Ratio. The Cpratio is defined and calculated as follows:
Cp= Specificarion Tolerance Spread/(6 xSigma), where Sigma is the standard deviationof the process being examined,
Basically. the Cp index is a comparison ofthe 6 Sigma spread of the distribution to thespecification tolerance. Ideally, the 6 Sigma
anee along with room to pare on each ide of thespecification limits. The Cp ratio does not ac-count for centeri ng the process relationship 10 the. pecification, See Fig. 2.
Cpkis the Capabihty Index .. It gives an indi-cation of the location of the di tribution relativeto the specification limit. Cpl accounts for theproce ss centering.
For bilateral tolerance , when both upper andlower pecification limits are given, Cpk is cal-culated by the following formula,
The minimum value of Cpk =(USL - MEAN)/(3 X Sigma) or(MEAN - LCL)I(3 X Sigma)
For unilateral tolerances when only a mini-mum or maximum specification limit is given,Cpk i calculated by the following formula:
Cpk = (SL - MEAN)/3 SigmaWhere: USL = Upper Specification Limit
l.SL = Lower Specification LimitSL = Specification Limit
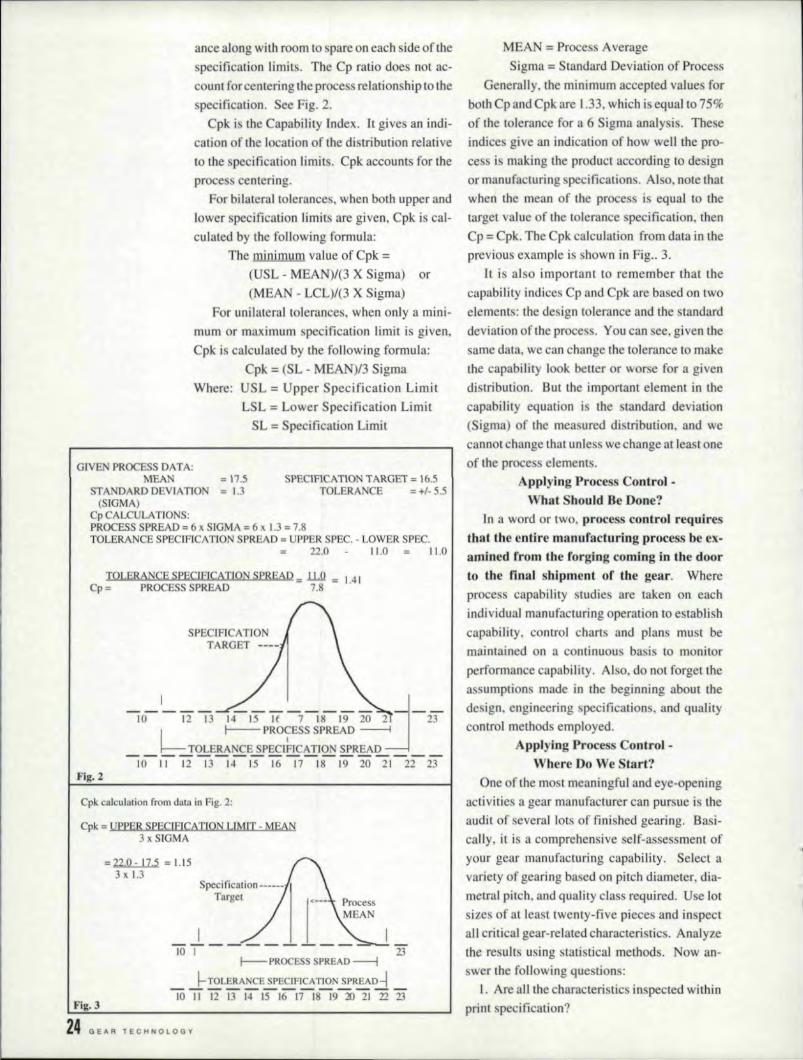
GIVE PROCESS DATA:I\>\EA . = 17.5 SPECIF1· Al'lON lARGEl = 16.5
STANDARD DEVIATIO, = 1.3 l'OLERANCE = +/- 5.5(SIGMA)
Cp CALCULA'JIONS:PROCESS SPREAD = 6 x S.lGMA = 6 x 1.3 = 7.8TOLERANCE SPBCIFICA nON SPREAD = UPPER SPEC. . LOWER SPEC.
22.0 11.0 11.0
J10LERANCESPECI'fICATIQN SPREAD_ ill - 1.41Cp = PROCESS SPREAD - 7.8 -
SP CIFI AnOTARGET ----
10-1-1213 14-'5u7Isi920 2d'-:!3L I--- PROCESS SPREAD ----I '
TOLERAN E SPECI~ICATIQ SPREAD----,-----,---,------10 1.I 12 13 14 15 I~6 17 18 19 20 :!I 22 23
Fig. 2
Cpk calculation from datu in .fig. 2:
Cpk - UPPER SPECIFICATION LIM.iT - MEAN3 x.S.IGMA
= 22.0 • .17.5 = 1.153 It 1.3
M~AN = Process AverageSigma = Standard Deviation of Process
'Generally. file minimum accepted values forboth Cp and Cpk are 1.33, which is equal to 75%of the tolerance for a 6 Sigma analysis. The eindices give am indication of how well the pro-ce . is making the product according to de ignor manufacturing specifications. Also, note thatwhen the mean of the process is equal to thetarget value of the tolerance specification, thenCp = Cpk. The CpkcalcuJation from data intheprevious example is shown in Fig .. 3.
It is also important to remember that thecapability indices Cp and Cpk are based onrwoelements: the de ign tolerance and the standarddeviation oflhe process, You can see, given thesame data, we can change the tolerance to makethe capability look better or wor e for a givendistribution. But the important element ill thecapability equation is the tandard deviation(Sigma) of the measured distribution, and wecall not change tilat Uiii less we chan ge at least oneof the preces element .
ApplyingProce s Control -What Should .BeDonei?
In a word or two, precess control requiresthat the entire manufacturing process be ex-amJned from the forging coming in the doorto the tlinal shlipment of the gear. Whereprocess capability uidies are taken on eachindividual manufacturing operation to establishcapability, control charts and plan mill I bemaintained on 8. continuous basis to monitorperformance capability .. AI 0, do not forget theassumption . made in the beginning about thedesign, engineering specifications, and qualitycontrol method employed.
AppJying Procecs 'Control. -Where Do We Start?
One of the most meaningful and eye-openingactivities a gear manufacturer C8_n pursue is theaudit of everal lots of finished gearing. Basi-cally, it is a comprehensive self-asse ment ofyour gear manufacturing capability. Select. avariety of gearing ba ed on pitch diameter, dia-rnetral pitch.and quality class required. Use lotsizes of at least. twenty-five pieces and inspectall. criticalgear-related characteristic . Analyzethe result. using statistical methods, Now an-swer tile following question:
I. Are allthe characteristies inspected withinprim specification?
SpecificatiQIl------ ,Target
I/.0·1 --------~-23
f-PROCESS SPREAD---j
,24 (lEAR TECH/oIOLOQY
2. After statistically analyzing the dataarethe 6 Sigma values calculated less than tiletolerance specification for that characteristic?
3. Are the data distributions centered withrespect to the specification limits? Remember,Cp and Cpk values of 1.33 are generally theminimum accepted numerical value.
If the answer to Questions 1, 2, and 3 are"yes." and the calculated Cp and Cpk values aregreater than 1.33, one should feel very confidentabout the quality of the overall gear manufactur-ing operation. Probably SPC techniques to moni-tor all manufacturing operations are already inuse and the exact performance capability of eachand every process in the plant is known.
If the answer to anyone of the questionsabove is "no," there is work to be done. If thediscrepancies are few and the manufacturingoperation has a formal process control. systemin place, corrective action may not be muchmore than trouble-shooting a specific processoperation. If the discrepancies are many. arecritical characteristics. and the manufacturingoperations are weak in the areas of SPC andprocess controls, a great deal of work will.need to be done,
Applymg Precess Control -Perform Capability Studies
Knowledge of the performance capability ofa process is essential to the overall concept ofproducing a quality gear. If the equipmentselected and used is sufficiently accurate to meetquality requirements, an acceptable gear can beexpected. When the quality is marginal orunsar-isfactory, or when the processing equipmentcannot meet the quality requieements, then theadditional costs of scrap. rework, decreased pro-ductivity, and warranty result.
A process capability studyis a technique formeasuring that which a process is capable ofproducing under normal, in-control conditions.In a capability study, measurements of gearsproduced in a run are analyzed to determinewhether or not the process is capable of produc-ing, to specifications, a given characteristic onsucces ive part under production conditions,Process capability is a measurement of the inher-ent precision of a manufacturing process.
Applying Process Control -Identifying the Process
Elements era CapabilUy StudyThere are numerous combinations of manu-
facturing processes that can be used to producean acceptable gear. Manufacturing engineeringhas the latitude to select the process to be used,depending on the capability of the equipmentavailable and the available open capacity.
The results of capability studies show whatis causing the "assignable" variation and whatmust be done to get it out ofthe process. Oncethis variation is eliminated, true process capa-bility results.
In most processes, a capability study willshow a large amount of initial variation. Ifcapability studies have not been made on theproces previou ly, the "assignable" variation islikely to be the greater part of the total varia-tion .. Itis most likely the variation that gets thehop into the most trouble, The process capa-
bility study will work to detect and reduce oreliminate the "assignable" variation.
Table 1
I. MAN· Training on equipment and procedures· Work day fatigue/awarene s· Setup skill & operating skill· Operator and operator changes
2. MACHINE· Quality capable· Machine alignment· Spindles· Draw· Speeds, feeds, and thermal growth· Rigidi.ty· Balance· Machine maintenance & lubrication
3. MATERIAL..Material hardenability· Material chemistry· Microstructure· Hardness· Machinability· Material cleanliness..Dimensional characteristic
(diameters, lengths, parallelism, runout)· Geometrical considerations
(rims, webs, thickness, position)4. METHODS
· Workholding equipment type & condition· Workholding rigidity· Coolant. type and volume· Cutting tool quality. new & resharpened· Cutting method
(hob, shape, bear speed. mill, broach)· Material handling system
MARCH I APRIL 1992 2:5
EXAMPLE IHYPOm/SPIRAL BEVEL GEAR. AND PINION SET PROCESSING
II'
PRE· TREATMENT NORMALIZE
K.W.LIU.:1~IN...l,;G...·· - PROFILE TURNING- BROACHING- HOLE DRILLING- IDENTIFICATION
TOOTH CUTTING - MACHINE SETUP
GREEN TEST - CUITING SETUPAPPROVAL
- SIZE AND CONTACTCOMP~RISON TOPRODUCTI.ON "REF'.
- INSPECTION
BURRING. CHAMFERING
HEAT TREAT - CARBURlZE ANDQUENCH
- BORE SIZE- GEAR GEOMETRY
HARD GRINn - BORE I.D.
MATCH AND LAP'·,R
HARDFJN~SH
, PROTECT
26 G E "FI T E.C H N 0 lOG ...
PINION
FORGING
BLANKrNG - PROFI~E TURNING- SPLJNJNG- GREEN GRJNDfNG- THREADING- mENTIHCA TION
TOOTH CUTTING - MACHINE SETUP
- CUITING SETUPAPPROVAL
- SIZE A -0. CONTACTCOMPARISON TOPROD CTlON "REF"
-INSPECHON
BURRING, CHAMFERING
~2A~~.AT - CARBURIZE ANDQUENCH
- INDUCTION ANNEAL- STRAIGHTENING
HARn GRINn - BEARING JOURNALS
- REdNE TOOTH SURFACES ORACCEPTABLE TOOTH CONTACTSAND NOISE LEV L
- MONITOR Fm[SHlNG OPERA TJON
- PHOSPHATE COA TlNG FOR BREAKIN, RUST PROOFING" ANDmENTIF]CAT~ON
- ASSEMB! Y LINE OR CUSTOMER
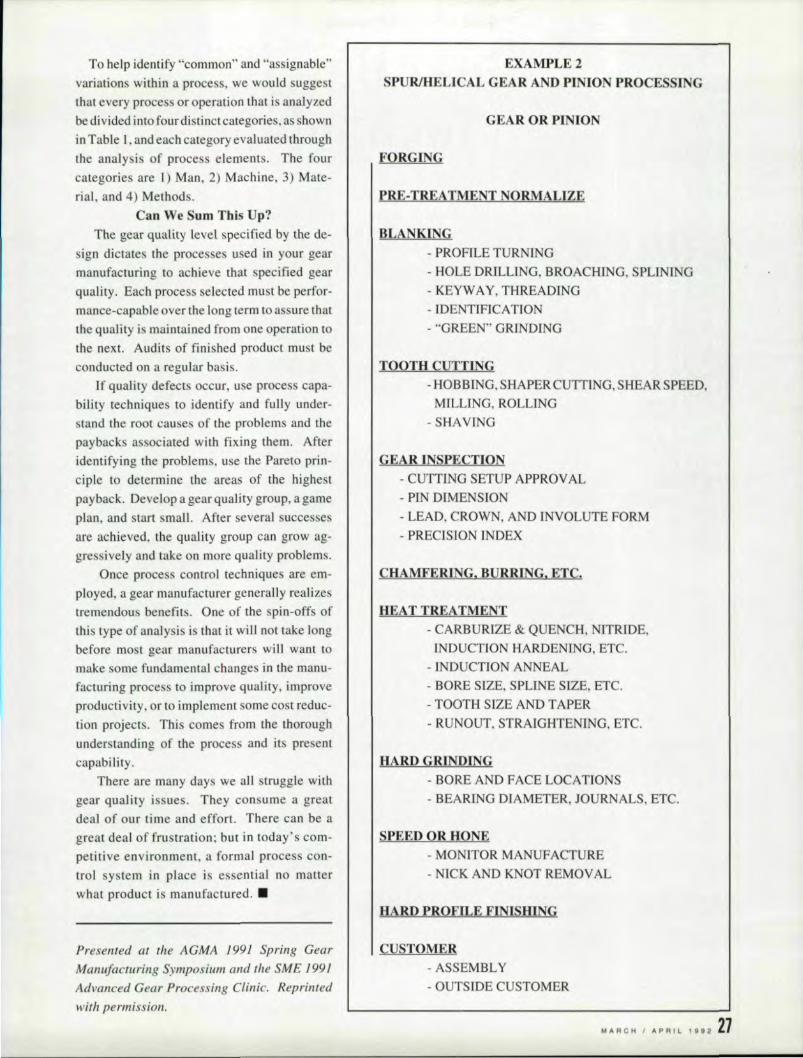
To help identify "common" and "assignable"variations within a process, we would suggestthat every process or operation that is analyzedbe divided into four disti net categories, as shownin Table I, and each category evaluated throughthe analysis of proces elements, The fourcategories are I) Man, 2) Machine, 3) Mate-rial. and 4) Methods,
Can We Sum This Up?The gear quality level specified by the de-
sign dictates the proces es used in your gearmanufacturing to achieve that specified gearquality. Each process selected must be perfor-mance-capable over the long term to assure thatthe qualityi maintained from one operation tothe next. Audits of finished product must beconducted on a regular basis.
If quality defect occur, use process capa-bility techniques to identify and fully under-stand the root causes of the problems and thepay backs as ociated with fixing them. Afteridentifying the problems, use the Pareto prin-ciple to determine the areas of the highestpayback. Developagear quality group, a gameplan, and start small. After several successesare achieved, the quality group can grow ag-gressively and take on more qualiryproblems.
Once process control techniques are em-ployed, a gear manufacturer generally realizestremendous benefits. One of the spin-offs ofthis type of analysisis that it will not take longbefore most gear manufacturers will want tomake some fundamental changes in the manu-facturing process to improve quality, improveproducti vity, or to implement some cost red uc-tion projects. This comes from the thoroughunderstanding of the process and its presentcapability.
There are many day we all struggle withgear quality issues. They consume a greatdeal of our time and effort. There can be agreat deal of frustration; but in today' s com-petitive environment, a formal process con-trol system in place is essential no matterwhat product is manufactured, •
Presented at the AGMA 1991 Spring GearManufacturing Symposium and the SME 1991'Advanced Gear Processing Clinic. Reprintedwith permission.
EXAMPLE 2SPURJHELICAL GEAR AND PINION PROCESSING
GIEAR OR PINION
FORGING
PRE- TREATMENT NORMALIZE
BLANKING- PROFILE TURNING- HOLE DRILLING, BROACHl G, SPU ING- KEYWAY, THREADING- IDENTIFICATION- "GREEN" 'GRINDING
TOOTH CUTUNG-HOBBING,SHAPERCUlTING,SHEARSPEED,
MILLING, ROLLING- SHAVING
GEAR INSPECTION- CUTT1NG SETUP APPROV AL- PIN DIMENSION- LEAD, CROWN, AND INVOLUTE FORM- PRECISION INDEX
CHAMFER.lNG. BURRING" ETC.
HEAT TREATMENT- CARBURIZE & QUENCH, NITRIDE,
INDUCTION HARDENING, ETC.- INDUCTION ANNEAL- BORE SIZE, SPLINE SIZE, ETC.- TOOTH SIZE AND TAPER- RUNOUT, STRAIGHTENING, ETC.
HARD GRINDING- BORE AND FACE LOCATIONS- BEARING DIAMETER, JOURNALS, ETC.
SllEED OR HONE- MONITOR MANUFACTURE- NICK AND KNOT R MOV AL
HARD PROFILE FINISHING
I CUSTOMER- ASSEMBLY- OUTSIDE CUSTOMER
MAR CHI APR I L I 9 9 2 21