appraisal of a proposed loan to file cuoy india for a...
TRANSCRIPT
Report No. 1158-IN FIL CA hpy
Appraisal of a Proposed Loan to FILE CUOYIndia for a Second Line of Credit to theIndustrial Development Bank of India for theState Financial CorporationsMay 6, 1976
Agriculture Credit & Development Finance Companies DivisionSouth Asia Projects
FOR OFFICIAL USE ONLY
Dpcument of the World Bank
This document has a restricted distribution and may be used by recipientsont', in the performance of their official duties. Its contents may nototherwise be disclosed without World Bank authorization.
Pub
lic D
iscl
osur
e A
utho
rized
Pub
lic D
iscl
osur
e A
utho
rized
Pub
lic D
iscl
osur
e A
utho
rized
Pub
lic D
iscl
osur
e A
utho
rized

CURRENCY EQUIVALENTS
US$1.00 = Rs 8.0 *Rs 1 - US$0.125Rs 10 million - US$125,000Rs 1.0 billion - US$125 million
Until September 24, 1975, the Rupee was officially valued at a fixedPound Sterling rate. Since then it has been fixed against a 'basket'of currencies. As these currencies are floating, the US Dollar/Rupeeexchange rate is subject to change. Conversions in this report havebeen made at US$1 to Rs 8.00, which was the short-term average rateprevailing at the time of appraisal.
FISCAL YEARS
GOI, SFCs: April 1 - March 31
RBI, IDBI: July 1 - June 30

FOR OFFICIAL USE ONLYLIST OF ACRONYMS
APSFC - Andhra Pradesh State Financial CorporationAFC - Assam Financial Corporation
BITCO - Bihar Industrial and Technical Consultancy OrganizationBSFC - Bihar State Financial CorporationCGAC - Capital Goods Adhoc CommitteeDCSSI - Development Commissioner of Small Scale IndustryDFC - Delhi Financial CorporationDGTD - Directorate General of Technical DevelopmentGNP - Gross National ProductGOI - Government of IndiaGSFC - Gujarat State Financial CorporationHFC - Haryana Financial CorporationHPFC - Himachal Pradesh Financial CorporationHSC - Hindustan Steel CorporationICICI - Industrial Credit and Investment Corporation of IndiaIDBI - Industrial Development Bank of IndiaIFCI - Industrial Finance Corporation of IndiaIFD - Industrial Finance Department (of RBI)IIG - Inter-Institutional GroupIRCI - Industrial Reconstruction Corporation of IndiaJ&KSFC - Jammu & Kashmir State Financial CorporationKFC - Kerala Financial CorporationKSFC - Karnataka State Financial CorporationKITCO - Kerala Industrial and Technical Consultancy OrganizationLIC - Life Insurance CorporationLRS - Liberalized Refinanced SchemeMPFC - Madhya Pradesh Financial CorporationMSFC - Maharashtra State Financial CorporationMMTC - Metals & Minerals Trade CorporationNCAER - National Council of Applied Economic ResearchNEITCO - North Eastern Industrial & Technical Consultancy OrganizationNSIC - National Small Industries CorporationOSFC - Orissa State Financial CorporationPFC - Punjab Financial CorporationRBI - Reserve Bank of IndiaRFC - Rajasthan Financial CorporationSBI - State Bank of IndiaSFC - State Financial CorporationSI - Small Industries Service Institute
SSI - Small Scale IndustriesSSIC - Small Scale Industries CorporationSSIDC - State Small Industries Development CorporationsSSIDO - Small Scale Industrial Development OrganizationSTC - State Trading CorporationSIDA - Swedish International Development AgencyTIIC - Tamil Nadu Industrial Investment CorporationUPFC - Uttar Pradesh Financial CorporationUTI - Unit Trust of India
WBFC - West Bengal Financial Corporation
This document has a restricted distribution and may be used by recipients only in the performanceof their official duties. Its contents may not otherwise be disclosed without World Bank authorization.

INDIA
APPRAISAL OF A SECOND LINE OF CREDIT TO THE INDUSTRIALDEVELOPMENT BANK OF INDIA FOR THE STATE FINANCIAL
CORPORATIONS
TABLE OF CONTENTS
The Main Report
Page No.
SUMMARY AND CONCLUSIONS .............................. i-iii
I. INTRODUCTION ......................................... 1
II. THE INDUSTRIAL SECTOR ................................ 1Historical Performance ..... ............. 1Industrial Policy ............................... 2Recent Performance ..... ............... 3Recent Changes in Policy and Procedures ......... 4The Role of the Small and Medium Scale Sectors 5The Financing of Small and Medium Scale
Industries ................................. 6
III. INSTITUTIONAL FRAMFWORK .............................. 8Organization .................................... 8Utilization of IDA Credit ....................... 11Characteristics of IDA Financing .... ............ 12SFC Inspections ................................. 12Credit Guarantee Scheme ......................... 13
IV. THE STATE FINANCIAL CORPORATIONS ......... .. .......... 14The Role of the SFCs ............ .. .............. 14SFC Upgrading Program ............ .. ............. 16Summary Evaluation of SFC Operations ............ 16Resource Mobilization ........................... 19Policies and Procedures ........... .. ............ 20Resource Allocation ............. .. .............. 22Characteristics of Portfolio ........ .. .......... 23Financial Performance ............ .. ............. 24Relations with State Governments ........ ........ 27Reporting Requirements ........... .. ............. 27Prospects ....................................... 28
The report is based on an appraisal mission consisting of Messrs. M. Rowat,E. Elejalde, N. Fostvedt and E. Njomo that visited India in May/June 1975.
Page No.
V. OBJECTIVES OF THE CREDIT ......................... 29
VI. THE PROPOSED LENDING SCHEME ......... ............. 29
Volume I - INDUSTRIAL DEVELOPMENT BANK OF INDIA*
Volumes II and III - ASSESSMENT OF INDIVIDUAL SFCS*
*Volume I contains an assessment of the present position, prospects, androle in the economy of the Industrial Development Bank of India to complementthe analysis of its refinance activit:Les presented in this main report. Italso analyzes the institutional framework for industrial financing in India.Volumes II and III evaluate separately each of the 18 State Financial Corpora-tions and contain specific recommendations for improving their activities.All the issues that are relevant to the proposed credit are discussed inthis main report. Therefore, Volumes I to III will be made available onlyon request.

ANNEXES
1. State-wise position of Term Loans (including installmentcredits) granted by scheduled commercial banks to smallscale industries
2. IDBI - Organization Chart3. Summary Statement showing progress in the utilization of
IDA Credit as on February 29, 19764. Classification of Refinance Assistance sanctioned by Size
and Industry under the IDA Line of Credit as of June 30,1975
5. SFC-wise break-up of applications received/sanctioned/withdrawnrejected and closed/pending under IDA Credit as onFebruary 29, 1976
6. SFC-wise break-up of assistance disbursed by SFCs under IDACredit upto February 29, 1976
7. IDA Credit - Proposals cleared by CGAC upto meetingheld on February 29, 1976
8. SFCs - Financial and Economic Data on a Sample of IDBI Subprojects9. Position of claim applications (Credit Guarantee Scheme) from
State Financial Corporations as of June 30, 197510. Summarized list of main shareholders for all SFCs as of
March 31, 197511. Summary of SFCs Staffing Pattern as of December 31, 197412. Summary of Financial Resources as of March 31, 197513. Summary of Operations FY73-FY7514. SFC Loans sanctioned by size of unit and by State (FY75)15. Analysis of Arrears to SFCs as of March 31, 197516. Summary of SFC's Comparative Operational Ratios, FY73-FY7517. Estimated Disbursement Schedule for the Proposed Loan.


INDIA
APPRAISAL FOR A PROPOSED LOAN TO INDIA FOR A SECOND LINEOF CREDIT TO THE INDUSTRIAL DEVELOPMENT BANK OF INDIA FOR
THE STATE FINANCIAL CORPORATIONS
SUMMARY AND CONCLUSIONS
i. GOI has placed considerable emphasis on the promotion of smallscale industry (SSI) since the mid-1950's as a means of increasing employmentparticularly amongst new entrepreneurs, income distribution and regional dev-elopment. This has included the provision of substantial incentives such aslower interest rates and margin on loans, a list of 124 industries reservedexclusively for SSI, and a generous credit guarantee scheme. The SSI sub-sector was the subject of a Bank Study in 1971 though much of the data col-lected was considered unreliable. GOI is presently completing a new censuson SSI which should be available in the middle of 1976. This should formthe basis for a study which GOI will carry out to determine the financial andeconomic efficiency of selected industrial subsectors reserved for SSI inrelation to the level of Government incentives.
ii. GOI's initial instruments for financing the small scale industrialsector defined as investment in plant and machinery of less than Rs 1million) were the State Financial Corporations (SFCs), most of which wereestablished in the late 1950s to provide financing to the small scale as wellas the lower portion of the medium scale sector. During the 1960s, the commer-cial banks also became actively involved in financing SSI primarily throughworking capital loans. Nevertheless, term lending by commercial banks wasonly 75% that of the SFCs in 1974.
iii. Until 1973, Bank Group financing of industrial investment hasconsisted of medium and large scale units either through direct financingor through the financing of the Industrial Credit and Investment Corporationof India (ICICI). However, in view of the importance of SSI, a new projectwas developed to reach this industrial sub-sector for the first time. Speci-fically, an IDA Credit of $25 million was channelled through the IndustrialDevelopment Bank of India (IDBI) to 18 SFCs for relending to small and small-medium scale industry. A second and equally important objective of the Creditwas to upgrade SFCs through specific institution-building programs. Thisreport appraises a repeat project involving a $40 million proposed Bank loan.The objectives of this Loan are (i) to expand financial assistance to thesmall and medium scale industrial sectors and (ii) to contribute to the on-going institutional upgrading of the SFCs.
iv. IDBI is the largest industrial development bank in India and isGOI's instrument as the apex institution for all other financial intermedi-aries. Aside from its many other activities, IDBI provides refinance

- ii -
facilities to SFCs as well as other financial institutions. Under theexisting Credit, IDA finances the estimated average foreign exchange content(60%) of SFC loans refinanced by IDB[. As of April 21, 1976, slightly lessthan $23 million had been authorized for some 400 subprojects, and $6.1 mil-lion disbursed.
v. SFCs are responsible for providing medium and long term finance,underwriting facilities and guarantees to small and medium scale industrialunits, and had total outstandings of Rs 2.8 billion as of March 31, 1975.At the time of the first Credit, SFCs suffered from a number of weaknesses,including shortcomings in the qualityr of management and staff, inadequateprocedures and appraisal standards, high arrears and inadequate provisionsfor possible losses. In order to provide for improvements, specific up-grading programs were developed by I)BI, and the Industrial Finance Depart-ment (IFD) of RBI which until recently was responsible for the inspectionof SFCs. These were agreed with IDA during negotiations in 1972. Sincethen, considerable progress has been made, particularly in management,general operational procedures, and appraisal standards. However, otherareas such as the quality of portfoliLo have shown little improvement largelydue to the general economic downturn in 1974.
vi. In addition, over the past two years the upgrading programs them-selves have been found to be insufficiently detailed and not broad enoughin scope. Accordingly, revised upgrading programs were prepared by IDBI/IFDin March/April 1975 based on recommenidations by IDA. These programs, alongwith the debt service coverage limitation (para 4.35) will form the basisfor an agreement between IDBI and each SFC to enable the latter to be eligi-ble for withdrawal under the proposed loan. In addition, the Bank hasspelled out a number of recommendations tailored to the needs of each SFC.These recommendations will not form a part of the upgrading program per se,but IDBI and the SFCs will implement the recommendations to the maximum extentfeasible and IDBI will include a revi.ew of them in its annual reports to theBank on the SFCs. On February 16, 1976, the ownership of IDBI passed fromthe Reserve Bank of India (RBI) by GOI. With this change, most of IFD'sactivities have been transferred to I:DBI, and this should provide a moreeffective means to monitor the performance of SFCs. IDBI is in the processof reorganizing and decentralizing its operations. This should improve itscapability to fulfill its functions in an effective way.
vii. The proposed Bank loan of $;40 million is expected to meet theestimated foreign exchange requirements of the SFCs for the two-year periodbeginning July 1, 1976, the date by which the first Credit was expected tobe fully committed. As of April ?1, 1q76, there was slightly more than US$2million left uncommitted. The proposed project would be similar to thepresent Credit except that it is recommended that (a) the free limit beincreased to Rs 2.5 million for selected SFCs where IDA has authorized atleast two projects above the present free limit of Rs 1 million and (b) in

- ili -
the case of loans to SSI, technician entrepreneurs and for projects in back-ward areas, the proceeds of the loan would be onlent by IDBI to the SFCsat 8.0%, and relent to SFC borrowers at not less than 11.5%. In the caseof all other lending, the corresponding rates would be 8.75% and not less
than 12.0%. GOI would onlend the Bank loan to IDBI on terms satisfactoryto the Bank which are proposed at 7.75% (excluding 0.25% rebate for promptpayment) for all types of lending.


INDIA
APPRAISAL FOR A PROPOSED LOAN TO INDIA FOR A SECOND LINEOF CREDIT TO THE INDUSTRIAL DEVELOPMENT BANK OF INDIA FOR
THE STATE FINANCIAL CORPORATIONS
I. INTRODUCTION
1.01 The Industrial Development Bank of India (IDBI), which is fullyowned by the Government of India (GOI) 1/ has requested through GOI a loanfor a second line of credit to be relent to 18 State Financial Corporations(SFCs) for refinancing the estimated foreign exchange content of SFC loansfor small and medium scale industry. The loan would also assist in thecontinuous upgrading programs of individual SFCs. As of April 21, 1976,slightly less than US$23 million of the initial $25 million (Credit 356-IN)had been authorized by IDA for some 400 subprojects and $6.1 million dis-bursed. It is expected that the balance will be authorized by May/June 1976,and that by June 1976 disbursements of approximately $7 million will havetaken place. 2/ Consequently, a second project of $40 million to meet theestimated foreign exchange content of SFC loans for the two-year periodbeginning July 1, 1976 is recommended. Such a loan would be consistentwith GOI1's obJectives of promoting the small and medium-scale industrialsectors and at the same time, would continue to support the institution-building efforts within SFCs presently being undertaken by IDBI.
II. THE INDUSTRIAL SECTOR
2.01 An assessment of India's present economic position is contained inthe Bank's latest Economic Report No. 1073-IN dated March 29, 1976. Inaddition, an evaluation of the overall framework for industrial financingis contained in Volume I to this report.
Historical Performance
2.02 India's industrial output has grown on average by little more than3% per annum since 1965, which is almost the same growth as that of NNP.Both demand and supply factors have constrained the sector's expansion. Ofthe four possible engines of growth on the side of demand, namely exports,import substitution, derived demand from the growth of other major sectors,
1/ Previously, IDBI was a wholly owned subsidiary of the Reserve Bankof India (RBI), but ownership was transferred to GOI as a result of theimplementation of the Public Financial Institutions Law (Amendment) Acton February 16, 1976 hereafter referred to as the IDBI Act.
2/ The final date for acceptance of subproject applications was extendedfrom June 30, 1975 to March 31, 1976.

and government investment, all have been weak. Import substitution, wherereasonably simple, was virtually compllete by the middle 60s; exports havenever been a major factor, accounting even now for only 10% of the outputof engineering goods, for example; the relatively slow growth trend of agri-culture of little more than 2% has restricted growth in demand for consumergoods; and, finally, government real investment has remained stagnant.Industrial growth has also been periodically constrained by transportbottlenecks, and by shortages of power, which was especially severe in1973 and 1974, and of raw materials siuch as steel, other metals, and agri-cultural inputs like cotton. Since these raw materials are tradeable goods,the latter shortages are merely a specific manifestation of the scarcity offoreign exchange.
2.03 The Government dominates production in steel, heavy plant andmachinery, mining, power generation, and increasingly in aluminum, ferro-alloys, machine tools, fertilizers, and other "basic" industries. Con-sequently according to the 1970 Annual Survey of Industry, the public sectoraccounted for 60% of productive capacity. However, it generated only 22Zof value added. This relationship cannot be explained solely by the capitalintensity of these industries, but is also the result of low capacityutilization - itself partly caused by poor management. However, low capa-city utilization has also been a problem in the private sector, mainly asa result of supply shortages and to a certain extent from lack of demandespecially for capital goods.
2.04 There have been slow shifts in the structure of industrial pro-duction, in accordance with the aims of industrial strategy. In 1960, 40%of output was of textiles and processed foods. This had fallen to 25% by1970. Instead "basic industries", engineering goods and chemicals, hadrisen to 40%. However, since 1965 the structural change has been quiteslow, and there has even been a decline in the share of capital goods inindustrial production.
Industrial Policy
2.05 The Government has placed central emphasis on rapid industrializa-tion as the key to development. Its goals in industrial policy have alsoincluded both greater equality and national self-sufficiency. The aim ofinhibiting concentration of economic lpower has been approached through ex-panded public ownership, restrictions on the growth of "large houses" and"dominant undertakings"; reservation of many products to the small-scalesector as well as special assistance to it; and, finally, support fordevelopment in backward regions. The aim of self-sufficiency has largelymanifested itself in the relentless pursuit of import substitution, as wellas curtailment of foreign owned firms and other forms of foreign involve-ment in industry.
2.06 The last decade must be regarded as a disappointment, as far asthe achievement of the key aim of rapiLd growth is concerned. While therehas been some progress towards the other goals, it is far from evident

- 3 -
that, in a wider context, such progress should be regarded as conduciveto production. Import substitution was clearly a major and successful spurto growth up until the middle 1960s, but since then the high cost inefficientindustries that have been created have acted as a major impediment to ex-pansion of exports. Since the latter offers one of the few means ofaccelerating growth, this is a significant cost. The emphasis on indepen-dence from outside technology, when combined with the fragmentation ofindustry and consequent limitations on domestic product development, hasfrequently resulted in the production of outmoded industrial goods. Al-though such goods may often not be inappropriate for Indian circumstances,they are difficult to export. The control of large houses and the encourage-ment of the small-scale sector has had effects on income distribution whichare simply unknown.
2.07 The main instruments of industrial policy have been centrallicensing of investment and imports, as well as physical allocation of"scarce" domestically produced raw materials, and controls on industrialprices. This system has itself tended to conflict with other aims,especially that of curbs on economic concentration since large firms aremuch better able to bear the overhead costs of dealing with a centralizedbureaucracy. Controls have also restricted the ability of firms to respondto changed opportunities, especially in overseas markets, and thus hamperedexports. The extent of excess capacity indicates that the planning supposedto underlie the industrial licensing system has been far from fully success-ful. Finally, price controls appear to have had a harmful effect on invest-ment and modernization in such crucial industries as cotton textiles, sugar,
and cement.
Recent Performance
2.08 In 1973/74 industry grew by 1%, and in 1974/75 growth was 2.5%.Through these years, the major effective constraint appears to have beenthat of raw material supply. However, the situation changed rather dramatic-
ally during 1975 and demand is currently the more serious problem. Theimprovement in supply of inputs has been partly the result of large increasesin the output of key public industries, especially steel and coal. Steelouput rose from 4.5 million tons in 1973/74 to 4.9 million tons in 1974/75and is expected to rise by a further 1 million tons in1975/76. After yearsof stagnation, coal output rose by 13.5% in 1974/75, or by about 10 milliontons, and is expected to rise by a further 10 million tons in 1975/76. (Thisimprovement in performance has, in fact, been a feature of quite a largenumber of public sector enterprises). The rise in production of coal combinedwith good rains has led to increases in power generation which are expectedto be of the order of 20% in 1975/76. Finally, increased aid disbursementsas well as improved export performance have been the main factors in reducingthe foreign exchange constraint, as perceived by the Government and haveallowed a marked liberalization of import controls.

2.09 Thus, major constraints on supply have been reduced or removed,while 1975/76 is clearly going to be a record year for agricultural pro-duction. Industrial growth for 1975/76 should reach 4 to 5%. While amajor expansion of intermediate output has occurred, there has been a fallin the domestic demand for many industrial goods. However, this conjunctionhas at least had a positive effect on. exports, especially of steel, whichwill be about one million tons. Weak domestic demand has been partly theresult of a tight credit policy motivated by the overwhelming desire to curbinflation. Commercial credit during the first part of 1975/76 grew by only2%. In addition, the very success of counter-inflationary policy has in-creased enormously the real cost of holding inventories and this, in combina-tion with action against "smugglers, hoarders, and black-marketeers", appearsto have led to a marked fall in holding of stocks. At the same time, therehas been a lag between increased agricultural income and a rise in consumerdemand. Export demand has been weak and in some sectors, such as jute andcotton textiles, disastrously so. Finally, increased real public sectordevelopment expenditures have not yet significantly affected the capitalgoods sector, and private investment demand continues to be in the doldrums.However, in 1976/77 increased consumer demand, required by tax reductions inthe budget, and increased public development expenditure, combined with theeasy availability of raw materials could lead to accelerated growth.
Recent Changes in Policy and Procedures
2.10 In the face of poor industrial performance and much underutilizedor inefficiently utilized capacity, the Government has been reconsideringparts of its strategy. It is increasingly acknowledged that existing capa-city must be utilized more efficiently; that public sector enterprisesshould be expected to meet more commetrcially oriented criteria for output,price, and profitability; and that with the slow growth of the domesticeconomy, industry can only expand at a reasonable rate through exporting.
2.11 The process of revising policy has been taking place for sometime, but the first discernible signs; emerged in 1972. Subsequently, theGovernment has introduced measures to simplify procedures and to introducemore flexibility. By now, licensing of new capacity and of expansion forexports is freely available; in the case of enterprises belonging to largeindustrial houses and foreign majority companies, export obligations areset. For the domestic market, licenses are also freely available, exceptfor industries reserved for the small scale sector, and except for thelarge industrial houses and foreign miajority companies which are confinedto a priority list of industries, which has, in fact, been fairly broadlydefined. Processing time for license!s has been very much reduced so thatthe obstacle posed by licensing procedures has been virtually eliminatedfor all except the large houses and foreign majority companies, and evenfor them there are fewer hurdles. By the beginning of 1975, price controlhad been lifted from all finished manufactures. Certain intermediateproducts are still subject to formal price controls largely as a resultof the fact that the Government is the main producer. Distribution controlon industrial materials has been lifted for almost all items.

- 5 -
2.12 These various changes mark a significant effort on the part ofGovernment, but the major structural problems of the sector remain. Insummary form, these are that many public sector undertakings still have along way to go before they become efficient producers. The private sectorwill be the main source of exports. Thus, structural changes to improvecompetitiveness will be vital. These may require adjustment in policiesthat lead to industrial fragmentation and inadequate expansion of efficientfirms. The dilemma before the Government is to formulate this strategy ina way that is still consistent with its social goals.
The Role of the Small and Medium Scale Sectors
2.13 GOI has placed considerable emphasis on promoting both of thesesectors, particularly the small scale sector 1/, to increase employment 2/,income distribution, and regional development.
2.14 The small-scale industrial sector (SSI) in India was the subjectof a Bank study in 1971 in cooperation with the Swedish International Develop-ment Authority (SIDA) and the National Council of Applied Economic Research(NCAER) of India. Report No. SA-33a entitled "Small Scale Industry in India"dated May 22, 1972 summarized their findings. This report described theindustrial sector (SSI), its present source of financing, made an assessmentof its economic importance in relation to the total industrial sector andattempted to evaluate the policy framework for SSI. Most of the data per-taining to SSI are based on the Annual Survey of Industry (1970) which isnow considered to be unreliable. However, GOI is presently conducting acensus of the small-scale sector, the results of which should be availablein the middle of 1976.
2.15 This is of critical importance since there is insufficient informa-tion available at present on the size, structure, growth and economic effi-ciency of SSI in order to evaluate in a meaningful way GOI's policies in thissubsector. Specifically, SSI units have been granted a variety of incentivesincluding lower rates of interest and security margin on loans, governmentprocurement of SSI output at favorable prices, simplified licensing pro-cedures, and the availability of a Credit Guarantee Scheme (para 3.20-3.22).In addition, GOI has reserved a list of 124 manufactured items exclusivelyfor SSI. It is possible that GOI's overall incentive scheme has perhaps beenover-generous. To explore this question further, GOI will complete withina year a study of the financial and economic efficiency of SSI in selectedsubsectors in relation to the level of incentives SSI presently receives.GOI has also launched a "Program of Modernization for Selected Small ScaleIndustries" with the objective of improving the productivity of small scale
1/ In June 1975, GOI amended its definition of SSI to include units withinvestment in plant and machinery of less than Rs 1 million (excludingcottage industries) and Rs 1.5 million for ancillaries. The "old"definitions of Rs 750,000 and Rs 1 million respectively are used inthe statistical references throughout the report.
2/ It is estimated that SSI employes about 4 million people.

- 6 -
enterprises (including quality improvement and cost reductions) to contri-bute to a better export performance. The total cost of the program would beRs 4.9 billion over 5 years to finance the purchase of equipment, rawmaterials and technical assistance. This would also be more effectivelyevaluated once the new census is available.
2.16 Investment, however, cannot and should not come to a standstillwhile studies are conducted to assess and evaluate the impact of Governmentpolicies. To the extent that there are questions and doubts about policies,however, it is all the more important to ensure that new investments aredirected to activities which are economically sound and financially viable.The experience under the first IDBI/SFC project has demonstrated that suchprojects exist in the small and mediumn scale sector and that properlystrengthened State Financial Croporations (SFCs) can be instrumental inidentifying and appraising these projects. Ultimately, of course, the ex-perience of the SFCs (their successes as well as their failures) will pro-vide valuable data by which to assess the effectiveness of the policy frame-work. Indeed, the study referred to (para 2.15) should make considerableuse of the data already accumulated by the SFCs.
The Financing of Small and Medium Scale Industries
2.17 State Level Institutions. The financing of small-scale and thesmaller end of medium-scale industry has largely been undertaken by State-level institutions and the commercial banks 1/. The State Financial Corpora-tions (SFCs) have been the most important sources of term loans over theyears, having accounted for Rs 2.8 billion in outstanding as of March 31,1975 2/. Moreover, the Small Scale Iridustrial Corporations (SSICs) alsoprovide a modest amount of financial aLssistance through hire purchasefinance. Hire purchase finance for bcoth imported and domestic equipmentis also provided by the National Small Industries Corporation (NSIC) on anall-India basis, and amounted to Rs 47.2 million in FY75.
2.18 Commercial Banks. Historically, commercial banks in India haveplayed an important role in financing industry, both medium- and large-scale as well as small-scale. Since 1969, when 14 commercial banks werenationalized, lending by commercial baLnks has become a more direct instru-ment of Government industrial policy (though this emphasis had alreadybegun several years before nationalization) in that priority has been givento financing the small-scale sector, and also to establishing a sufficientbranch network to cater to this group. At the same time, outstanding creditto the small-scale sector increased from Rs 2.9 billion in June 1969 toRs 7.5 billion as of September 1973. The proportion of total bank lendingto small industries increased from 7.9% in June 1969 to 11.9% in September1973. In the case of branch development, commercial banks had 8,632 branchesin 1969, and in the past five years the number has doubled to 16,936.
1/ The all-India financial intermediaries (para 2.20) also finance mediumscale industry but have tended to finance only those projects thatare beyond the limit of the SFCs (paras 3.05 and 6.04).
2/ A detailed discussion of the SFCs is contained in Chapter 4.
2.19 The commercial banks have also become active in term lending. Asof June 1974, the scheduled commercial banks had Rs 1.6 billion in termloans outstanding to the small-scale sector, which is about one-half theRs 2.8 billion in total outstanding financial assistance by the SFCs atMarch 31, 1975 (Annex 1). The former represented loans to about 45,000small-scale enterprises. The rate of interest charged by commercial bankshas gradually increased over the past few years, ranging between 12.5% and15% in FY75, the lower rate representing the minimum that can be chargedexcept for some specific priority sectors. Penalty fees in some caseswere as high as 4%. For term loans, maturities were generally up to sevenyears. The higher interest rates stem from GOI's policy of credit restraint,which has forced commercial banks to make more active use of IDBI's refinancefacilities (para 3.09).
2.20 Given the perhaps excessive number of financial intermediaries,there is considerable need in most states for improved coordination amongststate-level institutions involved in small and medium scale assistanceincluding SFCs, SSICs, commercial banks, SIDCs 1/, SISIs, as well as withthe all-India financial intermediaries including ICICI, 2/ IDBI, IFCI, 3/LIC 4/, UTI, 5/ and NSIC. GOI and IDBI intenid as a first step to revive Inter-Institutional Group (IIG) meetings (in those states where they are dormant).Secondly, mechanisms for coordination at the small-scale level will beadopted, including cross-representation on Boards of Directors and periodicmeetings to review joint financing proposals and clients in arrears, whenthis is not already being done.
2.22 Technical Assistance. SSI technical assistance is available froma variety of sources. A Ford Foundation recommendation in 1954 led to theestablishment of a GOI project authority for SSI which came to be known asSSIDO 6/, headed by a Development Commissioner for Small-Scale Industry(DCSSI). This institution was designed to coordinate the development ofSSI through promotional work, training, publicity and export promotion,though the institution has never had more than an advisory role. SSIDO isrepresented at the State level by 16 Small Industries Service Institutes(SISI), as well as by the State Director of Industries, the former providingtechnical and economic assistance to entrepreneurs. In a few States, thequality of work appears to be reasonably good, though by and large the SISIunits including their branches and extension centers need improvement. Thisshould be accomplished in conjunction with the Modernization Program (para2.15). Commercial banks have also begun to become active in technicalassistance of a managerial nature which has been pioneered by the FirstNational City Bank and the State Bank of India. Finally, the SFC's pro-vide a modest amount of technical assistance as part of their routinefollow-up work.
1/ State Industrial Development Corporation.
2/ Industrial Credit and Investment Corporation of India.
3/ Industrial Finance Corporation of India.
4/ Life Insurance Corporation.
5/ Unit Trust of India.
6/ Small Scale Industrial Development Organization.

- 8 --
III. INSTITUTIONA]. FRAMEWORK
Organization
3.01 Prior to the implementation of the revised IDBI Act in February1976, the institutional mechanism for providing assistance to the small andriedium-scale sectors involved the RefiLnance Department of IDBI, 1/ theIndustrial Finance Department (IFD) of- RBI, and the SFCs themselves. Insummary, the Refinance Department was responsible for the full processingof all SFC loan applications, while IFD was responsible for the inspectionof SFCs through periodic visits, for iinstitution building and for operationof the Credit Guarantee Scheme (paras 3.20-3.22).
3.02 At the time of the first project the plan was to create threedivisions wThin the Refinance Department in the Bombay Office (Appraisal,Operations, and Follow-up). However, up to the time of the implementation ofthe IDBI Act, IDBI had created only an IDA cell to handle those applicationsfalling under the IDA Credit, while no other reorganization had taken placebased on the uncertainty of the then pending IDBI Bill. IFD's reorganizationwas likewise postponed.
3.03 As a result of the implementation of the IDBI Act, the functionsof IFD, except for the operation of the Credit Guarantee Scheme, have beentransferred from RBI to IDBI. At the same time, IDBI has been reorganized.The new organization chart is shown in Annex 2. There are now three depart-ments of special importance for the SFCs.
(a) The SFC Department, covering the SFCs and other State levelagencies, which will be responsible for policy questionsand inspections;
(b) The Refinance Department, covering domestic refinanceprojects;
(c) The Import Loans Department, covering, inter alia, allrefinance in foreign currency, including the Bank/IDA projects.
In addition, IDBI has decentralized iits operations to a considerable extent.For refinance cases, the regional offLces have now been delegated authorityup to Rs 3 million, compared to Rs 300,000 2/ previously. Since, under theSFC Act, the SFCs cannot sanction loans of more than Rs 3 million, all re-finance cases will be decided in the regional offices, which should greatlyassist the implementation of this project.
1/ A detailed discussion of the IDBI is contained in Volume I. This volumereflects the position prior to the implementation of the revised IDBIAct. A report, discussing the present status of the IDBI, is underpreparation in connection with the proposed Credit to IDBI for itsdirect lending operations.
2/ The Deputy General Manager at the New Delhi regional office hadsanctioning powers up to Rs 500,000.

- 9 -
3.04 IDBI refinances loans with a minimum maturity of 3 years (sinceamended, para 3.10, footnote 1) granted to industrial concerns by SFCs, com-mercial banks, cooperative banks and any other notified institutions.Historically, SFCs have been the largest users of the facility, though com-mercial banks have had to make more use of it recently on account of thecredit squeeze. It is anticipated that once the credit squeeze has eased,the commercial banks will, by and large, revert back to using their ownfunds to finance industrial investment.
3.05 Policies. IDBI's policies on refinance are as follows:
(a) The extent to which it refinances a single financialinstitution is normally limited to three times theinstitution's equity.
(b) All types of industrial enterprises are eligible.However, primary consideration is given to privatesector enterprises with a net worth of less thanRs 25 million.
(c) The purpose of the loan to be refinanced is normallylimited to the acquisition of fixed assets, but aportion of the loan may also be for working capitalrequired on a term basis.
(d) The minimum size of loans to be refinanced is Rs 0.2million in normal cases, Rs 20,000 for loans to smallroad transport operators, and Rs 10,000 for loans tosmall-scale enterprises guaranteed under the CreditGuarantee Scheme.
(e) It normally refinances up to 80% of the original loanamount but the coverage can go up to 100% for small-scale enterprises and projects in backward areas.
(f) The credit risk is fully assumed by the financialinstitution which directly lends to the industrialenterprise.
3.06 Staff. Over the past two years, the professional staff in the oldRefinance Department (excluding Regional Offices) had increased from 29 to 39.However, it was still understaffed, not only in terms of original expectations,but also because of the enormous increase in applications in the past yeardue to the credit squeeze (para 3.09). Thus, it was considered essentialthat IDBI increased the staff doing refinance work to handle the increasedworkload. The implications in terms of staffing requirements of IDBI'sreorganization are not yet clear. However, the decentralization shouldreduce significantly the burden on the Bombay office, whereas the need forstaff in the regional offices has increased (para 3.07).
- 10 -.
3.07 Regional Offices. IDBI has three regional offices, plus the BombayOffice. Now, a new regional office in Ahmedabad, to cover the country'sWestern Region will be established. These offices are responsible for ongoingcontact with SFCs in their respective regions. Included in this are thereceipt, processing, ratification and follow-up action on all applicationsfor refinance. Previously, regional managers had sanctioning powers on appli-cations up to Rs 300,000 (New Delhi Rs 500,000), while all other applicationswere forwarded to Head Office. Now, all sanctions except in special caseswill be decided in the regional offices. In 1976 IDBI introduced a liberalizedrefinance scheme (LRS), which enabled It to grant on a near automatic basisrefinance of loans up to Rs 200,000 to SSI units covered under the CreditGuarantee Scheme and to small road transport operators. This was extended tocommercial banks on February 1, 1975.
3.08 Before the reorganization, the number of staff devoted to refinanceactivities at the regional offices appeared to be grossly inadequate, andhad led to a large backlog in the processing of applications (para 3.09).The New Delhi, Calcutta, and Madras Offices had only two staff each devotedto the processing of refinance cases. The reorganization will lead to aneven greater need for additional staff in the regional offices. IDBI hasconfirmed that these offices will be strengthened with more technical andfinancial officers, as well as with other supporting staff. This will bedone gradually on the basis of the work load. An export credit cell, hand-ling, inter alia, Bank/IDA refinance cases, will be set up immediately inall regional offices. There will be at least two officers in each regionaloffice handling Bank/IDA cases which appears sufficient.
3.09 Refinance Operational Results. 8,870 applications under therefinance scheme were received in FY75, or more than double the levelin FY74 (4,353). 1/ Thus, total sanctions increased from Rs 419 million(2,665) in FY74 to Rs 1.1 billion (6,390) in FY75. Disbursements increasedfrom Rs 277 million to Rs 524 million. This substantial growth placedan usually heavy burden on the staff. During FY75, 1,481 applicationswere either rejected or withdrawn compared to 1,144 in FY74. At the endof March 1975, there were 1,802 refinance applications pending with IDBI(including Regional Offices) compared to 778 at the same time the previousyear. The only region to show an absolute improvement in processing wasthe New Delhi Office where the Deputy General Manager had the highestsanctioning power and had also attempted to streamline processing procedures.
1/ SFCs accounted for 73% of such assistance in FY75 with the balancerepresented by commercial banks, t;he latter the result of the creditsqueeze.

- 1 1 -
Utilization of IDA Credit
3.10 Procedural Reform. GOI procedures for clearance of the importationof capital equipment under the IDA Credit were considerably improved andliberalized in 1972/73. Their main aspects are: 1/
(a) Irrespective of the size of the loan or the valueof imports, all proposals are now considered by theCapital Goods Ad Hoc Committee (CGAC) which meetsevery week;
(b) Applications involving imports of small value (Rs 0.75million or less) bypass the advertising procedurewhich was previously required to certify domestic non-availability of the machinery;
(c) The SFC concerned is now entitled to issue the"essentiality certificate" 2/ for the proposed machineryin lieu of the State Government; and
(d) IDBI's New Delhi Office is assigned the secretarialwork for the CGAC, preparing a summary for eachapplication, attending the CGAC meetings and keepingliaison with the Government Ministries, SFCs andapplicants.
3.11 Operational Results. On the basis of the estimates of the foreignexchange content of the first 150 subprojects under the first Credit, IDAagreed to increase its refinance percentage from 40% to 60% in March 1975.At the end of February 1976 SFC sanctions for projects eligible under theIDA scheme amounted to Rs 370 million (551 projects). IDBI's refinance ofsuch projects amounted to Rs 314 million (416 projects), for which it hadobtained authorization of about US$19.4 million equivalent. A detailedstatement of the progress in the utilization of the IDA Credit is containedin Annex 3. As of April 21, 1976, the authorizations had increased toslightly less than US$23 million, and the remainder was expected to beauthorized by May/June 1976. As of February 29, 1976 disbursements by SFCsamounted to Rs 124 million, while IDA disbursements as of April 21, 1976amounted to $6.1 million.
1/ In addition, IDBI itself has instituted a few reforms under the IDACredit including: (i) reduction of the minimum limit of loan foravailability of refinance for medium-scale units from Rs 200,000 toRs 10,000; (ii) reduction of the minimum period of loan from 3 yearsto 12-18 months and (iii) allowing refinance for acquisition ofsecond-hand machinery.
2/ Provides specific reason for the need to import a certain type ofequipment.

- 12; -
Characteristics of IDA Financing
3.12 Size of Assistance. A breakdown of IDA assistance by size ofloan is contained in Annex 4, and indicates that 80% of all sanctions(gross) by number and 63% by amount iLnvolved assistance of less thanRs 1 million.
3.13 Industrial Distribution. The distribution has been reasonablydiversified with the engineering subsector accounting for 25.7% of thetotal by amount followed by electrical machinery and appliances with 15.8%(Annex 4).
3.14 SFC. The largest recipienit of the IDA Credit has been MSFC(Maharashtra), which has accounted for sanctions of Rs 80.7 million (189projects), followed by TIIC (Tamil Nadu) with Rs 68.4 million (85 projects).At the other end of the scale, J&K SIFC (Jammu and Kashmir) has sanctionedonly two loans for Rs 0.6 million (Annex 5). The breakdown of disbursementsfollows a similar pattern (Annex 6), except that KSFC (Karnataka) has dis-bursed the most assistance so far. The number of import license applicationscleared by the CGAC as of February 2'9, 1976 is given in Annex 7.
3.15 Size of Unit. As of April 30, 1975, 59% by number and 38% byamount of IDBI sanctions under the IDA Credit involved small-scale units.
3.16 Economic Impact. Annex 8 shows the ex-ante financial and economicdata on a sample of 68 subprojects submitted to IDA for prior approval underthe first line of credit. The internal rate of return was expected to beabove 20% in 75% of the cases, with an unweighted average of 29%. Thedomestic resource cost (US dollar earned/saved) was calculated at belowRs 6.00 in 25% of the cases, and above Rs 9.00 in only 16%, with an un-weighted average of Rs 6.90. The average cost per job was $10,700; how-ever, it was below $5,000 in 29% of the cases. In addition, in a samplestudy of 76 projects accounting for about 49% of the total IDA refinanceup to June 30, 1975, IDBI estimated that the total value of output perannum at full capacity would be expected to reach Rs 677 million with anet value added of Rs 162 million, while exports should reach Rs 37 million/annum.
SFC Inspections
3.17 Timing. When the IDA Credit was negotiated, it was understoodSFCs should be inspected once every two years. For the period July 1973 toMay 1975, IFD was able to mount 15 inspection visits. Three SFCs (Punjab,Uttar Pradesh, and Haryana) were not inspected over this period, though thisoverall record is still a substantial improvement over past performance.After the reorganization, inspections are the responsibility of IDBI.

13 -
3.18 Procedures. Previously, SFC inspections were undertaken by theRegional Office staff of IFD. Now, they will be conducted mostly from theIDBI Head Office. To begin with, there will be four inspection teams ofthree men each (two for small SFCs). The SFCs will be inspected once everytwo years. However, short on-the-spot inspections of the SFCs may also becarried out from time to time. Previously, it took about 16 months onaverage from inspection to finalization of the report, which wasthen sent to the respective State Government/SFC and all regional offices forimplementation. The intervening steps included inspection (1-1/2 months),report writing (three months), report editing at Regional Office (two months),review and approval at Central Office (one month) and approval by RBI DeputyGovernor (2-1/2 months). Clearly, the time taken to provide feedback to theSFCs was excessively long. Now IDBI intends that the inspection procedureswill be completely reorganized and the inspection reports standardized. Itis the intention that the inspection time, from the commencement of the inspectionto the finalization of the report, will not normally be more than six months.
3.19 Inspection Substance. Past inspection reports have sufferedfrom a lack of coverage on major issues (general policies of SFC, organi-zational structure, appraisal standards), and have rather focussed on moredetailed accounting issues, reflecting the "inspection" bias of RBI(para 4.04). Further, IFD did not make sufficient effort to provide timelyand substantive feedback to SFCs on their progress in fulfilling the up-grading program. However, IFD recently developed new, broader inspectionguidelines which have been reviewed by IDA and were found satisfactory.
Credit Guarantee Scheme
3.20 The Scheme was enlarged in 1970, and at present roughly 200financial institutions make use of it to cover credit risks related toworking capital and term loans, letters of credit, and guarantees for allindustries, except transport and electric power. The Scheme provides fora payment of up to 75% of the amount in default or the amount guaranteed,whichever is lower. However, the maximum amount receivable is Rs 750,000for working capital 1/ loans and an additional Rs 250,000 for term loans.A guarantee fee of 0.1% is required, and is normally absorbed by thefinancial institution rather than passed on to the ultimate borrower.Guarantees outstanding increased from Rs 10.3 billion as of March 1973 toRs 16.1 billion as of December 1974. Rs 12.3 million was paid to creditinstitutions covering 983 claims between July 1960 (when the Scheme wasintroduced) and December 1974. There was an increase in claims pendingfrom the end of December 1972 (Rs 13.5 million or 7.6Z of total advancesin default) to the end of December 1973 (Rs 25.5 million or 9.7% of totaladvances in default). In April 1974, the Scheme was again liberalizedfor technician/entrepreneurs whose cover was increased to 90% from 75%for the first five years after disbursement, subject to a maximum loanof Rs 300,000 per borrower. Further, the Scheme was extended to cover
1/ Increased to Rs 1.25 million in 1975 on a two-year experimentalbasis for financing in conjunction with IRCI.

- 14 -
industrial cooperative societies functioning as production cum-salesunits provided the original investment in plant and machinery of thesociety and all its members did not exceed Rs 750,000. This latterliberalization is expected to increase the flow of institutional creditto a large number of handloom and powerloom societies.
3.21 At the end of 1975 IFD had 84 professional staff assigned to creditguarantee work, of whom 71 were in the regional offices. Claims are initiallyhandled in IFD's regional offices and are then transmitted to the CentralOffice for approval. There have been a number of complaints about thefunctioning of the Scheme on the grounds that it took too long for IFD toclear claim requests because of its predilection to ask an excessive numberof questions. Part of the problem related to the inadequacy of IFD's claimforms, which are under review by IFD. Further, until recently it was un-clear to SFCs what steps they had to take with a defaulting client prior toclaiming through IFD. This was clarified by IFD in a 1974 circular to allSFCs, though some confusion still persists. To speed up processing to acertain extent, IFD recently authorized its Regional Offices to sanctionclaims where the aggregate claim per borrower does not exceed Rs 15,000.
3.22 All SFCs are currently using the Scheme. Up to the end ofMarch 1975, SFCs as a group had filed 116 claims amounting to Rs 9.0million. Claims paid amounted to Rs 1.6 million (30 cases), whileRs 7.0 million (81 cases) were still pending (Annex 9). Nevertheless,there is still room for greater use (claim filing) on the part of SFCsas well as greater promptness in clearing claims by IFD (para 3.21). Theresponsibility for the credit guarantee scheme remains with RBI.
IV. THE STATE FINANCIAL CORPORATIONS
The Role of the SFCs
4.01 The majority of SFCs were established in the 1950s, 1/ to fill animportant gap in India's industrial financing structure by providing termfinance to small- and medium-sized enterprises, hitherto somewhat neglectedby existing financial institutions. SFCs were also permitted to underwriteand to give guarantees. It was expected that a State level institutionwould be in a better position to meet the specific needs of the localindustrial community than IFCI, the only all-India term-lending institu-tion then in existence. Over the years SFCs grew in importance, thoughtheir quality varied a great deal.
4.02 A substantial change began to take place in the late fiftiesand early sixties when the commercial banks, in particular the State Bankof India (SBI), became much more active in financing small-scale industry.
1/ TIIC (Tamil Nadu) was established in 1949 under the Companies Act,but is treated by RBI/IDBI as an SFC.

- 15 -
With aggressive management, competent staff, and an abundance of branches,commercial banks began to offer, at least in the more industrialized States,significant competition to SFCs. It appears that this trend is begin-ning in the more backward States as well. With the nationalization of 14commercial banks in 1969, the situation changed even more, in that GOIbegan to urge the newly-nationalized banks to give the SSI the highestpriority in their lending operations.
4.03 In December 1972, the SFC Act was amended to broaden its ob-jectives. 1/ The main amendments include:
(a) the creation of Special Capital which would becontributed equally by the State Government andIDBI; the shares of each would not attractdividends, and the proceeds of the issue wouldbe used to finance risky ventures as equity financing.Assistance would be restricted to new industrialunits which are private or public limited companieswith paid-up capital not exceeding Rs 500,000.Preference would be given to industries in backwardareas, industries set up by technician entre-preneurs or other artisans, and sophisticated typesof industries. The extent of capital participationshould not exceed the promoters' contribution or20% of the paid-up capital of the company whicheverwas lower. To date, however, only a few SFCs haveactually raised Special Capital, while others havedeclined on the grounds that they feel that there isinsufficient demand for such assistance or that suchassistance is already available under other schemes inthe State. Also, since Special Capital is restrictedto corporate bodies, 2/ a very large percentage of thepotential SFC clientele is excluded. On the otherhand, SFCs could try to turn partnerships and pro-prietorships into corporate bodies, using SpecialCapital as a lever.
(b) the scope of SFCs' activities would be widened toinclude the financing of industries engaged in themaintenance and repair of machinery; and
(c) SFCs' individual lending limit would be raised fromRs 2 million to Rs 3 million for corporations andcooperatives, and from Rs 1 million to Rs 1.5 millionfor all other entities.
1/ The Act was subsequently amended again in a few minor ways underthe Public Financial Institutions Laws (Amendment) Bill of 1975.
2/ Such things as partnerships and proprietorships are excluded sincein the absence of limited liability, SFCs could be forced to absorban entire loss to creditors.
- 16 -
SFC Upgrading Program
4.04 In an effort to improve certain aspects of the working of SFCs,individual upgrading programs were developed by IFD/IDBI on the basis ofdiscussions with SFCs, and were agreed by IDA in 1972 as part of the firstCredit. It has since been concluded by IDA and IDBI/IFD that the substanceof the upgrading programs themselves was insufficient in scope. Thus, on thebasis of previous IDA end-use missions, and subsequent visits by IFD/IDBIrepresentatives, revised upgrading programs have been developed for eachSFC with a much broader focus. The programs include detailed recommendationson management, organization and staffing, policies and procedures, appraisalstandards, improvements in portfolio quality and financial management andplanning. Also, each revised upgrading program will be supplemented withproposals to:
(a) increase the role of the Boards of Directors and thesanctioning authority of the Executive Committee(para 4.06);
(b) provide the continuity and smooth turnover of topmanagement and the strengthening of the second layerof management (para 4.02); and
(c) streamline interest rate structures (para 4.14).
These revised upgrading programs, along with the debt service coverage limit-ation (para 4.35) will form the basis for an agreement between IDBI and eachSFC to enable the latter to be eligible for withdrawal under the proposedloan. In addition, the Bank has spelled out a number of recommendationstailored to the needs of each SFC (Volumes II and III 1/). These recommenda-tions will not form a part of the upgrading programs per se, but IDBI andthe SFCs will implement the recommendations to the maximum extent possibleand IDBI will include a review of them in its annual reports to the Bankon the SFCs.
Summary Evaluation of SFC Operations
4.05 Ownershio. The composition of the shareownership of the 18 SFCsvaries considerably, often because of the timing of their establishment. 2/As of March 31, 1975, the aggregate plaid-in capital of all SFCs wasRs 305.7 million. Annex 10 shows that the respective State Governmentis usually the largest shareholder, ranging from 36% (Rajasthan) to 89%
1/ Paras 4.05 to 4.43 highlight the most important points made inVolumes II and III. In addition, these paragraphs have taken intoaccount the changes resulting from the implementation of the IDBI Act.
2/ The authorized capital of any SFC is limited to between Rs 5 millionand Rs 100 million, the latter limit having been increased fromRs 50 million under the SFC Act Amendments in 1975.

- 17 -
(Himachal Pradesh). IDBI is a shareholder in all the SFCs, with holdingsranging from 3.8% (Himachal Pradesh) to 42.5% (Gujarat). These figuresinclude RBI's shareholdings, which have now been transferred to IDBI as aresult of the IDBI Act. By virtue of its substantial shareholding, eachState Government is in a position to play an important role in influencingits SFC's policies (para 4.39), though this is counter-balanced by RBI/IDBI'simportance in providing funds (para 4.14), and in their influence inselecting the Managing Directors (para 4.08).
4.06 Board of Directors. With the exception of TIIC and the AssamFinancial Corporation (AFC), the composition of individual SFC Boardsreflects the SFC Act which stipulates that of the 11 Directors of eachBoard, four be appointed by the State Government, that IDBI nominate twoDirectors, and that four be elected by the remaining shareholders and thatthe Managing Director also sit on the Board 1/. In most cases, the Boardsmeet at regular monthly intervals wita reasonably high attendance records.Each SFC also has an Executive Committee, consisting of four Directors in-cluding the Managing Director, that has delegated authority to approveindividual projects with various limits, ranging between Rs 100,000 andRs 500,000. A number of SFCs are also assisted by Advisory Committeesthat have special expertise in certain industrial fields. As a generalpolicy, greater sanctioning authority should be delegated to Executive Com-mittees. Further, greater effort should be made by SFC management and staffto provide Boards with better and more timely information on SFC activities.
4.07 Organization. One of the primary weaknesses of past IFD inspectionsof SFCs (para 4.04) was the absence of any attempt to assess the adequacyof their organizational structure. The IFD/IDBI visits early in 1975attempted this with considerable success, and IDBI will now standardize itsprocedures accordingly. In essence, the new structures provide for a morelogical division of labor, a streamlining of appraisal and follow-up pro-cedures, and an appropriate level of decentralization in decision-making.A common trend in the past year has been the significant expansion in SFCs'branch network which now totals 93, though this is far short of the totalof the commercial banks as of June 1974 (16,936). However, SFCs should becareful not to over-extend the establishment of branches, nor to expandboth staff and branches at such a rate that they cannot be effectivelyabsorbed (as has happened in Madhya Pradesh).
4.08 Management. SFC Managing Directors are appointed by the StateGovernment in consultation with and after obtaining advice from IDBI. 2/ Thehistorical problem of a rapid turnover of Managing Directors has somewhatabated, although there is still difficulty in ensuring adequate continuityof management, particularly when the incumbent is seconded from the IndianAdministrative Service (IAS), as happens in about 50% of cases. Overall,
1/ Before the recent amendments to the SFC Act, the state governmenthad three representatives, IDBI and RBI one each, out of a totalof ten directors.
2/ Previously RBI.

- 18 -
the quality of SFC management has improved significantly over the pasttwo years. It would be desirable to eliminate the use of one-year termsfor Managing Directors in favor of a minimum of three or four years. Bythe same token, when Managing Directors have been very effective afterserving several four-year terms, there should be no need to insist on achange per se. Moreover, to ensure adequate continuity, the successor toany Managing Director should be taken on roughly six months prior to thedeparture of the previous Managing Director. In addition, IDBI and theState Governments should, where no suitable candidates are available,continue to agree to second outside personnel as Managing Directors (asin the case of Jammu and Kashmir and Orissa SFCs). The second layer ofmanagement also needs considerable st3rengthening, either through appropriateappointments from within the State or again through secondment of staff fromthe all-India institutions for fixed terms (e.g. Punjab, Assam, West Bengal)(para 4.13).
4.09 Staff. The original upgrad:Lng programs provided specifictargets for recruitment of both professional and non-professional stafffor each SFC. Because of the numerous definitional problems that devel-oped, and because the targets themselves did not appear to be based onan adequate analysis of the needs of the SFC, more systematic recruitmentprograms have been developed.
4.10 Annex 11 shows the growth in professional and other stafffrom March 31, 1973 to December 31, 1974, for each SFC. The only SFC thatdid not register an increase in professional staff was Maharashtra SFC,given the adequate size of its existinig staff. There is still need foradditional recruitment, particularly to strengthen follow-up work, and toprovide more technical and legal expertise.
4.11 A serious recruitment constraint affecting virtually all SFCshas been the pay scales, which are linked to State Government levels, andwhich are low in comparison with those of other financial institutions.In many States, SFC pay scales were 25% - 50% lower than those of com-mercial banks, the most important competitors in the recruitment of goodstaff. In a few instances (e.g. Haryana), SFCs have succeeded in mitiga-ting the effects of such disparities by the use of "advanced increments"for new recruits, to increase starting salaries. However, this requiresthe active support of the State Government, and is not always forthcoming.SFC staff quality is now the subject of continuous review by IFD particularlythe area of training requirements.
4.12 For the past few years, considerable effort has been devoted tothe training of professional staff, and up to the end of December 1973, 123had undergone training in specific courses related to project appraisalwork sponsored by IDBI. In addition, the Bankers Training College of RBIhas also conducted special courses for SFC staff. Thus, at least some 20%of SFC professional staff have undergone some outside professional training.Further, SFCs should make much greater efforts to use existing staff moreeffectively, given the strong academic backgrounds of many non-professionals.

- 19 -
4.13 A recent development in upgrading individual SFCs has been thepractice by some of the all-India financial institutions (IDBI and IFCI)to second experienced staff members to SFCs as advisors or in senior linepositions (para 4.08). In addition, IDBI will also consider the secondmentof staff members for short intervals (3-6 months) with SFCs to work onclearly defined areas such as assistance in project appraisal (paras 4.19-4.20).
Resource Mobilization
4.14 A summary of financial resources of all SFCs as of March 31, 1975is contained in Annex 12, which shows that the SFCs as a whole have reliedprimarily (excluding loan collections) on bond issues with State Govern-ment guarantees to finance their operations (38.7%). Of less importancehas been IDBI refinance facilities (29.2%) and share capital (10.2%). 12SFCs have also collected deposits with maturities in excess of one yearin amounts limited to the size of their individual share capital. 1/ Thoughinterest rates have varied, in most circumstances the cheapest funds (exclud-ing share capital) have come from IDBI. Thus, IDBI's ordinary refinanceoperations give spreads to SFCs of 3.5% for loans to the small scale sectorand/or to backward districts, as well as for loans for medium-scale projects.However, in the former case, SFCs borrow from IDBI at rates of 6 to 7.5%and on-lend at 9.5 to 11.0%. In the latter case SFCs pay 9.0% and relendat 12.5%, a rate which makes them less competitive with commercial banks.The revised upgrading programs (para 4.04) will include proposals tostreamline the SFC's interest rate structures, including proposals toreduce the excessive number of interest rates.
4.15 It should be stressed that the SFCs themselves have very littleindependence in raising resources, since RBI determines annually the amount,term and maturity of all bond issues, including the ad hoc bonds, 2/ whichthe SFCs are permitted to float. Moreover, the refinance facilities ofIDBI are generally limited to three times the SFCs' equity, though tem-porary exceptions are sometimes made. Aside from planning to have sufficientresources available to meet operational commitments and disbursements,it is somewhat difficult for an SFC in the short run to change materiallyits resource position, given the constraints in which it operates, even ifit so desires. Even with such constraints, however, there is some scopefor an SFC to improve resource planning through greater use of IDBI's
1/ A recent ruling by RBI states that SFC deposits should not be consi-dered as trustee securities on the part of investors for purposesof calculating reserve ratio requirements, though this is still underdiscussion.
2/ SFCs can borrow from RBI in maturities up to 90 days against trusteessecurities or commercial bills, and with a maturity of up to 12 monthsagainst government securities or the SFCs own bonds up to 90% oftheir paid-up capital.

- 20 -
refinance facilities and the avoidance wherever possible of relativelyhigh cost borrowings such as time deposits. In addition, two SFCs (Gu-jarat and Bihar) have overcommitted themselves in the absence of sufficientresources, a situation which could have been avoided through proper fore-casting. Further, SFCs in general are making increasing use of ad hocbonds from RBI to meet short-term (less than 12 month) resource require-ments, the bonds having grown from Rs 62 million in FY73 to Rs 213 millionin FY75. In some instances, SFCs have been using the facility on a moreor less permanent basis, indicating a lack of adequate planning.
Policies and Procedures 1/
4.16 Lending Terms. SFCs' lending terms vary from State to State,though the spreads under the IDBI refinance scheme are fixed. Nevertheless,certain priorities are readily apparent through the different rates chargedfor specific activities. In particulaLr, SFCs usually give lower rates ofinterest, longer maturities, and lower margin ratios to projects in backwardareas and to projects in the small-scaLle sector. The individual terms oflending for each SFC are contained in Annex 6 of each appendix in Volumes IIand III. Loans are usually restricted to financing fixed assets, thoughsome SFCs are prepared to finance working capital in conjunction with fixedasset financing. Working capital loans are not eligible for refinancing.
4.17 Where IDBI refinancing is inIvolved, a lower rate of interest isavailable to entrepreneurs, usually of the order of 1% to 3% less thanwould otherwise be payable. However, IDBI charges a commitment fee of 1%per annum, beginning six months from the date of IDBI's approval for loansnot then disbursed. 2/ Under the liberalized refinance scheme (LRS), nine-months grace is given irrespective of the status of the loan disbursement.Until recently, not all SFCs were charging commitment fees, while in manyinstances IDBI waived such fees to SFCs. Over the past year, IDBI agreedwith IDA not to waive commitment fees to SFCs and to insist that the lattercharge the maximum commitment fees.
4.18 Appraisal procedures and standards. SFCs have often been criti-cized for taking too much time to process loans. On average SFCs requirean estimated four to five months to process an individual loan applicationwhich is somewhat long, though a small percentage of applications have takenover two years. However, this performlance has improved in the past year.According to SFCs, much of the blame should be placed on the entrepreneur,
1/ The policies of the SFCs are contained in the SFC Act as well as inguidelines from RBI/IDBI. The State Governments, though empoweredto issue guidelines to the SFCs in consultation with RBI/IDBI hadnot done so to any great extent.
2/ Or three months from the date of IDBI's approval on the undisbursedportion for loans already disbursed.

- 21 -
who is slow to provide the necessary information, and on cumbersome Governmentprocedures. Nonetheless, when undue delays occur it is clearly due at leastin part to staff shortages or inadequate procedures within SFCs. In some, asystem of sequential appraisal has been adopted even where the total number ofstaff was small. Where not already undertaken, SFCs should be encouragedto establish appraisal teams to speed up the processing of applications.
4.19 Given the small size of projects and the lack of good data, it isnot surprising to find that appraisal standards are not of the same qualityas is possible for medium and large-scale industry. Nonetheless, the SFCshave made considerable progress in the past year as a result of a continuousdialogue with IDBI and IDA. The areas of analysis that have undergoneimprovement have been (a) marketing, (b) financial projections includingworking capital requirements, (c) management and (d) project implementationschedules.
4.20 Until a few years ago, most SFCs had no qualified staff for thetechnical aspects of project appraisal and were forced to rely mainly onSISIs, which act as an arm of the State Governments in providing technical-economic expertise in project appraisal. With the exception of one ortwo SISI units in the major cities, most SFCs felt that the quality ofsuch assistance was inadequate. Partly for that reason, SFCs recruiteda number of technical staff to undertake this kind of work. However,many still lack experience. The Kerala and Assam SFCs are fortunateto have available the technical expertise of KITCO1/ and NEITCO 2/ res-pectively. A third institution in Bihar (BITCO) 3T was recently establishedto undertake this function. IDBI intends to establish consultancy organiza-tions in less industrialized states. This will be beneficial to the SFCsfor assistance in project preparation.
4.21 Follow-Up Procedures. Probably the weakest part of SFC activitiesis the follow-up work, where the shortage of staff has resulted in ageneral neglect of clients, contributing to the high level of arrears.Nearly all SFCs tend to concentrate on appraisal at the expense of follow-up work. Follow-up visits are often limited to clients with known diffi-culties, though in some cases such clients account for 80% of the SFC'stotal portfolio. More branches, adequately staffed, would help to allevi-ate this problem, which is aggravated because SPCs generally cater to thesmall-scale and particularly the non-corporate sector, where little in-formation of an operational and financial nature is willingly made availableby clients, and even where it is, is not submitted regularly. Thus, itis important that the SFCs accord high priority to timely field visits.
4.22 Procurement and Disbursement. Historically, SFCs' review of pro-curement practices, hampered by lack of appropriate technical expertise,
1/ Kerala Industrial and Technical Consultancy Organization.
2/ North Eastern Industrial and Technical Consultancy Organization.
3/ Bihar Industrial and Technical Consultancy Organization.

- 22 -
has not been particularly thorough. Rather, the entrepreneur's judgementhas been the major factor in determininag equipment requirements. However,as part of the upgrading program, SFCs have in principle adopted the procedureof requiring price quotations from at least three suppliers as well asconsidering the quality of the equipment and the availability of spare parts.At least one SFC (Maharashtra) has, in conjunction with the State Directorateof Industry, assumed responsibility (wlhich has been vested in all SFCs, inline with a recent GOI directive) for providing the "essentiality" clearancefor particular applications. This serivice should increase as SFCs buildup their engineering staff.
4.23 Few SFCs have established deitailed, systematic disbursement pro-cedures, though the practice of ensurinxg that the entrepreneur puts inhis part of the capital cost first is common. Overall, however, disbursementprocedures are reasonably adequate. Nevertheless, SFCs, as a group, shouldput greater emphasis on establishing sound disbursement procedures withregular "verification visits". SFCs continue to experience lags in dis-bursements due partly to delays over licensing, information from client,verification of legal title, and over their own documentation, whichshould be rectified.
Resource Allocation
4.24 Operational Results. A statement of each SFC's operational re-sults for the fiscal years 1973 to 1975 is contained in Annex 13. Theirloan sanctions grew from Rs 789 millioni in FY73 to Rs 1,415 million inFY75, or by 79% in nominal terms. With the exception of Assam, Uttar Pradeshand Jammu and Kashmir, which recorded declines, each SFC experienced someincrease in its lending operations. MaLharashtra continues to be the largestsanctioner with Rs 221.7 million (15.6% of the total) in FY75, followed byGujarat (Rs 188.0 million). Overall di.sbursements grew from Rs 449 millionin FY73 to Rs 738 million in FY75. Gujjarat showed the largest single annualdisbursement (Rs 144.7 million). However, loan collections actuallyfell from Rs 248 million to Rs 222 million over the same period. Thus,total SFC outstandings increased from Its 2.2 billion to Rs 2.8 billionin FY75.
4.25 SFCs as a group have been inactive in making equity investments,1/bond subscriptions and guarantees. At the end of FY75, equity investmentsand bond subscriptions represented 0.5Z of total operations while guaranteesrepresented about 3%. The one exception has been TIIC which, since notlegally an SFC itself, is atypical. As of March 31, 1975, 20% of itstotal portfolio (outstanding) was represented by equity investments. TIIC'sweak investment portfolio amounts to almost twice its own net worth whichis an alarming situation. With the availability of Special Capital, it
1/ SFCs are not allowed to subscribe to the shares of a company unlessthey have underwritten the issue and may not hold such shares for morethan seven years, though exceptions are granted by RBI. Moreover,SFCs cannot hold more than 30% of the total shares of any company, ormore than 30% of its own net worth in a company, whichever is less.

- 23 -
would be desirable for the SFCs to become more active in equity investments,if there are appropriate opportunities, within the limits set out in the Act.
Characteristics of Portfolio
4.26 (a) Size of Loans. The weighted average size of approvals wasRs 230,000 during FY75 (Annex 14). In some SFCs, the trendhas been towards smaller loans, though in others (e.g.,Maharashtra) an attempt has been made to finance largerloans in order to increase net income and, thereby, obtaina more profitable operation. The minimum loan amountvaries from one SFC to another but is usually around Rs 10,000.
(b) Regional Distribution. SFCs have adopted various measuresto promote industrial development in backward districts in-cluding loans at reduced margins, concessional rates ofinterest and reductions in processing and legal fees. Asa result, the proportion of such loans sanctioned has grownfrom 28% of total sanctions in FY72 to 43% in FY74.
(c) Maturities. SFC maturities range generally from seven totwelve years (excluding transport operators, who receiveconsiderably shorter loans). It is only recently thatmost SFCs began carefully to determine maturities onthe basis of the debt service capability of the individualclient as opposed to arbitrary "rules of thumb."
(d) Size of Industry. Over the years SFCs have become importantsources of funds for the small-scale sector, and in FY75,an estimated 54% of loans by amount and 90% by number wentto the small-scale sector.
(e) Industrial Distribution. SFCs' portfolios tend to reflectthe distribution of the industrial activities in theirparticular States, though in most cases they are welldistributed amongst many sub-sectors. The most importantindustries are food manufacturing, basic metals, chemicals,and metal products. In certain instances (e.g., Orissa,Assam) SFCs tend to be over-exposed in particular sub-sectors such as rice milling (Orissa) and the tea industry(Assam). In such circumstances, SFCs should make everyeffort to diversify their portfolios wherever possible.
4.27 Technician Entrepreneurs Scheme. In order to reach the smallerand newer elements of the small scale sector, and thereby reduce unemploy-ment, sixteen of the eighteen SFCs have developed schemes for providing

- 24 -
assistance to tzzhnician entrepreneurs. 1/ The scheme generally provideslower rates of interest, reduced margins on security, and longer graceperiods. Up to the end of September 1974, 14 SFCs had sanctioned 874loans amounting to Rs 162 million under the scheme.
Financial Performance
4.28 Quality of Loan Portfolio. As part of the upgrading programSFCs were expected to conduct a case-by-case review of their entire port-folios. As of March 31, 1975, the review had been completed in 15 of theeighteen SFCs, while in the remainder the review was in progress. Thegeneral quality of the SFCs' portfolio, however, remains weak. An analysisof the arrears of etch SFC is contained in Annex 15. This shows that onlysix improved their rrears position in FY75 over FY74 using the "infected"portfolio criteria (column 3), while only eight showed an improvement inactual arrears of principal and interest (column 4). In the former case,the ratios ranged from 15% (Rajasthan) to 61.9% (West Bengal), while theactual arrears varied from 2.1% (Punjab) to 36.7% (Assam). Nevertheless,considering the difficult business condition experienced by industry in1974 these results are reasonably satisfactory.
4.29 After analysing all loans in arrears for more than two years,and the twenty largest loans in arrears for each SFC, the following generalreasons for high arrears were identified: (a) environmental factors suchas power shortages, raw material shortages and labor problems, resultingin delays in implementation of certaLn projects; (b) SFC institutionalfactors as in the absence of an adequate penalty fee, inadequate follow-upwork and (c) specific project reasons such as managerial incompetence and,in a minority of cases, lack of markets. SFCs have taken some steps to tryto reduce arrears, including rescheduling (on justifiable grounds) as wellas suit filing in chronic cases, and claims under the Credit Guarantee Scheme.
4.30 In a few SFCs in the eastern region, Default Committees, consist-ing of a small group of Board members, have been set up to review allaccounts in arrears beyond a certain time. Individual entrepreneurs areinvited to attend committee meetings to explain the reasons for theirdefaults. Against the background of generally weak portfolios, very fewloans have been written off in the past five years; 2/ SFCs claim that, innearly all cases, collateral is sufficient to cover potential losses.
4.31 A special problem has emerged in the case of "sick" textile millspreviously financed by certain SFCs. These were amongst the 103 textilemills taken over by GOI under the Sick Textile Undertaking (Nationalization)Act, 1974 and placed under the National Textile Corporation. As of June 30,1974, nine SFCs had Rs 45.3 million oustanding to 23 such units. The Act
1/ Defined as graduates or diploma holders and certified technicianand/or those having adequate experience in a particular field.
2/ SFCs are reluctant to write off since no tax deductions are availableuntil all other remedies are exhiausted.

- 25 -
has set out the amount of compensation that will be paid by GOI and alsothe order of priority of such payments arising out of the liabilities. The"opost-takeover management" claims will take precedence over the "pre-takeover"claims and at the same time, workers' back wages will be given overridingpriority. Thus, it is highly questionable whether SFCs can be adequatelycompensated under the circumstances. If not, write-offs will be requiredwhich, in a number of SFCs, may seriously jeopardize their financialposition. GOI has appointed Compensation Commissioners to sort out theclaims on the assets of the various textile mills. Once the Commissionersmake their decisions, the SFCs concerned should make the necessary adjust-ments in their portfolios through write-offs. This may entail the need forthe SFCs' shareholders to increase the SFCs' equity base so as to staywithin their debt-equity limit of 10:1, as stipulated under the SFC Act.
4.32 Any attempt to improve the arrears position of most SFCs willrequire a substantial effort. Nevertheless, all SFCs should put increasingemphasis on follow-up work through systematic visits to all clients toascertain the exact position of each operation, particularly before problemsdevelop. Secondly, appraisal standards need to be improved to reduce thelikelihood of problems at a later date (e.g., working capital shortages).Further, SFCs should make greater use of the Credit Guarantee Scheme,judicious rescheduling and suit filing where appropriate. In addition, thepenalty fees for clients in arrears and/or rebates for prompt payment shouldstill be increased further from their present level in order to eliminate,as far as possible, the phenomenon of willful defaulters who prefer to repayin the first instance loans from commercial banks since they carry interestrates of 3% to 4% above those of the SFCs.
4.33 Quality of equity portfolio. Given the small size of SFCs'equity portfolios, they do not materially affect the overall financialposition of the SFCs, with the exception of TIIC. Nevertheless, for manySFCs, the dividend yield has been extremely low because of the poor finan-cial performance of the individual clients. The return for FY75 on thetotal equity portfolio of SFCs (excluding those with no equity investments)ranged frow 2.68% in Punjab to 24.2% in Andhra Pradesh.
4.34 Profitability. A statement showing the financial performanceof the eighteen SFCs on the basis of a variety of ratios is contained inAnnex 16. Profit after tax as a percentage of year-end share capitalranged from 0.2% (Assam) to 35.5% (Bihar). From FY74 to FY75, fifteenSFCs showed an increase in this ratio. The nominal financial spreadranged from 0.6% (Assam) to 5.0% (Himachal Pradesh). 1/ Administrativeexpenses as a percentage of average total assets ranged from 0.7% (AndhraPradesh) to 2.2% (Maharashtra) in FY75. The relatively high ratio forMaharashtra reflects the SFC's considerable efforts to establish regionaloffices and branches, and to carry a significant portfolio of very small
1/ Income from term loans as a percentage of average term loan portfoliominus cost of term debt as a percentage of average term debt.
- 26 -
loans. 1/ In most cases, after a SFC has allocated 40% of its gross incometo reserves, encouraged by tax exemption, and has paid the required taxesand dividends, little is left over for the provisions that should havebeen a first charge on earnings. In FY75, the net profit of all SFCstaken together was Rs 68.1 million, based on total assets of Rs 3.35 billion.
4.35 Capital Structure. The SFC Act limits the debt/equity ratio ofall SFCs to 10:1. At the end of FY75, this ratio ranged from 2.5:1 (Jammuand Kashmir) to 8.2:1 (TIIC). Under the existing Credit Agreement, anadditional covenant ensures that the debt service coverage of each SFCbased on the combination of an estimate of results for the subsequent sixmonths as well as actuals from the past six months should be not less than1:1 as of October 1, 1973, not less than 1.1:1 as of April 1, 1974 and notless than 1.25:1 as of April 1 of any succeeding year. For FY75, actualdebt service ratios ranged from 0.78:1 (TIIC) to 2.8:1 (Jammu and Kashmir)with 8 of the SFCs below the 1.25 target. 2/ A number of difficulties emergedin the interpretation of the ratio. In the absence of sinking fund pro-visions, most SFCs repaid previous bond issues in lump sums, so that ona specific date the debt service coverage position might appear unfavorable.Further, RBI's practice of providing iso-called "ad hoc" bond funds to SFCs(para 4.15) in temporary resource difficulties also resulted in uneven ratiosfor short periods. In addition, the use of a combination of six months fore-casts and six months actual figures iinserted an arbitrary quality intothe calculations. Finally, the targets themselves were open to question inthat in the short-term there was very little an SFC could do to rectify a lowratio, since the only items used in ilts calculation that were capable ofimprovement in the short run, were loan collections and gross income. Forthe proposed loan the debt service covenant will be modified to include onlyactual results; the 1.25:1 limit as oJE April 1 each year will be retained,but be calculated on the basis of assumming sinking fund provisions for bondredemptions (to avoid large fluctuations).
4.36 With one or two exceptions, SFCs do not have adequate provisionsfor doubtful loans, though reserves plus provisions as a percentage ofyear end portfolio in FY75 ranged from 3.0% (Gujarat) to 9.6% (West Bengal).IDBI should review the adequacy of provisions (including provisions forequity investments) with the auditors and managements of the individual SFCs.
1/ Which explains its present efforts to now finance l1Tger loansand improve profitability (para. 4.26(a)).
2/ Without adjustment as described below.

- 27 -
4.37 Dividends. SFCs pay fixed dividends under the Act 1/ to theirshareholders, usually at a rate of 3.5%, this has resulted in pay-outratios ranging from 10% (Bihar) to 46.3% (Orissa) in FY75. At the sametime, year-end book value per share as a percentage of par value rangedfrom 130 (Gujarat) to 207 (Andhra Pradesh).
4.38 Audit. As a result of an amendment to the SFC Act in 1972, thereis now only one auditor for each SFC, appointed by the State Government inconsultation with the Comptroller and Auditor-General of India. The rightof the private shareholders to appoint an additional auditor has beenabrogated. The quality of the audit has varied considerably. In somecases, the auditors' letters to management indicated significant quali-fications to some of the figures in the financial statements. On theother hand, the audits of some SFCs indicated that the auditors had over-looked shortcomings in the financial statements. Under the proposed loan,the SFCs audits will be undertaken in the long form, but schedules 2 and 3 2/(analysis of quality of loan and equity portfolios, respectively) will beproduced only for outstanding loans/equity investments in excess ofRs 200,000. This modification has been introduced to take into account themall-scale nature of SFC portfolios.
Relations with State Governments
4.39 The State Governments are closely associated with each SFCthrough their involvement in fixing the amount of authorized and issuedcapital, nominating three Board directors, and appointing the ManagingDirector in consultation with RBI. State Governments are also importantin terms of granting incentives, promoting backward regions particularlythrough the establishment of industrial estates, and guaranteeing SFCbonds and dividends. In a few states, SFCs are used as channels forspecial State Government funds for specific industries. Thus, State Gov-ernments exert some influence over SFCs, and, to a significant extent,the success of the upgrading programs, particularly of management andstaff, will continue to depend on the degree of commitment of the StateGovernments.
Reporting Requirements
4.40 Aside from IDBI's normal reporting requirements, IDBI will prepareannually detailed evaluation reports for each SFC by September 30 3/ of
1/ Until FY71, some SFCs (Orissa, Jammu and Kashmir) still received finan-cial assistance from State Governments to pay such dividends, and anumber are still repaying such assistance received earlier. Becauseof the introduction of an interest suspense account, Assam will probablyrequire a subvention from the State Government to pay its dividend inFY75.
2/ As per "Illustrative Form of Audit Report for Development FinanceCompanies".
3/ For 1976: October 31.

- 28 -
each calendar year for forwarding to the Bank for review along the linespresented in Volumes II and III. This will take the place of semi-annual andquarterly data reporting by SFCs to IDA under the first credit, which wouldnow be restricted to IDBI only. In addition, the SFCs will prepare, withthe assistance of other State level bodies, a review of the industrial sector(small and medium scale) of their respective States to be forwarded throughIDBI to the Bank for review also by September 30 each year.
Prospects
4.41 The difficulties experienced by the industrial sector in Indiain 1973 and 1974 have been somewhat alleviated. They were largely due toshortages of raw materials, labor unrest, power cuts, and transport bottle-necks which led to significant underutilization of capacity. Since then,however, a very favorable monsoon has reduced the level of power cuts,and labor unrest has also reduced. Further, GOI has recently streamlinedprocedures for the allocation of raw materials, particularly for the smallscale sector. Coupled with this GOT has been successful in reducing therate of inflation. As a result, the overall prospect for new investment inthe industrial sector appear to be more promising than in previous years.Given GOI's priority emphasis on the small scale sector and the proposals tolaunch a modernization program in thiLs area, the demand for foreign exchangefrom SFCs should be substantial.
4.42 Five-year forecasts have been prepared for each SFC (balancesheet, income statement, sources and uses of funds). These reflect theparticular industrial prospects in each State as well as the processingcapacity of the SFC. In addition, detailed forecasts for IDBI's overalloperations have been prepared and are contained in Volume I. The Bank/IDArefinance scheme forecasts are sunmmarized below:
IDBI Refinance of Industrial Loans (Bank/IDA Credit Component)(Rs million)
1974 1975 1976 1977 1978--- Actuals --
Approvals 51 96 214 252 302Commitments - 126 183 242 289Disbursements - 31 141 195 251
4.43 From the above, IDBI is likely to sanction refinance of the entirefirst Credit by May/June 1976 on the basis of total sanctions of Rs 361million. Disbursements under the existing Credit are expected to increasesubstantially over the next two years. Thus, on the assumption that thereis sufficient staffing and reorganizaLtion in IDBI's Refinance Departmentand its Regional Offices (paras 3.04 and 3.07), IDBI is likely to sanctionabout an additional Rs 550 million for the two-year period beginning

- 29 -
July 1, 1976. This represents 1/ $40 million in eligible foreign exchangerequirements. A disbursement schedule for the proposed loan is containedin Annex 17.
V. OBJECTIVES OF THE CREDIT
5.01 To date, Bank Group involvement in the small and medium-scaleindustrial sectors in India has been confined to the existing line of creditthrough IDBI to the SFCs. That Credit had two basic objectives, namelythe financing of the import component of sound, high-priority industrialprojects in the small and medium-scale sectors and the upgrading throughspecific programs of the operations and procedures of SFCs. Based on theexperience under the first project (para 3.15) and as a result of the changein definition of SSI (para 2.13, footnote 1), approximately 90% by numberand 65% by amount of the proposed credit would go to the small scale sector.
5.02 The proposed Loan would provide continuity to these objectivesand at the same time expand on them. In the first instance, it would,through project financing, contribute to a multiplicity of objectives in-cluding the modernization of SSI, the development of new entrepreneurs,backward districts, employment generation both in rural and urban areas,and an increase in exports. Secondly, the upgrading of the SFCs that hasbegun over the past several years, particularly improvements in the qualityof management and staff, the streamlining of procedures (including thoseinvolving GOI), and improvements in appraisal standards would continue.Moreover, since then, the upgrading programs have been revised and expandedto include more detailed recommendations involving the SFCs. Thus, theproposed Loan would provide the vehicle for the Bank's continued involve-ment in the upgrading of the SFCs, particularly through more comprehensiveand detailed action programs for individual SFCs. However, it is expectedthat in future IDBI would assume more of the final responsibility for in-specting and upgrading the SFCs as well as monitoring appraisal standardsthrough subproject reviews.
VI. THE PROPOSED LENDING SCHEME
6.01 General. As in the previous Credit (356-IN), the proceeds ofthe proposed Bank Loan would be re-lent by GOI to IDBI for the exclusiveuse of SFCs, through IDBI's refinancing scheme. The number of sub-projects financed by the loan would be large (estimated at about 1,000).In view of its objectives to upgrade the standards of SFCs and to supportsmall- and medium-sized industries, the lending scheme continues to callfor special arrangements to ensure effective use and efficient administra-tion of the Loan. The main points are presented below:
1/ Assuming 65% refinance, 50% of loans in backward areas, and anexchange rate of Rs 8.0 = US$1.

- 30 -
6.02 On-lending Terms. The principal terms and conditions of on-lending of the proceeds of the Loan would be as follows: (a) GOI wouldlend the proceeds to IDBI on term satisfactory to the Bank. The presentrate of interest would be 7.75% less a rebate of 1/4% for prompt payment.The foreign exchange risk (para 6.09) would be borne by GOI, and amortizationwould be on a fixed schedule approximating the estimated amortizationpattern of sub-loans (extending over 18 years including 3 years of grace;(b) IDBI would lend the proceeds to SFCs at an interest rate of not lessthan 8.0% per annum to small-scale units covered under the Credit GuaranteeScheme, technician-entrepreneurs and units in specified backward districtsand not less than 8.75% for other cases. Amortization would be on aproject-by-project basis conforming to IDBI's normal procedures for refi-nancing, subject to a period of not more than 15 years; (c) SFCs would lendto enterprises at an interest rate of not less than 11.5% per annum in thecase of loans made to SFCs at 8.0%, and 12.0% in other cases, plus the SFCs'current commitment charges. Thus, the SFCs would enjoy a higher spread(3.5% compared to 3.25%) to cover the more costly and riskier loans to SSIwhile at the same time charging a higher final rate (12.0%) on other loans.SFCs would onlend to enterprises on terms and conditions that give adequateprotection to SFCs, IDBI and the Bank.
6.03 This interest rate structure would allow SFCs a spread of between3.25% and 3.5%, which is necessary to enable them to cover their costs andto improve their financial positions. IDBI's spread would be adequate tocover its expenses in administering the loan. Though inflation rate pro-jections are difficult given the present negative rates (1975/76), it hasbeen assumed that the rate of inflation will average about 5-7% over thenext five years. Thus the SFC final lending rates will entail real posi-tive rates of 5-7%. Further, the SFC rates would be in line with ICICI'sforeign currency rate of 11%, where the sub-borrower bears the exchangerisk.
6.04 Projects Eligible for Loans. IDBI has established basic financialand economic selection criteria for projects, and these have been approvedby the Bank. Under the SFC Act, SFC subloan are limited to size to Rs 3million, and eligible enterprises must have a total equity (paid up sharecapital and free reserves) of no more than Rs 10 million.
6.05 Use of Loan Proceeds. The proposed Loan would be used tofinance imports. For that purpose, the Bank would reimburse 65% of IDBI's re-finance disbursements for SFC-projects with import components. 1/ Sincethe import requirements for capital goods of SFC-financed projects areestimated at about S40 million for two years through June 30, 1978, theLoan proceeds would be principally used for financing caoital goods
1/ Under Credit 356-IN, the estimated foreign exchange content of theSFC loans was 62%. In addition, it is considered likely that therewill be a higher average foreign exchange component under the proposedLoan because of the expected increase in the relative prices of importedgoods due to the present negative rate of inflation in India.

- 31 -
and services imports. However, given the need of small-scale enterprisesfor imported raw materials, the proceeds would also be available for suchpurchases, provided the sub-borrower's need is for permanent working capitalas in the case of the first credit.
6.06 Eligibility of SFCs and Institution-Building. To ensure effectiveuse of Bank funds, the proceeds would be available to only those SFCs whichcontinue to meet the requirements of the revised upgrading programs.
6.07 Authorization of Sub-Projects. IDBI would forward to the Bankfor its prior approval, any sub-project whose loan amount exceeds Rs 2.5million, including local currency component. However, for those SFCs thathave not yet submitted at least two acceptable cases for prior review, thefree limit of Rs 1 million under Credit 356-IN would be retained, but wouldbe raised to Rs 2.5 million on an individual SFC basis once two acceptableprior review cases per SFC have been processed by the Bank/IDA. Appraisalreports prepared by the SFCs concerned and IDBI's review of the appraisalwould accompany the request for the Bank's approval. It is estimated thatthe Bank would review about 50 projects requiring its approval, accountingfor 20% by amount of the proposed Loan.
6.08 Disbursement. The Bank would finance 65% of IDBI's disbursementsto SFCs for projects which include a component for the import of machineryand equipment and services for expenditures incurred up to 180 days prior toreceipt of applications. The percentage thus represents an estimated averageof the eligible foreign exchange component in SFC projects. Since disburse-ments would be first made by IDBI, reimbursements would be obtained fromthe Bank at agreed intervals. Reimbursement to GOI would be made againstIDBI's certificate of expenditure, the documents for which would not besubmitted for review but would be retained by SFCs for submission to andinspection by the Bank as and when deemed necessary.
6.09 Foreign Exchange Risk. Both IDBI and SFCs would be protectedagainst foreign exchange risks. In addition, small scale units should notbe expected to bear the risk themselves. Thus, as in the previous projectthe risk would be borne by GOI.


State-wise position of Term Loans (including instalment credits)granted by scheduled ccsmercial banks to small scale industries
(Amount in million of rupee7s)
Name of the State/ AS O N T H E L A S T FRIDAY O FUnion Territory June 1972 June 1973* June 1974*
No. of Limits Balance No. of Limits Balance No. of Limits BalanceUnits sanctioned outstanding Units sanctioned outstanding Units sanctioned Outstanding
Andhra Pradesh 2740 156.o 113.6 3151 130.6 105.3 3453 145.3 123.6Assam 468 9.7 6.8 569 11.6 '8.2 724 16.9 11.7Bihar 652 48.6 26.6 802 40.0 29.3 1448 60.0 h1.2Gujarat 1927 104.7 76.8 2310 130.8 93.9 2690 168.1 127.5Haryana 412 26.6 19.0 602 37.9 30.7 1008 62.1 46.7Himachal Pradesh 16 .1 .1 27 .4 .2 71 2.6 1.7Jamnu & Kashmir 62 3.4 1.8 181 5.0 3.1 293 6.2 4.4Karnataka 4676 145.2 126.5 5496 180.5 156.3 6239 227.9 197.1Kerala 1616 84.2 57.6 2287 54.o 50.0 2453 63.6 54.4Madhya Pradesh 986 57.1 31.1 1230 68.3 38.6 1547 63.3 43.oMaharashtra 5278 306.5 243.1 6576 373.7 294.7 7502 435.9 352.2Manipur 1 - - 16 .2 .1 67 .7 .2Meghalaya 4 - - 12 .2 .1 18 .3 .3Nagaland 2 - - 2 - - 1 - _Orissa 189 5.8 4.2 290 6.5 4.8 350 9.8 7.5PUnjab 445 27.8 12.6 804 24.0 20.4 1235 48.8 40.3Rajasthan 397 11.9 8.7 457 17.5 12.1 856 29.3 18.1Tamil Nadu 5209 170.1 130.1 6439 222.6 178.7 7635 290.7 227.2Tripura 9 .4 .1 2 - - 4 - -Uttar Pradesh 1047 44.o 29.3 1569 51.6 37.6 2847 99.6 78.8West Bengal 1192 48.6 38.3 1466 60.9 47.9 3031 144.4 110.2Union TerritoriesAndaman & Nicobar - - - 11 - - 13 - -Arunachal Pradesh - - - - - - - -Chandigarh 24 .8 .4 51 2.1 2.3 92 5.0' 4.5Dadra & Nagar Haveli 3 .1 .1 2 .1 .1 3 .1 -Delhi 1034 64.6 54.7 1015 69.2 49,9 1367 84.4 70.9Goa, Daman & Diu 198 8.5 7.7 205 8.7 7.4 195 9.8 9.3(Pondicherry 58 1.5 .9 86 3.1 2.5 149 4.8 3.8(Mahe - - - - - - - -
(Lakshadweep _ _ - _ _(Minicoy 1 - - - - - - -
Mizoram - - - - - - - - -
Grand total 28646 1326.9 990.2 35658 1499.6 1170.6 45291 1971.7 1574.8
* Provisional
April 21, 1976

ORGANISATION CHARTINDUSTRIAL DEVELOPMENT BANK OF INDIA
IBOARD OF DIRECTORS
_EXECUTIVr COMMITTEE CHAIRMAN AND MANAGIN'G DIRECTOR REGIONAL COMMITTEES
EXECUTIVE DIRECTOR EXECUTIVE DIRECTOR CHAIRMANS SECRETARIATII ( INC LU 01Ir MANAGE MENT
DOMEc:c r;M :C - lvING INTERNAT:3:.'At.L '::AuCE .INGA s s
r"42P5. 7 deR T-CiN,CAU AZVISE GENCRAL MANAGER GENERAL MANAGER ECONQMIC ADVISERA __ 1 i. ,P LT
P!GfONAL D AL~R AREA 7) DGM EX~PORT LOANS DEPARTMENT DYGM PYGM DYGML:)A'.,' LEPARTMENT &ACkWAR M ~~~~~~~(INCLLOING EXP9ORT RE;INANCE) I_~~~~~~~~~ ---
LCAN DEpAro-z^4r I :)y GMY DEVILOPM M,NT DPARrTeE tNr } DYGM ' OV&wSts5 tsOEEA REAS DIR[CT LOANS DEPAGtMENr
L~AI4 -PMENT D ' STATE FINANCIAL COJRPORATIONS DY GM AIISF
LOA- eLFAQREN E AND CTI4ER STATE LFEVL IMPORT LOANS DEPARTMENT } YGMp LEGAL ADISER
LOAN _-IP MT.N r v D V IAN TPR E- I S A TITJI N L------E _ __ _ _ _ _ _ _
LOAN C9tARSnE~r v13_ c. c*tDINAT'ON DRPr RTMEN? DY GM CREDIT tNTELLIGENCE ; L INTERNAL AUDITORJGl
LOAN ,AMEI VI (;rl~~~~~~~.I.~~e .~~,i AND bANWS) )INVESTI(ATION DEPARTMENT YG
TEflN*NCE or INDUSTRIAL DY GM ADMINISTRAriON , ACCOuNTS J ADMINISTRATION.ACCOUNTS L artLCAI4E DkPARTP.IEN? TJ - BUDGETING 73 ATETGEEA AAE
v 6~~~~~~~~~~~~~~~~~~~~~~~ENERAL M"ArAERCOUNSELLING SERViCes &
_ . * r: $ ~ : 9 .tx *:Ir,.L - .; ,, *:I N e > ;'' ':T ' PULBLIC RELAriON5 73Et^PAYEIT).
: 'EA'_tSERS : rErwliEs X srE 5TELS 3. AsLCYS
*X'~5 OS~ A.A..^r&SS, t 5v^S-W-EC FlF2tS 2- ASTIIAS. OR OREIS65 ADMINISTRAriONm ECRETARY A.C
:5 E-151 ,_5 :t-;rcts 3sAf I ANE WtRES PERSONNEL, 4ttNEF ACCeCUNTtN'
AiL Fe_4O.C., ASL(14t I. I1CC PA!CO.jCTS SUGGIE RC0 TRAINING AND
ICARSON Pt5Lc;95ftt LASTIC$ S V m-NUFACTVI6 IE4 C PREMISES
r CrTEI CA[C4L PAcDUCTI r . EA.r, 5E TAL DYGM-- CA PRDU(TS GL Sj'& e, PA-AC CL'iAleS NS STACS rAYG
LAC.ALI4A. Er6IICALS ECA TC'OT*L ' iNsLLARDS CHAIRMAN'S SECRETARIATI*oA6QtELS,L'A LFa.I A' rIsVTIPUFrs A tocts1 ( INCLUDING tAANAGE_E'NT
LEA?-# tCo:;e'S a REFRACTORIES SERVICE D:vISION )LI C,Ss FR' I S I-Lk i -L. q.ENr,fES, PuIS EVE-
_ . . .: - .. :; F I c D: . ' S laaA. E SE atAs / A u DE S |
F ^:' f -t' Ol'I.~C'S EASES6Ar^z , Ss~se>< ,NrSsTrlES .............. TRE CHAIRMAN'S SECREtARIAT WILL CCNSISr OF Six
3!tIEC stl^4L lFr_t 5-RLtSZ SE.NIOR OFFICERS WHO I.4LL Se WELL CO'4'ERSANIT
leaos:'. leAr^e^aC"DRS WITH THE fUNNCTIONI NS OF THE OPERATIV9
A"rE IOF DivISIO NS ArRD WILL MONPIOR OPFRATfONS AS
*..IC~ C'l. 'AC4'"I8rY _______________________ WELL& AS HELP EvOLVE POLICIES FOR Tr.E O8l.
A rv A * Cr -r - V S ORN eFPlFTMDNT \'; THE N^AACE mrENT SErrvSC DI-vSION WILL as
A '-m LOAN Ec.I,' VI RE SP cs5,.SLE FOR PREPARIN PitEOGA* CE 1
_ NU ? - P NIILTSS MA SlE --. Er AUDCT, REFOrReE PLANNING.
s.t ^ * ' 5 EAFL5rEo 70IC' By DEPARTI4ENT WILL POLICY FORMULAT10N APECTlG A. ACFIVITIES 0U
6~'NF 3^- "U _ FEAtIO~ . TlTrNEKT S A AS TAr_ CARE OF WEAkER 4 CR1 ESvI Er; VL e-c i,ATATIOM
713 S s rAR.S TC'T'4.ES * CEMENTS. .NITS DER lEmoNTORING SYSTEM, PUBL^ IC REL£ATIONS AND-ALrLI.E I,. eA'EA T ICIPNACELOT aER SLATED ACTIV3TrRl
eF i C ..NL'S UtZERE7, UIS NE
Ap§=2, 1976
. .

INDUSTRIAL DEVELOPMENT BANK OF INDIA
Summary statement showing progress in the utili-zation of IDA Credit as on February 29. 1976
(Rs Million)
No. of Foreignapplica- hxpee currencytions component component SFC loan IDBI Refinance
1. Proposals cleared by CGAC 825 N.A. 272.4 N.A. N.A.
2. Proposals received by SFCs 855 285.1 374.6 659.8 -
3. Proposals sanctioned by SFCs 551 165.0 214.4 379.4 1
4. Proposals rejected/closed by SFCs 177 68.9 94.8 163.8 -
5. Proposals pending with SFCs 127 51.2 65.4 116.6 -
6. Assistance disbursed by SFCs - 53.9 69.9 123.8 -
7. Refinance sanctioned by IDBI 416 141.1 173.4 314.5 287.6
8. Applications under consideration by IDBI 46 - - - 42.6
9. Refinance disbursed by IDBI - - - - 88.0
10. Authorization granted by IDA 373 117.0 147.3 264.4 241.5(60% - 144.9 equivalentto U$ 19.363 million)
11. Authorization requested 41 26.8 33.3 60.1 54.3(60% - 32.6 equivalentto Us$ 4.134 million)
12.. Withdrawals claimed - - - 83.4
(60% - 50.0)
13. Applications pending clearance by CGAC 21 - 13.8 _
4pwil 21, 1976
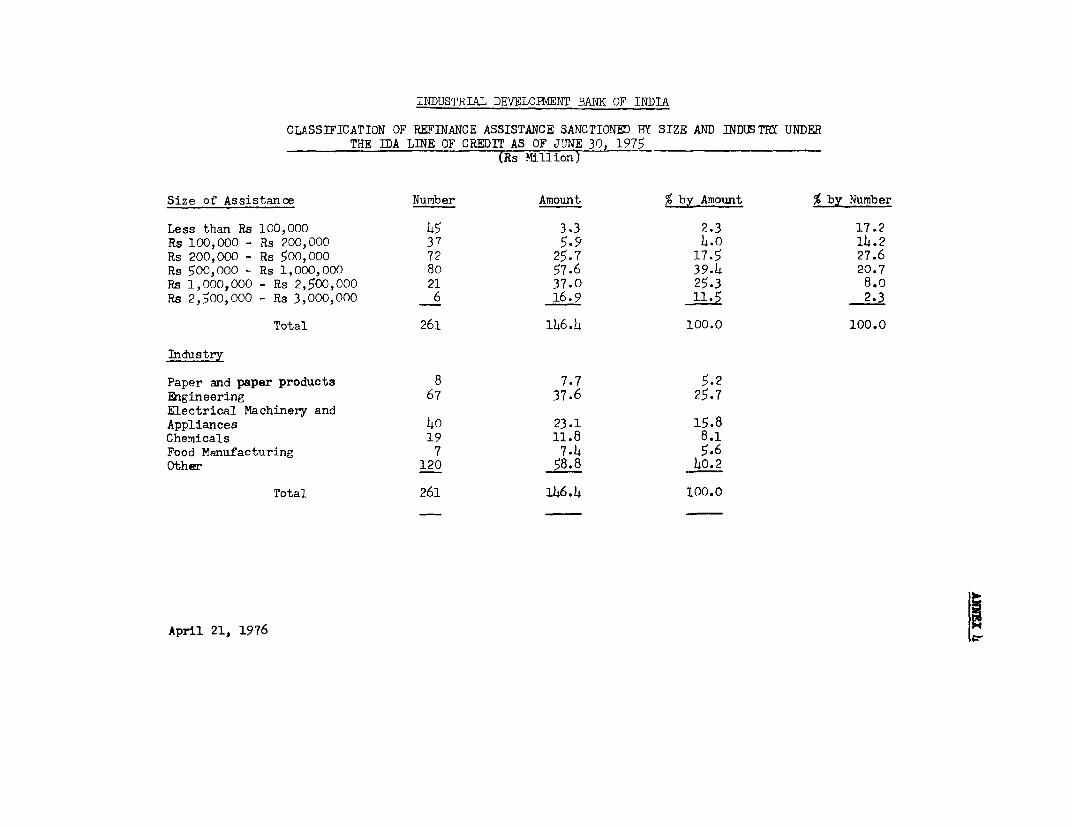
INDUSTRIAL DEVELOPMIENT BANK OF INDIA
CLASSIFICATION OF REFINANCE ASSISTANCE SANCTIONED BY SIZE AND INDLE TRY UNDERTHE IDA LINE OF CREDIT AS OF JUYNE 30, 1975
(Rs Million)
Size of Assistance Number Amount % by Amount % by Number
Less than Rs 100,000 45 3.3 2.3 17.2Rs 100,000 - Rs 200,000 37 5.9 4.o 14.2Rs 200,000 - Rs 500,000 72 25.7 17.5 27.6Rs 500,000 - Rs 1,000,000 80 57.6 39.4 20.7Rs 1,000,000 - Rs 2,500,000 21 37.0 25.3 8.0Rs 2,500,000 - Rs 3,000,000 6 16.9 11.5 2.3
Total 261 146.4 100.0 100.0
Industry
Paper and paper products 8 7.7 5.2Eigineering 67 37.6 25.7Electrical Machinery andAppliances 40 23.1 15.8Chemicals 19 11.8 8.1Food Manufacturing 7 7.4 5.6Other 120 58.8 40.2
Total 261 146.4 100.0
April 21, 1976

INDUSTRIAL DEVELOPMENT BANK OF INDIA
SFC-wise break-up of applications received/wanctioned/withdrawn, rejected and closed/pending under IDA Credit as on February 29, 1976
(Rs million) RC - Rupee Component
FC -.Foreign Currency Compenent
Sr. Applications Received Applications Sanctioned Applications withdrawn! Applications pending
No. SFC rejected/closed _
No. RC FC TOTAL No. RC FC TOTAL No. RC FC TOTAL No. RC FC TOTAL
1. APSFC 39 15.9 16.3 32.3 21 5.1 6.1 11.2 11 5.8 4.9 10.7 7 5.1 5.3 10.4
2. AFC 7 5.4 5.0 10.3 4 3.8 3.4 7.2 1 1.2 0.1 1.2 2 o.4 1.5 1.9
3. BSFC 10 6.7 4.7 11.4 8 2.5 2.1 4.6 1 3.0 2.1 5.0 1 1.2 0.6 1.8
4. DFC 39 8.7 9.3 17.9 25 2.3 5.5 7.8 5 .9 1.0 1.9 9 5.4 2.7 8.2
5. GSFC 106 31.4 53.0 84.4 58 19.9 32.0 51.9 30 7.1 13.3 20.5 18 4.4 7.7 12.1
6. HFC 43 17.1 16.7 33.9 24 5.6 8.5 14.2 12 5.8 5.9 11.7 7 5.7 2.3 8.0
7. HPFC 7 1.8 5.3 7.1 5 1.1 2.1 3.2 1 0.3 o.6 0.9 1 0.4 2.6 3.0
8. JMKSFC 2 0.4 0.3 0.7 2 0.4 0.3 0.6 - - - - - - - -
9. KFC 12 10.9 13.5 24.4 5 5.5 6.6 12.1 1 0.5 0.5 6 5.4 6.5 11.8
10. MPFC 16 4.0 7.5 11.5 10 2.2 3.2 5.4 5 1.5 1.7 3.2 1 0.4 2.6 3.0
11. MSFC 226 55.6 97.0 152.6 139 30.8 49.9 80.7 58 14.4 35.3 49.6 29 10.4 11.9 22.3
12. KSFC 111 28.5 41.9 70o,4 92 22.3 32.3 54.6 6 4.3 4.7 9.0 13 1.8 4.9 6.7
13. OSFC 9 3.1 5.3 8.4 2 0.8 0.8 1.6 7 2.3 4.5 6.8 - - - -
14. PFC 11 2.9 7.9 10.9 8 1.6 3.5 5.1 2 0.3 4.0 4.3 1 1.0 .4 1.4
15. RFC 22 17.9 12.7 30.6 10 10.4 6.1 16.4 9 6.1 5.1 U1.2 3 1.5 1.6 3.0
i6. TTTC 120 46.h 43.8 90.2 85 36.0 32.6 68.7 15 6.1 8.6 14.8 20 4.3 7.5 11.8
17. UPFC 41 20.2 15.4 35.6 29 9.0 11.5 20.5 11 9.8 2.4 12.1 1 1.5 1.5 3.0
18. WBFC 34 8.1 14.o 22.1 24 5.7 7.9 13.6 2 0.1 °.2 o.4 8 2.3 5.8 8.1
TOTAL 855 285.1 369.6 654.8 551 165.0 214.4 379.4 177 68.9 94.8 163.8 127 51.2 65.4 116.6
April 21, 1976

AMNEX 6
INDUSTRIAL DEVELOPMENT BANK OF INDIA
SFC-wise break-up of assistance disbursed by SFCsunder IDA Credit upto February 29, 1976
(Re Million)
RC - Rupee ComponentFC - Foreign Currency
Component
Sr.No. SFC RC FO Total
1. Andhra Pradesh 1.5 3.4 4.92- Assam 1.4 2.5 3.93. Bihar 0.3 0.4 0.7
4- Delhi 0.4 0.4 0.8
5- Gujarat 8.4 7.4 15.8
6. Haryana 0.8 0.4 1.2
7. Himachal Pradesh 0.5 0.9 1.4
8. Jammu & Kashmir 0.2 0.1 0.3
9. Kerala 1.3 2.9 4.2
10. Madhya Pradesh 0.2 1.5 1.6
11. Maharashtra 10.3 15.6 26.0
12. Karnataka 13.9 22.6 36.5
13. Orissa 0.5 - 0.5
14. Punjab 0.3 1.0 1.4
15. Rajasthan 3.9 1.5 5.4
16. Tamil Nadu 8.2 4.7 12.9
17. Uttar Pradesh 1.4 3.4 4.8
18. West Bengal 0.4 1.2 1.6
Total 53.9 69.9 123.8
April 21, 1976

ANNEXr
INDUSTRIAL DEVELIOPMNT BANK CF INDIA
IDA Credit - Proposals cleared by CGAC Uptomeeting held on February 20, 1976
(Rs million)
No. of importSFC licence applications Value
1. Andhra Pradesh 38 14.1
2. Assam 11 6.7
3. Bihar 10 2.4
4. Delhi 43 12.3
5. Gujarat 80 28.8
6. Haryana 42 13.1
7. Himachal Pradesh 6 4.6
8. Jammu & Kashmir 3 0.7
9. Kerala 16 8.7
10. Madhya Pradesh 21 7.2
11. Maharashtra 223 64.5
12. Karnataka 86 28.8
13. Orissa 3 .9
14. Punjab 12 5.3
15. Rajasthan 14 5.3
16. Tamil Nadu 125 39.0
17. Uttar Pradesh 38 13.0
18. West Bengal 54 17.0
Total 825 272.4
April 21, 1976

STATE FINANCIAL CORPORATIONS
Financial and Economic Data on a Sanmpler. of IDBI Subprojects
Internal Rate of Return2/ Domestic Resource Cost Capital Cost per Job
3/ 28ve Irage-/ 31s .9 pr sUS$___Average- = 28.8% Rs 6.90 per US$ 1 Average- = US$10,683 per Job
Distribution No. % Distribution No. % Distribution No. .
from 11% to 20% 17 25 below Rs 6.00 14 25.0 below US$ 5,000 18 28.6
from 21% to 30% 31 h6 from Rs 6.00 to Us$ 5,000 to
Rs 6.99 16 28.6 US$ 9,999 20 31.7
from 31% to 40% 9 13 from Rs 7.00 toRs 7.99 10 17.8 US$ 10,000 to
US$ 14,999 10 15.9
from 41% to 50% 4 6 from Rs 8.00 toIL 8.99 7 12.5 US$ 15,000 to
US$ 19,999 7 11.1
from 51% to 60% 7 10 from Rs 9.00 toRs 9.99 7 12.5 US$ 20,000 to
US$ 24,999 1 1.6
from Rs 10 and above 2 3.6 US$ 25,000 and above 7 11.1
Total 68 100% 56 100.0% 63 100.0%
1/ The sample consists of 68 nA" subprojects submitted to IDA for approval. It has been reduced when data were not
available.2/ Following IDBI definition where Net cash flows = (Net Profit + Depreciation + Interest + Tax) - (fixed assets
+ inventories).3/ Unweighted average.
April 21, 1976

CREDIT ODJAANMTEE SCHEMEA
Statenent Showing th,e Position of Clais Applications from State isancial. Corporations
As of Jue 975
upto end of April 1973 April 1971* April 1975 Ulpto end of Upto end of April 1973 April 1974* April 1975 Upto end of Ujpto end ofName of Corporation March 1973 to to to June 1975 March 1973 to to to June 1975 Marsh 1973 Up to Up to Up io
(Comulative) March 1974 March 1975i Jone 1975 (Comulative) (ComuIative) March i974 March 1975 June 1975 fCumulative) (Cumulative) March 1974 March 1975 June 1973Nfo-.Mat. No.-Amat. No. Ant. No. . No. AMat. Nc. AMat. :No. La.No Amt. No at7S Ml ! F- 3-t ¶Irs-IEr
1. Aodhra Peadesh-l 9 32-L0 i6 856.o I LU0 P6 1,i8o.o 8 260.0-- -- 8 260.0 16 856.o 15 732.0 15 732.0
2. Assesm ---- -
3. Nihar---
4. Delhi--- - -
5. Gujarat3 142.0 1 3.0 24 654.o 28 799.0 1 74.0-- -- 1 74.0 2 68.o 1 3.0 24 654.0 27 725.0
6. Haryana 1 250.0 -- 1 250.0 - ----- 1 250.0 1 2,50.0 1 250.0 1 250.0
7. Himachal Pradesh - - - - - -
8. JawTu ohKashnir 4 75.0 - j 4o.o 4 278.0 9 393.0 4. 75.0 -1 4o.o 5 115.0 --- 4 2r8.0
9. Kerala - - - - - - --
10. Kfarnataka 3 77.0 7 536.0 8 869.0 18 1,482.0 - 1 2.0 1 U1.0 1 53.0 3 66.0o 77.0 9 612.o 16 1,470.0 15 i,417.0
11. Madhya Pradesh 2 39.0 1 566.o 1 250.0 - - 4 855.0 2 39.0-- - - - - - 2 39.0 3. 566.0 1 250.0 2 816.0
12. MaharashtraA/ 2 397.0 - 3 531.0 3 488.0 8 i,416.o 1 62.0 1 i62.0 - - 2 224.0 - 3 531.0 6 1,019.0
13. Orissa 4 232.0 -- -- -- - - 4 232.0 4 232.0… … … … … … …- - 4 232.0 -
14. Punjab - - --- --
15. Rajasthan- ---- --
it. Uttar Pradesh - 9 i,544. o 1 250.0 - 1 1,794.0 - - 1 250.0 - 1 250.0 - 9 i,544
.o 9 1,544. 0 9 i,544.o
17. West NengalY' 6 481.0 2 i46.o0 - 8 627.0 3 8i.0 1 221.0 - - 4 302.0 2 384.0 1 63.0 - - 2 226.0
iS.8 Tamil Hado - ---- --
Total 34 2,016.0 36 3,651.0 39 2,595.0 7 766.0 lU 9,028.0 23 823.0 3 385.0 3 301.0 1 53.0 30 1,562.0 3 779.0 38 3,894'.0 69 5,431.0 di 7,007.0
%/Includes applications withdrawn/or in respect of which amounts have heen reduced. FApril 21, 1976
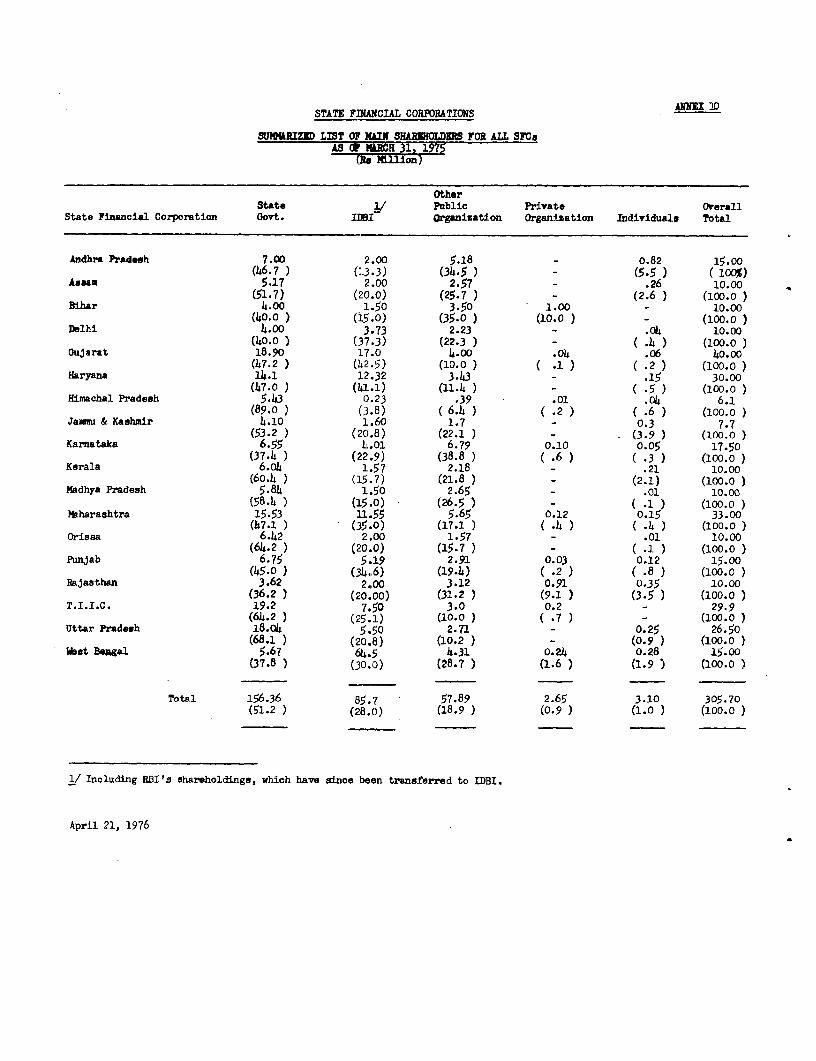
STATE FWANCIAL CORPORATIONS X 20
SUNKItIZUD LIST OF XAIN SHAOHLDSR FOR ALL SFC.AS B NARCH 31 1975
(Re RUlllon)
OtherState 1/ Pablic Private Overall
State Financial Corporation Govt. I1lI organization Organization Individuals Total
Andhra Pradesh 7.00 2.00 5.18 0.82 15.00(4 6.7 ) (].3.3) (34.5 ) - (5-5 ) ( 100%)
AssamN 5.17 2.00 2.57 - .26 10.00(51-7) ('0.0) (25.7 ) - (2.6 ) (100.0 )
Bihar 4.00 1.50 3.50 1.00 - 10.00(40.0 ) (15-0) (35.0 ) (10.0 ) - (100.0 )
Delhi 4.00 3.73 2.23 - .04 10.00(40.0 ) (37.3) (22.3 ) - ( .4 ) (100.0 )
Oujarat 18.90 17.0 4.00 .04 .06 40.00(47.2 ) (142.5) (10.0 ) ( .1) (.2 ) (100.0)
Haryana 14.1 12.32 3.43 - .15 30.00(47.0 ) (4:L.1) (11.4 ) - ( .5 ) (100-0)
Himachal Pradesh 5.43 0.23 *39 .01 .04 6.1(89.0 ) (3.8) (6.4 ) (.2) (.6 ) (100.0)
Janmu & Kashmir 4.10 1..60 1.7 - 0.3 7.7(53.2 ) (2(.8) (22.1 ) - (3.9 ) (100.0
Karnataka 6.55 4.01 6.79 0.10 0-05 17.50(37.4 ) (22'.9) (38.8 ) (.6) (.3 ) (100.0)
Kerala 6.o4 1.57 2.18 - .21 10.00(60.4 ) (15.7) (21.8 ) - (2.1) (100.0 )
Madhya Pradesh 5.84 1.50 2.65 - .01 10.00(58.4 ) (15.0) (26.5 ) - ( .1 ) (100.0
Mlharashtra 15.53 11.55 5.65 0.12 0.15 33.00(h7.1 ) (35.0) (17.1 ) ( .4 ) ( .4 ) (100.0 )
Orissa 6.42 2.00 1.57 - .01 10.00(64.2 ) (20..0) (15.7 ) - ( .1 ) (100.0 )
Punjab 6.75 5.,19 2.91 0.03 0.12 15.00(45.0 ) (34.,6) (19.4) ( .2 ) ( .8 ) (100.0
Rajaathan 3.62 2.00 3.12 0.91 0.35 10.00(36.2 ) (20.00) (31.2 ) (9.1 ) (3.5 ) (100.0 )
T.I.I.C. 19.2 7.50 3.0 0.2 - 29.9(64.2 ) (25.1) (10.0 ) ( .7 ) - (100.0
Uttar Pradebh 18.04 5.50 2.71 - 0.25 26.50(68.1 ) (20.8) (10.2 ) - (0.9 ) (100.0
lbst Bmgal 5.67 64.5 4.31 0.24 0.28 15.00(37.8 ) t30.;D) (28.7 ) (1.6 ) (1.9 ) (100.0 )
Total 156.36 85.7 57.89 2.65 3.10 305.70(51.2 ) (28.0) (18.9 ) (0.9 ) (1.0 ) (100.0 )
1/ Including RBI's shareholdings, which have since been transferred to IDBI.
April 21, 1976

STATE FINANCIAL CORPORATIONS
SUMMARY OF SFCS STAFFING PATTERN AS OF DECEMBER 31, 1974
Changes Changes
March 73 - March 74 1/ March 74 - December 74 I
Staff on hand -/ Professional Other Staff on hand - Professional Other Staff on hand -
March 31, 1973 New Termi- New Termi- March 31, 1974 New Termi- New Termi- December 31. 1974
State Financial Corporations Professional Other Recruit nations Recruit nations Professional Other Recruit nations Recruit nations Professional Other
Andhra Pradesh 23 62 10 3 19 6 30 75 11 5 14 6 36 83
Assam 13 22 4 - 5 1 17 26 1 - 3 3 18 26
Bihar 12 52 7 1 28 - 18 80 5 1 22 1 22 101
Delhi 30 44 1 1 1 2 30 43 4 - 4 3 34 44
Gujarat 45 246 10 5 37 9 50 274 3 5 23 11 48 286
Haryana 18 68 2 4 22 5 16 85 19 2 43 20 33 108
Himachal Pradesh 6 14 1 - - 2 7 12 5 - 8 4 12 16
Jaemu & Kashmir 11 30 9 2 11 5 18 36 8 5 18 10 21 44
Karnataka 23 64 6 - 6 1 29 69 7 2 15 1 34 83
Kerala 47 46 3 1 3 - 49 49 10 - 23 - 59 72
Madhya Pradesh n.a n.a n.a n.a n.a n.a 22 21 22 - 12 - 44 33
Maharashtra 204 376 n.a n.e n.a n.a 249 319 n.a n.a n.& n.a 249 319
Orissa 16 35 - - 5 1 16 39 1 _ n.a n.a 17 56
Punjab 6 69 5 1 32 18 10 83 1 - 32 13 21 102
Rajasthan 26 36 4 3 11 7 27 40 7 1 22 7 33 55
T.I.I.C. 16 76 - - n.a n.a 16 88 n.a n.a n.a n.a 45 134
Uttar Pradesh 105 55 32 8 41 15 129 81 13 2 52 5 140 128
West Bengal 17 23 7 3 1 - 21 24 10 4 8 3 27 29
2/Total -/ 618 1318 101 32 222 72 754 1444 137 27 299 86 893 1719
/ Including 'Junior Officers' in professional category.
/ Totals do not agree owing to non-availability of data in respect of some SFCs.
April 21, 1976

STATE FINfJGI U CORPORATIONS
SUMMARY OF FINANCIAL RS50J1CES AS OF PARCH 31 1975
(Re millions)
LoansShare State TStal
State Financial Corporation Capital Reserves RBI MDBI Govt. Others Bonds Deposits Resources
Andhra Pradesh 15.00 16.03 - 56.22 - 22.26 107.50 4.52 221.53Aueam 10.00 5.19 3.85 9.98 - 2.95 28.70 7.75 68.42Bihar 10.00 7.70 6.00 46.69 1.39 27.27 46.34 - 145.39Delhi 10.00 5.24 - 30.6 1.6 5.65 26.60 - 79.69Gujarat 4o.oo 12.10 31.4 105.4 10.2 19.6 181.1 39.9 439.70Haryana 30.00 10.38 2.00 65.41 - 5.12 62.52 .26 175.69Himachal Pradesh 6.10 2.39 0.50 15.13 1.00 2.86 5.51 - 33.49Jamu & Kashmir 7.66 3.80 1.10 12.71 .67 1.97 13.75 - 41.66Karnataka 17.50 11.17 - 91.24 2.40 18.84 91.78 17.35 250.28Kerala 10.00 6.64 7.4 28.08 1.73 11.02 95-25 3.45 163.57Madhya Pradesh 10.00 6.92 - 24.27 - 4.47 56.14 .05 101.85?aharashtra 33.00 17.27 a/ 17.50 91.11 - 2.58 239.32 28.78 429.56OrisBa 10.00 4.20 2.00 10.06 - 6.93 37.75 - 70.94Punjab 15.00 7.84 3.50 56.22 - 7.65 39.04 .05 129,30Rajasthan 10.00 7.95 - 45.16 - 6.06 52.60 .03 121.80T.I.I.C. 29.96 20.59 b/ - 76.18 5.45 26.93 129.98 111.27 420.36Uttar Pradesh 54.00 78.51 17.50 375.16 27.19 58.10 181.99 7.00 799.45West Bengal 170.00 Q/ 84.51 56.00 259.51 - 87.71 458.26 - 1115.99
Total 488.22 308.43 148.75 1399.13 51.63 317.97 1854.13 220.41 4788.67
a/ Including share application money (Re 3.40 million).b/ Including undistributed earnings (Ra 1.16 million).c/ Including Special Capital (Rs 20.0 million).
April 21, 1976

STATE FINANCIAL CORPORATIONS
SUMMARY OF OPERATIONS FY73-FY75 AS OF MARCH 31, 1975(Amounts in Rs million)
State Financial Corporations Net Sanctionsl/ Disbursements Repayments Outstanding
FY73 FY74 FY75 FY73 FY74 FY75 FY73 FY74 FY75 FY73 FY74 FY75
Andhra Pradesh 71.5 85.37 102.63 33.20 41.06 57.42 13.17 19.17 20.49 141.10 163.31 200.23
Assam 4.94 14.37 8.89 4.01 6.60 7.64 2.87 3.36 2.93 4.80 5.29 5.90
Bihar 43.8 61.7 75.8 18.6 29.7 34.8 3.1 4.3 3.0 66.7 92.6 124.4
Delhi 14.3 16.1 18.9 12.6 13.1 15.1 4.6 6.2 5.6 58.8 63.3 74.1
Gujarat 139.5 178.5 188.0 70.6 85.9 144.7 21.9 26.5 38.5 227.0 285.3 409.6
Haryana 47.12 64.25 92.70 26.97 32.40 49.10 9.00 14.03 12.16 100.97 125.10 167.01
Himachal Pradesh 9.79 114.00 20.87 6.14 10.81 11.11 2.79 4.11 4.12 16.12 23.06 30.05
Jammu & Kashmir 11.9 14.8 13.9 8.7 11.0 18.5 8.8 8.4 7.7 25.1 27.7 39.5
Karnataka 59.2 85.7 103.7 39.3 46.4 75.03 11.8 18.1 21.7 139.2 166.9 223.6
Kerala 54-3 38.6 69.8 28.4 20.9 26.6 3.4 6.6 9.2 1014.5 122.0 147.2
Madhya Pradesh 15.7 16.0 49.8 9.3 10.1 6.8 7.6 8.8 4.3 72.6 77.7 81.9
Maharashtra 80.2 182.7 221.7 65.2 92.3 74.7 40.4 45.1 33.25 294.0 342.84 383.45
Orissa 16.62 12.71 30.75 8.10 9.57 11.87 4.53 3.11 2.91 41.76 47.53 56.49
Punjab 33.48 48.39 63.39 19.39 28.28 5o.41 7.89 11.95 11.23 66.49 81.44 120.84
Rajasthan 35.95 29.48 68.66 18.78 21.80 28.34 5.67 7.17 7.24 80.63 93.80 113.19
T.I.I.C. 45.6 57.7 177.4 23.6 41.0 82.4 22.8 28.6 25.8 279.0 313.7 376.7
Uttar Pradesh 79.27 86.75 64.31 48.13 42.36 34.28 11.46 14.61 8.20 145.57 173.31 199.40
West Bengal 26.12 23.99 44.52 8.04 7.17 9.56 899 8.05 4. i4 78.07 78.68 85.79
Total 789.29 1031.11 1415.72 449.06 550.45 738.36 190.77 238.76 222.47 1942.41 2283.56 2839.35
After cancellations, but including equity investments, debenture investments and guarantees.
April 21, 1976

STATE FINANCIAL CORPORATIONS
Loans Sanctioned by Size of Unit and by State
State Financial Corporations (FY75)(Rs Millions)
Medium Scale Sector Small Scale SectorPercentage Percentage
State Financial Corporations No. Amount No. Amount No. Amount No. Amount
Andhra Pradesh 54 48.68 10.0 49.0 487 50.65 90.0 51.0Assam 6 6.14 40.0 70.0 9 2.63 30.0Bihar 11 18.83 5.2 25.0 201 56.47 94.8 75.0Delhi 7 6.o8 5.6 19.6 119 24.92 94.4 80.4Gujarat 47 65.44 4.0 32.0 1,119 139.06 96.0 68.oHaryana 93 44.5 27.7 48.0 243 48.2 72.3 52.0Himachal Pradesh 9 12.47 6.4 41.2 131 17.77 93.6 58.8Jammu & Kashmir 6 2.2 2.3 10.2 256 19.3 97.7 89.8Karnataka 37 51.93 11.8 50.0 278 51.79 88.2 50.0Kerala 39 27.23 10.9 39.0 318 42.57 89.1 61.0Madhya Pradesh 8 27.39 12.5 55.0 56 22.41 87.5 45.0Maharashtra 80 126.37 10.0 57.0 721 95.33 90.0 43.0Orissa 19 9.18 9.1 30.0 191 21.42 90.9 70.0Punjab 46 31.31 7.9 31.0 534 69.69 92.1 69.0Rajasthan 36 35.29 11.2 50.0 286 35.3 88.8 50.0Tamil Nadu 92 101.25 19.9 66.0 370 52.15 80.1 34.0Uttar Pradesh 56 32.43 13.8 55.0 349 31-44 86.2 45.0West Bengal 22 31.86 24.2 74.0 69 11.19 75.8 26.0
Total 668 684,58 10.4 46.4 5,737 792.29 89.6 53.6
April 21, 1976
* 0 e I

STATE FINANCIAL CORPORATIONS
Analysis of Arrears as of March 31. 1975(Rs nillion)z'
Total Principal Outstanding Principal and Interest (1) Aa S of Total Loans (2) As % of Total Loan.State Financial Corporations of leam in Arrears in Arrears OuttadOuE
March March Narch March March March Mab rch Nmrob Marc1973 1974 1975 1973 1974 1975 1973 197k 1975 fl73 19 2
Andhra Pradesh 32.11 28.21 34 .idi" 5.78 4.64 6.1 8k/ 23.70 17.83 17.7 ' 4.26 2.93 3.1 VAssam 22.45 2 2 . 07 kZ 33.5 14.39 16.333/ 17.53 58.62 56.12/ 56.00 37.57 41.52 36.7Bihar 18.89 23.0-04 51.6 2 V 5.35 6.432" 10.73 ' 32.04 33.9, 1 44 . 00V 9.06 9 .47 9.15Delhi 15.27 n.a. 20.8 V 3.25 n.a. 6.5 " 27.37 n.a. 29.2 5.82 n.a. 9.1Gujarat n.a. n.a. 141.14 n.a. n.a. 41.12 V n.a. n.a. 40.9 n.a. n.a. 11.6 VHsryana 36.91 39.89 5 7 .3 5V 9.56 7.17 12.334 37.14 32.31 38.9"' 9.62 5.81 8.*Himachal Pradesh 6.47 8.45 6 .7 6W .97 1.32 1. 6 4 W 40.09 36.62 2 5 .8 6 V 6.02 5.7,4 6.2Jau & Kashmir 5.09 5.26?/ 1 3 . 30W/ 1 .42! 1 .42" 2 .01 -V 20.1 20.5 3/ 39.3 / 5.5 5.6 & 6.0 VKarnataka 43.97 n.a. 73.90W 13.02 n.a. 1 9 .33 W 35.91 n.-. 37.4*I/ 10.63 n.a. 9 .7 8k/Kerala 42.80 58.81 78 .7 8W 7.80 14.54 2 0. 22-4/ 41.7 8 49.17 59 .49k/ 7.61 12.15 15.2*Kadhya Pradeh 26.9 16.8 31.2 / 11.5 9.6 13.6 / 37.12 21.68 38.09/ 15.77 12.00 16.60b/Maharashtra 117.68 131.54 132.39k/ 25.02 28.27 28 .9 5V 25.02 28.27 28.98V 8.66 8.37 7.64VOrissa 15.98 20.639/ 2 8 .57k/ 7.12 8 .4 1 r/ 12.76V 42.10 49.7k2-/ 5 8 .80 W 18.76 20.3hz" 26 .2 6 W/Punjab 12.26 16.04 21.1* 2.39 2.21 2.2OW 18.80 20.5 20.0/ 3.67 2.81 2.134/Rajasthan 10.98 10.79-/ 15.87 1.61 2.313' 8.55 314.69 13JW/ 15.00 .2.15 2.883' 8.00Tamil Nada 97.44 96.72 9 8 .11/ 50.20 48.63 46.910/ 57.17 52.29 46.3 J/ 29.1&5 26.29 21.5 2/Uttar Pradesh 65.01 n.a. 120.564 8.53 n.m. 28.56W 147.68 n.a. 61.33k' 6.24 n.a. 14 .5 0WWest Bengal 42.63 54.962/ 53.62 19.98 17.7221 19.76 58.5 71.2 2/ 61.9 2k.2 25.7 23.0
1x helude suit-filed cases.J An Ot Ssetber 1973
As of Septmber 1974As of December 1974
April 21, 1976

SIJIdMARY OF COOPERATIVE OPERATIONAL RATIOS
STATE Ff882135 QORFYRATI2OS ANDHRA8 P035S0 ASSAM "H.AR DELIP GUJARAT7 HAFYANA IPSMACHAL P85D15SF qnAs & 5831*43 68AR8TA2A
FY73 FY74 FY75' P73 FY74 055 FY79 074 Ff75 PY73 fY74 FY75 FY7 3 FY74 FY75 FY73 FY74 FY75 FY79 FY74 FY75 FY73 FY74 FY75 FY73 FY74 FY75
Title of Opevotion.1 Bathos
A. Ratios of Pfnfit.btlity.FRof it bf-for ao and prcci-ioan 9 of aegetotal assets 3.057 4.i 4.6 2.3 2.1 o,4 2.26 2.24 4.1. 3.76 3.6B5 4.46 1.4 1.6 1.8 2.87 3.37 3.16 4.54 3.97 4.32 4.0 4.2 4.3 2.14 2.35 2.50
2 . Frofit after tax as f overagetots.a no-to L.76 3.1 3,I. 1.1 I .5 0.2 1.37 1.41 2.68 1.90 2.17 2.88 2.8 0.9 1.2 1.54 1. 92 1.06 2.40 2.09 2.67 2.2 2.2 2.7 1.15 1.26 1.53
3 . FofIt after tan s of yea-sodsh-r osFite). 17.34 21.0 30.2 6.2 6.7 1.7 8.98 03.70 33.47 13.24 13.47 21.0o2 5.4 7.2 11.1 14.65, 15.43 10.93 4.31 7.90 13.12 7.5 3.5 12.5 1lo86 14.5 16.7
F3. RtoofStruot-s4 Ns-curent onvethooldObt/
eqoIty 4.98:1 5.37:1 5.35:1 2.30 3.02 '3.3). 4.31 4.74 5.64 3.61:1 3.84:1 3.36:1 5.6:1 7.0:1 7.3:15.6: 4.87:1 3.24:1 1.30 2.12 2.6i 1.7:1 1.7:1 2.5:1 5.9 6.6 7.3
5. D0664 -erloochrgo 1.03 1.67 1.4 2.41: 2.76:1 1.0:1 0.79 iCY7 4.21. 1.6:140:1 1.05:2 1.1:2 1.1:5 1.7:1. 1.12:1 1.L2:1 0.88:1 0.19 1.65 1.51 1.9:1 4.7:1 0?.8:1 1.37 i.48 0.36
P. 8aRt2..2r 2 WL (f groath oP
tots),.. asts 9 12.3 16.7 t80. 3.7 19.3 9.3 33.27 79.76 21.4 07.05 13.91 20.54 y8.8 27.1 41.7 24.12 29.23 32.2 18.3 52.8 27.7 6.4 5.2 36.0 20.6 21.4 31.9
D. Flonasta. at7. Isc.- frn FaTs Loan as 9 of
overge tens oo portfolio 8.57 8.3 9.4 7.4 7.1 6~.7 7.61 8.1oc 9.32 9.53 9.94 10.90 0.3 8.4 9.2 9.17 9.41 9.75 10.26 10.14 10.62 9.6 9.7 10.5 8.60 8.36 SIco
8. Cos.t of t-s 856t as ofoverage ten debt 5.97 6.90~ 6.15 5,4 5,2 6.1 5.50 5.1 5.2 _5 561 5.8 .66 5.4 5.4 6.0 5.69 5.6o 5.75 5.Ri 5.66 5.62 6.2 5.1 6.1 5.7 5.5 5.9
9. Eqoity Inane (inrdiodg -5
t cait-gs)no bnfoce tao) an 9 of aveeneqOity portfolio 17.52 20.0 24.2 sn0n .. c. n. n.t. o. na .8 0.9 3.2 na a n a a s a a .. - 1.0 2.6,
E. Costs1.Fissnoiji cost no9f averge
total asoto 4.42 4.47 4.73 3.7 3.7 u.5 3.96 3.75 3.65 4.51 4.29 4.29 4.5 4.5 5.0 4.62 4.sv 4.37 3.03 3.34 9.61 3.6 3.0 3.9 4.7 4.6 4.86
l1. Adtis.t-atlve cotso ofaverage total as-ts .53 .61 .74 - . - 1.o7 LA0 0.04 i.i8 1.55 5.54 1.6 2.2 1.3 O.96 0.97 1.21 1.94 1.96 2.32 1.3 2.6 1.7 .03 .90 .9
F. Reseve
PIns Fr-isioO s 9- of pear end portfolio(loans, guaratees and soulty poetfolic) 6.1 6.9 7.9 9.7 8.1 7.9 5.21 4.97 6. 05 3.49 5.28 7.07 3.0 3.0 3.1 5.35 5.77 6.29 7.06 6.94 7.95 9.0 10.5 9.6 5.2 4,7 4.6
13. Reserves for bad debts an of year sadloan and eqoity Fortfolio 0.77 2.9 1.08 1.3 1.2 1.1 1.25 1.33 1.76 0.4S 0.57 o.66 o.6 0.5 0.4 0.59 0.87 0.71 0.41 o.66 0.75 0.4 0.15 0.13 .67 .6 .48
G. SRh-56P1ts.114T03sB 68k 4 s 9 of Far vaos 159 177 207 134, 149 152 135 145 177 122. 133, 152. 121 120 130 1.53. 147. 134. 119 1cR 139 131. 137. 148. 146 147 157
15. DilsdO f For ca- ofshrcapital 3.5 3.5 3.5 3.5 3.5 0.4 3.5 3.5 3.5 2.31 3.62 3.62 2.9 3.5 3.5 4.4 3.3 2.1 3 3 3 4.3 4.3 4.3 3.R 3.8 3.4
IE. Dividend an 9f 0t earings(Pay sot soth.) 20.2 ia.1 ill6 57.7 52.0 23.5 36.98 25.55 9.87 22.56 26.87 17.22 55.4 36.9 29. i6.i 12.3 12.6 47.52 38.45 22.88 44.2 29.4 19.9 35.2 26.4 19.42

STATE' FIIIARC IAL CoORPRATIONS MAIA MADSHYA FMERSH MAHA2801fTRA 021021 PUNJAB2 FJA383 SR Y0 . I. I. C. UTfAR PRADSHR WEST BENGAL
Title of Opara tioo1 Raise FY73 Mv4 FY75 FY73 FY74 P075 PY73 FY74 FY75 FY73 FY74 FY75 FY73 FY74 FY75 FY73 FY74 FY7 FM7 FY74 FY75 FY73 FY74 FY5 PY73 FY74 FY75,
A. Ratios of Fofitability1. Profit befor tax asd Br...isi-i
as % Of overge total assts 1.32 i,48 2.90 2.5 2.8 2.0 0.05 1.50 1.8 2.23 1.92 2.Ll 2.81 3.20 3.74 2.95 3.04 3.60 0.4 0.9 1.0 2.97 2.87 3.86 2.25 1.83 2.32
2. Profit after tao a%of avergetotal, assts 0.64 0.75 1.91 1.1 1.2 1.2 0.5 0.83 11.0 1.37 1.11 1.23 1.59 1.81 2.40 1.20 1.63 2.21 0.2 0.9 0.9 1.64 t.62 2.49 1. 28 i.26 1.80
3. Profit after tao a Of yea-endshare oapital 6.57 9.33 28.46 10.3 11.5 11.8 5. 49 9.80 12.7 6.95 6.32 8. 09 14.29 19.20 17.23 9.63 15.87 25.67 2.0 10.5 12.27 1.53 13.10 20.79 7.23 7.47 9.60
atio- of Ot-otur4. No-ourreat ovstinldebt!
equity 7.29 8.24 8.66 4.8 4.8 4.8 7.9 8.o 6.5 2.64:1 3.1:1 3.51:1 4.62:1 5.191:1 4.3:1 4.44 5.06 5.34 6.8:1 6.2:1 8.2:1 4.30:1 4.76:1 4.71:1 3.73 4.31 5.16
5. Debt sroei.. arhge 1.56 0.77 1.36 1.6 1.4:i 1.2:1 ii.64 0.07 1.17 1.02 0.73 1.32 1.87:1 i.86:1 1.22:1 .67 .87 1. 43 o.67:1 0.55:1 0.78:1 1.46:1 1.13:1 0.87:i 1.04 0.83 0.64
C.. .Avo9g.Rt, of.0rostb _b
total .. asots 9 30.12 15.15 22.06 5.2 11.1 1.4 113.4 9.5 20.8 12.11l 12.72 17.18 18.70 17.43 50.72 24.88 21.10 23.58 7.3 2.3 32.8 34.30 19.40 23.51 (1.25) ii.40 18.9
D. Fi-aioa Ma-gias7. Iara- fr- Tes- on L as 9 of
oveag test loa 2ortfolio 7.70 7.89 9.60 8.7 8.4 8.0 8.5 8.78 9.0 9.36 9.03 8.97 9.10 9.30 9.86 9.57 9.45 10.37 5.1 6.6 3.1 8.8o 8.75 10.33 7.69 7.12 7.65
8. Cost of ters debt a8ofaverge ten debt 5.71 5.30 5.93 5.6 5.5 5.5 5.80 5.70 5.8o 5.70 5.75 5.61 5.57 5.45 5.81 6.12 5.64 5.74 4.7 6.2 5.9 5.53 5.38 5.68 5.37 5.07 4.02
9. Egoity Io-a (iooLodiag net sapito.1gains befor tan) a9ofeqoity portfolio a..a. 10.30 6.44 1.5 21.6 4.5 - - - 6.35 5.32 16.43 2.56 2.64 2.68 a.. aa .. 3.7 5.6 3.0 o.. a. aa. sa a.. a.
E. Costs10. f-inanla osats so9f avirge
total, assts 4.72 4.87 4.92 4.4 4.L 4.3 4.87 4.80 4.87 3.73 3.97 4.oi 4.10o 4.21 4.51 4.65 4.39 4.5o 3.4 4.5 4.4 3.93 3.94 4.22 3.71 3.50 2.82
11. Adnieltrativ- -t as 9 faeaetotal, assts 1.15 1.29 1.130 0.9 0.8 1.1 0.11 i.8O 2.14 1.07 1.16 i.4i 1.20 1.20 1.43 .92 1.64 1.18 0.5 0.0 0.9 1.29 i.56 1.84 o.94 i.o6 0.94
10 eevs(iaslodieg reti-d -ariagaplea pr-visi- as 9 of y-a sad portfolio(loan, g-aratees and eqoitysportfolio) 3.604 3.29 4.52 6.0 7.0 7.5 2.81 0.95 3.90 8.46 8.10 7.62 6.56 6.80 6.49 5.67 5.98 7.15 5.0 5.6 5.2 3.79 4.31 5.56 7.51 9.26 9.61
13. Reseve for bad debts a of Year e-d
loa and eqaitys portfolio 0.00 0.00 0.47 0.7 0.9 1.0 0.74 0.68 0.70 i.88 1.70 1.51 1.47 1.43 1.21 .76 .63 .70 1.1 1.0 1.0 0.22 0.32 0.54 0.19 0.37 0.46
FW52bi vlea9ofarvle 10 14 i6 475 158.4 169.2 1-29 134 142 134.114137.68 142.0 158.1 174.6 152.6 145 156 183 ibs4 15 163 153 14.7147.38 141 145 1,56
1757TDivuoad a9of Bar valu share-apita.1 3.5 3.5 3.5 3.5 3.5 3.5 3 1/2.5 3 W2.5 3 1/0 .5 3.75 3.75 3.72 3.49 3.49 2.61 3.5 3.5 3.5 2.3 '3. 0 3.0 3.5 3.5 3.5 3.5 3.5 3.5
16. Dividend s*of set earisgs(Pay-oat ratio) 533.27 37.51 12.29 i6.6 t4.2 18.9 59.3 40.7 26.3 53.96 59.33 46.35 04.4 18.19 15.13 36.31 02.05 13.65 112.0 28.6 24.5 27.35 26.73 16.88 48.17 46.87 36.5
APril 01, 1974

ANNEX 17
STATE FINANCIAL CORPORATIONS
Estimated Disbursement Schedule for the Proposed Second Credit(US$ million)
1976 October - December 1.6
Sub-total 1.6
1977 January - March 1.9April - June 2.2July - September 3.1October - December 3.8
Sub-total 11.0
1978 January - March 4.oApril - June 4.2July - September 4.0October - December _
Sub-total 15.7
1979 January - March 3.0April - June 2.0July - September 2.0October - December 2.0
Sub-total 9.0
1980 January - March 1.0April - June 0.7July - September o.6October - December o.4
Sub-total 2.7
Total 40.0
April 21, 1976