approach for importance performance analysis of product
TRANSCRIPT

Junegak JoungEnterprise Systems Optimization Laboratory,
Department of Industrial and Enterprise SystemsEngineering,
University of Illinois at Urbana-Champaign,Urbana, IL 61801;
Department of Industrial Engineering,Ulsan National Institute of Science and
Technology,Ulsan 44919, Republic of Koreae-mails: [email protected];
Harrison M. Kim1
Enterprise Systems Optimization Laboratory,Department of Industrial and Enterprise Systems
Engineering,University of Illinois at Urbana-Champaign,
Urbana, IL 61801e-mail: [email protected]
Approach for Importance–Performance Analysis of ProductAttributes From Online ReviewsThe importance–performance analysis (IPA) is a widely used technique to guide strategicplanning for the improvement of customer satisfaction. Compared with surveys, numerousonline reviews can be easily collected at a lower cost. Online reviews provide a promisingsource for the IPA. This paper proposes an approach for conducting the IPA from onlinereviews for product design. Product attributes from online reviews are first identified bylatent Dirichlet allocation. The performance of the identified attributes is subsequently esti-mated by the aspect-based sentiment analysis of IBMWatson. Finally, the importance of theidentified attributes is estimated by evaluating the effect of sentiments of each product attri-bute on the overall rating using an explainable deep neural network. A Shapley additiveexplanation-based method is proposed to estimate the importance values of product attri-butes with a low variance by combining the effect of the input features from multipleoptimal neural networks with a high performance. A case study of smartphones is presentedto demonstrate the proposed approach. The performance and importance estimates of theproposed approach are compared with those of previous sentiment analysis and neuralnetwork-based method, and the results exhibit that the former can perform IPA more reli-ably. The proposed approach uses minimal manual operation and can support companies totake decisions rapidly and effectively, compared with survey-based methods.[DOI: 10.1115/1.4049865]
Keywords: data-driven design, interpretable machine learning, neural network
1 IntroductionImportance–performance analysis (IPA) was first introduced by
Martilla and James [1]. It identifies the product/service attributesthat a company must focus on based on the importance and perfor-mance. IPA aids in the effective distribution of resources to maxi-mize customer satisfaction. It has been used to guide strategicplanning in various fields, such as tourism [2–4], e-governance[5], healthcare [6], and telecommunication [7]. The Kano modelhas been more widely used to identify customer needs in productdesign than the IPA, but the Kano model does not consider boththe performance and importance of product/service attributes [8].In the IPA, product/service attributes are categorized into four quad-rants based on the levels of importance and performance (Fig. 1).These four quadrants provide the following strategic guidelines.The attributes in quadrant 1 (Q1) with the managerial guideline,“Keep up the good work,” have high performance and importance.They indicate competitive advantages or major strengths. The attri-butes in quadrant 2 (Q2) with the managerial guideline, “Concen-trate here,” have a low performance but a high importance. Theseattributes require immediate action for improvement, being themajor weaknesses. The attributes in quadrant 3 (Q3) with the man-agerial guideline, “Low priority,” have low performance and impor-tance. These attributes are minor weaknesses. The attributes inquadrant 4 (Q4) with the managerial guideline, “Possible overkill,”have a high performance but a low importance. These attributes areminor strengths; therefore, attribute investment can be deployedelsewhere.Online reviews can be considered as a promising source for IPA
because they provide companies opportunities to receive customerfeedback and improve the corresponding product attributes [9].
Compared with surveys, numerous online reviews can be easily col-lected at a lower cost. The textual content of online reviews includesa high level of detail regarding product usage experience by present-ing information in verbal format [10]. Conducting IPA based ononline reviews allows companies to make strategic decisionsrapidly and effectively to improve the performance of next-generation products.However, numerous studies have used questionnaire surveys to
conduct IPA. For example, in one survey, obtaining 540 responsesrequired nine days, excluding the time for the pilot studies andsurvey analysis [3]. These surveys are time-consuming and expen-sive. Investigations on conducting the IPA of product attributesbased on online reviews are scarce. Instead, some studies have sug-gested methods to measure the performance and importance ofproduct attributes separately. Machine learning-based sentimentclassifiers [11,12], extraction rules with sentiment dictionaries[13–15], and aspect-based sentiment analysis of IBM Watson
Fig. 1 IPA
1Corresponding author.Contributed by the Design Automation Committee of ASME for publication in the
JOURNAL OF MECHANICAL DESIGN. Manuscript received July 21, 2020; final manuscriptreceived December 22, 2020; published online February 11, 2021. Assoc. Editor: MianLi.
Journal of Mechanical Design AUGUST 2021, Vol. 143 / 081705-1Copyright © 2021 by ASME
Dow
nloaded from http://asm
edigitalcollection.asme.org/m
echanicaldesign/article-pdf/143/8/081705/6633577/md_143_8_081705.pdf by U
niversity of Illinois Urbana-C
hampaign user on 28 April 2021

[16] were used to infer the performance of product attributes fromonline reviews. Term frequency [16–18], regression [19], andneural networks [2] were employed to measure the importance ofproduct attributes from online reviews.The contributions of the present study are threefold. First, an
approach with minimal manual operation is proposed to conductIPA from the online reviews for product design. The total runtimeof the case study, excluding product attribute identification withmanual operation, was approximately 2 h on a PC with a 16GBRAM, Intel i7-8550U, and the Ubuntu operating system. Thisapproach can aid companies to make strategic decisions morerapidly and effectively than surveys. Second, aspect-based senti-ment analysis of IBMWatson is employed for estimating the perfor-mance of product attributes in comparison to existing sentimentanalysis. The use of IBM Watson can reduce the time requiredfor developing an aspect-based sentiment classifier and canensure high accuracy. Third, a Shapley additive explanation(SHAP)-based method is proposed to estimate the importance ofproduct attributes using an explainable deep neural network(DNN). It provides importance values with a low variance by com-bining multiple optimal neural network models with a highperformance.The remainder of this paper is organized as follows. Section 2
reviews the literature on customer requirements elicitation inproduct design and the performance and importance estimation ofproduct attributes. Section 3 presents the proposed approach forIPA based on online reviews. Section 4 discusses a case study ofsmartphones to verify the proposed approach. Section 5 presentsthe proposed approach application and use of online reviews andan explainable DNN. Section 6 concludes the paper.
2 Literature ReviewThis section presents previous research on customer requirements
elicitation in product design from online reviews and subsequentlydescribes previous studies on the performance and importance esti-mation of product attributes in detail.
2.1 Customer Requirements Elicitation in Product Design.Identifying customer needs and preferences is highly importantfor a successful product design [20]. Previous research has deter-mined performance and importance from online product reviewsfor deciding the design direction of next-generation productsbased on customer needs. Zimmermann et al. [12] proposed aframework to identify product features and their polarity. Zhanget al. [15] suggested an opinion mining extraction algorithm foridentifying product features, their relationships, polarity, andopinion expression. Decker and Trusov [19] proposed a methodto estimate the relative importance of product attributes and brandnames on the overall rating of a product using negative binomialregression. Suryadi and Kim [14] proposed a method to identifythe product features that influence sales ranking using multiplelinear regression. A method using the term frequency was proposedto measure the relative importance of product attributes [16,18].Jiang et al. [17] proposed a method to infer the future importanceweights of product features using opinion mining and a fuzzytime series method.Furthermore, numerous studies have attempted to identify cus-
tomer needs and preferences from online product reviews. Amethod for identifying useful customer reviews from the perspec-tive of a designer was presented using text mining [21–23]. Amethod for reducing the target design-feature range based on cus-tomer preferences was also proposed [24,25]. A method for identi-fying the Kano category of product attributes was presented usingsentiment analysis [13,26]. Zhou et al. [11] proposed an approachto identify latent customer needs using case analogical reasoningfrom the sentiment analysis of online product reviews. Suryadiand Kim [27] proposed a method to automatically extract productusage context using machine learning. Wang et al. [28] presented
a method to compare customer needs in two competitive productsusing latent Dirichlet allocation (LDA). El Dehaibi et al. [29] pro-posed a method to identify sustainable features using crowdsourcedwork.However, to the best of the authors’ knowledge, no studies have
conducted IPA based on the estimation of both the importance andperformance of product attributes from online reviews. The presentstudy contributes to the product design literature by providing amethod for conducting the IPA of product attributes from onlinereviews.
2.2 Previous Research on the Performance Estimation ofProduct Attributes. Previous studies have estimated the perfor-mance of product attributes by measuring their sentiment scorebased on online reviews. In a review of the pros and cons, the senti-ment of product attributes was simply measured by their appearancein the pros and cons categories [19,30]. The sentiment score wasconsidered positive for the pros and negative for the cons. Super-vised machine learning was used to measure the sentiment ofproduct attributes by learning sentiment patterns from labeleddata. Zimmermann et al. [12] used semi-supervised sentiment learn-ing to measure the polarity of product attributes. Zhou et al. [11]developed a support vector machine learning classifier for evaluat-ing the performance of product attributes. Bi et al. [2] and Zhouet al. [26] used a sentence sentiment classifier based on machinelearning. The performance of the product attributes was inferredfrom the sentiments of sentences containing product-relatedwords. An extraction rule with sentiment dictionaries was employedto measure the performance of product attributes by identifyingproduct-related words and their associated sentiment patterns[13–15,17]. This extraction rule with sentiment dictionaries firstidentifies product-related words in the forms of nouns and sentimentwords in the forms of adjectives that modify a noun word. Subse-quently, it evaluates the sentiment words based on a well-constructed sentiment word bank. Jeong et al. [16] used an aspect-based sentiment analysis of IBM Watson, which is a text miningtechnique that breaks down a text into aspects (i.e., attributes orcomponents of a product or service) and estimates the sentimentscore of the aspects.However, previous studies to measure the performance of
product attributes have the following limitations. The estimationof the sentiment of the product attributes as pros and cons is notapplicable to natural language forms. Developing machine learning-based sentiment classifiers and extraction rules with sentiment dic-tionaries is expensive. Machine learning-based sentiment classifiersrequire labeled data to develop a model, and manual labeling istime-consuming. Extraction rules with sentiment dictionariesrequire manual rules to define various syntactic patterns thatexpress emotions, which is time-consuming. Sentence sentimentclassifiers cannot accurately measure the sentiment of a productattribute when a sentence has more than two product attributes. Incontrast, the aspect-based sentiment analysis of IBMWatson is pub-licly available and applicable to numerous cases using predefinedrules, although its specific rules are unknown [31].Therefore, this study utilizes the aspect-based sentiment classifier
of IBM Watson to estimate the performance of product attributes.Using IBM Watson to develop aspect-based sentiment classifierssaves time and ensures high accuracy because it trains classifiersusing large-scale data [16].
2.3 Previous Research on the Importance Estimation ofProduct Attributes. Previous studies estimated the importanceof product attributes using term frequency and regression fromonline reviews. The importance of product attributes was measuredusing the frequencies of product-related words. High-frequencyproduct attributes and high-frequency, low-sentiment-scoreproduct attributes were considered to have high importance inRefs. [17,18], respectively. Suryadi and Kim [14] used multipleregression to determine the relationship between the sentiment of
081705-2 / Vol. 143, AUGUST 2021 Transactions of the ASME
Dow
nloaded from http://asm
edigitalcollection.asme.org/m
echanicaldesign/article-pdf/143/8/081705/6633577/md_143_8_081705.pdf by U
niversity of Illinois Urbana-C
hampaign user on 28 April 2021

a product attribute and its sales ranking. The coefficient of a productattribute in a regression model can be considered as an importancevalue. Previous studies newly defined the importance, but they didnot provide theoretical evidence to support it.Importance is classified into self-stated importance (i.e., rele-
vance) and implicit importance (i.e., determinance) [32]. Thedirect measure of self-stated importance is achieved by asking cus-tomers about the satisfaction of each attribute. This presents generalattribute-importance and aids in distinguishing between core andnon-core attributes [33]. Implicit importance is a relatively flexibleconcept compared with self-stated importance and is measured byevaluating how each attribute affects overall satisfaction. This indi-cates case-based or situational attribute importance and describesthe behavioral outcomes of customers for overall satisfaction[34]. Some studies have attempted to estimate the implicit impor-tance of product attributes from online reviews. Decker andTrusov [19] used negative binomial regression based on sentimentscores and user ratings to estimate the implicit importance values inthe review of pros and cons. Bi et al. [2] used a neural network forevaluating the implicit importance in natural language text. Ashallow neural network (SNN) with a hidden layer was consideredas the neural network architecture. The implicit importance wasestimated by calculating the weights of the input and hiddenlayers and the hidden and output layers from the SNN.Regression analysis assumes that the overall rating follows a
Gaussian distribution and is a linear combination of the sentimentscores of the product attributes mentioned in the reviews.However, in online reviews, the overall ratings generally presenta positively skewed distribution and can be a non-linear combina-tion of the sentiment scores of the product attributes mentioned inthe reviews. Therefore, regression analysis does not perform wellcompared with a neural network [2,32,35]. Furthermore, theSNN-based method cannot identify how input features affect eachprediction since the neural network is described as a black-boxmodel. The SNN-based method inferred the importance of inputfeatures from weights between layers in the training set, but thevariability of the importance values is high because of the random-ness of the training set and model. The SNN structure with a hiddenlayer is also unclear whether it is optimal between neural networkscomposed of various neurons and hidden layers. To overcome theselimitations, the present study uses an explainable DNN technique toidentify the effects of sentiments of product attributes on the overallrating. Implicit importance values of product attributes with a lowvariance are derived by combining the effect of product attributesfrom multiple optimal neural networks with a high accuracy.
3 MethodThe overall process of performing the IPA of product attributes
from online customer reviews is described here (Fig. 2). Theonline product reviews are the inputs, and the output is the IPAof the product attributes. The proposed approach comprises threeimportant stages. It uses minimal manual operation, although afew stages require human involvement.
(1) Product attribute identification: Product attributes are identi-fied using the LDA from online reviews. An automatedmethod for keyword preprocessing is used prior to theLDA; human judgment is required to identify the productattributes from the LDA results.
(2) Performance estimation of each product attribute: After iden-tifying the product attributes, the performance of eachproduct attribute is estimated using the aspect-based senti-ment analysis by IBM Watson. IBM Watson provides thesentiment intensities of product-related words; therefore,the performance of each product attribute is automaticallymeasured.
(3) Importance estimation of each product attribute: The impor-tance of each product attribute is estimated using an explain-able DNN based on the performance estimation of eachproduct attribute. Optimal neural networks are first designedto predict overall ratings based on the estimated sentimentscores of product attributes. The importance values are sub-sequently derived by combining deep SHAP values thatpresent the influence of input variables on output variablesas the explainable DNN technique from these neural net-works. The importance estimation is automated, and initialparameter settings are necessary to determine the optimalneural networks.
3.1 Data Collection and Preprocessing. To perform the pro-posed approach, the collection of numerous reviews is required. Afew reviews over a long period are likely to be biased in terms ofrepresentativeness. The customer reviews of a target product arecollected from product review websites, including Amazon, eBay,and BestBuy. Web scraping can be used to automatically collectinformation such as title, review, date, and user rating from webpages. Duplicated reviews that appear more than once areremoved, and non-English reviews are eliminated to refine the col-lected review. The emojis, emoticons, and newline characters, suchas “U+1F600,” “U+1F603,” and “U+1F604,” in each review areremoved. The keywords and their sentiment intensities are extractedfor the IPA of the collected reviews using IBM Watson natural lan-guage understanding (NLU). IBM Watson NLU automaticallyextracts keywords and their sentiment intensities by removingstop words, such as “and,” “but,” “how,” and “what.” Subsequently,the text preprocessing proceeds as follows: uppercase is convertedto lowercase (e.g., “Screen” is transformed to “screen”), punctua-tion is eliminated (e.g., “high-end” is transformed to “high end”),and words are lemmatized (e.g., “batteries” is transformed to itsroot form “battery”). Consequently, each review is structured intokeywords and their sentiment intensities.
3.2 Product Attribute Identification. LDA-based methodscan be used for identifying the product attributes from onlinereviews [16,26,28,36]. The LDA is a powerful statistical topicmodel that summarizes numerous textual data by extracting thehidden topics [37]. It assumes that each review document isregarded as a mixture over a set of topic probabilities, and eachtopic is regarded as a mixture over a subsequent set of words.
Fig. 2 Overall process of the proposed approach
Journal of Mechanical Design AUGUST 2021, Vol. 143 / 081705-3
Dow
nloaded from http://asm
edigitalcollection.asme.org/m
echanicaldesign/article-pdf/143/8/081705/6633577/md_143_8_081705.pdf by U
niversity of Illinois Urbana-C
hampaign user on 28 April 2021

The LDA model takes a review-keyword matrix as the input, and ityields a topic-keyword matrix as the output. Topic coherence [38]can be used to determine the number of topics in the LDAresults. The LDA model with a higher topic coherence indicates amodel best. Each topic is identified by interpreting the keywordsin the topic. The label of each topic can be considered as an attributeof the product [16,26,28,36].The LDA-based method by Joung and Kim [36] is used herein to
identify product attributes from online reviews. This method isapplied because it considers the forms of noun phrases as productattributes and reduces the manual effort by providing an automatedmethod for keyword preprocessing in the LDA. The LDA-basedmethod includes two steps after the extraction of keywords fromthe customer reviews.
Step 1: Noise keywords are automatically filtered out usingproduct manuals. Subsequently, the product-related key-words are identified. For example, product-related keywordssuch as “camera,” “screen,” and “battery life” are identifiedas words, including nouns and noun phrases.
Step 2: Product-related keywords that are frequently mentionedtogether by customers are grouped into topics by the LDA,and the product attributes are identified by interpreting thetop n keywords and typical reviews related to each topic.For example, a topic clustered with keywords such as“screen,” “size,” “display,” and “glass” is named as a“screen” attribute of a product.
Additionally, the product-related keywords of each product attri-bute can be expanded by identifying synonyms through WordNet[39] or word embedding [40]. A more detailed process of the LDA-based method can be found in the study by Joung and Kim [36].Some open-source libraries or software, such as the Gensimlibrary of PYTHON [41] and the Stanford Topic Modeling Toolbox[42], can be used if the application of the LDA-based method byJoung and Kim [36] to product attribute identification is difficult.The keyword preprocessing in the LDA can be manually conductedhere.
3.3 Performance Estimation of Each Product Attribute.After extracting the customer reviews that include the keywordsof each product attribute, the aspect-based sentiment analysis ofIBM Watson is used to estimate the performance of the identifiedproduct attributes. The aspect-based sentiment analysis providesthe sentiment intensity of the keywords, which ranges from −1 to1; −1 indicates a higher negative sentiment, and 1 a higher positivesentiment.M customer reviews are structured into the keyword sen-timent intensity of the product attributes, Ai. If a review containsmore than two keywords for the product attribute, the sentimentintensity of that product attribute is calculated by taking theaverage of the sentiment intensities of the keywords. Forexample, in the following review, “Screen is great. Size is too bigfor me,” the sentiment intensities of “screen” and “size” are 0.97and −0.68, respectively. Consequently, the sentiment intensity ofthe product attribute is their average, i.e., 0.145. However, quanti-fying emotional sentiment is challenging. For example, in IBMWatson, “convenient screen,” “good screen,” “fine screen,” and“nice screen” are generally considered as very positive sentiments.However, they are strictly assigned to different sentiment intensityscores (i.e., 0.9 for “convenient,” 0.95 for “good,” 0.84 for “fine,”and 0.96 for “nice”). To consider similar emotional expressionsequally and perform the subsequent analysis, the keyword senti-ment intensity is encoded into six labels using the following
equation (Table 1):
Sim =
5 if 0.6 < Sentiment intensity ≤ 14 if 0.2 < Sentiment intensity ≤ 0.63 if −0.2 ≤ Sentiment intensity ≤ 0.22 if −0.6 ≤ Sentiment intensity < −0.21 if −1 ≤ Sentiment intensity < −0.60 if Sentiment intensity is "missing value"
⎧⎪⎪⎪⎪⎪⎪⎨⎪⎪⎪⎪⎪⎪⎩
(1)
The transformed labels indicate 5 (very positive), 4 (positive), 3(normal), 2 (negative), and 1 (very negative). For example, “conve-nient screen,” “good screen,” “fine screen,” and “nice screen” aregenerally assigned a score of 5. The above sentiment intensityranges assigned to the six labels can be used for all types of prod-ucts. However, to clearly identify very positive and negative senti-ments, the ranges can be narrowed further. The performance of aproduct attribute, Ai, is calculated as follows:
Perf i =∑Mm=1
SimRi
(2)
3.4 Importance Estimation of Each Product Attribute. Anexplainable DNN is used for estimating the importance of eachproduct attribute. To exploit the explainable DNN, the transformedscore values of the online reviews are used as the input features,whereas the overall rating corresponding to the reviews is theoutput variable (Table 1). Even though the overall ratings rangingfrom 1 to 5 can be used directly, they can be further categorizedinto two labels for higher performance when training the neuralnetwork. One- or two-star ratings are regarded as negative, andfour- or five-star ratings are regarded as positive. Three-starratings are classified into positive or negative depending on thepos/neg ratio and strength of the sentiment scores of the productattribute in the reviews.Herein, in the explainable DNN, the SHAP-based method is pro-
posed to derive the importance values of each product attribute witha low variance. The strategy for estimating the importance values ofthe product attributes involves initially constructing K optimalmodels from K training sets to solve the variance problem of themodel constructed from a single training set with randomness. Sub-sequently, K importance values are calculated by measuring theinfluence of the input features based on SHAP method from theK optimal models and combined into one value. The importancevalue by the SHAP-based method is calculated as follows (Fig. 3):
(1) K training sets are prepared.(2) By employing a genetic algorithm [43] with each training set,
K optimal neural networks are designed.(3) From each K optimal neural network, K importance values
[44] of each product attribute are calculated based on theSHAP method.
(4) Based on the information fusion algorithm, the K importancevalues are combined [45].
3.4.1 Preparing K Training Sets. K-fold cross-validation isused to randomly partition the original sample into K equal-sizedsub-samples [46]. A single sub-sample is used as a test set for
Table 1 Transformed sentiment score for each product attributein the customer reviews
Review A1 A2 ·· · Ai Overall rating
1 5 ·· · 52 4 4 ·· · 53 5 ·· · 5 4⋮ ⋮ ⋮ ⋮ ⋮ ⋮M ·· · 3
081705-4 / Vol. 143, AUGUST 2021 Transactions of the ASME
Dow
nloaded from http://asm
edigitalcollection.asme.org/m
echanicaldesign/article-pdf/143/8/081705/6633577/md_143_8_081705.pdf by U
niversity of Illinois Urbana-C
hampaign user on 28 April 2021

measuring the performance of the model, and the remaining K− 1sub-samples are used as the training sets. A K-fold cross-validationcan reduce the bias of the results from a single training set becauseall the observations are used for both training and testing. There isno strict rule to determine K; however, a tenfold cross-validationcan generally be applied [47]. A small K can be considered, if thevolume of the data is insufficient. The K can reduce the varianceof the performance of the trained model when the test set is large.
3.4.2 Designing K Optimal Neural Networks. From each Ktraining set, K optimal neural networks are designed to predict theoverall rating based on the sentiment score of each product attribute.The feedforward neural network obtained by extending the previousSNN can be considered as the neural network architecture [2,32,35].The feedforward neural network comprises an input layer, hiddenlayers, an output layer, and neuron units per layers. The numberof neurons of the input and output layers depends on the numberof variables in the data; however, the number of hidden layersand neurons per hidden layer need to be determined. In addition,an activation function that decides the activation between theneurons and an optimizer that decides the optimal weightsbetween the neurons should be selected to train the neuralnetwork. “Rectified linear unit” (ReLU), “exponential linear unit”(ELU), and “Tanh” can be considered as activation functions forthe DNN [48]. “Stochastic gradient descent” (SGD), “Adagrad,”“Adadelta,” “RMSProp,” “Nadam,” “Adam,” and “Adamax” canbe considered as the optimizers [49].A genetic algorithm [43,50] is used to design K optimal feedfor-
ward neural networks based on the initial parameters, such as thenumber of hidden layers, neurons per hidden layer, activation func-tion type, and optimizer type. The genetic algorithm is used to solveoptimization or search problems depending on biological processes,such as life, reproduction, and death [51]. Biological processesinclude population, generation, selection based on the fitnessscore, crossover to generate new offspring, and random mutationof new offspring. After setting the range of initial parameters, thegenetic algorithm to determine the optimal neural network proceedsas follows:
Step 1: The neural networks corresponding to the population attraining set are constructed by randomly selecting initialparameters in a given range.
Step 2: The performance of each neural network is evaluated bythe fitness function. For the fitness function, performancemeasures such as accuracy, precision, and recall at a testset can be considered.
Step 3: The neural networks corresponding to retention rateremain to breed children. The top neural networks are
selected based on the fitness score, and a few non-top net-works are randomly chosen. The selected neural networksbecome a part of the next generation.
Step 4: The initial parameters of the selected neural networks,such as the number of hidden layers, neurons per hiddenlayer, activation function type, and optimizer type, are con-sidered as individual genes and bred through theircombination.
Step 5: Some initial parameters for offspring are randomlymutated based on mutation chance.
Step 6: Step 2 is conducted until the termination condition isreached. The termination condition is determined by thenumber of generations.
After applying the genetic algorithm, the optimal model is theneural network with the highest fitness score, which assignsweights between the output and input layers.The constructed optimal neural networks should not have an
overfitting problem, that is, a high performance on the training setand not on the test set. Overfitting models reduce their generaliz-ability. The importance values of the product attributes derivedfrom these models may be the noise rather than the genuine valuein the population.
3.4.3 Calculating K Importance Values Based on the SHAPMethod From K Optimal Neural Networks. The SHAP method isused for calculating the K importance values of each product attri-bute from each K optimal neural network [44]. An explainable DNNtechnique, SHAP method, is a unified approach to interpret theDNN model predictions based on Shapley values. Given a specificprediction v, the Shapley values are calculated using a weightedsum of the influences of each feature over all possible orders ofthe features (Eq. (3)). The influence of each feature in each predic-tion is calculated by estimating the change in the prediction of themodel when that specific feature is missing.
ϕi(v) =∑
S⊆N:i∉S
S| |!( N| | − S| |−1)!N| |! (v(S ∪ i) − v(S))
=∑
S⊆N:i∉S
1( N| |choose S| |)( N| | − S| |) (v(S ∪ i) − v(S)) (3)
To estimate the Shapley values in the neural network model, theSHAP method infers the weights between the input and outputlayers by combining the influence of the features calculated forthe small components of the neural network into that of the featuresfor the whole neural network. The SHAP method has a solid theo-retical foundation based on game theory and provides contrastive
Fig. 3 Overall process of the SHAP-based method
Journal of Mechanical Design AUGUST 2021, Vol. 143 / 081705-5
Dow
nloaded from http://asm
edigitalcollection.asme.org/m
echanicaldesign/article-pdf/143/8/081705/6633577/md_143_8_081705.pdf by U
niversity of Illinois Urbana-C
hampaign user on 28 April 2021

explanations because the prediction is reasonably distributedbetween the feature values.From each K optimal neural network, deep SHAP values that
represent the influence of product attributes on the overall ratingare calculated (Table 2). The larger the absolute value of deepSHAP in each review, the greater the effect on the overall rating.The importance of product attributes from kth optimal neuralnetwork is calculated as follows:
Impik =∑TRk
m=1
SHAPimk| |TRk
(4)
In K optimal neural networks, K importance values of each productattribute are estimated.
3.4.4 Combining K Importance Values. The informationfusion algorithm is used to combine the K importance values ofeach product attribute [45]. Numerous studies have employed thisalgorithm for combining the effect of input variables in machinelearning models. The fusion of multiple models in knowledge dis-covery provides reliable results [52]. The information fusion algo-rithm is formulated as
yfused =∑Kk=1
wkfk(x) = w1f1(x) + w2f2(x) + · · · + wkfk(x)∑Kk=1
wk
(5)
Based on Eq. (5), the importance of each product attribute is esti-mated by combining the K importance values in the optimalneural networks by the following equation:
ˆImpi =∑Kk=1
wkimpik (6)
Finally, the importance value of each product attribute is normal-ized using the following equation:
Impi =ˆImpi∑I
i=1ˆImpi
, i = 1, 2, . . . , I (7)
The SHAP-based method provides the importance values of theproduct attributes with a low variance by combining multipleexplainable neural network models derived from multiple trainingsets.
3.5 Importance–Performance Analysis. The IPA plot isdrawn based on the estimated importance–performance of eachproduct attribute (Fig. 1). The x- and y-axes represent the perfor-mance and importance, respectively. The IPA plots of the productsof a target company or a target product model (i.e., high-end andmid-range models) can be drawn to provide insights into theproduct design.The cross-hair of the IPA is determined using two types of
methods: scale- [1] and data-centered methods [4,53]. The scale-centered method determines the cross-hair using the mid-point ofthe scale of the importance–performance. In contrast, the data-centered method determines the cross-hair using the means or
medians of the scale of importance–performance. The data-centeredmethod is frequently used because it provides a stronger distin-guishing power between the attributes compared with to the scale-centered method [54]. The data-centered method is used herein forthe cross-hair placement of the IPA. If the product attribute islocated adjacent to the cross-hair, it can be considered to comprisetwo close quadrants.
4 Case StudyAn IPA case study of smartphones was used to validate the pro-
posed approach. Three IPA plots for all, high-end and mid-rangesmartphones were drawn from online customer reviews. The “allsmartphones” category contains similarly sized high-end and mid-range products. The high-end products present a slightly better per-formance, but they share numerous common features with a phonereleased by a specific manufacturer.
4.1 Collecting Data and Preprocessing. Web scraper chromeextension (e.g., WebScraper.io) was used for collecting the cus-tomer reviews of verified purchases in the cell phone category ofAmazon.com. After eliminating the overlapping and non-Englishreviews, 33,779 reviews of smartphones were obtained fromApril 2014 to September 2019. The reviews in the five years afterthe product was released in 2014 were selected because of theirlack until 2013. The time trend of the collected reviews is shownin Fig. 4. The number of reviews of high-end and mid-range smart-phones were 23,591 and 10,188, respectively. Each review wasrefined by stripping the emojis, emoticons, and newline characters.From the collected reviews, 51,011 keywords and the corre-
sponding sentiment intensities were extracted using the IBMWatson NLU. After text preprocessing, each review was structuredinto keywords and their sentiment intensities.
4.2 Identifying Product Attributes. After extracting 51,011keywords, the LDA-based method of Joung and Kim [36] wasused for identifying the product attributes from the online reviews.After filtering out noise keywords, 1226 product-related keywordswere clustered in each topic by the LDA. The number of topicswas selected as eight based on the maximum topic coherence value(0.711). These eight attributes were identified by interpreting thelogical connections between the top-30 words and typical reviews(Table 3). Most topics were easy to identify without investigatingthe review comments. For example, the second topic was named“Screen” considering its top related keywords (e.g., “screen,”“case,” “size,” “display,” “protector,” and “glass”).” The third,fourth, fifth, sixth, seventh, and eighth topics were also named.The first topic, “Product check,” was named by examining thetypical reviews, which included the most probable topic keywords.The typical reviews contained “This product is worthless to me.The product arrived in good condition; however, the modelnumber on the box and the sticker attached to the phone were differ-ent than the model numbers in the product specifications on theAmazon web site.” This attribute was not directly related to the hard-ware of the smartphone but was considered because it representedinitial condition or quality of the ordered product. Synonyms of thekeywords were identified using word2vec. For example, synonymsof “camera” and “app,” such as “cam” and “application,” were con-sidered in the “camera” and “app” attributes. The Gensim library ofPYTHON [41] was used to conduct the LDA and to build word2vec.“Frequent keywords” were sorted in the descending order based onthe probability of each attribute in the LDA. “Number of keywords”indicates the number of keywords, considering the synonyms of eachproduct attribute. “Number of reviews” indicates the number ofreviews that include the keywords of each product attribute.“Product check,” which determines the first impressions of anordered product, was the attribute most frequentlymentioned by cus-tomers. Among the remaining seven attributes, the customers were
Table 2 Deep SHAP values of each product attribute in themodel
Review A1 A2 ·· · Ai Overall rating
1 SHAP11 SHAP21 ·· · SHAPi1 52 SHAP12 SHAP22 ·· · SHAPi2 53 SHAP13 SHAP23 ·· · SHAPi3 4⋮ ⋮ ⋮ ⋮ ⋮ ⋮M SHAP1M SHAP2M ·· · SHAPiM 3
081705-6 / Vol. 143, AUGUST 2021 Transactions of the ASME
Dow
nloaded from http://asm
edigitalcollection.asme.org/m
echanicaldesign/article-pdf/143/8/081705/6633577/md_143_8_081705.pdf by U
niversity of Illinois Urbana-C
hampaign user on 28 April 2021

more concerned about the “Screen,” “Camera,” “Communication,”and “Battery.” These attributes were mentioned more than 3000times in all reviews.
4.3 Estimating Performance of Each Product Attribute.The sentiment score of each product attribute was measured bythe sentiment intensity of the keywords identified in each productattribute. Among the original data of 33,779 reviews, reviews that
did not include the product-related keywords and their sentimentintensities were excluded from the analysis:
R1: “Five Stars. Better than I expected flawless.”R2: “Five Stars. Perfect phone for me!”R3: “She loves it! So far so good.”R4: “Works perfect. Nice for the price.”R5: “Very nice phone for the price, and can be used overseas…
yesss…thank you.”
Table 3 Eight product attributes from smartphones
Product attribute Frequent keywords Number of keywords Number of reviews
Product check (A1) Product, problem, seller, box, device, 26 6749condition, version, model, warranty, item,description, replacement, support, and return
Screen (A2) Screen, case, size, display, protector, 21 5304glass, cover, screen protector, pocket, and touch
Camera (A3) Camera, quality, picture, video, photo, 23 3612light, front, pic, resolution, and image
App (A4) Apps, android, update, app, notification, 26 2967email, application, mail, and file
Communication (A5) Call, network, data, text, message, lte, internet, 25 3351signal, voice, connection, contact, fi, and gps
Battery (A6) Battery, life, battery life, charge, use, power, drain, 17 3948battery drain, fast charging, battery charge, and battery power
Card slot (A7) Card, sim, sim card, sd, slot, 16 2666sd card, dual sim, memory card, pin, and microsd
Accessory (A8) Charger, port, cable, accessory, plug, usb, earphone, 24 2261wall, jack, microphone, assistant, and wireless charging
Table 4 Sentiment score values of the online reviews for all, high-end and mid-range smartphones
Product Review A1 A2 A3 A4 A5 A6 A7 A8 Overall rating
All High-end 1 0 5 0 0 0 0 0 0 52 0 0 5 0 0 0 0 0 5⋮ ⋮ ⋮ ⋮ ⋮ ⋮
10,902 5 0 0 0 0 0 0 5
Mid-range 1 0 0 0 5 0 0 0 0 52 4 4 4 3 4 3 3 0 5⋮ ⋮ ⋮ ⋮ ⋮ ⋮
4191 0 0 0 0 0 5 0 0 5
Fig. 4 The time trend of the data
Journal of Mechanical Design AUGUST 2021, Vol. 143 / 081705-7
Dow
nloaded from http://asm
edigitalcollection.asme.org/m
echanicaldesign/article-pdf/143/8/081705/6633577/md_143_8_081705.pdf by U
niversity of Illinois Urbana-C
hampaign user on 28 April 2021
Most of these reviews are short reviews and unsuitable for per-forming the three stages of the IPA. The IPA was conducted with15,093 reviews, and the sentiment intensities of the keywords inthe reviews were transformed into the score values of the sixlabels using Eq. (1) (Table 4). Based on the score values of theonline reviews, the performance of all, high-end and mid-range,smartphones was estimated using Eq. (2) (Table 5). In Table 5,the performance of the product attributes of the high-end smart-phones is generally lower than that of the mid-range smartphones.Customers were dissatisfied with the high-end products of thecompany compared with those of their competitors, whereas theywere relatively satisfied with their mid-range products.
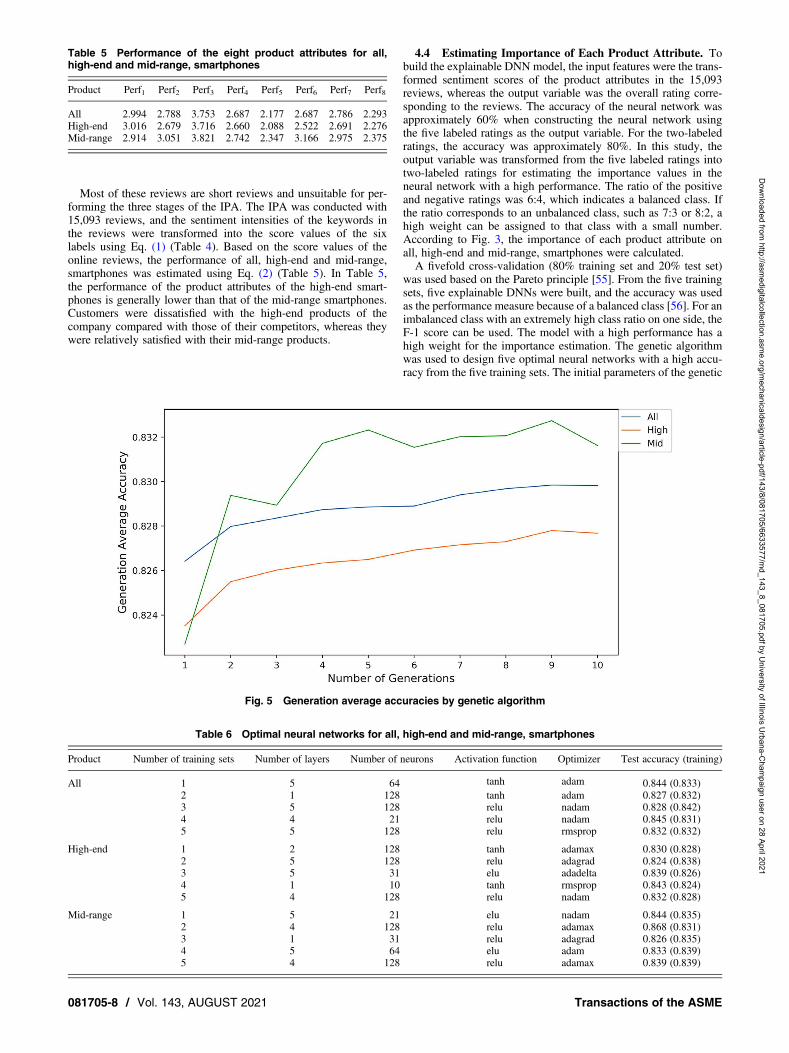
4.4 Estimating Importance of Each Product Attribute. Tobuild the explainable DNN model, the input features were the trans-formed sentiment scores of the product attributes in the 15,093reviews, whereas the output variable was the overall rating corre-sponding to the reviews. The accuracy of the neural network wasapproximately 60% when constructing the neural network usingthe five labeled ratings as the output variable. For the two-labeledratings, the accuracy was approximately 80%. In this study, theoutput variable was transformed from the five labeled ratings intotwo-labeled ratings for estimating the importance values in theneural network with a high performance. The ratio of the positiveand negative ratings was 6:4, which indicates a balanced class. Ifthe ratio corresponds to an unbalanced class, such as 7:3 or 8:2, ahigh weight can be assigned to that class with a small number.According to Fig. 3, the importance of each product attribute onall, high-end and mid-range, smartphones were calculated.A fivefold cross-validation (80% training set and 20% test set)
was used based on the Pareto principle [55]. From the five trainingsets, five explainable DNNs were built, and the accuracy was usedas the performance measure because of a balanced class [56]. For animbalanced class with an extremely high class ratio on one side, theF-1 score can be used. The model with a high performance has ahigh weight for the importance estimation. The genetic algorithmwas used to design five optimal neural networks with a high accu-racy from the five training sets. The initial parameters of the genetic
Table 5 Performance of the eight product attributes for all,high-end and mid-range, smartphones
Product Perf1 Perf2 Perf3 Perf4 Perf5 Perf6 Perf7 Perf8
All 2.994 2.788 3.753 2.687 2.177 2.687 2.786 2.293High-end 3.016 2.679 3.716 2.660 2.088 2.522 2.691 2.276Mid-range 2.914 3.051 3.821 2.742 2.347 3.166 2.975 2.375
Fig. 5 Generation average accuracies by genetic algorithm
Table 6 Optimal neural networks for all, high-end and mid-range, smartphones
Product Number of training sets Number of layers Number of neurons Activation function Optimizer Test accuracy (training)
All 1 5 64 tanh adam 0.844 (0.833)2 1 128 tanh adam 0.827 (0.832)3 5 128 relu nadam 0.828 (0.842)4 4 21 relu nadam 0.845 (0.831)5 5 128 relu rmsprop 0.832 (0.832)
High-end 1 2 128 tanh adamax 0.830 (0.828)2 5 128 relu adagrad 0.824 (0.838)3 5 31 elu adadelta 0.839 (0.826)4 1 10 tanh rmsprop 0.843 (0.824)5 4 128 relu nadam 0.832 (0.828)
Mid-range 1 5 21 elu nadam 0.844 (0.835)2 4 128 relu adamax 0.868 (0.831)3 1 31 relu adagrad 0.826 (0.835)4 5 64 elu adam 0.833 (0.839)5 4 128 relu adamax 0.839 (0.839)
081705-8 / Vol. 143, AUGUST 2021 Transactions of the ASME
Dow
nloaded from http://asm
edigitalcollection.asme.org/m
echanicaldesign/article-pdf/143/8/081705/6633577/md_143_8_081705.pdf by U
niversity of Illinois Urbana-C
hampaign user on 28 April 2021

algorithm, such as population, generation, retention rate, mutationchance, number of hidden layers, neurons per hidden layer, an acti-vation function type, and optimizer type, were determined by refer-ring to previous studies [2,32,35,43]. The population and generationwere determined as 50 and 10, respectively, to reduce the searchtime, because increasing the population and generation did notproduce better results [43]. The retention rate and mutationchance were given as 0.4 and 0.25, respectively, because these set-tings help find mutant neural networks with a high accuracy whilemaintaining elitism. The number of hidden layers was considered as1 [2,32,35], and 2, 3, 4, and 5 were additionally considered. Theneurons per hidden layer were considered as 10 [32], 21 [2], 31[35], and 64, and 128 was additionally considered. For the activa-tion function type, “Tanh” was considered in previous studies,and “ReLU” and “ELU” were additionally considered. Varioustypes of optimizers, “SGD,” “Adagrad,” “Adadelta,” “RMSProp,”“Nadam,” “Adam,” and “Adamax,” were considered because thenetwork optimizers were unclear in previous studies. The Keraslibrary of PYTHON was used to build the neural network. Thegenetic algorithm results exhibited that the average accuracy withfive test sets of each smartphone category continued to improvewith the generations (Fig. 5). The optimal neural networks withthe best accuracy were designed based on five training sets ofeach smartphone category without the overfitting problem(Table 6). The SHAP method2 was used for calculating the effectof the eight product attributes on the overall rating obtained fromfive optimal neural networks. Based on the deep SHAP valuesfrom the five optimal neural networks, the importance of eachproduct attribute on all, high-end and mid-range, smartphoneswas measured by Eqs. (4), (6), and (7) (Tables 7 and 8). The impor-tance value of a product attribute estimated using the SHAP-basedmethod correlated with the frequency of that attribute mentioned inthe reviews because a frequently mentioned attribute is expected toaffect the overall rating; however, it did not fit exactly. Based on thefrequency, the top four product attributes were “product check,”“screen,” “battery,” and “camera” (Table 3). In contrast, the topfour product attributes affecting the overall ratings were “product
check,” “screen,” “camera,” and “battery” in the all smartphonescategory. The importance values derived by the SHAP-basedmethod indicated the effect on the overall rating. The importanceof “screen,” “camera,” and “battery” was also high in a previousstudy in which Chinese reviews were analyzed [57]. The impor-tance of “app” was low in both the studies. In contrast, the impor-tance of “communication” was low in this study, whereas it washigher than that of “screen” and “battery” in the previous study.This study and the previous study targeted the US and Chinesemarkets, respectively. These regional variations may have causeddifferences in the importance values of the product attributes.
4.5 Importance–Performance Analysis. The IPA plots of all,high-end and mid-range, smartphones were built based on the
Table 7 Importance values for all, high-end and mid-range, smartphones from the five optimal neural networks
Product Number of training sets A1 A2 A3 A4 A5 A6 A7 A8
All 1 0.108 0.067 0.051 0.026 0.035 0.047 0.032 0.0322 0.106 0.069 0.057 0.029 0.032 0.050 0.039 0.0393 0.094 0.062 0.056 0.028 0.035 0.044 0.029 0.0294 0.085 0.066 0.056 0.032 0.036 0.051 0.035 0.0355 0.101 0.058 0.050 0.028 0.032 0.046 0.026 0.026
High-end 1 0.120 0.065 0.053 0.025 0.029 0.054 0.043 0.0432 0.106 0.063 0.042 0.023 0.027 0.049 0.036 0.0363 0.113 0.056 0.052 0.028 0.033 0.053 0.037 0.0374 0.116 0.057 0.067 0.023 0.034 0.060 0.038 0.0385 0.118 0.060 0.040 0.023 0.024 0.049 0.025 0.025
Mid-range 1 0.079 0.057 0.096 0.045 0.051 0.047 0.034 0.0342 0.063 0.066 0.099 0.035 0.030 0.050 0.032 0.0323 0.062 0.063 0.097 0.030 0.018 0.047 0.041 0.0414 0.067 0.068 0.084 0.040 0.042 0.043 0.033 0.0335 0.069 0.070 0.081 0.038 0.032 0.038 0.038 0.038
Table 8 Importance of the eight product attributes for all, high-end and mid-range, smartphones
Product Imp1 Imp2 Imp3 Imp4 Imp5 Imp6 Imp7 Imp8
All 0.252 0.164 0.138 0.073 0.087 0.122 0.082 0.082High-end 0.284 0.149 0.126 0.060 0.073 0.131 0.088 0.088Mid-range 0.164 0.157 0.222 0.091 0.084 0.109 0.087 0.087
Fig. 6 IPA of the all smartphones category2https://github.com/slundberg/shap
Journal of Mechanical Design AUGUST 2021, Vol. 143 / 081705-9
Dow
nloaded from http://asm
edigitalcollection.asme.org/m
echanicaldesign/article-pdf/143/8/081705/6633577/md_143_8_081705.pdf by U
niversity of Illinois Urbana-C
hampaign user on 28 April 2021

estimated performance and importance (Figs. 6–8). In the IPA plotsof all smartphones, “product check” (A1), “screen” (A2), and“camera” (A3) attributes were positioned in Q1. These attributeshave both high performance and importance, which indicates themain merits and competitive advantages of the target smartphones.The advantages of these attributes must be maintained. There wereno product attributes in Q2, and the all smartphones category didnot have a major weakness. However, if the performance of“screen” (A2) is lowered in the future, it can be considered in Q2.This attribute has a low performance and high importance; there-fore, immediate investment and attention are expected. “App”(A4), “communication” (A5), “battery” (A6), and “accessory” (A8)attributes were positioned in Q3. These attributes have low perfor-mance and importance, which indicates low priority. “Card slot”(A7) was located in Q4. This attribute has a high performance andlow importance, which indicates that it is an overemphasized attri-bute. Therefore, companies may not consider investment andattention.
For high-end and mid-range smartphones, some product attri-butes were placed slightly different. “Screen” (A2) was located inQ1 for the mid-range smartphones but in Q2 for high-end smart-phones. “Screen” (A2) is a main merit and competitive advantagefor mid-range smartphones; however, immediate investment andattention are required to improve the performance of high-endsmartphones. Customers may want to improve their screensbecause they frequently use high-end smartphones to play high-performance games and high-quality streaming services comparedwith mid-range smartphones. “Battery” (A6) was also located inQ4 for mid-range smartphones but in Q2 for high-end smartphones.“Battery” (A6) is an overemphasized attribute for mid-range smart-phones; however, its performance for high-end smartphones mustbe improved. These results reflect that customers do not expecthigh performance from mid-range products, unlike high-end prod-ucts. Attention and investment for the “battery” attribute placed inQ4 for mid-range smartphones need not be considered.
4.6 Validation of Performance and ImportanceEstimation. The performance and importance estimation of theproposed approach was validated for other cases. The approachwas verified by comparing its results with those of existingmethods. In the performance estimation, the aspect-based sentimentof IBMWatson was used to calculate the sentiment intensity of eachproduct attribute in a case study. The aspect-based sentiment anal-ysis of IBM Watson was compared with that of previous studies,such as sentence sentiment analysis [2,26] and dependency parserwith SenticNet4 dictionary [14]. In the following example, the sen-timent intensity of a “condition” word corresponding to the“product check” attribute was −0.574 (i.e., negative) according toIBM Watson and 0 (i.e., neutral) according to Vader, sentence sen-timent analysis. The dependency parser can be measured as a pos-itive value on identifying patterns such as “good condition.”Example: “Be careful about the product you receive—check it
thoroughly. Product was received in good condition but immedi-ately it became apparent that there was a battery or system issuewith the product received. After battery life (Which drainedextremely fast) reached 20% or below it would automatically shutdown and be unable to be turned on until plugged into a charger.Even in worse cases at 40% or 50% it might randomly shut down.”In this study, the aspect-based sentiment analysis of IBMWatson
for the performance estimation exhibits that the sentiment intensityof the keywords can be measured in more patterns by consideringthe overall sentiment. The use of IBM Watson can also reducethe time to develop the keyword sentiment classifier [16].According to Sec. 4.4, for the importance estimation, the SNN
utilized in previous research was considered to determine theoptimal neural networks. However, 80% (12/15) of the optimalneural networks were DNNs with more than two hidden layers inmost cases for all, high-end and mid-range, smartphones(Table 6). These DNNs generally perform the prediction taskbetter than the SNN [58]. This paper proposes the SHAP-basedmethod to estimate the importance values of the input featuresfrom the optimal neural networks, including both the SNN andDNN, and achieving more than 80% accuracy in the optimalneural networks ensures the reliability of the importance estimation.Furthermore, the SHAP-based method is compared with the
SNN-based method to identify whether it derives constant impor-tance values. The SNN-based method used a hidden unit between10, 21, and 31, the “tanh” activation function, and an optimizerchosen among “SGD,” “Adagrad,” “Adadelta,” “RMSProp,”“Nadam,” “Adam,” and “Adamax” [2,32,35]. The SNN-basedmethod was conducted repeatedly by randomly selecting theinitial parameters of the existing study, such as the training set,hidden unit, and optimizer, in each trial (Fig. 9). The SHAP-basedmethod was applied by sharing the same training set as theSNN-based method. The importance estimation by the SHAP-basedmethod (Fig. 10) exhibited importance values with a lower variancecompared with those with the SNN-based method.
Fig. 7 IPA of high-end smartphones
Fig. 8 IPA of mid-range smartphones
081705-10 / Vol. 143, AUGUST 2021 Transactions of the ASME
Dow
nloaded from http://asm
edigitalcollection.asme.org/m
echanicaldesign/article-pdf/143/8/081705/6633577/md_143_8_081705.pdf by U
niversity of Illinois Urbana-C
hampaign user on 28 April 2021

5 DiscussionThis section discusses the following three aspects. First, the
application of the proposed approach in product design is described.Second, to further analyze the strengths and weaknesses of the pro-posed approach, and the use of online product reviews as a source ofthe IPA is discussed. Finally, the use of the explainable DNN for theimportance estimation is presented. A detailed discussion on eachaspect is provided below.
5.1 Application of the Proposed Approach in ProductDesign. The proposed approach for conducting IPA can be usedto identify customer needs in the early stages of product design. Itprovides an opportunity for comparing various product attributes
by identifying the performance and importance of each productattribute from the perspective of the customers. The comparisonof these product attributes can lead to effective resource allocationfor enhancing competitiveness by providing customer-centric solu-tions, based on which the attributes of the product should bestrengthened. The proposed approach can also be used to performIPA by following various product groups, such as high-end andmid-range products of a company. The product segmentation canbe evaluated from the perspective of the customers. In the casestudy, the IPA plots of the high-end and mid-range smartphonesdistinguished “screen” and “battery” from customer perceptions.Such a distinction helps to assess whether the products of acompany are well-segmented based on the customer groups.The strategy of product segmentation may be considered as afailure if the IPA plots of the high-end and mid-range products donot differ.According to Sec. 3.3, for performance estimation, the proposed
approach can measure the sentiment intensities of theproduct-related keywords in each product attribute, which rangefrom −1 (i.e., negative) to 1 (i.e., positive). The sentiment intensityhelps to identify the response of a customer to the product feature.In the case study, the sentiment intensities of the top fiveproduct-related keywords for the “screen” and “battery” attributesof the high-end and mid-range smartphones, which can measureother product attributes but exhibit the most differences, were mea-sured (Table 9). For both high-end and mid-range smartphones,“size” as a screen attribute was positively rated, whereas “button”was perceived as the most negative for high-end smartphones.The strengths of “size” need to be maintained in the next-generationproducts of both smartphone lines, and the weaknesses of “button”for high-end smartphones should be addressed. The top fiveproduct-related keywords of “battery” were generally negativelyevaluated for high-end smartphones, compared with mid-range
Fig. 9 Importance values by the SNN-based method
Fig. 10 Importance values by the SHAP-based method
Table 9 Top five product-related keywords of “screen” and“battery” attributes of high-end and mid-range smartphones
Product ScreenSentimentintensity Battery
Sentimentintensity
High-end Screen −0.145 Battery −0.171Case −0.160 Life 0.110Button −0.519 Battery life 0.038Size 0.424 Charge −0.407Fingerprint −0.019 Power −0.163
Mid-range Screen 0.026 Battery 0.182Case −0.089 Life 0.491Size 0.606 Battery life 0.498Display 0.345 Charge −0.122Fingerprint −0.148 Power −0.281
Journal of Mechanical Design AUGUST 2021, Vol. 143 / 081705-11
Dow
nloaded from http://asm
edigitalcollection.asme.org/m
echanicaldesign/article-pdf/143/8/081705/6633577/md_143_8_081705.pdf by U
niversity of Illinois Urbana-C
hampaign user on 28 April 2021

smartphones. However, “battery” and “battery life” were positivelyrecognized, and “charge” and “power” were negatively recognizedfor mid-range smartphones. For high-end smartphones, the capacityand charging method of the “battery attribute” need to be improvedoverall. For mid-range smartphones, the advantages of the “capac-ity” need to be maintained and the weaknesses of the “chargingmethod” need to be addressed. Consequently, the sentimentvalues of product-related keywords can be used to identify the cus-tomer response to product features, and companies can redesignthem to increase customer satisfaction.
5.2 Use of Online Product Reviews for the Importance–Performance Analysis. Online product reviews are used as thedata source in the proposed approach to conduct IPA. Numerousstudies have used online product reviews to identify customerneeds and preferences [11,13,14,17,24,26,27]. These reviews area significant information source for customer needs analysis,because customers participate actively when they write thesereviews. A large volume of online reviews is also easier to obtainthan surveys. This study requires overall ratings along withtextual reviews for importance estimation. Online product reviewsprovide a large amount of labeled data; however, it is not easy toacquire labeled data for the development of a machine learningmodel in natural language processing.However, the representativeness of online product reviews could
be questioned if different products or brands are considered. Forexample, if numerous customers are not accustomed to buyingproducts online or posting online reviews, the representativenessmay not be ensured. Conversely, if numerous customers preferbuying some products online and posting online product reviews,online reviews of these products will be more representative.With the increase in online users, online reviews are increasing.IPA based on these reviews can be applied to increasing numberof cases with the increase in the representativeness.Furthermore, in an IPA survey, participant information can be
easily obtained before the survey, whereas, in an online review,this information is relatively difficult to obtain. Using onlinereviews cannot measure the performance and importance ofvarious customer segments according to demographic, geographic,behavioral, and psychographic segmentation. The results derivedfrom the proposed approach indicate aggregated performance andimportance of the reviewer group, compared to the performanceand importance of various customer segments [13]. Consideringthe reviewer group as the representative of all the consumers maybe biased. Despite these limitations, using online reviews for theIPA provides the benefits of obtaining and analyzing a largeamount of data in a short time.
5.3 Use of the Explainable Deep Neural Network for theImportance Estimation. This study uses an explainable DNN toestimate the importance of each product attribute. A DNN is a pow-erful technique used to predict and assign weights to input featuresby identifying the non-linear relationships between the input andoutput variables. In this DNN, one of the explainable techniques,the SHAP method, was used to infer the weight of each inputfeature. The SHAP method provides a unique solution by consider-ing various orders between the features, compared with otherexplainable DNN techniques such as local interpretablemodel-agnostic explanation and layer-wise relevance propagation[44]. In this study, the importance value estimated by the SHAPmethod in the DNN with high accuracy is reliable.However, the proposed SHAP-based method for the importance
estimation needs to build models from multiple training sets andmeasure importance values in various relationships of the inputfeature in each model. This estimation is more time-consumingthan the SNN-based method. To reduce the required time, agenetic algorithm was used for the optimal neural network architec-ture design. This reduced the search time by half if the initial param-eters were appropriately assigned, compared with the brute force
search. Based on experiments, assigning the initial parameters ofgeneration and population, which affect the search time, as 50and 10, respectively, is recommended. However, if there is a signif-icant change in the performance of the optimal model after increas-ing generation and population, they can be increased. In the casestudy, determining the optimal neural networks in the five trainingsets of the all smartphones category required 58.3min using thegenetic algorithm; brute force search required twice as muchtime. Although the optimal neural networks designed by thegenetic algorithm are near the global optimum, they cannot be con-sidered strictly as the global optimum [43]. Despite the limitation ofthe genetic algorithm, the SHAP-based method provides constantand reliable importance values, compared with the SNN-basedmethod.
6 Conclusion and Future WorkThis paper proposes an approach to perform the IPA of product
attributes from online reviews. This is the first attempt to illustrateIPA plots from online product reviews for product design. Thisstudy first used an LDA-based method [36] to identify product attri-butes; this method automates the process of filtering out the key-words not related to the product in the keyword preprocessing ofthe LDA. Second, the aspect-based sentiment analysis of IBMWatson was used for estimating the performance of each productattribute. By the sentiment analysis of IBM Watson, the sentimentintensity of each product attribute was measured with a lower devel-opment cost and higher reliability compared with those of the exist-ing methods, such as sentence sentiment analysis and dependencyparser with sentiment dictionaries. Finally, the SHAP-basedmethod was proposed to estimate the importance of each productattribute. In the SHAP-based method, the importance values wereinferred from explainable DNNs with higher performance andexplainability than an SNN-based method. It provides importancevalues with a low variance over several trials.The limitations of this research will provide directions for further
research. First, the popular convolutional neural networks, such asLeNet, AlexNet, and VGGNet, have been considered as theoptimal neural network architecture [58]; however, they yieldedlower performance than the feedforward neural network. Therefore,the proposed approach considered a feedforward neural network asthe optimal neural network architecture. Future studies can exploreconvolutional neural network architectures with higher perfor-mance or other neural network architectures, because the input fea-tures are relatively sparse data. Second, the aspect-based sentimentanalysis and explainable DNN techniques for the performance andimportance estimation, respectively, are continually improving.Future studies may use a better estimation method while usingthe proposed approach. Third, the proposed approach cannot iden-tify the importance and performance of the new features of newlyreleased products in real-time. Future studies can achieve real-timemonitoring by presenting a fully automated model for conductingIPA from online reviews. Finally, future research can improve thesampling level by linking user information on a review site to thecompany-owned information regarding that particular customer.This can be achieved by matching common information, such asuser names and e-mail addresses. The combination with the cus-tomer information (e.g., region, age, gender, and usage experience)available with the company helps in conducting IPA in various cus-tomer groups.
AcknowledgmentThis research was supported by the Basic Science Research
Program through the National Research Foundation of Korea(NRF) funded by the Ministry of Education (2019R1I1A1A01063298).
081705-12 / Vol. 143, AUGUST 2021 Transactions of the ASME
Dow
nloaded from http://asm
edigitalcollection.asme.org/m
echanicaldesign/article-pdf/143/8/081705/6633577/md_143_8_081705.pdf by U
niversity of Illinois Urbana-C
hampaign user on 28 April 2021

Conflict of InterestThere are no conflicts of interest.
Data Availability StatementThe authors attest that all data for this study are included in the
paper.
NomenclatureI = total number of product attributesK = total number of training sets, test sets, and modelsM = total number of customer reviewsN = set of all the featuresS = all the feature subsetswk = normalized performance measure (i.e., accuracy
value) of the kth prediction modelAi = ith product attributeRi = total number of online reviews including the
sentiments concerning product attribute Ai; sum (1 ifSim > 0; 0 otherwise)
Sim = sentiment score value of mth online reviewcorresponding product attribute Ai
yfused = fusion modelfk(x) = kth model
v(S ∪ i) = influence of the set of features with order and feature iin prediction v
v(S) = influence of the set of features with order in prediction vImpik = importance value of product attribute Ai in kth neural
networkˆImpi = importance value of product attribute Ai in fused
modelsImpi = normalized importance value of product attribute Ai
Perfi = performance value of product attribute Ai
SHAPimk = deep SHAP value of mth online review correspondingproduct attribute Ai in kth neural network
TRk = total number of customer reviews in kth training setϕi(v) = the Shapley value of feature i in prediction v
References[1] Martilla, J. A., and James, J. C., 1977, “Importance–Performance Analysis,”
J. Market., 41(1), pp. 77–79.[2] Bi, J.-W., Liu, Y., Fan, Z.-P., and Zhang, J., 2019, “Wisdom of Crowds:
Conducting Importance-Performance Analysis (IPA) Through OnlineReviews,” Tourism Manage., 70, pp. 460–478.
[3] Chu, R. K., and Choi, T., 2000, “An Importance-Performance Analysis of HotelSelection Factors in the Hong Kong Hotel Industry: A Comparison of Businessand Leisure Travellers,” Tourism Manage., 21(4), pp. 363–377.
[4] Deng, W., 2007, “Using a Revised Importance–Performance Analysis Approach:The Case of Taiwanese Hot Springs Tourism,” Tourism Manage., 28(5),pp. 1274–1284.
[5] Seng Wong, M., Hideki, N., and George, P., 2011, “The Use of Importance–Performance Analysis (IPA) in Evaluating Japan’s E-Government Services,”J. Theor. Appl. Electron. Commerce Res., 6(2), pp. 17–30.
[6] Izadi, A., Jahani, Y., Rafiei, S., Masoud, A., and Vali, L., 2017, “EvaluatingHealth Service Quality: Using Importance Performance Analysis,” Int. J. HealthCare Qual. Assurance, 30(7), pp. 656–663.
[7] Dahlgaard-Park, S. M., Pezeshki, V., Mousavi, A., and Grant, S., 2009,“Importance–Performance Analysis of Service Attributes and Its Impact onDecision Making in the Mobile Telecommunication Industry,” Meas. Bus.Excell., 13(1), pp. 82–92.
[8] MacDonald, E., Backsell, M., Gonzalez, R., and Papalambros, P., 2006, “TheKano Method’s Imperfections, and Implications in Product Decision Theory,”Proceedings of the 2006 International Design Research Symposium, Lisbon,Portugal, Nov. 1–4, pp. 1–12.
[9] Joung, J., Jung, K., Ko, S., and Kim, K., 2019, “Customer Complaints AnalysisUsing Text Mining and Outcome-Driven Innovation Method for Market-OrientedProduct Development,” Sustainability, 11(1), p. 40.
[10] Ordenes, F. V., Theodoulidis, B., Burton, J., Gruber, T., and Zaki, M., 2014,“Analyzing Customer Experience Feedback Using Text Mining: ALinguistics-Based Approach,” J. Service Res., 17(3), pp. 278–295.
[11] Zhou, F., Jiao, R. J., and Linsey, J. S., 2015, “Latent Customer Needs Elicitationby Use Case Analogical Reasoning From Sentiment Analysis of Online ProductReviews,” ASME J. Mech. Des., 137(7), p. 071401.
[12] Zimmermann, M., Ntoutsi, E., and Spiliopoulou, M., 2015, “Discovering andMonitoring Product Features and the Opinions on Them With Opinstream,”Neurocomputing, 150, pp. 318–330.
[13] Hou, T., Yannou, B., Leroy, Y., and Poirson, E., 2019, “Mining Changes in UserExpectation Over Time From Online Reviews,” ASME J. Mech. Des., 141(9),p. 091102.
[14] Suryadi, D., and Kim, H., 2018, “A Systematic Methodology Based on WordEmbedding for Identifying the Relation Between Online Customer Reviewsand Sales Rank,” ASME J. Mech. Des., 140(12), p. 121403.
[15] Zhang, H., Sekhari, A., Ouzrout, Y., and Bouras, A., 2016, “Jointly IdentifyingOpinion Mining Elements and Fuzzy Measurement of Opinion Intensity toAnalyze Product Features,” Eng. Appl. Artif. Intell., 47, 122–139.
[16] Jeong, B., Yoon, J., and Lee, J.-M., 2019, “Social Media Mining for ProductPlanning: A Product Opportunity Mining Approach Based on Topic Modelingand Sentiment Analysis,” Int. J. Inform. Manage., 48, 280–290.
[17] Jiang, H., Kwong, C., and Yung, K., 2017, “Predicting Future Importance ofProduct Features Based on Online Customer Reviews,” ASME J. Mech. Des.,139(11), p. 111413.
[18] Rai, R., 2012, “Identifying Key Product Attributes and Their Importance LevelsFrom Online Customer Reviews,” ASME 2012 International Design EngineeringTechnical Conferences and Computers and Information in EngineeringConference, Chicago, IL, Aug. 12–15, pp. 533–540.
[19] Decker, R., and Trusov, M., 2010, “Estimating Aggregate Consumer PreferencesFrom Online Product Reviews,” Int. J. Res. Market., 27(4), pp. 293–307.
[20] Chen, W., Conner, C., and Yannou, B., 2015, “User Needs and Preferences inEngineering Design,” ASME J. Mech. Des., 137(7), p. 070301.
[21] Wang, W., Li, Z., Tian, Z., Wang, J., and Cheng, M., 2018, “Extracting andSummarizing Affective Features and Responses From Online ProductDescriptions and Reviews: A Kansei Text Mining Approach,” Eng. Appl. Artif.Intell., 73, pp. 149–162.
[22] Singh, A., and Tucker, C. S., 2017, “A Machine Learning Approach to ProductReview Disambiguation Based on Function, Form and BehaviorClassification,” Decis. Support Syst., 97, 81–91.
[23] Liu, Y., Jin, J., Ji, P., Harding, J. A., and Fung, R. Y., 2013, “Identifying HelpfulOnline Reviews: A Product Designer’s Perspective,” Comput. Aided Des., 45(2),pp. 180–194.
[24] Chaklader, R., and Parkinson, M. B., 2017, “Data-Driven Sizing SpecificationUtilizing Consumer Text Reviews,” ASME J. Mech. Des., 139(11), p. 111406.
[25] Ferguson, T., Greene, M., Repetti, F., Lewis, K., and Behdad, S., 2015,“Combining Anthropometric Data and Consumer Review Content toInform Design for Human Variability,” ASME 2015 International DesignEngineering Technical Conferences and Computers and Information inEngineering Conference, Boston, MA, Aug. 2–5.
[26] Zhou, F., Ayoub, J., Xu, Q., and Jessie Yang, X., 2020, “A Machine LearningApproach to Customer Needs Analysis for Product Ecosystems,” ASMEJ. Mech. Des., 142(1), p. 011101.
[27] Suryadi, D., and Kim, H. M., 2019, “A Data-Driven Approach to Product UsageContext Identification From Online Customer Reviews,” ASME J. Mech. Des.,141(12), p. 121104.
[28] Wang, W., Feng, Y., and Dai, W., 2018, “Topic Analysis of Online Reviews forTwo Competitive Products Using Latent Dirichlet Allocation,” Electron.Commer. Res. Appl., 29, 142–156.
[29] El Dehaibi, N., Goodman, N. D., and MacDonald, E. F., 2019, “ExtractingCustomer Perceptions of Product Sustainability From Online Reviews,” ASMEJ. Mech. Des., 141(12), p. 121103.
[30] Wang, L., Youn, B., Azarm, S., and Kannan, P., 2011, “Customer-Driven ProductDesign Selection Using Web Based User-Generated Content,” ASME 2011International Design Engineering Technical Conferences and Computers andInformation in Engineering Conference, Washington, DC, Aug. 28–31, pp.405–419.
[31] Nasim, Z., and Haider, S., 2017, “Absa Toolkit: An Open Source Tool for AspectBased Sentiment Analysis,” Int. J. Artif. Intell. Tools, 26(6), p. 1750023.
[32] Mikulic, J., and Prebezac, D., 2012, “Accounting for Dynamics inAttribute-Importance and for Competitor Performance to Enhance Reliability ofBPNN-Based Importance–Performance Analysis,” Expert Syst. Appl., 39(5),pp. 5144–5153.
[33] Garver, M. S., 2003, “Best Practices in Identifying Customer-DrivenImprovement Opportunities,” Ind. Mark. Manage., 32(6), pp. 455–466.
[34] Myers, J. H., and Alpert, M. I., 1977, “Semantic Confusion in Attitude Research:Salience Vs. Importance Vs. Determinance,”ACRNorth Am. Adv., 4, pp. 106–110.
[35] Deng, W.-J., Chen, W.-C., and Pei, W., 2008, “Back-Propagation NeuralNetwork Based Importance–Performance Analysis for Determining CriticalService Attributes,” Exp. Syst. Appl., 34(2), pp. 1115–1125.
[36] Joung, J., and Kim, H. M., 2020, “Automated Keyword Filtering in LDA forIdentifying Product Attributes From Online Reviews,” ASME J. Mech. Des.,pp. 1–10.
[37] Blei, D. M., Ng, A. Y., and Jordan, M. I., 2003, “Latent Dirichlet Allocation,”J. Mach. Learn. Res., 3(Jan.), pp. 993–1022.
[38] Mimno, D., Wallach, H. M., Talley, E., Leenders, M., and McCallum, A., 2011,“Optimizing Semantic Coherence in Topic Models,” Proceedings of theConference on Empirical Methods in Natural Language Processing, Edinburgh,Scotland, UK, July 27–31, pp. 262–272.
[39] Miller, G. A., 1995, “Wordnet: A Lexical Database for English,” Commun. ACM,38(11), pp. 39–41.
[40] Mikolov, T., Sutskever, I., Chen, K., Corrado, G. S., and Dean, J., “Distributedrepresentations of words and phrases and their compositionality,” Advances in
Journal of Mechanical Design AUGUST 2021, Vol. 143 / 081705-13
Dow
nloaded from http://asm
edigitalcollection.asme.org/m
echanicaldesign/article-pdf/143/8/081705/6633577/md_143_8_081705.pdf by U
niversity of Illinois Urbana-C
hampaign user on 28 April 2021
Neural Information Processing Systems 26 (NIPS 2013), Stateline, CA, Dec. 5–10, pp. 3111–3119.
[41] Rehurek, R., and Sojka, P., 2010, “Software Framework for Topic ModellingWith Large Corpora,” Proceedings of the LREC 2010 Workshop on NewChallenges for NLP Frameworks, Valletta, Malta, May 22.
[42] Ramage, D., and Rosen, E.,2011, Stanford Topic Modeling Toolbox, http://nlp.stanford.edu/software/index.shtml.
[43] Miller, G. F., Todd, P. M., and Hegde, S. U., 1989, “Designing Neural NetworksUsing Genetic Algorithms.” ICGA, Morgan Kaufmann, Palo Alto, CA, Vol. 89,pp. 379–384.
[44] Lundberg, S. M., and Lee, S. -I., “A Unified Approach to Interpreting ModelPredictions,” Advances in Neural Information Processing Systems 30 (NIPS2017), Long Beach, CA, Dec. 4–9, pp. 4765–4774.
[45] Delen, D., Sharda, R., and Kumar, P., 2007, “Movie Forecast Guru: AWeb-BasedDSS for Hollywood Managers,” Decis. Support Syst., 43(4), pp. 1151–1170.
[46] Friedman, J., Hastie, T., and Tibshirani, R., 2001, The Elements of StatisticalLearning, Vol. 1, Springer Series in Statistics, New York.
[47] McLachlan, G. J., Do, K. -A., and Ambroise, C., 2005, Analyzing MicroarrayGene Expression Data, Vol. 422, John Wiley & Sons, Hoboken, NJ.
[48] Pedamonti, D., 2018, Comparison of Non-Linear Activation Functions for DeepNeural Networks on MNIST Classification Task. ArXiv180402763 Cs Stat,http://arxiv.org/abs/1804.02763
[49] Kingma, D. P., and Ba, J., 2014, “Adam: A method for stochastic optimization,”3rd International Conference on Learning Representations (ICLR 2015), SanDiego, CA, May 7–9.
[50] Arifovic, J., and Gencay, R., 2001, “Using Genetic Algorithms to SelectArchitecture of a Feedforward Artificial Neural Network,” Phys. A: Stat. Mech.Appl., 289(3–4), pp. 574–594.
[51] Davis, L., 1991, Handbook of Genetic Algorithms, Van Nostrand Reinhold,New York.
[52] Batchelor, R., and Dua, P., 1995, “Forecaster Diversity and the Benefits ofCombining Forecasts,” Manage. Sci., 41(1), pp. 68–75.
[53] Azzopardi, E., and Nash, R., 2013, “A Critical Evaluation of Importance–Performance Analysis,” Tourism Manage., 35, pp. 222–233.
[54] Eskildsen, J. K., and Kristensen, K., 2006, “Enhancing Importance–PerformanceAnalysis,” Int. J. Product. Perform. Manage., 55(1), pp. 40–60.
[55] Box, G. E., and Meyer, R. D., 1986, “An Analysis for Unreplicated FractionalFactorials,” Technometrics, 28(1), pp. 11–18.
[56] Bekkar, M., Djemaa, H. K., and Alitouche, T. A., 2013, “Evaluation Measures forModels Assessment Over Imbalanced Data Sets,” J. Inf. Eng. Appl., 3(10),pp. 27–38.
[57] Bi, J.-W., Liu, Y., Fan, Z.-P., and Cambria, E., 2019, “ModellingCustomer Satisfaction From Online Reviews Using Ensemble NeuralNetwork and Effect-Based Kano Model,” Int. J. Product. Res., 57(22),pp. 7068–7088.
[58] Goodfellow, I., Bengio, Y., and Courville, A., 2016, Deep Learning, MIT Press,Cambridge, MA.
081705-14 / Vol. 143, AUGUST 2021 Transactions of the ASME
Dow
nloaded from http://asm
edigitalcollection.asme.org/m
echanicaldesign/article-pdf/143/8/081705/6633577/md_143_8_081705.pdf by U
niversity of Illinois Urbana-C
hampaign user on 28 April 2021