approaches to studying neurotoxic effects of …...p1 approaches to studying neurotoxic effects of...
TRANSCRIPT
P1
Approaches to Studying
Neurotoxic Effects of
Environmental Pollutants:
Manganese – A Case Study
Tomás R. Guilarte, PhD
Leon Hess Professor & Chair
Department of Environmental Health Sciences
Mailman School of Public Health
Columbia University
New York, NY
P2
Manganese Neurotoxicity
Manganese (Mn) is an essential nutrient but excess levels in the brain produces
a complex neurological syndrome with expression of psychiatric symptoms,
cognitive impairment and parkinsonism. [Perl and Olanow, 2007; Guilarte, 2010]
Occupational and environmental exposures to Mn cause problems of attention
and cognitive impairment as well as increased expression of neuropsychological
symptoms. [Josephs et al., 2006; Bouchard et al., 2006; Bowler et al., 2006; Kloes
et al., 2006]
An association between environmental exposure to Mn and deficits in
measures of intellectual function has been described in children. [Takser et al.,
2003; Wasserman et al., 2006]
Recent studies also show that chronic Mn exposure in non-human primates may
be associated with early signs of Alzheimer’s disease-like pathology and
neurodegeneration in the cerebral cortex [Guilarte et al., 2008]

P3
• Environmental: water (>300 μg/L): automobile combustion of
gasoline containing the additive MMT (methylcyclopentadienyl
manganese tricarbonyl).
• Occupational: smelting industry, mining, welding (inhalation)
• Other human conditions in which Mn concentrations increase in
the brain: liver disease, parenteral nutrition
• Drug users: Ephedrine-based illicit psychostimulant drugs
[Russian Cocktail]. Blood [Mn] ranging from 2100-3200 g/L.
Normal: 5-15 g/L.
• Inherited Genetic mutation- SLC30A10 loss of function; Mn
transporter
Sources of Human Mn Exposure
P4
PET Scan Set II
[11C]-methylphenidate
[11C]-raclopride
(amphetamine)
MRI/MRS/DTI
2 weeks
Mn-1
Imaging studies
Terminate cohort
(neuropathology) 6 weeks
Quarantine
24 weeks
Behavioral Training
4 weeks
Return to TJU
(behavioral baseline)
PET Scan Set III
[11C]-methylphenidate
[11C]-raclopride
(amphetamine)
MRI/MRS/DTI
2 weeks
Mn-2
Imaging Studies
PET Scan Set I
[11C]-methylphenidate
[11C]-raclopride
(amphetamine)
MRI/MRS/DTI
Baseline
Imaging Studies
2 weeks
Baseline
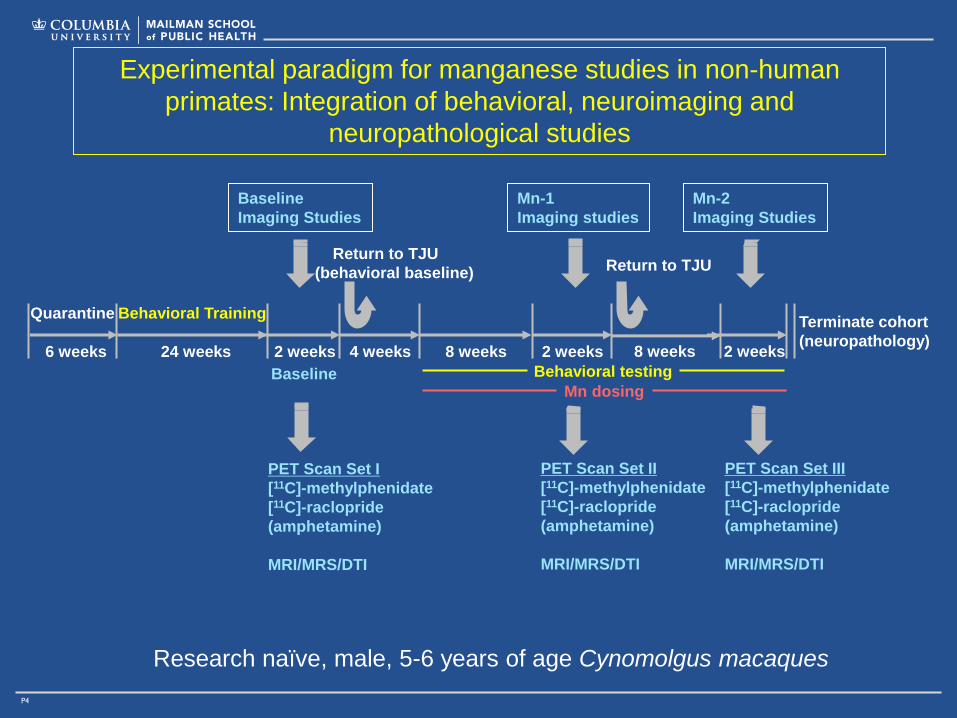
Experimental paradigm for manganese studies in non-human
primates: Integration of behavioral, neuroimaging and
neuropathological studies
Research naïve, male, 5-6 years of age Cynomolgus macaques
8 weeks
Return to TJU
8 weeks
Mn dosing
Behavioral testing
P5
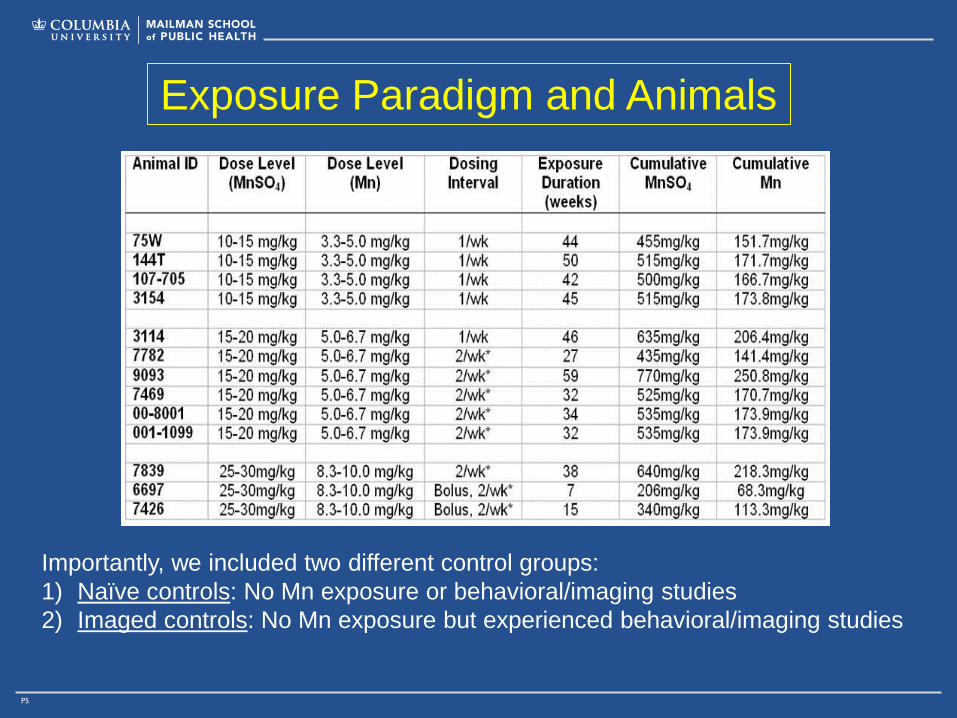
Exposure Paradigm and Animals
Importantly, we included two different control groups:
1) Naïve controls: No Mn exposure or behavioral/imaging studies
2) Imaged controls: No Mn exposure but experienced behavioral/imaging studies

P6
Blood and Brain Manganese Concentrations

P7
Blood Mn in non-occupationally
exposed populations Blood Mn Levels (µg/L)
Age (yrs) Mean Minimum
Value
Maximum
Value N Reference
0.29-2.4 12.3 1.8 45.0 254 children in Australia
Gulson et al. (2006)
7.1 9.8 3.6 26.5 384 school children
Rollin et al. (2005)
6.7 6.74 1.6 32.8 430 school children
Rollin et al. (2005)
29 ± 4
(mothers) 20.4 6.3 151.2 222
general population
Takser et al. (2003)
Newborns 38.5 14.9 92.9 222 cord blood in newborns
Takser et al. (2003)
15-93 18.3 10 88 46 general population
Santos-Burgoa et al. (2001)
14-75 16.8 7.5 45 27 general population
Santos-Burgoa et al. (2001)
3.4-20.8 31.7 18 51 7 children on parenteral nutrition
Iinuma et al. (2003)

P8
“Behavioral Studies”
Motor Function Tests
Working Memory

P9
Summary of motor function findings
A: parkinsonian rating scale B: overall activity levels
C: test of fine motor skill-”easy” D: test of fine motor skill-”difficult”
Schneider et al., Brain Res, 2006
P10

P11
Variable Delayed Response Performance
[spatial working memory]
Hatched Bar: Control
Black Bar: Mn-exposed
Delays: From 2-60 sec
Mn animals show
impairment at intermediate
to long delays
1= 2 sec
2= 5 sec
3= 10 sec
4= 30 sec
5= 50 sec

P12
Summary of Results
These studies show that chronic Mn exposure in non-
human primates produces deficits in fine motor control and
reduces overall activity levels.
Further, there are significant deficits in spatial working
memory in Mn-exposed animals relative to controls. These
findings point to Mn effects on cerebral cortical structures,
specifically the frontal cortex.
P13
“Neuroimaging Studies”
T1-weighted MRI
(Mn is paramagnetic)
Positron Emission Tomography

P14
Molecular Imaging Modalities:
clinical & preclinical studies
Magnetic resonance imaging (MRI)
Magnetic resonance spectroscopy (MRS)
Positron emission tomography (PET)
Single photon emission computed tomography
(SPECT)
Functional MRI
Ultrasound
Optical imaging
P15
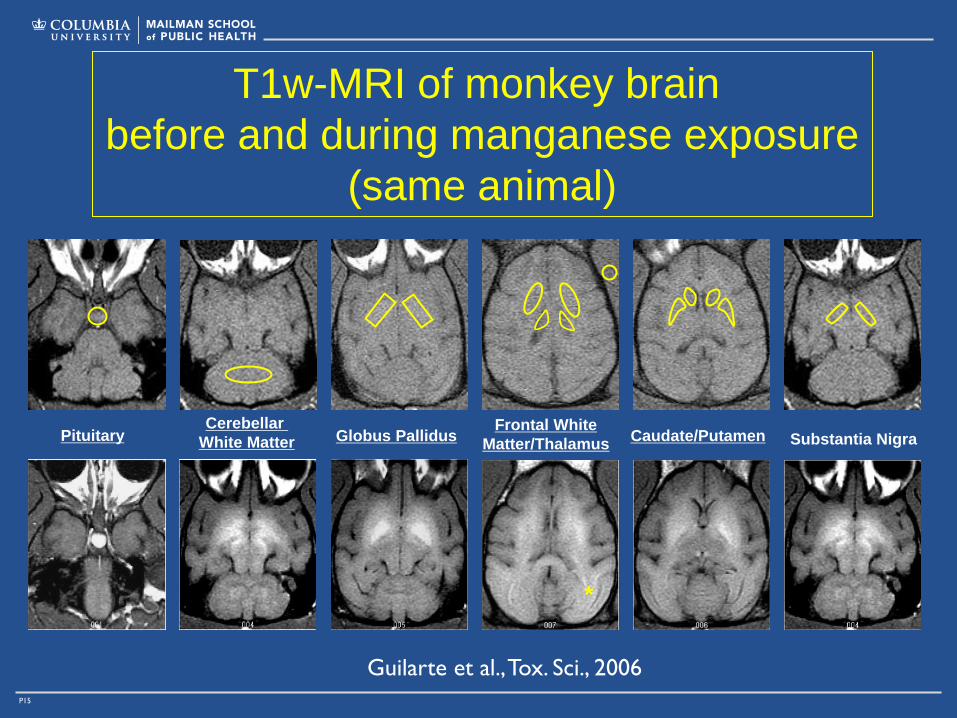
T1w-MRI of monkey brain
before and during manganese exposure
(same animal)
Substantia Nigra Pituitary Cerebellar
White Matter Globus Pallidus Caudate/Putamen Frontal White
Matter/Thalamus
*
Guilarte et al., Tox. Sci., 2006

P16
Longitudinal Analysis of
Manganese Levels in the Brain
Blood Mn= 8.9 ug/L
No Mn
T1 RT= 826 sec
Blood Mn= 132 ug/L
35 weeks of Mn
T1 RT= 469 sec
Blood Mn= 121 ug/L
66 weeks of Mn
T1 RT= 476 sec
Blood Mn= 33 ug/L
40 weeks after no Mn
T1 RT= 837 sec

P17
P18
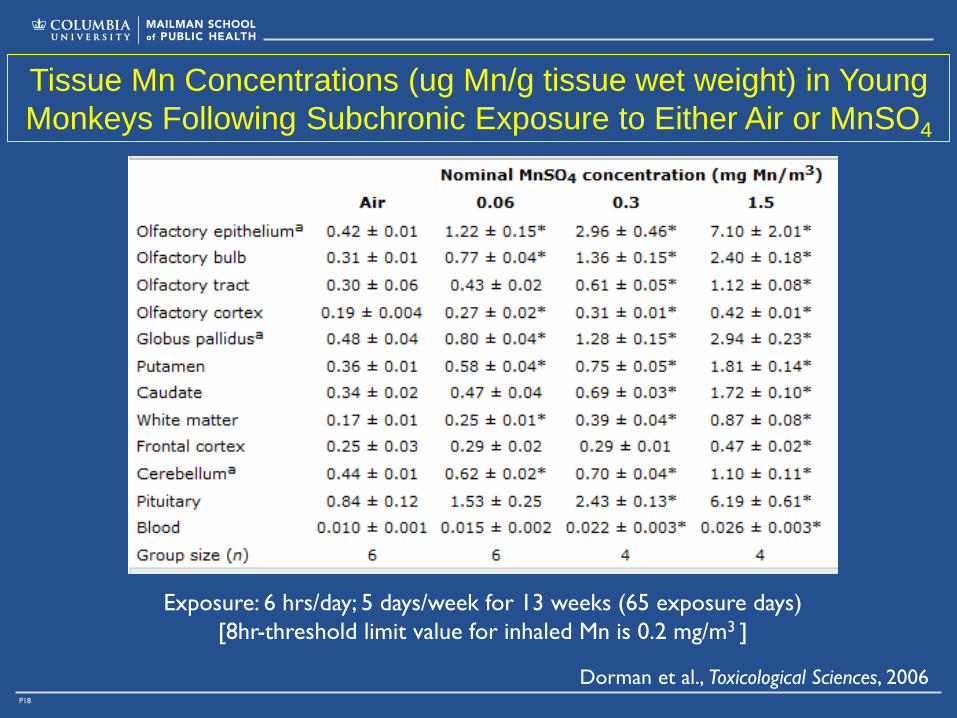
Tissue Mn Concentrations (ug Mn/g tissue wet weight) in Young
Monkeys Following Subchronic Exposure to Either Air or MnSO4
Dorman et al., Toxicological Sciences, 2006
Exposure: 6 hrs/day; 5 days/week for 13 weeks (65 exposure days)
[8hr-threshold limit value for inhaled Mn is 0.2 mg/m3 ]

P19
Three-dimensional Reconstruction of MRI Images from
Monkeys Exposed Subchronically to Either Air or MnSO4
Dorman et al., Toxicological Sciences, 2006
Exposure: 6 hrs/day; 5 days/week for 13 weeks (65 exposure days)
P20
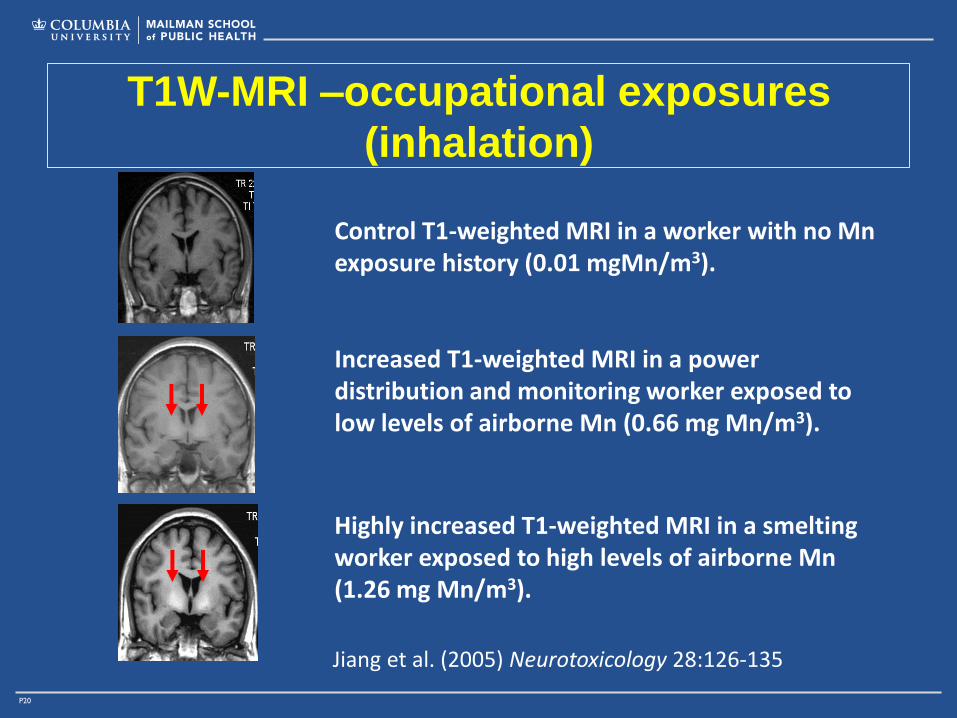
T1W-MRI –occupational exposures
(inhalation)
Control T1-weighted MRI in a worker with no Mn exposure history (0.01 mgMn/m3).
Increased T1-weighted MRI in a power distribution and monitoring worker exposed to low levels of airborne Mn (0.66 mg Mn/m3).
Highly increased T1-weighted MRI in a smelting worker exposed to high levels of airborne Mn (1.26 mg Mn/m3).
Jiang et al. (2005) Neurotoxicology 28:126-135

P21
Nigrostriatal Dopaminergic System in Mn-
induced parkinsonism C. Manganism
Normal Degeneration Degeneration or
Dysfunction?

P22
P23
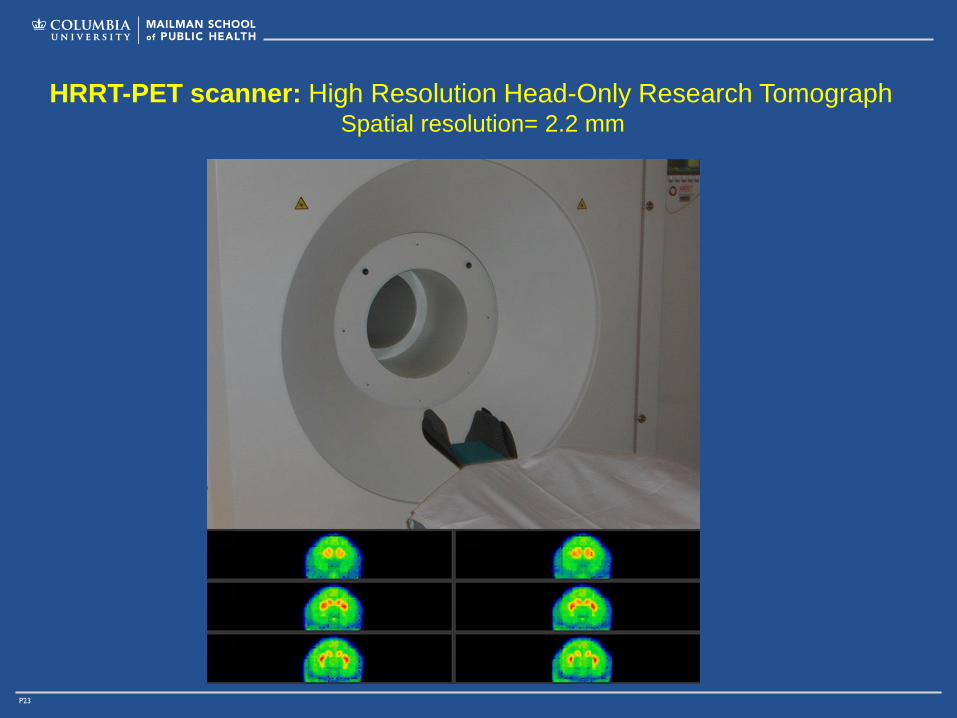
HRRT-PET scanner: High Resolution Head-Only Research Tomograph Spatial resolution= 2.2 mm

P24
[11C]-methylphenidate
VMAT2
DA
Tyrosine
L-Dopa
DA
DA
DA
DA
DA
DA
TH
DC
DA
[18F]-Fdopa
D 1 D 1 D 1 2 D
2 D G i
2 D
AC
(-)
D 1
G s AC
(+)
ATP cAMP
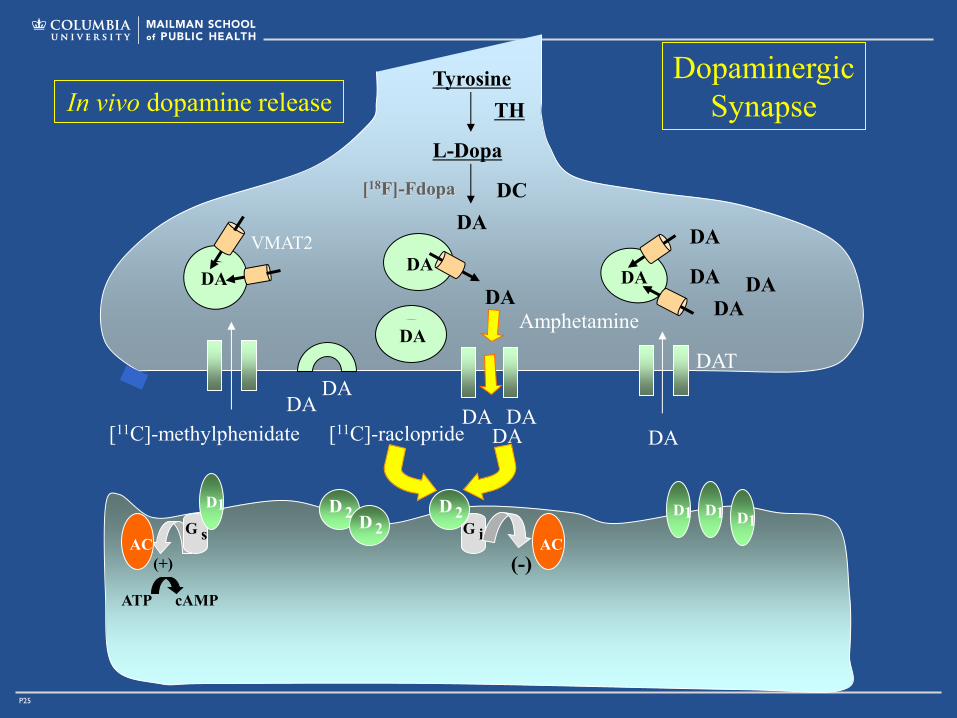
Dopaminergic
Synapse
[11C]-raclopride
DA DA
DAT DAT
P25
[11C]-methylphenidate DA
DA
VMAT2
DA
DA
Tyrosine
L-Dopa
DA
DA
DA
DA
DA
DA
TH
DC
DA
[18F]-Fdopa
D 1 D 1 D 1 2 D
2 D G i
2 D
AC
(-)
D 1
G s AC
(+)
ATP cAMP
Dopaminergic
Synapse
[11C]-raclopride
Amphetamine
DA DA
DA
DAT
In vivo dopamine release

P26
Monkey 144T baseline050010001500200025003000 0 20 40 60 80 100Time (min)Activity (nCi/cc) StriatumCerebellum
Monkey 144T Mn-105001000150020002500 0 20 40 60 80 100Time (min)Activity (nCi/cc) StriatumCerebellum
Monkey 144T Mn-205001000150020002500 0 20 40 60 80 100Time (min)Activity (nCi/cc) StriatumCerebellum
After Amph Before Amphetamine
Baseline
Mn-1
Mn-2
T i m e ( m i n )
0 2 0 4 0 6 0 8 0
Acti
vit
y (
nC
i/cc)
0
5 0 0
1 0 0 0
1 5 0 0
2 0 0 0
2 5 0 0
3 0 0 0
S t r i a t u m C e r e b e l l u m
A m p h e t a m i n e ( 2 m g / k g B W )
T i m e ( m i n )
0 2 0 4 0 6 0 8 0
Acti
vit
y (
nC
i/cc)
0
5 0 0
1 0 0 0
1 5 0 0
2 0 0 0
2 5 0 0
3 0 0 0
S t r i a t u m C e r e b e l l u m
A m p h e t a m i n e ( 2 m g / k g B W )
T i m e ( m i n )
0 2 0 4 0 6 0 8 0
Acti
vit
y (
nC
i/c
c)
0
5 0 0
1 0 0 0
1 5 0 0
2 0 0 0
2 5 0 0
3 0 0 0
S t r i a t u m C e r e b e l l u m
A m p h e t a m i n e ( 2 m g / k g B W )
P27
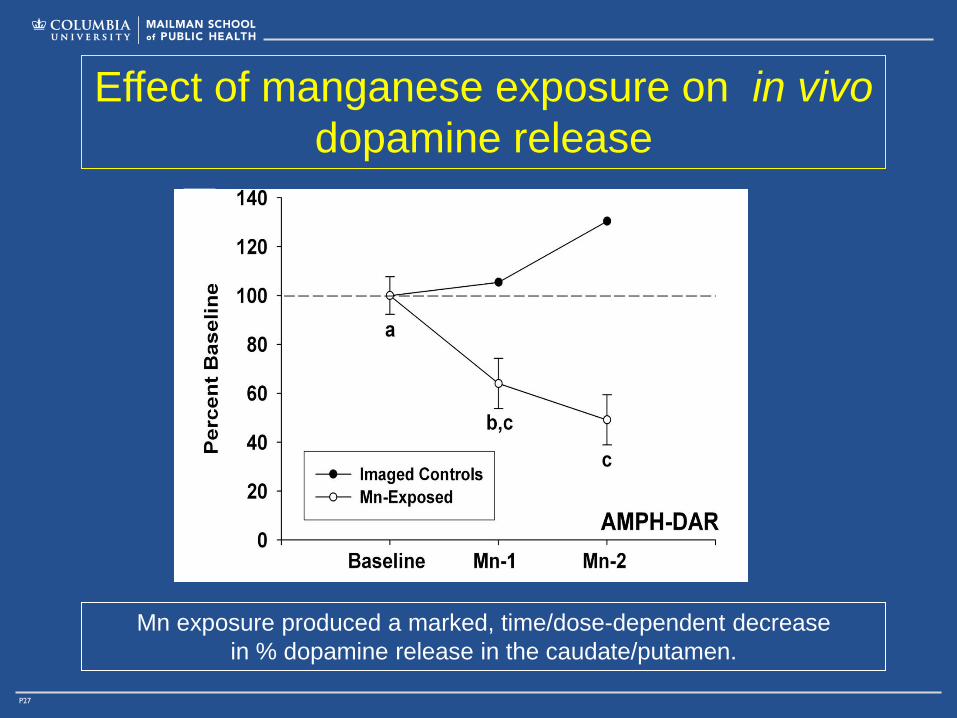
Effect of manganese exposure on in vivo
dopamine release
Mn exposure produced a marked, time/dose-dependent decrease
in % dopamine release in the caudate/putamen.

P28
[11C]-methylphenidate
VMAT2
DA
Tyrosine
L-Dopa
DA
DA
DA
DA
DA
DA
TH
DC
DA
[18F]-Fdopa
D 1 D 1 D 1 2 D
2 D G i
2 D
AC
(-)
D 1
G s AC
(+)
ATP cAMP
Dopaminergic
Synapse
[11C]-raclopride
DA DA
DAT DAT
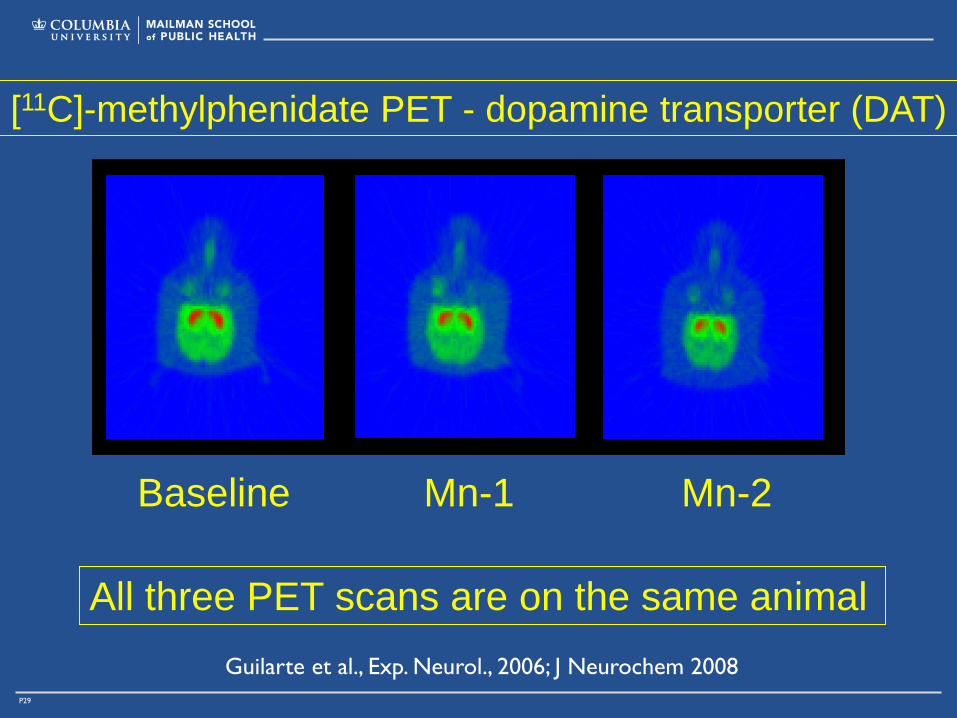
P29
[11C]-methylphenidate PET - dopamine transporter (DAT)
Baseline Mn-1 Mn-2
All three PET scans are on the same animal
Guilarte et al., Exp. Neurol., 2006; J Neurochem 2008

P30
Effect of manganese exposure on dopamine transporter
levels as measured by [11C]-methylphenidate PET
No Significant Differences Between Mn-treated and Imaged-controls Results indicate that dopamine terminals do not degenerate

P31
Summary of Results
Our PET studies show that animals chronically
exposed to Mn express a marked inhibition of in vivo
dopamine release in the absence of terminal
degeneration (based on DAT levels) in the striatum.
These findings suggest that Mn-induced movement
abnormalities are not associated with dopamine
neuron degeneration as in idiopathic Parkinson’s
disease, but result from dopamine neuron
dysfunction, i.e. inability to release dopamine.
These findings have now been confirmed in rodent
models and in human studies

P32
“Neuropathological Studies”
Gene array
Diffuse β-amyloid plaques
Neurodegeneration
P33
Frontal Cortex & Working Memory
The frontal cortex is involved in executive functions, for
example working memory. Working memory is a central
cognitive domain that has been defined as the ability to
temporarily maintain and manipulate information on line. Also
called short-term memory.
Since working memory was impaired in Mn-exposed non-
human primates, we performed gene array and
neuropathological studies in the frontal cortex.
P34
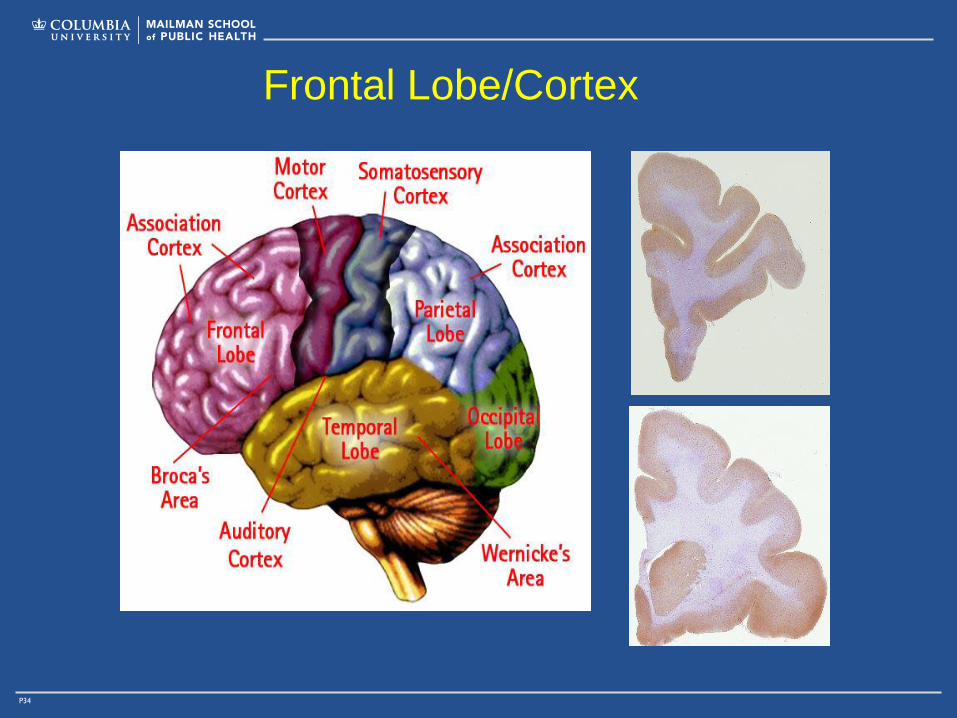
Frontal Lobe/Cortex
P35
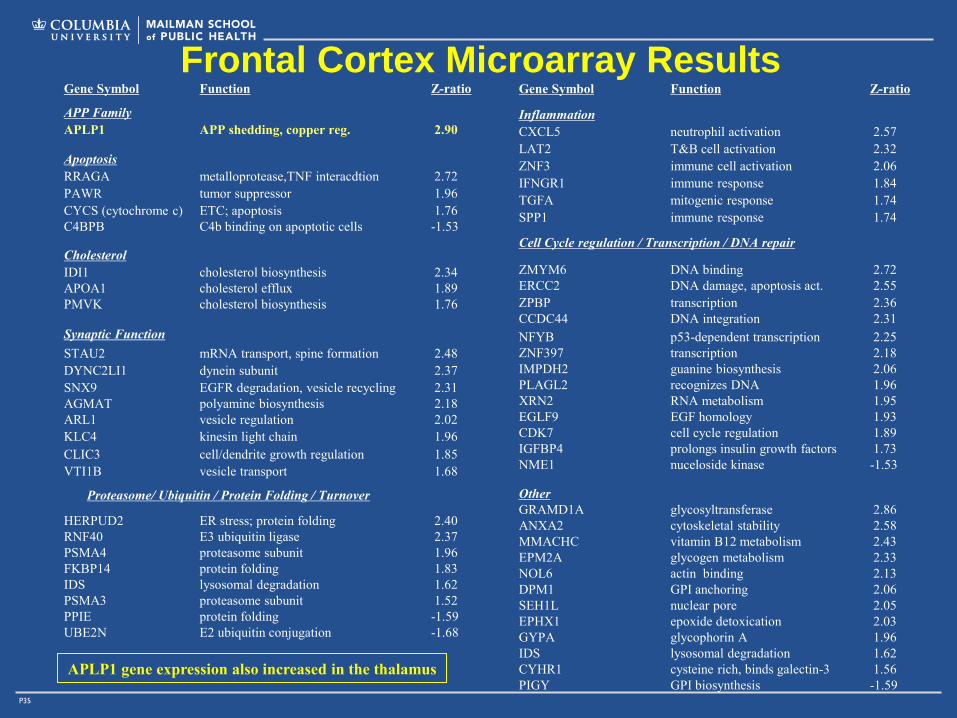
Gene Symbol Function Z-ratio
APP Family
APLP1 APP shedding, copper reg. 2.90
Apoptosis
RRAGA metalloprotease,TNF interacdtion 2.72
PAWR tumor suppressor 1.96
CYCS (cytochrome c) ETC; apoptosis 1.76
C4BPB C4b binding on apoptotic cells -1.53
Cholesterol
IDI1 cholesterol biosynthesis 2.34
APOA1 cholesterol efflux 1.89
PMVK cholesterol biosynthesis 1.76
Synaptic Function
STAU2 mRNA transport, spine formation 2.48
DYNC2LI1 dynein subunit 2.37
SNX9 EGFR degradation, vesicle recycling 2.31
AGMAT polyamine biosynthesis 2.18
ARL1 vesicle regulation 2.02
KLC4 kinesin light chain 1.96
CLIC3 cell/dendrite growth regulation 1.85
VTI1B vesicle transport 1.68
HERPUD2 ER stress; protein folding 2.40
RNF40 E3 ubiquitin ligase 2.37
PSMA4 proteasome subunit 1.96
FKBP14 protein folding 1.83
IDS lysosomal degradation 1.62
PSMA3 proteasome subunit 1.52
PPIE protein folding -1.59
UBE2N E2 ubiquitin conjugation -1.68
Gene Symbol Function Z-ratio
Inflammation
CXCL5 neutrophil activation 2.57
LAT2 T&B cell activation 2.32
ZNF3 immune cell activation 2.06
IFNGR1 immune response 1.84
TGFA mitogenic response 1.74
SPP1 immune response 1.74
ZMYM6 DNA binding 2.72
ERCC2 DNA damage, apoptosis act. 2.55
ZPBP transcription 2.36
CCDC44 DNA integration 2.31
NFYB p53-dependent transcription 2.25
ZNF397 transcription 2.18
IMPDH2 guanine biosynthesis 2.06
PLAGL2 recognizes DNA 1.96
XRN2 RNA metabolism 1.95
EGLF9 EGF homology 1.93
CDK7 cell cycle regulation 1.89
IGFBP4 prolongs insulin growth factors 1.73
NME1 nuceloside kinase -1.53
Other
GRAMD1A glycosyltransferase 2.86
ANXA2 cytoskeletal stability 2.58
MMACHC vitamin B12 metabolism 2.43
EPM2A glycogen metabolism 2.33
NOL6 actin binding 2.13
DPM1 GPI anchoring 2.06
SEH1L nuclear pore 2.05
EPHX1 epoxide detoxication 2.03
GYPA glycophorin A 1.96
IDS lysosomal degradation 1.62
CYHR1 cysteine rich, binds galectin-3 1.56
PIGY GPI biosynthesis -1.59
Frontal Cortex Microarray Results
Cell Cycle regulation / Transcription / DNA repair
Proteasome/ Ubiquitin / Protein Folding / Turnover
APLP1 gene expression also increased in the thalamus

P36
APLP1 Immunohistochemistry

P37
A
L K J
I G H
E D F
B C A: Control animal
B-F: Mn-exposed animals
G: Aged canine brain (from: Czasch &
Baumgartner, Neurobiology of Disease 27:
293, 2006)
H & I: Aged monkey brain (from: Kimura et
al., Neuropath Appl Neurobiol 31: 170,
2005)
J: 17 year old Down Syndrome (from: Gyure
et al., Arch Pathol Lab Med 125: 489, 2001)
K: AD patient (from: Alafuzoff et al., J
Neuropath Exp Neurol 65: 740, 2006)
L: neuron from a 20 month old Down
Syndrome that developed A plaques
(Gyure et al., Arch Pathol Lab Med 125:
489, 2001)
-amyloid Immunohistochemistry-6E10

P38
Silver Staining A Immuno-6E10
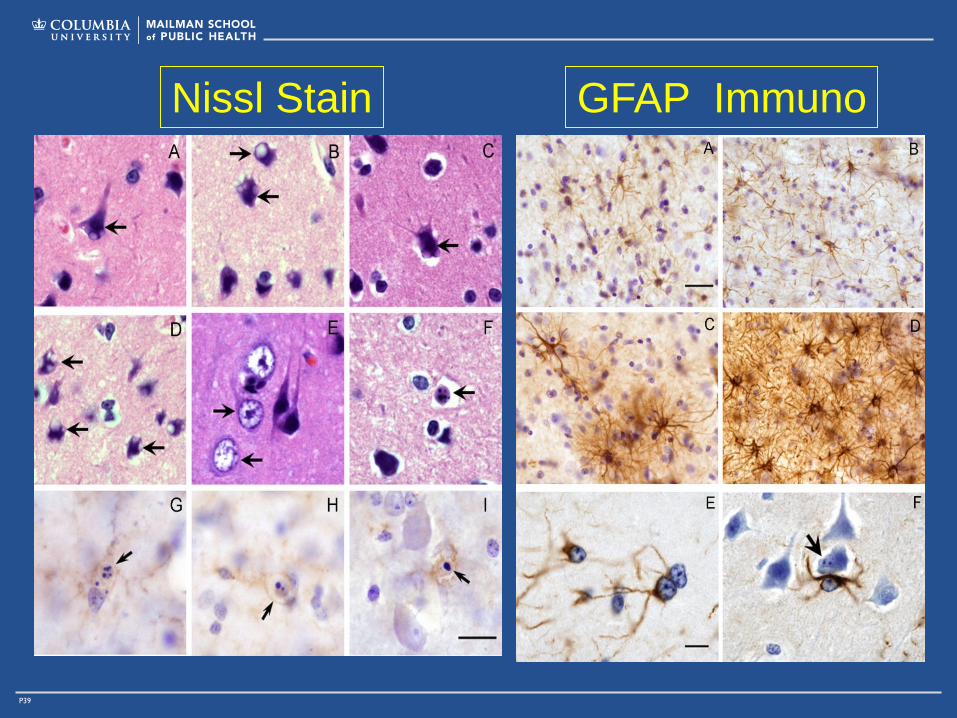
P39
GFAP Immuno Nissl Stain

P40
Manganese Neurotoxicity-Frontal Cortex
These studies indicate that Mn exposure produces an increase in APLP1 gene and
protein expression in the frontal cortex.
Exposure to Mn results in diffuse -amyloid plaques in the grey and white matter in
the frontal cortex.
Neurodegenerative changes were observed in the frontal cortex grey and white
matter using Silver and Nissl stains and these included apoptotic cells. These
degenerative changes were associated with glial activation.
These neurodegenerative changes may be responsible for the working memory
deficits observed in these animals.
Recent human studies have also implicated the frontal cortex in Mn-induced
neurotoxicity.

P41
Acknowledgements
Guilarte Lab:
-Jennifer McGlothan, MS
-Neal C. Burton, PhD
-Tatyana Verina, MS
-Kalynda Gonzales, PhD
Johns Hopkins Hospital (Radiology):
-Dean F. Wong, MD, PhD
-Peter Barker, PhD
-Yun Zhao, PhD
-Susumo Mori, PhD
Johns Hopkins PET Center:
-Robert F. Dannals, PhD
-Paige Finley (anesthesia)
Johns Hopkins Comparative Medicine:
-Robert Adams, PhD
Norwegian University of Science
& Technology:
-Tore Syversen, PhD
Gene Expression & Genomics Unit,
National Institute on Aging:
-Kevin Becker, PhD
-V.V. Prabhu, PhD
Purdue University Radiology:
-Ulrike Dydak
-Shalmali Tanmay Dharmadhikari
-Chien-Lin Yeh
Thomas Jefferson University:
-Jay S. Schneider, PhD
Funding: NIEHS-ES010975-10 to TRG

P42
Thank You!!
Questions??