apr spring 2016 - center for agricultural and rural ... · spring 2016 agricultural s cientists and...
TRANSCRIPT

1 / Agricultural Policy Review
The Agricultural Policy Review is primarily an online publication. This printed copy is produced in limited numbers as a convenience only. For more information please visit the Agricultural Policy Review website at: www.card.iastate.edu/ag_policy_review.
Ames, Iowa ● Spring 2016
AGRICULTURAL S CIENTISTS and economists have long been
interested in quantifying the optimal amount of nitrogen needed on an acre of corn. Notions of optimality are sometimes based on principles of cost and revenue, sometimes on yield targets, and other times on environmental concerns. Ask any producer, fertilizer retailer, or agronomist how much nitrogen a corn producer needs to apply and you will probably not be surprised to hear, repeatedly, “It depends.” Even if the optimal amount of nitrogen can be computed for a single ield, being right ex post hinges critically on weather and other factors. The nitrogen management decision is complicated because the yield response to nitrogen depends on a host of variables, most of which
The Yield Response to Nitrogen: Subjective Belief Bias in Nitrogen Managementby Sandip Agarwal, Keri Jacobs, Quinn Weninger, and John [email protected]; [email protected]; [email protected]; [email protected]
are uncertain when nitrogen is applied and beyond the control of the producer: rainfall amounts and timing, in- ield nutrient availability, and growing conditions top the list.
Further complicating the nitrogen decision is a producer’s beliefs about the underlying relationship between nitrogen and yields, and the roles played by external factors (e.g., weather). In 2014, we surveyed producers in Central Iowa to gain an understanding of the real-world decision processes used by farmers when making nitrogen decisions on their ields. The survey was designed to elicit individual producers’ beliefs about how much nitrogen is needed on a speci ic ield, the ield’s expected yields, and the expected impact
on yields when lesser and greater amounts of nitrogen are applied.
An important contribution of this work is to compare farmers’ underlying beliefs about the relationship between nitrogen and corn yields, these are subjective beliefs, with what agronomists have quanti ied as the actual relationship— this is the objective yield distribution and its response to varying amounts of nitrogen. Iowa State University researchers in the Department of Agronomy have maintained long-term trials of nitrogen and yield on several research farms located across the state (Sawyer et al. 2006). These trials occur on land of varying quality that experience variation in weather similar to the type of variation that would be experienced by producers
Photo: USDA, ARS
INSIDE THIS ISSUE
The Yield Response to Nitrogen: Subjective Belief Bias in Nitrogen Management ........................................................1
Crude Oil Prices and US Crop Exports: Exploring the Secondary Links between the Energy and Ag Markets ............................3
Reducing Antibiotic Use in Animal Production Systems ..........................................5
Research Needs and Challenges in the Food, Energy and Water System: Findings from an NSF Funded Workshop ...................7
2 / Agricultural Policy Review
in our survey. At the research sites, variables such as soil fertility, planting date, hybrid, etc. are held constant in order to compare yields under different nitrogen rates and rotation. In order to properly condition our analysis, we asked producers to report on ield speci ic measures including corn suitability rating (CSR), rotation, soil fertility, their nitrogen application plans and, importantly, their expected yield outcomes.
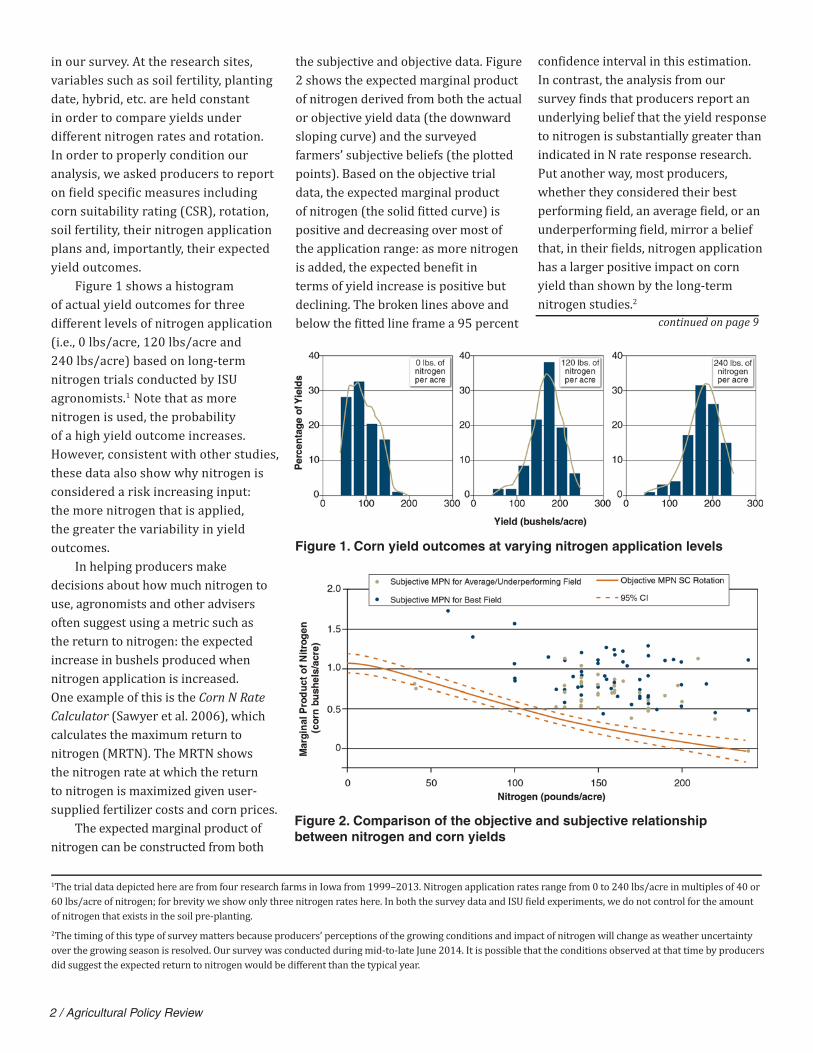
Figure 1 shows a histogram of actual yield outcomes for three different levels of nitrogen application (i.e., 0 lbs/acre, 120 lbs/acre and 240 lbs/acre) based on long-term nitrogen trials conducted by ISU agronomists.1 Note that as more nitrogen is used, the probability of a high yield outcome increases. However, consistent with other studies, these data also show why nitrogen is considered a risk increasing input: the more nitrogen that is applied, the greater the variability in yield outcomes.
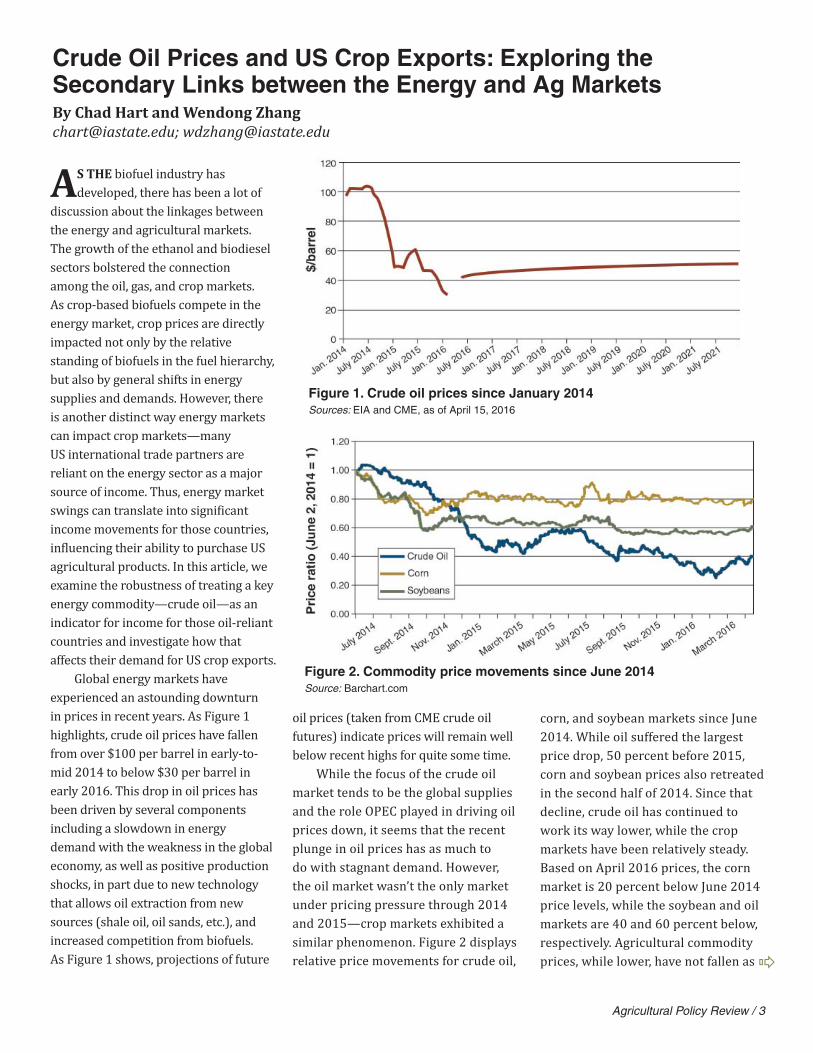
In helping producers make decisions about how much nitrogen to use, agronomists and other advisers often suggest using a metric such as the return to nitrogen: the expected increase in bushels produced when nitrogen application is increased. One example of this is the Corn N Rate Calculator (Sawyer et al. 2006), which calculates the maximum return to nitrogen (MRTN). The MRTN shows the nitrogen rate at which the return to nitrogen is maximized given user-supplied fertilizer costs and corn prices.
The expected marginal product of nitrogen can be constructed from both
the subjective and objective data. Figure 2 shows the expected marginal product of nitrogen derived from both the actual or objective yield data (the downward sloping curve) and the surveyed farmers’ subjective beliefs (the plotted points). Based on the objective trial data, the expected marginal product of nitrogen (the solid itted curve) is positive and decreasing over most of the application range: as more nitrogen is added, the expected bene it in terms of yield increase is positive but declining. The broken lines above and below the itted line frame a 95 percent
Figure 1. Corn yield outcomes at varying nitrogen application levels
con idence interval in this estimation. In contrast, the analysis from our survey inds that producers report an underlying belief that the yield response to nitrogen is substantially greater than indicated in N rate response research. Put another way, most producers, whether they considered their best performing ield, an average ield, or an underperforming ield, mirror a belief that, in their ields, nitrogen application has a larger positive impact on corn yield than shown by the long-term nitrogen studies.2
2The timing of this type of survey matters because producers’ perceptions of the growing conditions and impact of nitrogen will change as weather uncertainty over the growing season is resolved. Our survey was conducted during mid-to-late June 2014. It is possible that the conditions observed at that time by producers did suggest the expected return to nitrogen would be different than the typical year.
Figure 2. Comparison of the objective and subjective relationship between nitrogen and corn yields
1The trial data depicted here are from four research farms in Iowa from 1999–2013. Nitrogen application rates range from 0 to 240 lbs/acre in multiples of 40 or 60 lbs/acre of nitrogen; for brevity we show only three nitrogen rates here. In both the survey data and ISU ield experiments, we do not control for the amount of nitrogen that exists in the soil pre-planting.
continued on page 9
Agricultural Policy Review / 3
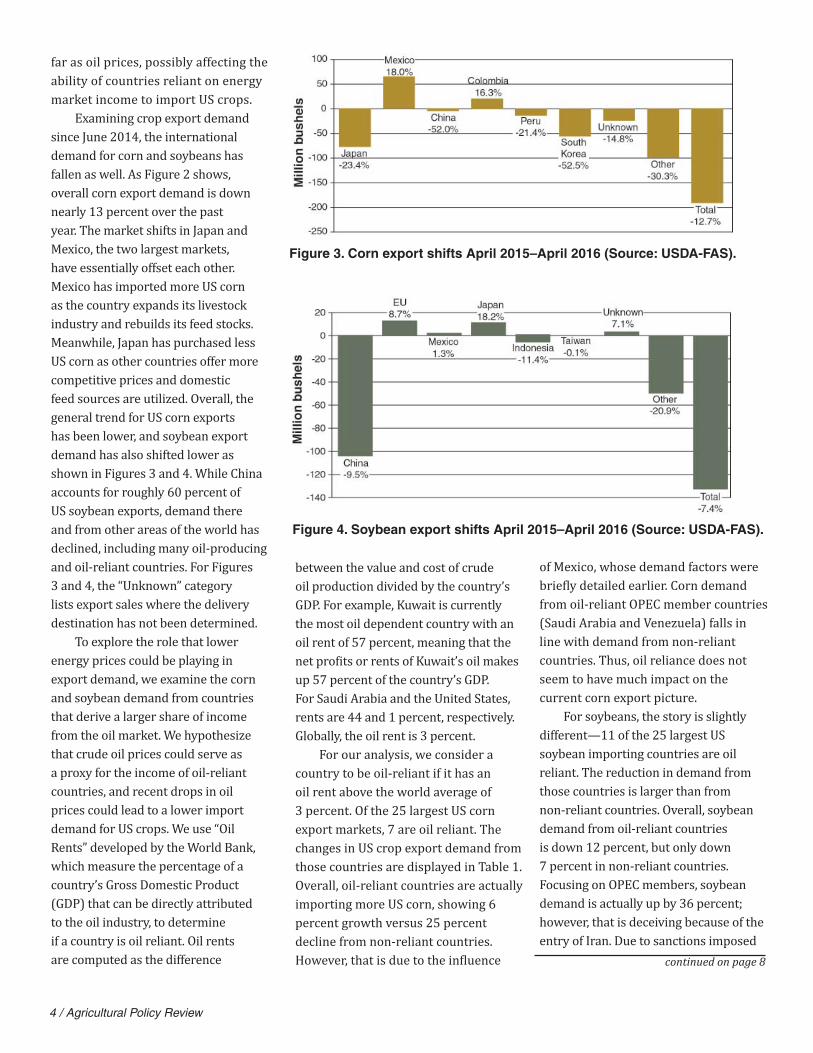
corn, and soybean markets since June 2014. While oil suffered the largest price drop, 50 percent before 2015, corn and soybean prices also retreated in the second half of 2014. Since that decline, crude oil has continued to work its way lower, while the crop markets have been relatively steady. Based on April 2016 prices, the corn market is 20 percent below June 2014 price levels, while the soybean and oil markets are 40 and 60 percent below, respectively. Agricultural commodity prices, while lower, have not fallen as
AS THE biofuel industry has developed, there has been a lot of
discussion about the linkages between the energy and agricultural markets. The growth of the ethanol and biodiesel sectors bolstered the connection among the oil, gas, and crop markets. As crop-based biofuels compete in the energy market, crop prices are directly impacted not only by the relative standing of biofuels in the fuel hierarchy, but also by general shifts in energy supplies and demands. However, there is another distinct way energy markets can impact crop markets—many US international trade partners are reliant on the energy sector as a major source of income. Thus, energy market swings can translate into signi icant income movements for those countries, in luencing their ability to purchase US agricultural products. In this article, we examine the robustness of treating a key energy commodity—crude oil—as an indicator for income for those oil-reliant countries and investigate how that affects their demand for US crop exports.
Global energy markets have experienced an astounding downturn in prices in recent years. As Figure 1 highlights, crude oil prices have fallen from over $100 per barrel in early-to-mid 2014 to below $30 per barrel in early 2016. This drop in oil prices has been driven by several components including a slowdown in energy demand with the weakness in the global economy, as well as positive production shocks, in part due to new technology that allows oil extraction from new sources (shale oil, oil sands, etc.), and increased competition from biofuels. As Figure 1 shows, projections of future
Crude Oil Prices and US Crop Exports: Exploring the Secondary Links between the Energy and Ag MarketsBy Chad Hart and Wendong [email protected]; [email protected]
oil prices (taken from CME crude oil futures) indicate prices will remain well below recent highs for quite some time.
While the focus of the crude oil market tends to be the global supplies and the role OPEC played in driving oil prices down, it seems that the recent plunge in oil prices has as much to do with stagnant demand. However, the oil market wasn’t the only market under pricing pressure through 2014 and 2015—crop markets exhibited a similar phenomenon. Figure 2 displays relative price movements for crude oil,
Figure 1. Crude oil prices since January 2014 Sources: EIA and CME, as of April 15, 2016
Figure 2. Commodity price movements since June 2014 Source: Barchart.com
4 / Agricultural Policy Review
of Mexico, whose demand factors were brie ly detailed earlier. Corn demand from oil-reliant OPEC member countries (Saudi Arabia and Venezuela) falls in line with demand from non-reliant countries. Thus, oil reliance does not seem to have much impact on the current corn export picture.
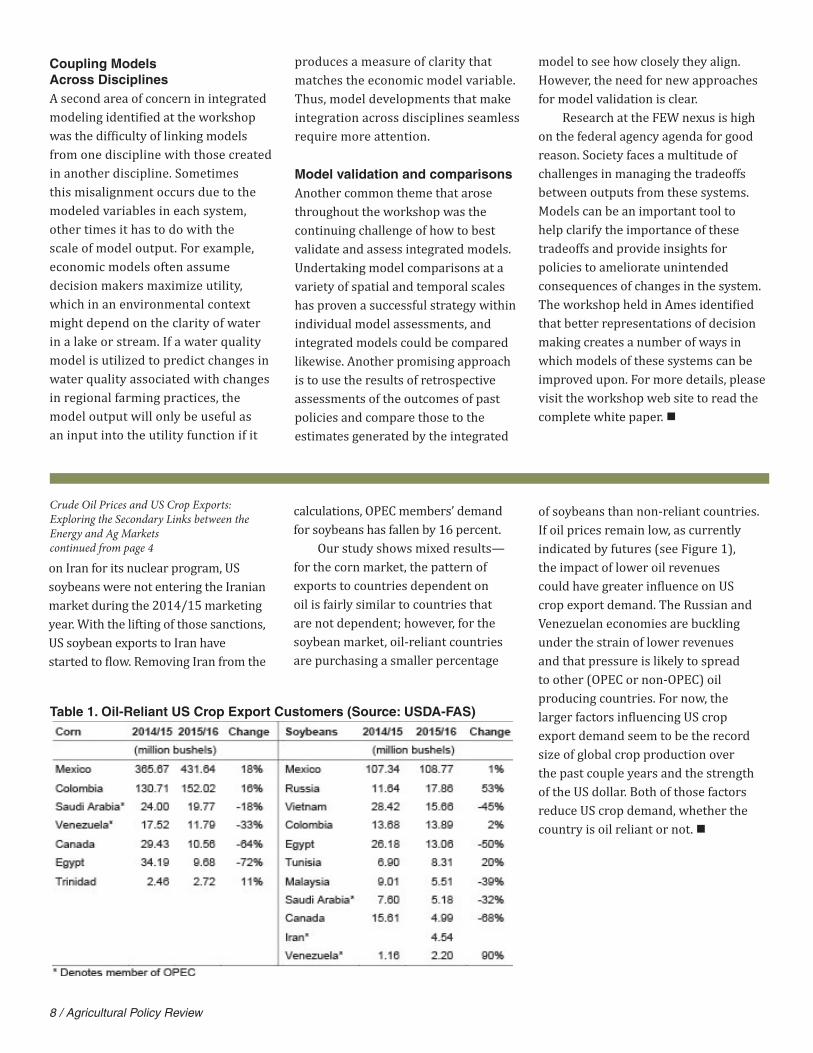
For soybeans, the story is slightly different—11 of the 25 largest US soybean importing countries are oil reliant. The reduction in demand from those countries is larger than from non-reliant countries. Overall, soybean demand from oil-reliant countries is down 12 percent, but only down 7 percent in non-reliant countries. Focusing on OPEC members, soybean demand is actually up by 36 percent; however, that is deceiving because of the entry of Iran. Due to sanctions imposed
far as oil prices, possibly affecting the ability of countries reliant on energy market income to import US crops.
Examining crop export demand since June 2014, the international demand for corn and soybeans has fallen as well. As Figure 2 shows, overall corn export demand is down nearly 13 percent over the past year. The market shifts in Japan and Mexico, the two largest markets, have essentially offset each other. Mexico has imported more US corn as the country expands its livestock industry and rebuilds its feed stocks. Meanwhile, Japan has purchased less US corn as other countries offer more competitive prices and domestic feed sources are utilized. Overall, the general trend for US corn exports has been lower, and soybean export demand has also shifted lower as shown in Figures 3 and 4. While China accounts for roughly 60 percent of US soybean exports, demand there and from other areas of the world has declined, including many oil-producing and oil-reliant countries. For Figures 3 and 4, the “Unknown” category lists export sales where the delivery destination has not been determined.
To explore the role that lower energy prices could be playing in export demand, we examine the corn and soybean demand from countries that derive a larger share of income from the oil market. We hypothesize that crude oil prices could serve as a proxy for the income of oil-reliant countries, and recent drops in oil prices could lead to a lower import demand for US crops. We use “Oil Rents” developed by the World Bank, which measure the percentage of a country’s Gross Domestic Product (GDP) that can be directly attributed to the oil industry, to determine if a country is oil reliant. Oil rents are computed as the difference
between the value and cost of crude oil production divided by the country’s GDP. For example, Kuwait is currently the most oil dependent country with an oil rent of 57 percent, meaning that the net pro its or rents of Kuwait’s oil makes up 57 percent of the country’s GDP. For Saudi Arabia and the United States, rents are 44 and 1 percent, respectively. Globally, the oil rent is 3 percent.
For our analysis, we consider a country to be oil-reliant if it has an oil rent above the world average of 3 percent. Of the 25 largest US corn export markets, 7 are oil reliant. The changes in US crop export demand from those countries are displayed in Table 1. Overall, oil-reliant countries are actually importing more US corn, showing 6 percent growth versus 25 percent decline from non-reliant countries. However, that is due to the in luence
Figure 4. Soybean export shifts April 2015–April 2016 (Source: USDA-FAS).
Figure 3. Corn export shifts April 2015–April 2016 (Source: USDA-FAS).
continued on page 8
Agricultural Policy Review / 5
ANTIMICROBIAL DRUGS are commonly used for animals raised
in food production for treatment, control, and prevention of disease as well as growth promotion or increased feed efficiency in many production systems. A recent report from the USDA Economic Research Service (Sneeringer et al. 2015) indicates that the share of hogs, broilers, and beef cattle that have been raised without the use of antibiotics has increased, although a significant share of animals do receive antibiotics for growth promotion or disease prevention (e.g., 59 percent of finishing hogs in 2009 and 52 percent of broilers in 2011). Furthermore, many producers reported that they did not know about their use of antibiotics, particularly those producing under contract (based on data from the USDA Agricultural Resource Management Survey, Sneeringer et al. 2015). The advantages of using antimicrobials in production include prevention of mortality and morbidity especially for young animals (e.g., weaning pigs), reduced input costs (improved feed efficiency), and reduced variation in growth and final product. However, concerns have been raised that the extent of antibiotic use in animal production has the potential to promote the development of antibiotic-resistant pathogens that can affect human health through exposure in food and the environment and limit the important and critical benefits of drugs used to treat and protect human health. Consumer groups and public health proponents have pushed for the food animal production industry to restrict antimicrobial use.
US Policies and PracticesIn 2013, the Food and Drug Administration (FDA) issued guidance on the appropriate use of “medically important” antibiotics in food animal production. Guidance #213 includes requests to remove use for growth promotion through re-labeling products to remove feed ef iciency and growth promotion use claims; limit application of dosing to speci ic duration and level for an identi ied disease and targeted animal industry; avoid administering doses to entire lock or herd; and clarify the use of
drugs for disease prevention. FDA also proposed a rule to require the use of veterinary feed directives that increase veterinary oversight for the use of antibiotics deemed medically important for human health. USDA was directed to “advance development and use of antibiotic stewardship practices that assure judicious use of antibiotics in agriculture.” Alternative strategies to preventing and controlling disease include vaccination, improved
animal housing and management systems, and adjustments in feeding systems. However, changing practices and decisions made at the production level is challenging, and current data systems do not effectively monitor usage and applications.
Concurrent with changes in use of antibiotics, efforts are underway to improve the reporting on antimicrobials sold or distributed for use in food-producing animals. At the same time, the food industry and meat companies have responded to consumer demand to limit antimicrobial use by adopting new requirements on production practices and use of antibiotics by suppliers of their animal and meat products. For example, Perdue Farms has stopped almost all antibiotic use in raising chicken, Tyson is offering a brand of chicken raised without antibiotics, retail grocers and food service companies like Chick- il-A, Chipotle, and Subway have made statements to indicate restriction on products (poultry) produced with antibiotics, and other stores like Wal-
Reducing Antibiotic Use in Animal Production Systemsby Helen H. [email protected]
6 / Agricultural Policy Review
Mart are offering beef, pork, and chicken raised without antibiotics as a specialty product. In response, producers and animal practitioners have expressed concerns that restricting use in the treatment of disease risks harm to animal welfare. The policy for animals in the United States is still evolving and differs from policy enacted in the European Union where there is less use of voluntary efforts, and greater use of restriction on producer and veterinary practice. Many of the differences between the United States and European Union stem from differences in the data systems used to track drugs used in veterinary practice.
The Danish ExperienceDenmark was one of the earliest countries to adopt more restrictive policies on the use of antibiotics and, as a major producer of pork in the world market, can offer lessons on the practice and effectiveness of policies and restrictions on their antimicrobials in animal production. Denmark prohibited the use of antimicrobials for growth promotion in 1998 and restricted use in all production phases in 2000. Hayes and Jensen (2003) conducted one of the early studies to assess implications of such restrictions on the US swine industry. Based on parameters from the Danish experience, they applied biological and economic modeling to the US production systems and concluded that the ban at the weaning stage was the most dif icult—minimizing the effects of reducing usage requires changes in management and production practices and coordination between producer and veterinary services, especially for young pigs.
In Denmark, further reductions in antimicrobial use have resulted from tighter controls on veterinary practices,
monitoring veterinary prescriptions, the use of a “yellow card” system to lag producers and operations with
high use (implemented in 2010), and limiting the ability of veterinarians to pro it from sales. Denmark maintains an extensive antimicrobial monitoring and research program with collaborating of ices in veterinary, food, and health institutes and agencies and an integrated data reporting system through veterinary practices, private laboratories, processing plants, and health services and hospitals. Antimicrobial use in animal production is monitored by speci ic drug, quantity, veterinarian, specie, animal age group, and farm identi ication. However, close examination of the current Danish system shows that challenges in on-farm and veterinary practices to increasingly tighter controls remain (Jensen and Hayes 2014). Most recently, Denmark implemented additional taxes on veterinary sales including a differentiated tax on antibiotics (highest on the most critically important antibiotics) and removed the existing tax on vaccines, which may reduce the need for antibiotics. Despite the overall decrease in consumption of antimicrobial agents in Denmark, the overall effectiveness of reduced animal use in mitigating development of antimicrobial resistance is mixed.
Implications for the United StatesAlthough the Danish context is signi icantly different than that in the United States, the Danish experience offers insight into the implications from a shift in US policy and food industry practice to implement more restrictions on antibiotic use in animal production. Experience with the most ef icient and best managed production facilities indicates that production systems can
operate well without compromising productivity, although with some increase in costs. New research is improving our understanding of the development and persistence of resistance at the farm and in the human population. Understanding the management and production practices in a multi-disciplinary context is necessary to reduce resistance and exposures in the environment and on-going work and collaborations at Iowa State University are currently addressing these problems.
In addition to farm-level practices, there are adjustments likely to occur throughout the supply chain that will favor producers with the ability to have tighter production controls and meet the requirements of buyers with stricter standards on antimicrobial use. Global trade and production systems pose other challenges. Recent problems of E. coli resistant to cephalosporins in poultry in Denmark were traced to grandparent locks in Great Britain. If there are cost increases at the production level, consumers are likely to bear some of the cost of adjustment through higher prices. However, based on industry response and observation of the development and persistence of market niches offering products with limited use of antibiotics, consumers do have a choice and some are willing to pay the price. Companies in the food service industry trying to guarantee product sourced with more restrictive practices now need to compete for more limited supply of product raised with limited use of antimicrobials. From the public health perspective, there is a critical need to determine if efforts in animal and food sectors will have a positive effect on reducing the overall level of exposure to antimicrobial resistance in human health.
references on page 9
Agricultural Policy Review / 7
IN OCTOBER 2015, the Center for Agricultural and Rural Development
at Iowa State University, Ames, Iowa hosted a two-day National Science Foundation-funded workshop exploring the challenges and pitfalls associated with integrating biophysical and economic models. The workshop brought together leading economists, statisticians, crop scientists, hydrologists, climate scientists, and other biophysical modelers, to identify and address the key scienti ic, engineering, and data challenges associated with understanding our food, energy, and water (FEW) system. Approximately 80 people attended the workshop with about half of them representing social scientists (primarily economists) and the rest from the physical and natural sciences. Economics and social sciences were intentionally emphasized so that the indings would be particularly relevant
to research needs in those ields.The direct product of this
workshop is a white paper, available at http://www.card.iastate.edu/few, which provides guidance to the National Science Foundation in formulating future funding initiatives in this area.
In addition to the four workshop leaders, about two dozen participants, listed as coauthors, contributed to the inal white paper, which identi ies several major gaps in existing modeling capacity that present substantial impediments to understanding the FEW system.
While the white paper identi ies a number of areas of necessary research,
Research Needs and Challenges in the Food, Energy and Water System: Findings from an NSF Funded WorkshopBy Catherine L. Kling, Raymond W. Arritt, Gray Calhoun, and David A. [email protected]; [email protected]; [email protected]; [email protected]
the following broad areas are the highest priority for future funding.
Economic Models of Decision-Making in Coupled SystemsA clear theme emanating from many of the talks at the workshop and follow up discussions was the need for integrated models to have adequate representations of human behavior. While there is a growing and increasingly visible literature that couples human system models with biophysical models, many studies do not incorporate economic and social drivers. Too often, decision making in coupled economic and biophysical models are not explicitly modeled, or based on overly simplistic rules of thumb. Poor policy recommendations are likely to come from models that do not adequately represent how incentives will alter behavior.
We discussed a number of approaches, including more widespread use of models with simple representations of humans as economic agents who attempt
to improve their own welfare or profits. To appropriately capture potential changes to policy, it can also be very important to incorporate market responses, both regionally and internationally. Additionally, there are situations where simple profit maximization assumptions will not adequately represent human behavior. In these cases, insights from behavioral economics, sociology, and psychology may be useful to build models better representing likely responses to policy and other system drivers. Needed model improvements also include better representation of decision making related to adaptation behavior and the adoption of new technologies. Finally, some decisions have important dynamic components where beliefs of the decision maker about future prices or environmental considerations affect decisions made today. There is a paucity of models that can incorporate these dynamic considerations and that can appropriately incorporate uncertainty in decision making.
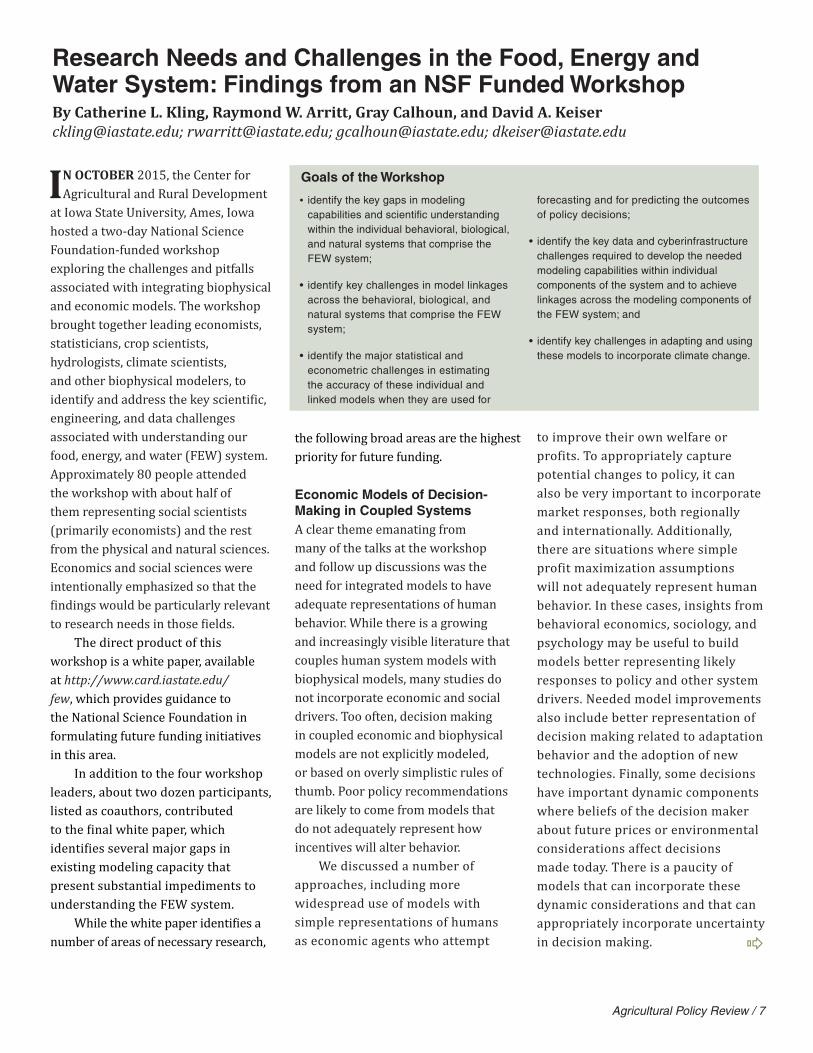
• identify the key gaps in modeling capabilities and scientifi c understanding within the individual behavioral, biological, and natural systems that comprise the FEW system;
• identify key challenges in model linkages across the behavioral, biological, and natural systems that comprise the FEW system;
• identify the major statistical and econometric challenges in estimating the accuracy of these individual and linked models when they are used for
forecasting and for predicting the outcomes of policy decisions;
• identify the key data and cyberinfrastructure challenges required to develop the needed modeling capabilities within individual components of the system and to achieve linkages across the modeling components of the FEW system; and
• identify key challenges in adapting and using these models to incorporate climate change.
Goals of the Workshop
8 / Agricultural Policy Review
Coupling Models Across DisciplinesA second area of concern in integrated modeling identi ied at the workshop was the dif iculty of linking models from one discipline with those created in another discipline. Sometimes this misalignment occurs due to the modeled variables in each system, other times it has to do with the scale of model output. For example, economic models often assume decision makers maximize utility, which in an environmental context might depend on the clarity of water in a lake or stream. If a water quality model is utilized to predict changes in water quality associated with changes in regional farming practices, the model output will only be useful as an input into the utility function if it
produces a measure of clarity that matches the economic model variable. Thus, model developments that make integration across disciplines seamless require more attention.
Model validation and comparisonsAnother common theme that arose throughout the workshop was the continuing challenge of how to best validate and assess integrated models. Undertaking model comparisons at a variety of spatial and temporal scales has proven a successful strategy within individual model assessments, and integrated models could be compared likewise. Another promising approach is to use the results of retrospective assessments of the outcomes of past policies and compare those to the estimates generated by the integrated
model to see how closely they align. However, the need for new approaches for model validation is clear.
Research at the FEW nexus is high on the federal agency agenda for good reason. Society faces a multitude of challenges in managing the tradeoffs between outputs from these systems. Models can be an important tool to help clarify the importance of these tradeoffs and provide insights for policies to ameliorate unintended consequences of changes in the system. The workshop held in Ames identi ied that better representations of decision making creates a number of ways in which models of these systems can be improved upon. For more details, please visit the workshop web site to read the complete white paper.
Table 1. Oil-Reliant US Crop Export Customers (Source: USDA-FAS)
on Iran for its nuclear program, US soybeans were not entering the Iranian market during the 2014/15 marketing year. With the lifting of those sanctions, US soybean exports to Iran have started to low. Removing Iran from the
calculations, OPEC members’ demand for soybeans has fallen by 16 percent.
Our study shows mixed results—for the corn market, the pattern of exports to countries dependent on oil is fairly similar to countries that are not dependent; however, for the soybean market, oil-reliant countries are purchasing a smaller percentage
of soybeans than non-reliant countries. If oil prices remain low, as currently indicated by futures (see Figure 1), the impact of lower oil revenues could have greater in luence on US crop export demand. The Russian and Venezuelan economies are buckling under the strain of lower revenues and that pressure is likely to spread to other (OPEC or non-OPEC) oil producing countries. For now, the larger factors in luencing US crop export demand seem to be the record size of global crop production over the past couple years and the strength of the US dollar. Both of those factors reduce US crop demand, whether the country is oil reliant or not.
Crude Oil Prices and US Crop Exports: Exploring the Secondary Links between the Energy and Ag Marketscontinued from page 4

Agricultural Policy Review / 9
Our research inds differences in the actual yield response to changes in nitrogen application and the response perceived by producers. What are the underlying causes of this difference? One explanation is that decision makers may not assign the correct (true) probabilities to uncertain outcomes. Another explanation is that differences in the actual and perceived nitrogen response stems from being overly optimistic. For example, producers may attach too
Th e Yield Response to Nitrogen: Subjective Belief Bias in Nitrogen Managementcontinued from page 2
great of a probability to ‘good’ growing conditions, where nitrogen’s role in plant growth is perhaps greatest. A third possibility is that producers perceive nitrogen to be a relatively inexpensive risk-limiting input: this is the nitrogen-as-insurance argument. For example, “If I apply more nitrogen, nitrogen won’t be the limiting factor,” or “I have a greater probability of a larger yield, somewhat regardless of the weather outcome.”
The source of the bias in producers’ perceptions about nitrogen’s role in crop growth is the subject of our ongoing research. What we have learned so far is
that the bias can be large. That it exists at all has implications for designing policies for water quality and nutrient use and gives important insight into how educational programs of nitrogen management might be more effective.
ReferencesBabcock, B.A. Effects of Uncertainty on Optimal
Nitrogen Applications. Rev. Agr. Econ. 14 (1992): 271–80.
Sawyer, J., E. Nafziger, G. Randall, L. Bundy, G. Rehm, B. Joern. 2006. Concepts and Rationale for Regional Nitrogen Rate Guidelines for Corn, Iowa State University Extension Publication, available at http://www.extension.iastate.edu/Publications/PM2015.pdf.
References: Hayes, D.J. and H.H. Jensen. 2003. “Lessons from
the Danish Ban of Feed-Grade Antibiotics.” Choices. Third Quarter 2003. http://www.choicesmagazine.org/2003-3/2003-3-01.htm
Jensen, H.H. and D.J. Hayes. 2014. “Impact of Denmark’s Ban on Antimicrobials for Growth Promotion.” Current Opinion in Microbiology 19: 30–36.
Sneeringer, S., J. MacDonald, N. Key, W. McBride, and K. Mathews. 2015. “Economics of Antibiotic Use in U.S. Livestock Production.” USDA Economic Research Service, Economic Research Report Number 200, November 2015. http://www.ers.usda.gov/publications/err-economic-research-report/err200.aspx
Reducing Antibiotic Use in Animal Production Systemscontinued from page 6

10 / Agricultural Policy Review

Agricultural Policy Review / 11

www.card.iastate.edu
Editorial StaffNathan Cook Managing EditorCurtis Balmer Web ManagerRebecca Olson Publication Design
EditorCatherine L. Kling CARD Director
Subscription is free and available on-line. To sign up for an electronic alert to the newsletter post, go to www. card.iastate.edu/ag_policy_review/subscribe and submit your information.
Iowa State University does not discriminate on the basis of race, color, age, ethnicity, religion, national origin, pregnancy, sexual orientation, gender identity, genetic information, sex, marital status, disability, or status as a U.S. veteran. Inquiries can be directed to the Interim Assistant Director of Equal Opportunity and Compliance, 3280 Beardshear Hall, (515) 294-7612.
Agricultural Policy Review is a quarterly newsletter published by the Center for Agricultural and Rural Development (CARD). This publication presents summarized results that emphasize the implications of ongoing agricultural policy analysis of the near-term agricultural situation, and discussion of agricultural policies currently under consideration.
Articles may be reprinted with permission and with appropriate attribution. Contact the managing editor at the above e-mail or call 515-294-3809.
Advisory CommitteeBruce A. BabcockJohn BeghinChad HartDermot J. HayesHelen H. JensenGianCarlo MoschiniSebastien PouliotLee Schulz