apresentação 1 q12 eng-1
DESCRIPTION
TRANSCRIPT
1April 18, 2012
Localiza Rent a Car S.A.1Q12 results
R$ million, IFRS
2
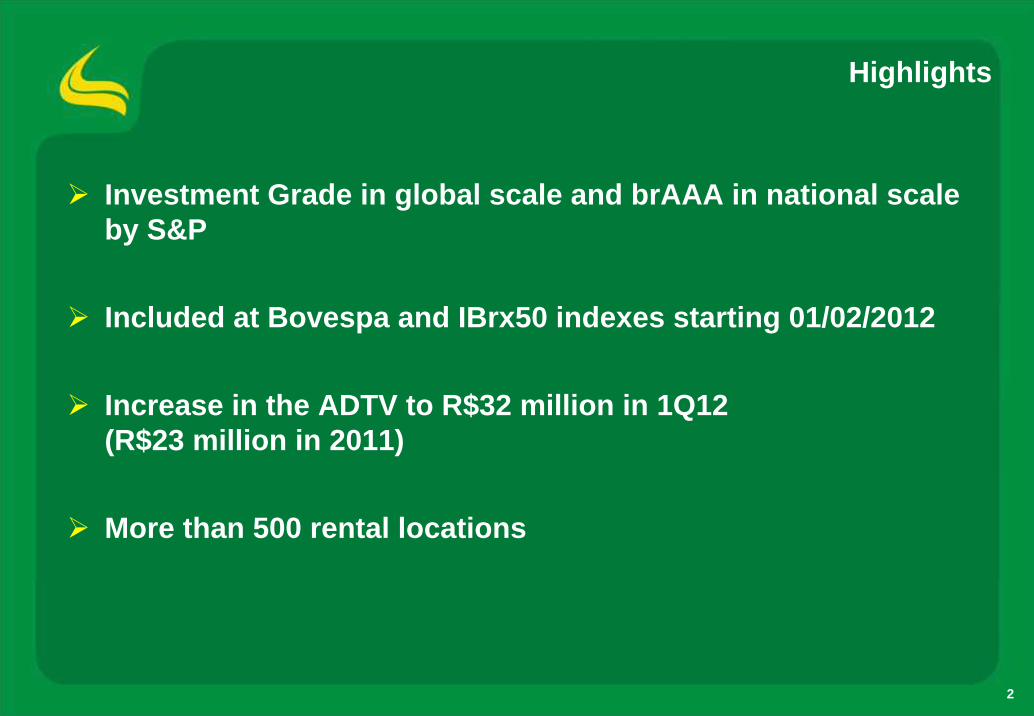
Highlights
Investment Grade in global scale and brAAA in national scale by S&P
Included at Bovespa and IBrx50 indexes starting 01/02/2012
Increase in the ADTV to R$32 million in 1Q12 (R$23 million in 2011)
More than 500 rental locations

3
681.5774.7
1Q11 1Q12
Highlights
Consolidated EBITDA
Consolidated net income End of period fleet
Car rental Fleet rental
R$
mill
ion
Net Revenues - Consolidated
R$
mill
ion
13.7%12.8%
14.3%
186.2210.0
1Q11 1Q12
72.763.6
1Q11 1Q12
60,258
31,186
56,080
28,191
1Q11 1Q12
8.5%84,271 91,444
Qua
ntity
R$
mill
ion

4
Car Rental Division
Revenue grew above volume due to the increase in the average rental rate per car.
267.9233.0
980.7802.2
585.2565.2428.0
346.1258.6
2005 2006 2007 2008 2009 2010 2011 1Q11 1Q12
CAGR: 24.9%
22.3% 15.0%
3,4114,668
5,7937,940 8,062
10,73412,794
3,063 3,330
2005 2006 2007 2008 2009 2010 2011 1Q11 1Q12
CAGR: 24.6%
19.2% 8.7%
# daily rentals (thousand)
Net revenues (R$ million)
5
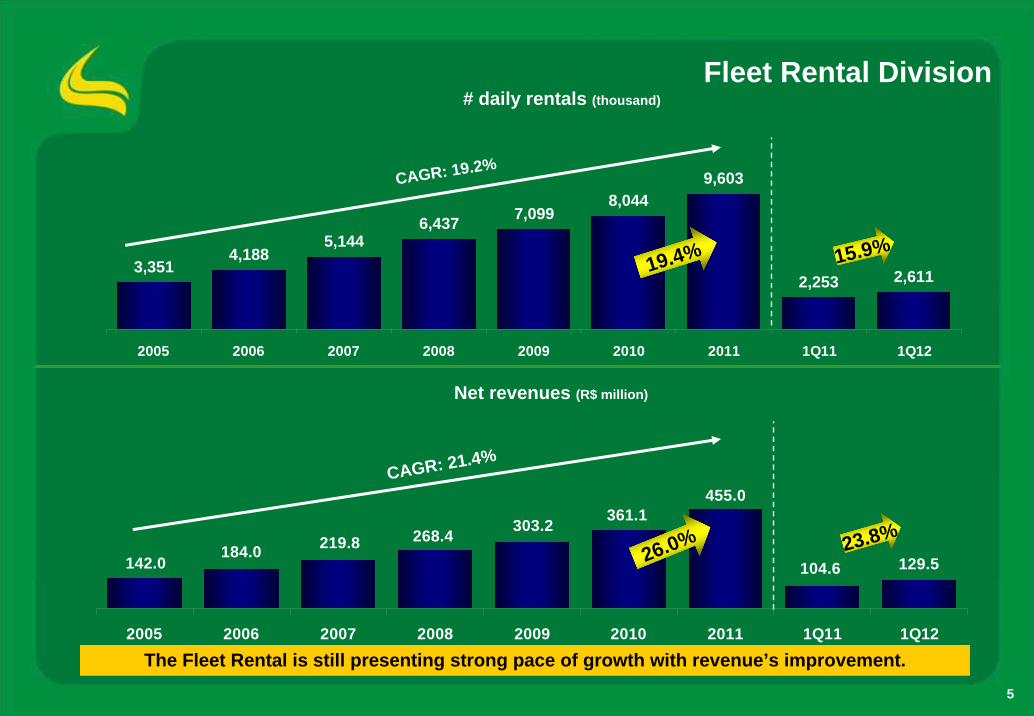
Fleet Rental Division
The Fleet Rental is still presenting strong pace of growth with revenue’s improvement.
142.0184.0 219.8 268.4 303.2 361.1
455.0
104.6 129.5
2005 2006 2007 2008 2009 2010 2011 1Q11 1Q12
CAGR: 21.4%
26.0% 23.8%
3,3514,188
5,1446,437 7,099
8,0449,603
2,253 2,611
2005 2006 2007 2008 2009 2010 2011 1Q11 1Q12
CAGR: 19.2%
15.9%19.4%
# daily rentals (thousand)
Net revenues (R$ million)

6
26,10533,520 38,050 44,211 43,161
18,763 23,17430,093 34,281 34,519
13,2858,065
59,950
8,723
65,934
11,581
47,285 50,772
2005 2006 2007 2008 2009 2010 2011 1Q11 1Q12
Net Investment
Car Rental fleet was reduced after the peak of summer vacation demand…
Fleet increase * (quantity)
Purchases (accessories included) Net used car sales revenues
Net investment (R$ million)
* It does not include theft / crashed cars.
690.0930.3 1,060.9
1,335.3 1,204.2
1,910.41,776.5
249.5446.5 588.8
850.5 980.8 922.4
1,321.91,468.1
340.7 373.3231.8
2005 2006 2007 2008 2009 2010 2011 1Q11 1Q12
(108.9) (123.8)243.5
341.5 210.4354.5 281.8
308.4588.5
(3,516)(4,562)7,342 10,346 7,957
18,649
9,930 8,642
9,178
Purchased cars Sold cars

7
Utilization rate – car rental division
...to keep utilization rate in healthy levels.
66.2% 69.9% 68.2% 68.9% 68.9%69.7%68.2%
74.1%66.3%
0 .0 %
5 .0 %
1 0 .0 %
1 5 .0 %
2 0 .0 %
2 5 .0 %
3 0 .0 %
3 5 .0 %
4 0 .0 %
4 5 .0 %
5 0 .0 %
5 5 .0 %
6 0 .0 %
6 5 .0 %
7 0 .0 %
7 5 .0 %
8 0 .0 %
8 5 .0 %
9 0 .0 %
9 5 .0 %
1 0 0 .0 %
1Q10 2Q10 3Q10 4Q10 1Q11 2Q11 3Q11 4Q11 1Q12

8
End of period fleetQuantity
Inspite of reduction after peak of demand, end of period fleet grew 8.5% compared to the 1Q11.
Car rental Fleet rental
31,373 35,686 39,112 47,51761,445 64,688 56,080 60,25811,762
14,630 17,79023,403
22,778
26,615 31,62928,191 31,186
24,103
2005 2006 2007 2008 2009 2010 2011 1Q11 1Q12
35,86546,003
53,47662,515
70,295
88,06096,317CAGR: 17.9%
91,44484,271
8.5%
9
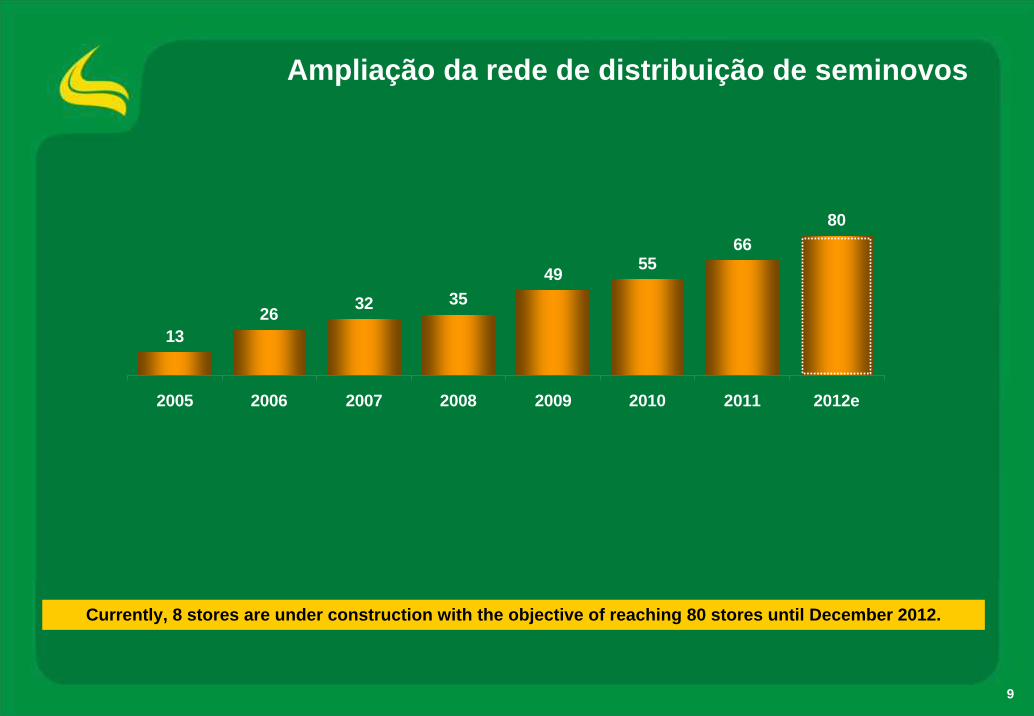
Ampliação da rede de distribuição de seminovos
Currently, 8 stores are under construction with the objective of reaching 80 stores until December 2012.
26 32 3549 55
6680
13
2005 2006 2007 2008 2009 2010 2011 2012e

10
Consolidated net revenuesR$ million
The growth was leveraged by the increase of 17.8% in the rental revenues.
Rentals Seminovos
408.4 537.4 655.0 842.9 898.5 1,175.3 1,450.0
340.8 401.4446.5 588.8
850.5980.8 922.4
1,468.1
340.7 373.3
1,321.9
2005 2006 2007 2008 2009 2010 2011 1Q11 1Q12
681.5 774.713.7%
17.8%
CAGR: 22.7%
854.91,126.2
1,505.51,823.7
2,918.1
1,820.9
2,497.2
23.4%
16.9%

11
EBITDA R$ million
Car rental margin was impacted by loss of scale, due to a lower growth rate.
Divisions 2005 2006 2007 2008 2009 2010 2011
46.9%
68.6%
53.8%
2.8%
45.3%
68.0%
52.3%
2.6%
45.9%
69.1%
53.3%
5.6%
1Q11 1Q12
42.0%
66.2%
Rentals consolidated 53.6% 52.9% 54.5% 51.1% 50.7% 49.9%
2.6%
44.0%
66.0%
3.9%
41.9%
68.7%
1.1%
43.4%
71.4%
4.6%
46.0%
71.3%
5.5%
Car rental 47.5%
Fleet Rental 65.5%
Used car sales 13.2%
277.9 311.3403.5
504.1 469.7649.5
821.3
186.2 210.0
2005 2006 2007 2008 2009 2010 2011 1Q11 1Q12
CAGR: 19.8%
12.8%
26.5%

12
Average depreciation per car
Depreciation is in line with the Company’s expectation for the current scenario.
1,536.0 1,683.9 1,965.8
332.9
2,546.0 2,577.0
939.1492.3
2005 2006 2007 2008 2009 2010 2011 1Q12
Hot used car market
Financial crisis effect
3,509.74,185.34,133.0
2,981.32,383.3
4,371.75,083.1
2,395.8
2005 2006 2007 2008 2009 2010 2011 1Q12
13
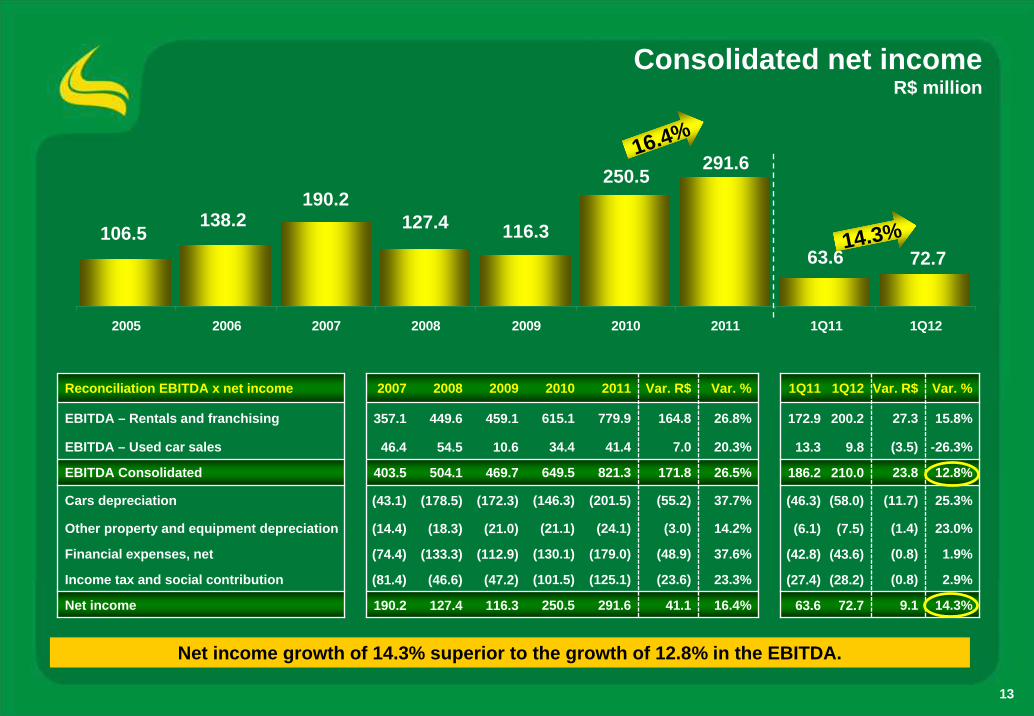
Consolidated net incomeR$ million
Net income growth of 14.3% superior to the growth of 12.8% in the EBITDA.
16.4%
72.763.6
291.6250.5
116.3127.4190.2
138.2106.5
2005 2006 2007 2008 2009 2010 2011 1Q11 1Q12
14.3%
Reconciliation EBITDA x net income 2007 2008 2011 Var. R$ Var. R$
164.8 27.3
(3.5)
23.8
(11.7)
(1.4)
(0.8)
(0.8)
9.1
7.0
171.8
(55.2)
(3.0)
(48.9)
(23.6)
41.1
357.1
46.4
403.5
(43.1)
(14.4)
(74.4)
Var. %
(81.4)
190.2
779.9449.6
54.5
504.1
(178.5)
(18.3)
(133.3)
26.8%
(46.6)
20.3%
127.4
41.4
821.3
(201.5)
(24.1)
(179.0)
26.5%
37.7%
14.2%
37.6%
23.3%(125.1)
291.6 16.4%
2009 2010
459.1
10.6
469.7
(172.3)
(21.0)
(112.9)
(47.2)
1Q11 1Q12 Var. %
EBITDA – Rentals and franchising
116.3
615.1
34.4
649.5
(146.3)
(21.1)
(130.1)
(101.5)
250.5
15.8%
-26.3%
EBITDA Consolidated 186.2 210.0 12.8%
25.3%
23.0%
1.9%
2.9%
14.3%
172.9 200.2
EBITDA – Used car sales 13.3 9.8
Cars depreciation (46.3) (58.0)
Other property and equipment depreciation (6.1) (7.5)
Financial expenses, net (42.8) (43.6)
Income tax and social contribution (27.4) (28.2)
Net income 63.6 72.7

14
Free cash flow - FCF
Cash generated before interest expenses was used for the reduction of the accounts payable to OEMs.
(*) without technical discount deduction
Free cash flow - R$ million 2005 2006 2007 2008 2009 2010 2011 1Q12
821.3 210.0
(373.3)
340.7
(29.6)
(29.8)
118.0
373.3
(249.5)
123.8
(16.8)
225.0
-
(211.8)
13.2
(4,562)
(1,468.1)
1,328.6
(83.0)
(83.9)
514.9
1,468.1
(1,504.5)
(36.4)
(63.0)
415.5
(272.0)
32.7
176.2
9,178
649.5
(1,321.9)
1,203.2
(57.8)
54.5
527.5
1,321.9
(1,370.1)
(48.2)
(51.1)
428.2
(540.3)
111.3
(0.8)
18,649
469.7
(922.4)
855.1
(49.0)
(11.5)
341.9
922.4
(947.9)
(25.5)
(21.0)
295.4
(241.1)
241.1
295.4
Fleet increase (decrease) - quantity 7,342 10,346 7,957 9,930 8,642
504.1
(980.8)
874.5
(52.8)
(44.8)
300.2
980.8
(1,035.4)
(54.6)
(39.9)
205.7
(299.9)
(188.9)
(283.1)
EBITDA 277.9 311.3 403.5
Used car sales net revenues (446.5) (588.8) (850.5)
Depreciated cost of used car sales (*) 361.2 530.4 760.0
(-) Income tax and social contribution (32.7) (42.7) (63.4)
Working capital variation (24.2) (4.8) 13.3
Cash provided before capex 135.7 205.4 262.9
Used car sales net revenues 446.5 588.8 850.5
Capex of car - renewal (496.0) (643.3) (839.0)
Net capex for renewal (49.5) (54.5) 11.5
Capex – other property and equipment, net (28.0) (32.7) (23.7)
Free cash flow before growth and interest 58.2 118.2 250.7
Capex of car - growth (194.0) (287.0) (221.9)
Change in accounts payable to car suppliers (capex) (25.5) 222.0 (51.0)
Free cash flow before interest (161.3) 53.2 (22.2)
15
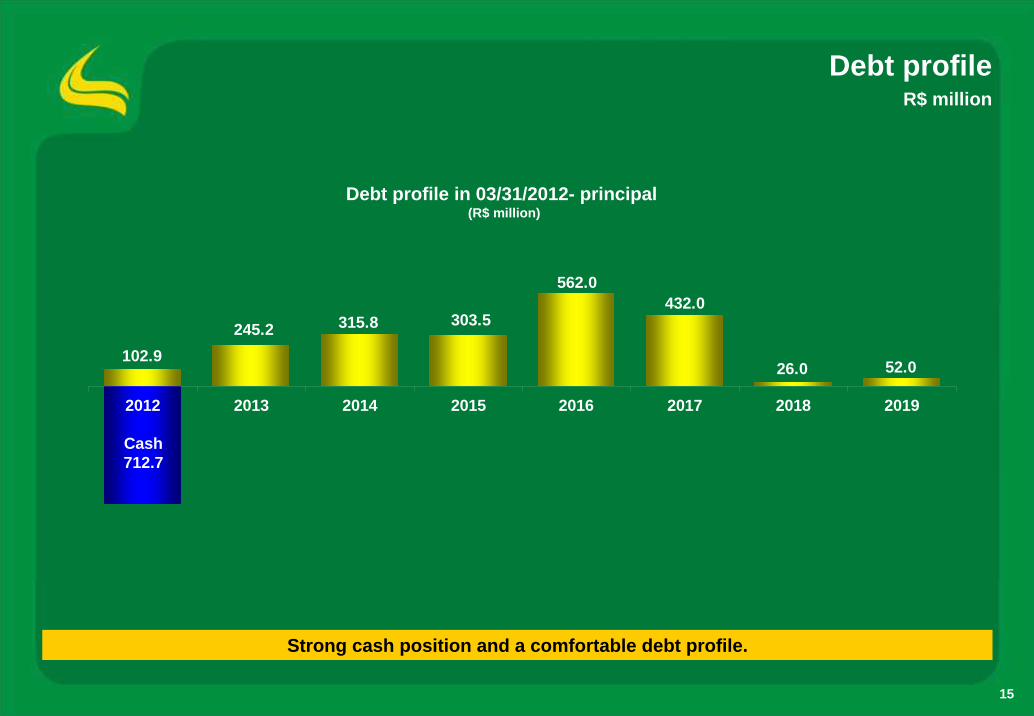
Debt profileR$ million
Strong cash position and a comfortable debt profile.
Debt profile in 03/31/2012- principal (R$ million)
52.026.0
432.0562.0
303.5 315.8 245.2 102.9
2012 2013 2014 2015 2016 2017 2018 2019
Cash712.7

16
Debt – ratiosR$ million
Comfortable debt ratios.
Net debt x Fleet value
END OF PERIOD BALANCE 2005 2006 2007 2008 2009 2010 2011
57% 52%
2.0x
1.4x
5.0x
2.3x
51%
1.7x
1.2x
EBITDA / Net financial expenses 3.3x 4.8x 5.4x 3.8x 4.2x 4.6x
1.5x
4.8x
72%
2.5x
2.0x
1Q12
Net debt / Fleet value 60% 36% 51% 56%
Net debt / EBITDA (*) 1.9x 1.4x 1.9x 1.7x
Net debt / Equity 1.4x 0.7x 1.3x 1.2x
* annualized
Net debt Fleet value
535.8 440.4765.1
1,254.5 1,078.6 1,281.1 1,363.4 1,407.9900.2
1,247.71,492.9
1,752.6 1,907.82,446.7 2,681.7 2,528.7
2005 2006 2007 2008 2009 2010 2011 1Q12annualized
17
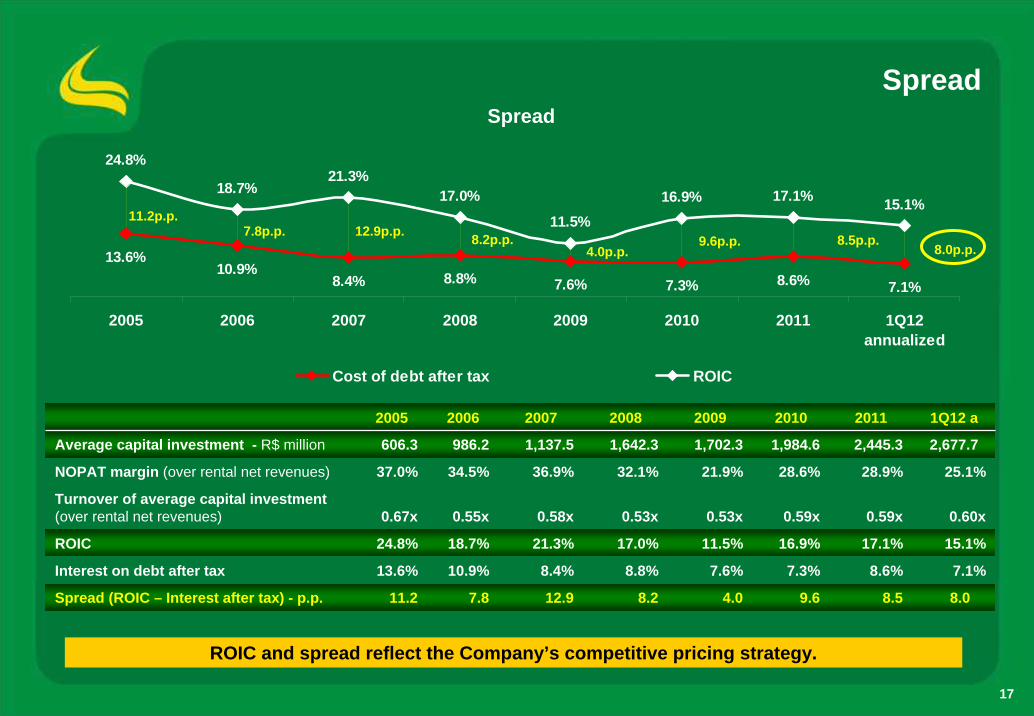
Spread
ROIC and spread reflect the Company’s competitive pricing strategy.
13.6%10.9%
8.4% 8.8% 7.6% 7.3% 8.6%
24.8%
18.7%21.3%
17.0%
11.5%16.9% 17.1% 15.1%
7.1%
2005 2006 2007 2008 2009 2010 2011 1Q12annualized
Cost of debt after tax ROIC
Spread
11.2p.p.7.8p.p. 12.9p.p. 8.2p.p.
4.0p.p.9.6p.p. 8.5p.p.
8.0p.p.
2005 2006 2007 2008 2009 2010 2011 1Q12 a
2,445.3 2,677.7
25.1%
0.60x
15.1%
7.1%
8.0
28.9%
0.59x
17.1%
8.6%
8.5
1,984.6
28.6%
0.59x
16.9%
7.3%
9.6
1,642.3
32.1%
0.53x
17.0%
8.8%
Average capital investment - R$ million 606.3 986.2 1,137.5
8.2
1,702.3
21.9%
0.53x
11.5%
7.6%
4.0
NOPAT margin (over rental net revenues) 37.0% 34.5% 36.9%
Turnover of average capital investment (over rental net revenues) 0.67x 0.55x 0.58x
ROIC 24.8% 18.7% 21.3%
Interest on debt after tax 13.6% 10.9% 8.4%
Spread (ROIC – Interest after tax) - p.p. 11.2 7.8 12.9
18
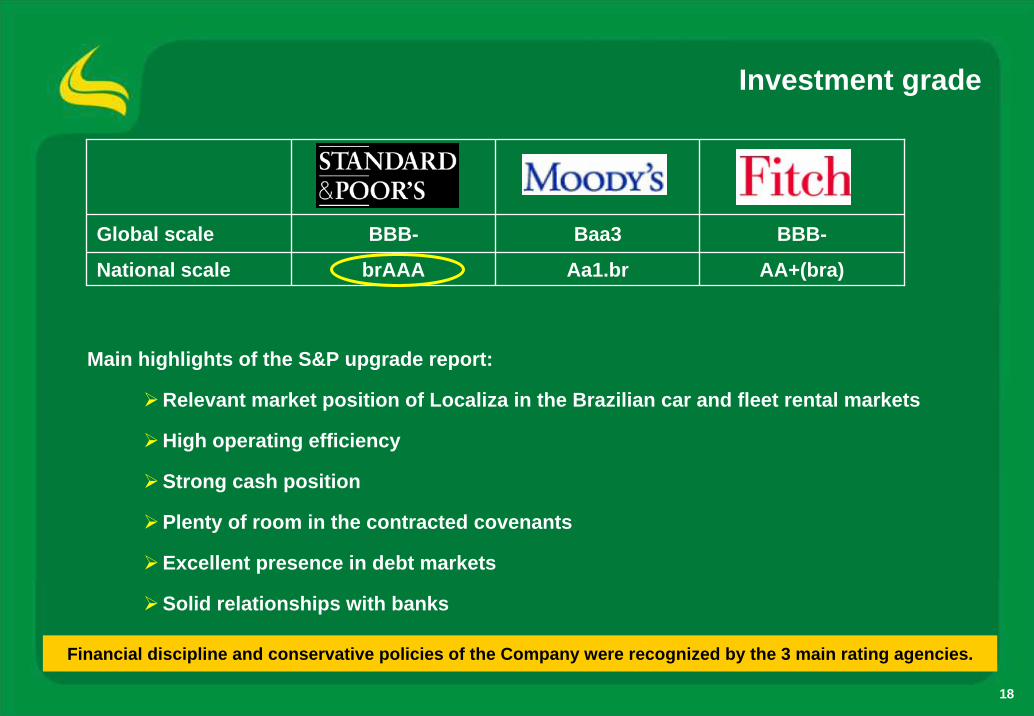
Investment grade
Financial discipline and conservative policies of the Company were recognized by the 3 main rating agencies.
Global scale BBB- Baa3 BBB-
National scale brAAA Aa1.br AA+(bra)
Main highlights of the S&P upgrade report:
Relevant market position of Localiza in the Brazilian car and fleet rental markets
High operating efficiency
Strong cash position
Plenty of room in the contracted covenants
Excellent presence in debt markets
Solid relationships with banks
19
Disclaimer
Thank you!
The material presented is a presentation of general background information about LOCALIZA as of the date of the presentation. It is information in summary form and does not purport to be complete. It is not intended to be relied upon as advice to potential investors. This presentation is strictly confidential and may not be disclosed to any other person. No representation or warranty, express or implied, is made concerning, and no reliance should be placed on, the accuracy, fairness, or completeness of the information presented herein.
This presentation contains statements that are forward-looking within the meaning of Section 27A of the Securities Act of 1933 and Section 21E of the Securities Exchange Act of 1934. Such forward-looking statements are only predictions and are not guarantees of future performance. Investors are cautioned that any such forward-looking statements are and will be, as the case may be, subject to many risks, uncertainties and factors relating to the operations and business environments of LOCALIZA and its subsidiaries that may cause the actual results of the companies to be materially different from any future results expressed or implied in such forward-looking statements.
Although LOCALIZA believes that the expectations and assumptions reflected in the forward-looking statements are reasonable based on information currently available to LOCALIZA’smanagement, LOCALIZA cannot guarantee future results or events. LOCALIZA expressly disclaims a duty to update any of the forward-looking statement.
Securities may not be offered or sold in the United States unless they are registered or exempt from registration under the Securities Act of 1933. Any offering of securities to be made in the United States will be made by means of an offering memorandum that may be obtained from the underwriters. Such offering memorandum will contain, or incorporate by reference, detailed information about LOCALIZA and its business and financial results, as well as its financial statements.
This presentation does not constitute an offer, or invitation, or solicitation of an offer, to subscribe for or purchase any securities. Neither this presentation nor anything contained herein shall form the basis of any contract or commitment whatsoever.
www.localiza.com/irE-mail: [email protected]: +55 31 3247-7024