apresentação 3q11 en
TRANSCRIPT

0
EARNINGS RESULTS
3Q11

1
This presentation contains statements that are forward-looking within the meaning of Section 27A of
the Securities Act of 1933 and Section 21E of the Securities Exchange Act of 1934. Such forward-
looking statements are only predictions and are not guarantees of future performance. Investors
are cautioned that any such forward-looking statements are and will be, as the case may be,
subject to many risks, uncertainties and factors relating to the operations and business environments
of General Shopping and its subsidiaries that may cause the actual results of the companies to be
materially different from any future results expressed or implied in such forward-looking statements.
This material is published solely for informational purposes and is not to be construed as a solicitation
or an offer to buy or sell any securities or related financial instruments and should not be treated as
giving investment advice. It is not targeted to the specific investment objectives, financial situation
or particular needs of any recipient. No representation or warranty, either express or implied, is
provided in relation to the accuracy, completeness or reliability of the information contained
herein. This material should not be regarded by recipients as a substitute for the exercise of their
own judgment.
Any opinions expressed in this material are expressed as of this date and subject to change without
notice and General Shopping is not under the obligation to update or keep current the information
contained herein. General Shopping and the respective affiliates, directors, partners and
employees accept no liability whatsoever for any loss or damage of any kind arising out of the use
of all or any part of this material. You should consult with your own legal, regulatory, tax, business,
investment, financial and accounting advisers to the extent that you deem it necessary, and make
your own investment, hedging and trading decision (including decisions regarding the suitability of
this transaction) based upon your own judgment and advice from such advisers as you deem
necessary and not upon any views expressed in this material.
Disclaimer

2
Sector Overview
Company Overview
Financial Performance
Agenda

3
Sector Overview
4
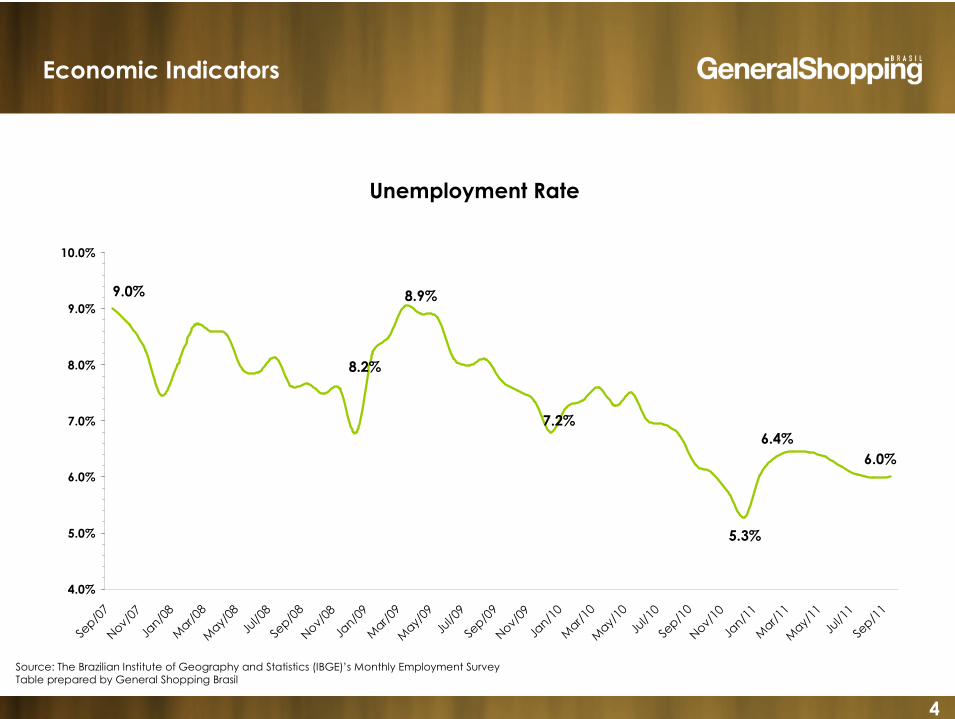
6.4%
5.3%
9.0%
8.2%
8.9%
7.2%
6.0%
4.0%
5.0%
6.0%
7.0%
8.0%
9.0%
10.0%
Sep
/07
Nov/
07Ja
n/08
Mar/
08M
ay/08
Jul/0
8Se
p/0
8N
ov/08
Jan/0
9M
ar/09
May/
09Ju
l/09
Sep
/09
Nov/
09Ja
n/10
Mar/
10M
ay/10
Jul/1
0Se
p/1
0N
ov/10
Jan/1
1M
ar/11
May/
11Ju
l/11
Sep
/11
Source: The Brazilian Institute of Geography and Statistics (IBGE)’s Monthly Employment Survey Table prepared by General Shopping Brasil
Economic Indicators
Unemployment Rate
5
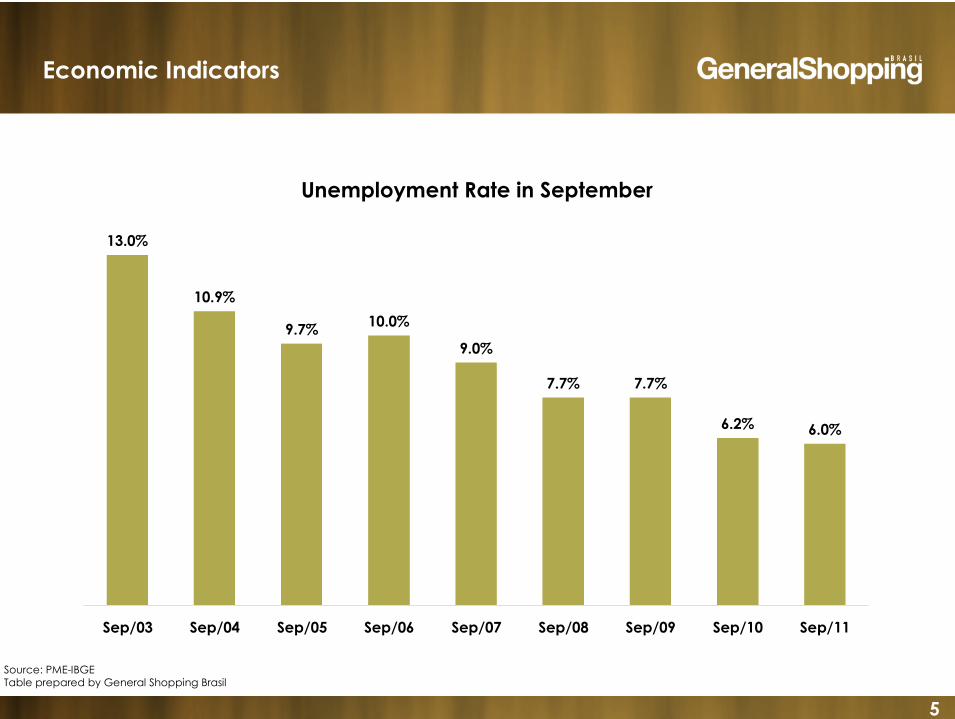
Unemployment Rate in September
13.0%
10.9%
9.7%10.0%
9.0%
7.7% 7.7%
6.2% 6.0%
Sep/03 Sep/04 Sep/05 Sep/06 Sep/07 Sep/08 Sep/09 Sep/10 Sep/11
Source: PME-IBGETable prepared by General Shopping Brasil
Economic Indicators

6
Real Income of the Employee Population¹R$ billion
24.225.7 26.3
27.729.0
31.732.5
35.8 36.4
Sep/03 Sep/04 Sep/05 Sep/06 Sep/07 Sep/08 Sep/09 Sep/10 Sep/11
Source: PME-IBGE; Table prepared by General Shopping Brasil(1)Based on the employed population and average income of the employed population
Economic Indicators
7
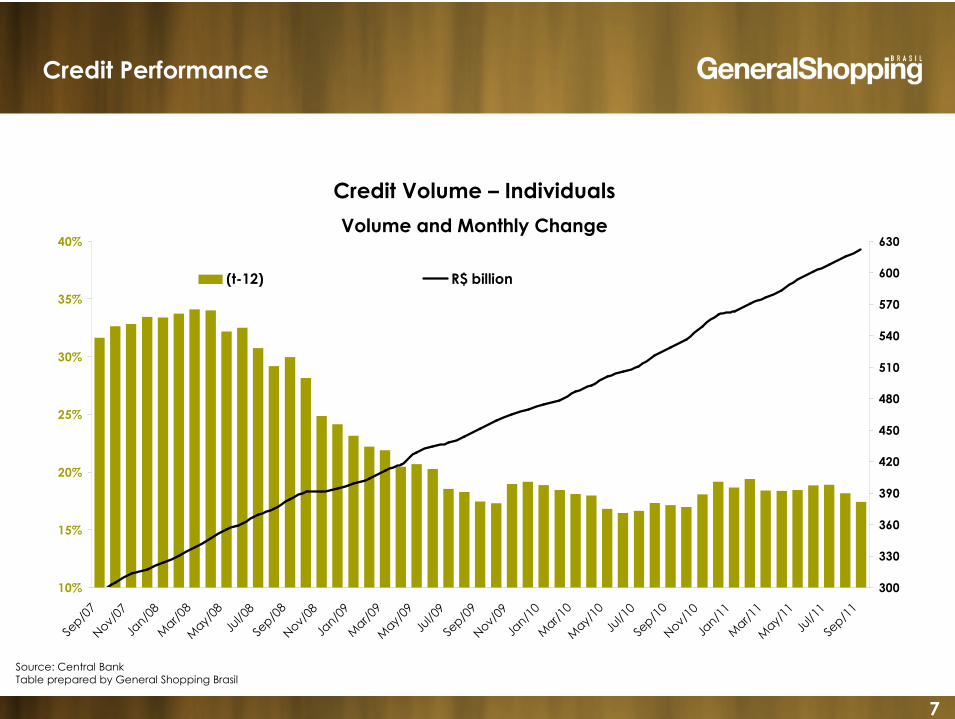
10%
15%
20%
25%
30%
35%
40%
Sep
/07
Nov/
07Ja
n/08
Mar/
08M
ay/08
Jul/0
8Se
p/0
8N
ov/08
Jan/0
9M
ar/09
May/
09Ju
l/09
Sep
/09
Nov/
09Ja
n/10
Mar/
10M
ay/10
Jul/1
0Se
p/1
0N
ov/10
Jan/1
1M
ar/11
May/
11Ju
l/11
Sep
/11
300
330
360
390
420
450
480
510
540
570
600
630
(t-12) R$ billion
Source: Central BankTable prepared by General Shopping Brasil
Credit Performance
Credit Volume – Individuals
Volume and Monthly Change

8
-10%
-5%
0%
5%
10%
15%
20%
25%
30%
35%
Sep
/07
Nov/
07Ja
n/08
Mar/
08M
ay/08
Jul/0
8Se
p/0
8N
ov/08
Jan/0
9M
ar/09
May/
09Ju
l/09
Sep
/09
Nov/
09Ja
n/10
Mar/
10M
ay/10
Jul/1
0Se
p/1
0N
ov/10
Jan/1
1M
ar/11
May/
11Ju
l/11
Sep
/11
30
40
50
60
70
80
90
(t-12) R$ billion
Source: Central Bank
Table prepared by General Shopping Brasil
Credit Performance
Credit Concession – Individuals
Volume and Monthly Change

9
6.0
8.1
7.3
6.87.1
Sep
/07
Nov
Jan/0
8
Mar
May
Jul
Sep
/08
Nov
Jan/0
9
Mar
May
Jul
Sep
/09
Nov
Jan/1
0
Mar
May
Jul
Sep
/10
Nov
Jan/1
1
Mar
May
Jul
Sep
/11
General Individuals
Source: Central BankTable prepared by General Shopping Brasil
Credit Performance
Default Rate
Individuals and General Spread
10
80
85
90
95
100
105
110
115
120
125
130
Sep
/07
Nov
Jan/0
8
Mar
May
Jul
Sep
/08
Nov
Jan/0
9
Mar
May
Jul
Sep
/09
Nov
Jan/1
0
Mar
May
Jul
Sep
/10
Nov
Jan/1
1
Mar
May
Jul
Sep
/11
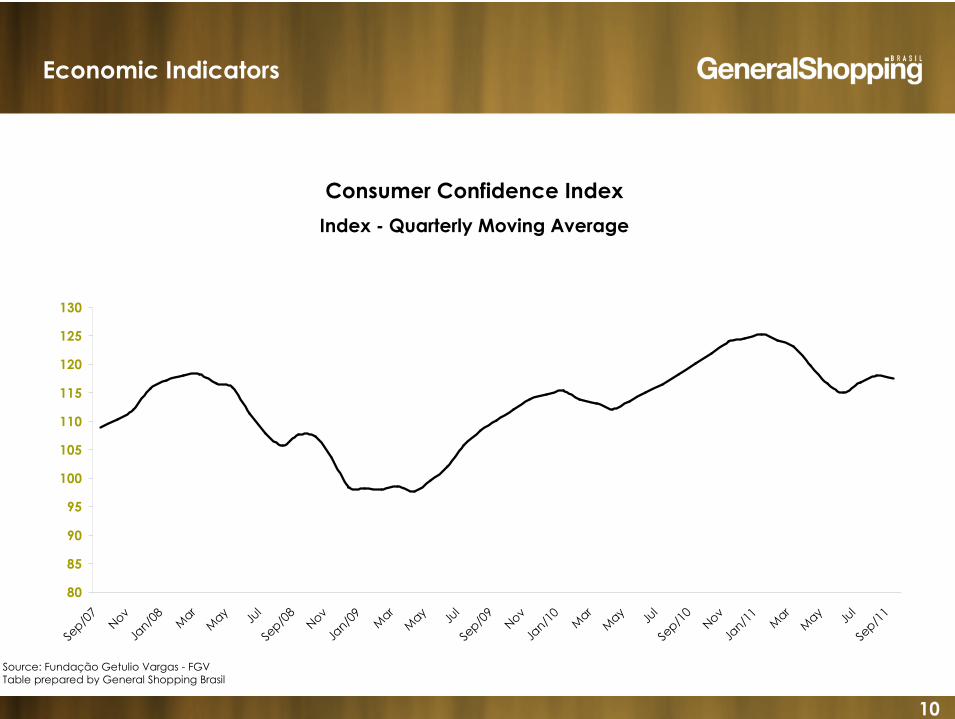
Source: Fundação Getulio Vargas - FGVTable prepared by General Shopping Brasil
Consumer Confidence Index
Index - Quarterly Moving Average
Economic Indicators

11
12.0
5.1
9.3
8.3
Sep
/07
Nov/
07Ja
n/08
Mar/
08M
ay/08
Jul/0
8Se
p/0
8N
ov/08
Jan/0
9M
ar/09
May/
09Ju
l/09
Sep
/09
Nov/
09Ja
n/10
Mar/
10M
ay/10
Jul/1
0Se
p/1
0N
ov/10
Jan/1
1M
ar/11
May/
11Ju
l/11
Sep
/11
Source: PMC-IBGETable prepared by General Shopping Brasil
Retail Performance
Sales Volume - Monthly change (%) – Sep/07 to Sep/11
As compared with same year-ago period
5.3

12
Retail Industry: Monthly Change (VS Same Year-Ago Period) of Sales Volume (Jan/10-Sep/11)
Retail Growth
Source: Brazilian Institute of Geography and Statistics (IBGE)
Total -Retail Books, newspapers, magazines and stationeryOffice supplies and equipment, personal computer
and telecomOther personal and domestic products
Jan/10 10.4 7.0 32.2 6.0
Feb 12.2 10.2 21.0 4.7
Mar 15.7 8.0 35.6 8.1
Apr 9.2 8.7 15.4 5.6
May 10.2 9.7 28.9 2.9
Jun 11.4 4.8 23.2 9.6
Jul 11.1 7.3 19.0 12.2
Aug 10.5 13.5 25.4 11.7
Sep 12.0 9.9 32.4 15.8
Oct 8.7 12.5 10.1 9.9
Nov 9.9 23.6 21.2 11.0
Dec 10.2 26.7 27.1 10.2
Jan/11 8.3 12.5 7.4 4.9
Feb 8.5 14.9 14.8 12.5
Mar 4.0 -1.2 4.2 4.6
Apr 10.2 5.8 -0.8 12.1
May 6.3 8.3 23.2 3.3
Jun 7.1 9.0 34.7 3.2
Jul 7.1 6.8 16.2 2.9
Aug 6.3 5.2 26.3 1.7
Sep 5.3 0.6 7.7 -0.1
0
5
10
15
20
25
30
35
40

13
Source: Brazilian Institute of Geography and Statistics (IBGE)
Retail Industry: Monthly Change (VS Same Year-Ago Period) of Sales Volume (Jan/10-Sep/11)
Retail Growth
Total - Retail Supermarkets and hypermarkets Fabrics. clothing na footwear Furniture and white/durable goodsPharmaceutical, medical, orthopedic
and cosmetics
Jan/10 10.4 10.2 2.3 17.7 10.3
Feb 12.2 11.6 11.2 22.2 14.7
Mar 15.7 15.4 15.7 25.4 14.9
Apr 9.2 5.5 16.7 22.4 11.1
May 10.2 8.2 11.9 19.6 12.1
Jun 11.4 11.9 4.4 17.0 10.3
Jul 11.1 11.0 12.8 12.2 8.1
Aug 10.5 7.2 13.1 16.7 12.5
Sep 12.0 9.7 12.9 14.4 12.0
Oct 8.7 6.7 10.0 15.4 9.3
Nov 9.9 5.6 9.3 20.5 13.4
Dec 10.2 6.2 9.8 18.3 14.1
Jan/11 8.3 4.2 9.8 19.1 12.7
Feb 8.5 2.7 14.2 20.3 10.6
Mar 4.0 1.4 5.7 11.2 5.3
Apr 10.2 10.6 1.5 19.3 10.5
May 6.3 1.9 5.6 20.4 12.0
Jun 7.1 2.7 11.3 16.4 12.8
Jul 7.1 4.6 1.4 21.1 10.4
Aug 6.3 3.9 0.8 16.9 9.5
Sep 5.3 3.5 0.6 16.5 10.6
0
5
10
15
20
25

14
Disclaimer
Company Overview

15
Differentials
� Market-driven company with retail approach� Market-driven company with retail approach
� B and C consumption classes as target market� B and C consumption classes as target market
� Innovative complementary services� Innovative complementary services
� Majority ownership: 85.6% average interest� Majority ownership: 85.6% average interest

16
General Shopping´s Methodology
17
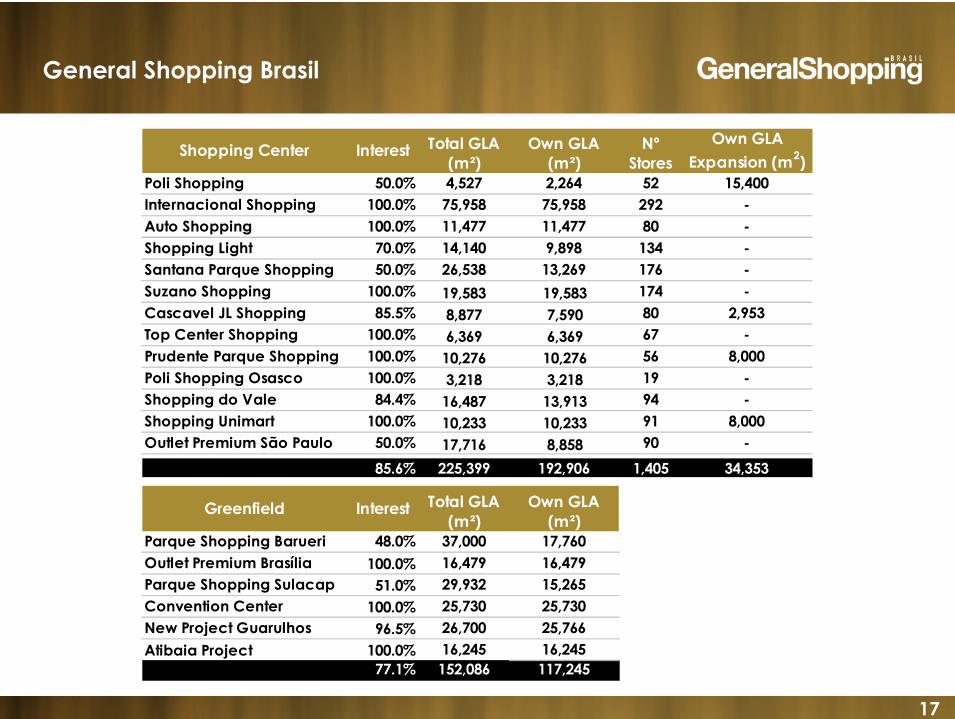
Poli Shopping 50.0% 4,527 2,264 52 15,400
Internacional Shopping 100.0% 75,958 75,958 292 -
Auto Shopping 100.0% 11,477 11,477 80 -
Shopping Light 70.0% 14,140 9,898 134 -
Santana Parque Shopping 50.0% 26,538 13,269 176 -
Suzano Shopping 100.0% 19,583 19,583 174 -
Cascavel JL Shopping 85.5% 8,877 7,590 80 2,953
Top Center Shopping 100.0% 6,369 6,369 67 -
Prudente Parque Shopping 100.0% 10,276 10,276 56 8,000
Poli Shopping Osasco 100.0% 3,218 3,218 19 -
Shopping do Vale 84.4% 16,487 13,913 94 -
Shopping Unimart 100.0% 10,233 10,233 91 8,000
Outlet Premium São Paulo 50.0% 17,716 8,858 90 -
85.6% 225,399 192,906 1,405 34,353
Parque Shopping Barueri 48.0% 37,000 17,760
Outlet Premium Brasília 100.0% 16,479 16,479
Parque Shopping Sulacap 51.0% 29,932 15,265
Convention Center 100.0% 25,730 25,730
New Project Guarulhos 96.5% 26,700 25,766
Atibaia Project 100.0% 16,245 16,245
77.1% 152,086 117,245
Greenfield Interest Total GLA(m²)
Own GLA(m²)
Shopping Center Interest Nº Stores
Total GLA(m²)
Own GLA(m²)
Own GLA
Expansion (m2)
General Shopping Brasil
18
(*) Excludes sales of gas and liquefied petroleum gas
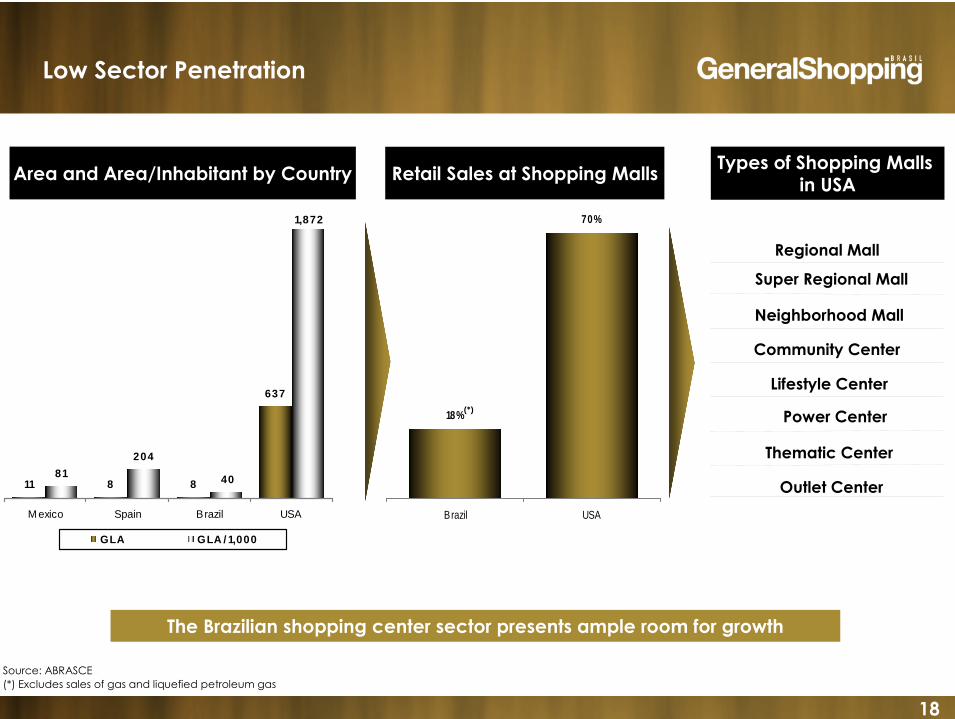
11 8 8
637
81
204
40
1,872
M exico Spain Brazil USA
GLA GLA / 1,000
Neighborhood Mall
Community Center
Lifestyle Center
Thematic Center
Outlet Center
Power Center
Super Regional Mall
Regional Mall
18%
70%
Brazil USA
Retail Sales at Shopping Malls
Source: ABRASCE
(*)
Area and Area/Inhabitant by CountryTypes of Shopping Malls
in USA
The Brazilian shopping center sector presents ample room for growth
Low Sector Penetration

19
11
9
8
7
6
4
GeneralShopping
Brasil
BR Malls SonaeSierra
Iguatemi Multiplan Aliansce
Participation in São Paulo State
Number of Shopping Center Operations Own GLA (m2)
164,635
149,782 148,971 148,744
41,795
168,597
GeneralShopping
Brasil
Iguatemi BR Malls SonaeSierra
Multiplan Aliansce

20
Top Center Shopping
Internacional Shopping Guarulhos
Poli Shopping
Santana Parque Shopping
Poli Shopping Osasco
Suzano Shopping
Shopping Light
Shopping do Vale
Prudente Parque Shopping
Outlet Premium São Paulo Convention Center
Greenfields
Shopping centers in operation
Parque Shopping Sulacap
25,730NA
Total GLA (m2)No. of stores
17,71690
Total GLA (m2)No. of stores
29,932165 (1)
(1)Total GLA (m2)No. of stores
16,48794
Total GLA (m2)No. of stores
Cascavel JL ShoppingUnimart Shopping Campinas
8,87780
Total GLA (m2)No. of stores
10,23391
Total GLA (m2)No. of stores
8
10,27656
Total GLA (m2)No. of stores
14,140134
Total GLA (m2)No. of stores
Auto Shopping
Total GLA (m2)No. of stores
11,47780
75,958292
Total GLA (m2)No. of stores
6,36967
Total GLA (m2)No. of stores
4,52752
Total GLA (m2)No. of stores
3,21819
Total GLA (m2)No. of stores
26,538176
Total GLA (m2)No. of stores
19,583174
Total GLA (m2)No. of stores
Outlet Premium Brasília
16,479 82
(1)Total GLA (m2)No. of stores (1)
(1) Estimated
71.6%72.6%Southeast + South
Retail mktGDPRegion
Source: IBGE 2008
New Project Guarulhos
26,700 200
(1)Total GLA (m2)No. of stores (1)
Parque Shopping Barueri
37,000 200
(1)Total GLA (m2)No. of stores (1)
(1)
Atibaia Project
16,245(1)
NATotal GLA (m2)No. of stores
Geographic Distribution

21
412,339
77,48511,477
14,14013,120
26,5388,877
10,2766,166 3,218
16,48710,2336,463
3,000
17,716203
37,0008,000
16,4798,000
15,400 3,454
29,932
25,730
26,700
16,245
Growth : 432
%
Oct06
Jul07
Jul09
Poli and InternacionalShopping
ShoppingLight
SantanaParque
Shopping
PrudenteParque
Shopping
PoliShopping Osasco
UnimartShopping
InternacionalShopping Expansion
Retrofit Top CenterSão Paulo
UnimartShopping Expansion
PrudenteParque
Shopping Expansion
Convention PowerCenter
ProjectAtibaia
Cascavel JL Shopping
Auto Shopping
SuzanoShopping
Cascavel JL Shopping
Top Center Shopping São Paulo
Shoppingdo Vale
SuzanoShopping Expansion
Outlet Premium São Paulo
ParqueShopping Barueri
Outlet Premium Brasília
PoliShopping Expansion
ParqueShopping Sulacap
New Project
Guarulhos
TOTALGLA
Total GLA Evolution (m 2)
Greenfields
Aquisitions
Expansions
Portfolio

22
34.0%
12.8%
31.6%
21.6%
Diversified Growth Strategy
Own GLA (1)
Concluded Greenfields
AcquisitionsExpansions
Greenfields under Development
Consolidation
� Shopping center acquisitions
Greenfields
� Concept and development of new shopping centers
Expansions
� Interest stake increase in assets� GLA expansion of the original portfolio� Implementation of mixed-use projects
− Synergies + Profitability
Turnaround
� Remodeling and retrofit of tenant mix� Innovation in complementary services
(1) Considering current shopping centers, expansions and announced greenfields.

23
Unimart Shopping Campinas – Lifestyle Case
Ongoing Development (November 2011)
Before Completed

24
Greenfield – Parque Shopping Barueri
Trocar foto pela do e-mail
Construction in November 2011
Opening in November 2011
� Tenanted: more than 95% of GLA
25
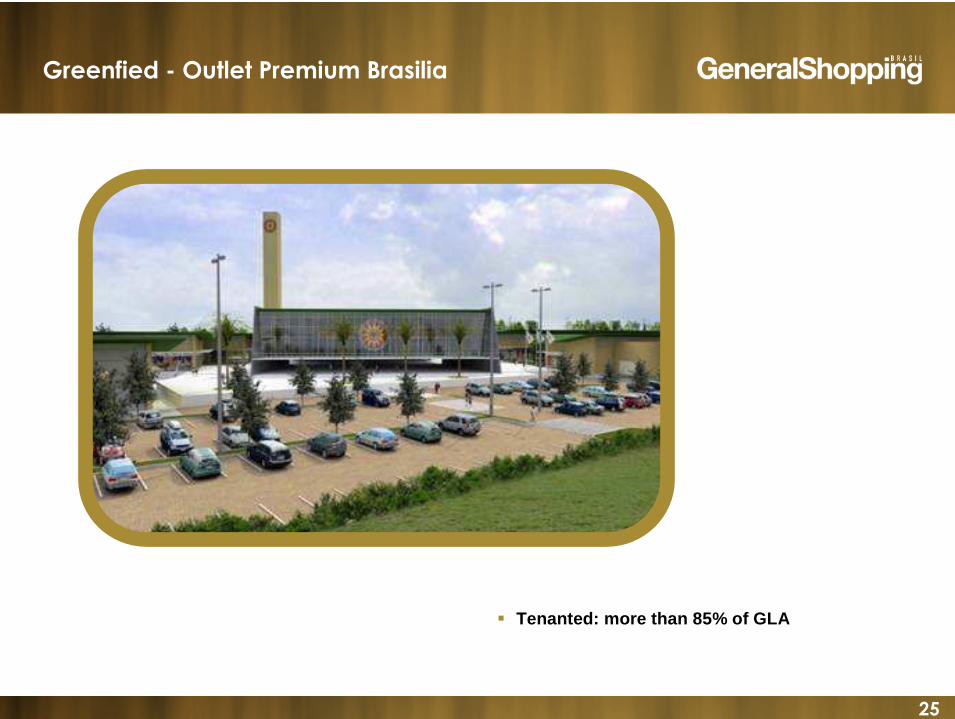
Greenfied - Outlet Premium Brasilia
� Tenanted: more than 85% of GLA

26
Greenfield – Parque Shopping Sulacap

27
Greenfield – New Project Guarulhos

28
Greenfield –Project Atibaia

29
Increasing Complementary Services Activities
����
����
����
����
����
����
����
����
����
����
����
����*
����
����
����
����
����
����
����
����
����
����
����
����
����
����
����
����
����
����
����
����
����
����
����
����
����
Atlas
Energy
Wass
I Park
GSB Adm
ASG Adm
Stake Held
100%
100%
100%
100%
100%
Services currently provided to the mall���� Potential services / currently being implemented����
����
����
���� ����
Management Parking Water Energy
����* Partial
► Responsible for planning the energy supply and leasing of the equipment for its transmission and distribution
► Engaged in water supply planning and its treatment and distribution
► Controls and manages parking lots
► Manages operations of shopping centers
► Manages the operations of Auto Shopping
���� ��������
ISG
Auto
Poli
Light
Santana
Cascavel
PrudenteParque
Poli ShoppingOsasco
Top Center
Do Vale
Unimart
Suzano
Outlet Premium São Paulo
����
���� ����
����

30
R$ 11.89*45.18%*
58,338*-5.9%*
0
20
40
60
80
100
120
140
160
180
Jun-
10
Jul-1
0
Aug
-10
Sep
-10
Oct
-10
Nov
-10
Dec
-10
Jan-
11
Feb
-11
Mar
-11
Apr
-11
May
-11
Jun-
11
Jul-1
1
Aug
-11
Sep
-11
Oct
-11
GSHP3 Ibovespa
(*) In NOV 10, 2011
Until SEP 30, 2011: GSHP3 = 22.1%Ibovespa = -14.1%
Stock Performance
Stock Performance(Basis 100 – JUN 30, 2010)

31
GSHP3Volume (R$ thousand)
Liquidity
Hiring of new
Market Maker
XP Investimentos13,164
278,611
64,74659,84042,790
66,36565,52791,672
17,9716,3944,23113,29422,902
64,685
102,614
574 568 8091,886
6,263
3,911 3,236 3,077
12,625
5,9454,5455,254
1,105712
1Q08 2Q08 3Q08 4Q08 1Q09 2Q09 3Q09 4Q09 1Q10 2Q10 3Q10 4Q10 1Q11 2Q11 3Q11
Trading Volume Number of Trades
150,268

32
Shareholders
Market-making activities (through broker XP Investimentos) since October/10
59.4%
40.6%
Free float Controlling shareholder
Listed since July 2007
(*) Position as of NOV 03, 2011.
Nr. Shares Type of investor(*)
Controllingshareholder
30,000,000 -
58.1% - Brazilian
37.7% - Foreign
4.2% - Individual
Total 50,480,600 -
Free float 20,480,600
33Financial PerformanceFinancial Performance

34
6.8
8.231.4
36.1
27.924.6
3Q10 3Q11
Rent Services
15.0%
20.9%
13.4%
TOTAL GROSS REVENUE
Gross Revenue – R$ million
SERVICES REVENUE BREAKDOWN - 3Q11
14.6%
4.3%3.6%
77.5%
Parking Energy Water Management
RENTAL REVENUE BREAKDOWN - 3Q11
10.8%
3.6%7.5%
3.9%
74.2%
Minimum Rent Percentage on Sales
Key Money Advertising
Straight-lining Revenue

35
19.3
22.490.6
103.9
81.571.3
9M10 9M11
Rent Services
14.7%
16.5%
14.3%
TOTAL GROSS REVENUE
Gross Revenue – R$ million
RENTAL REVENUE BREAKDOWN - 9M11
10.4%
3.8%6.9%
4.2%
74.7%
Minimum Rent Percentage on Sales
Key Money Advertising
Straight-lining Revenue
SERVICES REVENUE BREAKDOWN - 9M11
13.9%
4.9% 4.0%
77.2%
Parking Energy Water Management
36
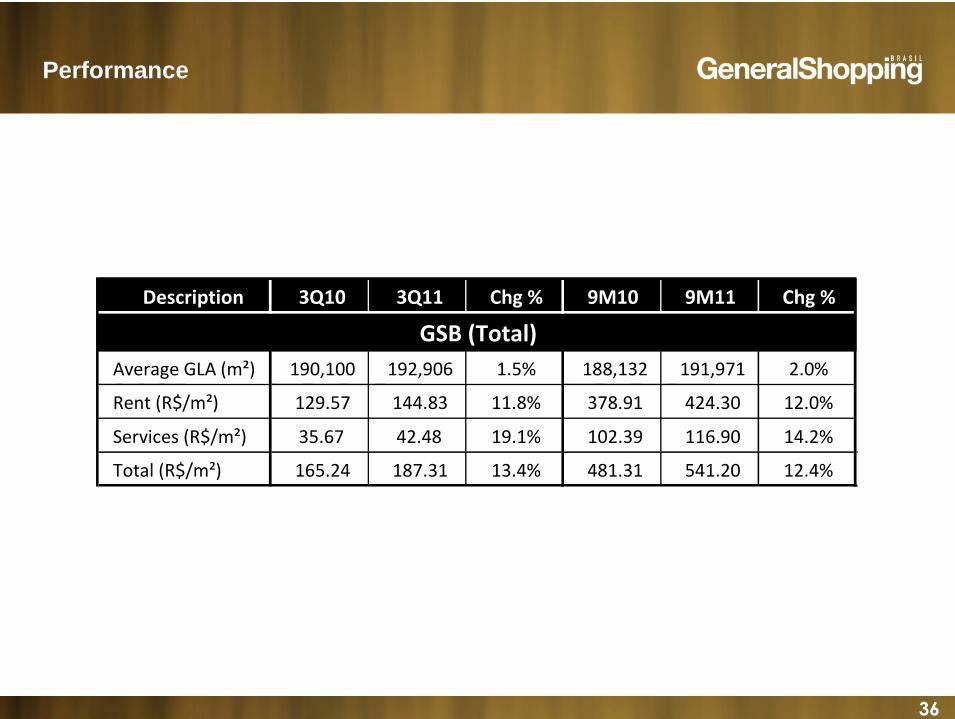
Performance
Description 3Q10 3Q11 Chg % 9M10 9M11 Chg %
GSB (Total)
Average GLA (m²) 190,100 192,906 1.5% 188,132 191,971 2.0%
Rent (R$/m²) 129.57 144.83 11.8% 378.91 424.30 12.0%
Services (R$/m²) 35.67 42.48 19.1% 102.39 116.90 14.2%
Total (R$/m²) 165.24 187.31 13.4% 481.31 541.20 12.4%

37
Occupancy Rate
Occupancy Rate (*)
96.6%
96.2%
3Q10 3Q11
(*) except for Auto Shopping
38
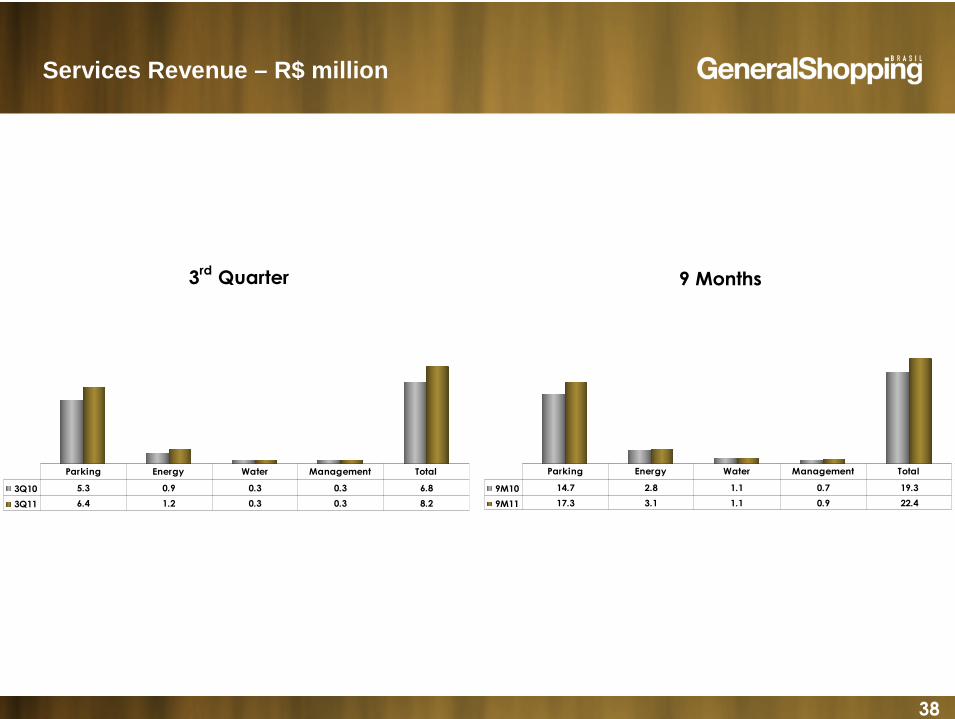
3rd Quarter
3Q10 5.3 0.9 0.3 0.3 6.8
3Q11 6.4 1.2 0.3 0.3 8.2
Parking Energy Water Management Total
9 Months
9M10 14.7 2.8 1.1 0.7 19.3
9M11 17.3 3.1 1.1 0.9 22.4
Parking Energy Water Management Total
Services Revenue – R$ million

39
Adjusted FFO
-44.2
5.8
3Q10 3Q11
Adjusted Net Income
-46.9
3.5
3Q10 3Q11
EBITDA Adjusted and Margin
20.3
25.1
74.4%70.3%
3Q10 3Q11
NOI Consolidated and Margin
24.7
29.8
88.1%85.5%
3Q10 3Q11
20.4% 23.7%
Performance Indicators – R$ million

40
Adjusted FFO
-24.0
10.1
9M10 9M11
Adjusted Net Income
-32.0
3.1
9M10 9M11
EBITDA Adjusted and Margin
58.569.2
71.4%70.4%
9M10 9M11
NOI Consolidated and Margin
71.685.4
88.1%86.1%
9M10 9M11
19.3% 18.3%
Performance Indicators – R$ million

41
Amortization Schedule(R$ million)
-
280.9
458.7
8.5 3.310.933.439.334.129.625.421.818.9
2011 2012 2013 2014 2015 2016 2017 2018 2019 2020 Perpetual
Bonds
Cash Perpetual Bonds CCI Banks
Indebtedness Breakdown
TR23.3%
USD67.1%
IPCA8.9%
FIXED0.7%
Cash X Debt
660.2
280.9
683.9
Cash(1) Debt(2) Pro formaDebt(3)
2011
Cash X Debt (R$ million)
(1) Cash: SEP 30, 2011
(2) Debt: Dolar Rate SEP 30, 2011 = R$ 1,8544
(3) Pro forma Debt: Dolar Rate NOV 10, 2011 = R$ 1,7610
-23.7
2011 2012 2013 2014 2015 2016 2017 2018 2019 2020Perpetual
BondsTotal %
CCI 3.4 18.9 21.8 25.4 29.6 34.1 39.3 33.4 10.9 3.3 - 220.1 32.2%
Banks 5.1 - - - - - - - - - - 5.1 0.7%
Perpetual Bonds - - - - - - - - - - 458.7 458.7 67.1%
Total 8.5 18.9 21.8 25.4 29.6 34.1 39.3 33.4 10.9 3.3 458.7 683.9 100.0%
Amortization Schedule

42
GSB INVESTOR RELATIONS
Alessandro Poli VeroneziInvestor Relations Officer
Marcio SniokaInvestor Relations Manager
55 11 3159-5100
www.generalshopping.com.br
Contacts