apresentação do powerpoint -...
TRANSCRIPT
Product Sustainability I’m greenTM polyethylene
Beatriz Luz Product Sustainability May 2014
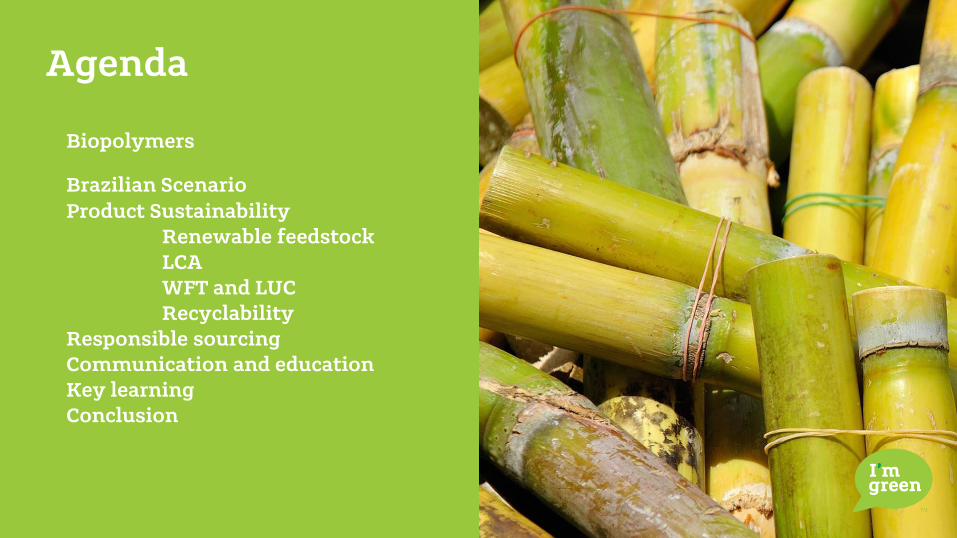
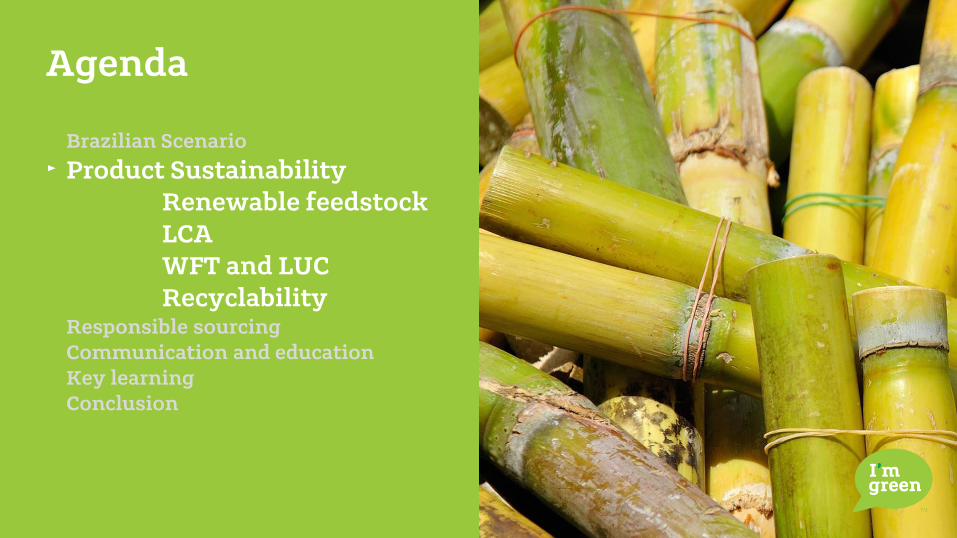
Agenda
Biopolymers
Brazilian Scenario
Product Sustainability
Renewable feedstock
LCA
WFT and LUC
Recyclability
Responsible sourcing
Communication and education
Key learning
Conclusion
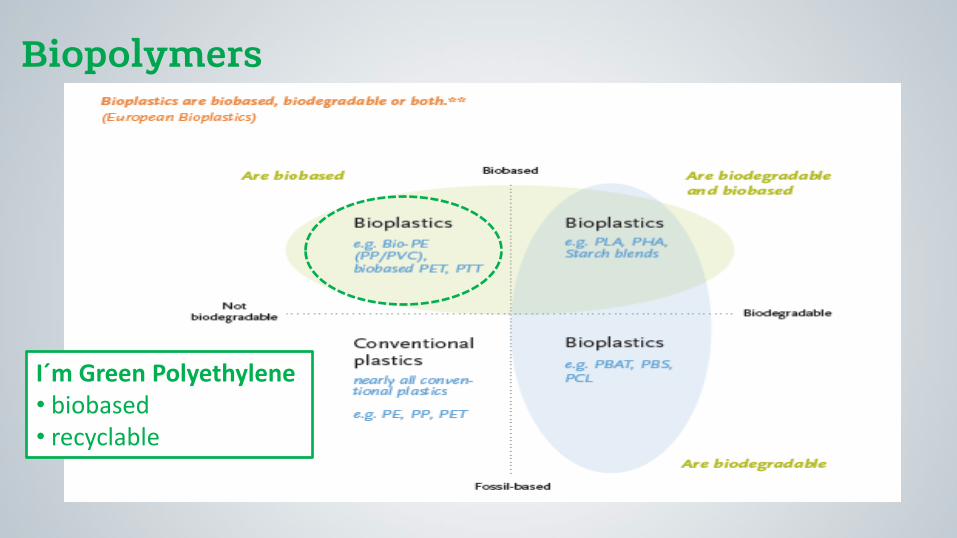
Biopolymers
I´m Green Polyethylene • biobased • recyclable
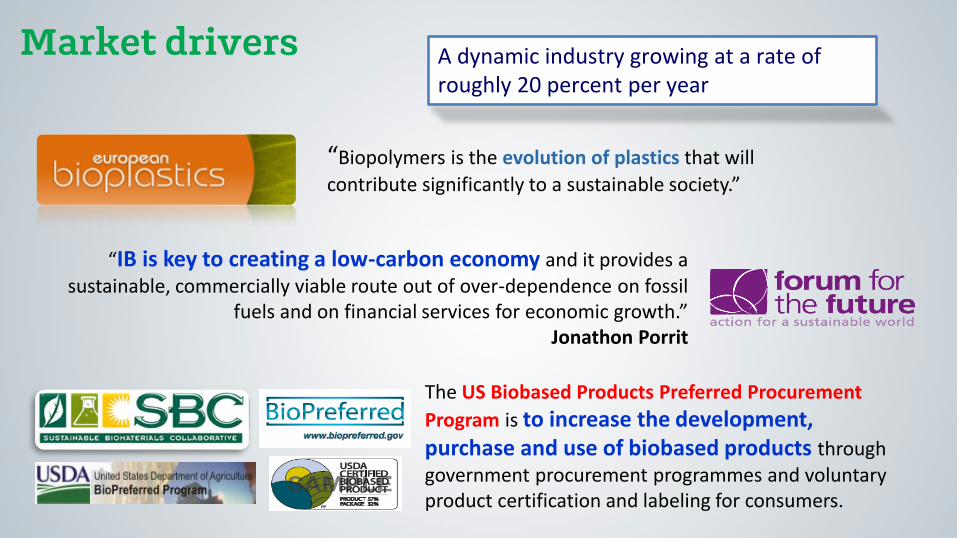
“IB is key to creating a low-carbon economy and it provides a sustainable, commercially viable route out of over-dependence on fossil
fuels and on financial services for economic growth.” Jonathon Porrit
Market drivers
The US Biobased Products Preferred Procurement
Program is to increase the development, purchase and use of biobased products through government procurement programmes and voluntary product certification and labeling for consumers.
“Biopolymers is the evolution of plastics that will
contribute significantly to a sustainable society.”
A dynamic industry growing at a rate of roughly 20 percent per year
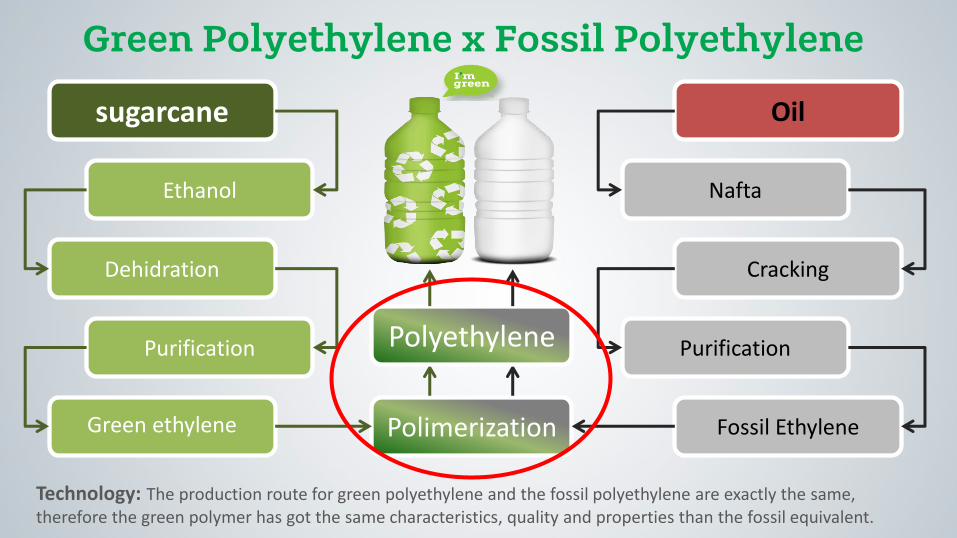
Green Polyethylene x Fossil Polyethylene
Ethanol
Dehidration
Purification
Green ethylene
Nafta
Cracking
Purification
Fossil Ethylene Polimerization
sugarcane Oil
Polyethylene
Technology: The production route for green polyethylene and the fossil polyethylene are exactly the same, therefore the green polymer has got the same characteristics, quality and properties than the fossil equivalent.

How do we define product sustainability?
Eco-design, design for recycling, RecyClass, circular economy, new business models ...

Agenda
Brazilian Scenario Product Sustainability
Renewable feedstock
LCA
WFT and LUC
Recyclability
Responsible sourcing
Communication and education
Key learning
Conclusion
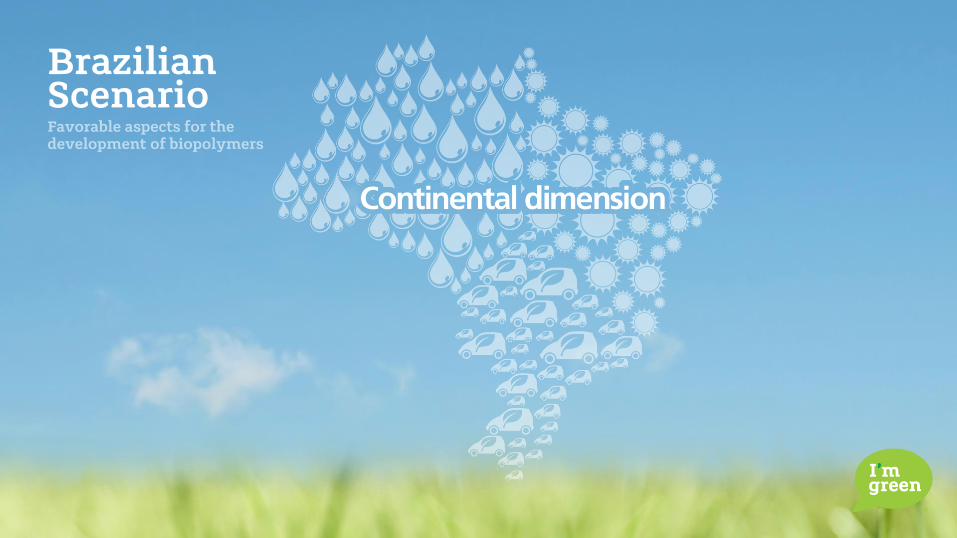
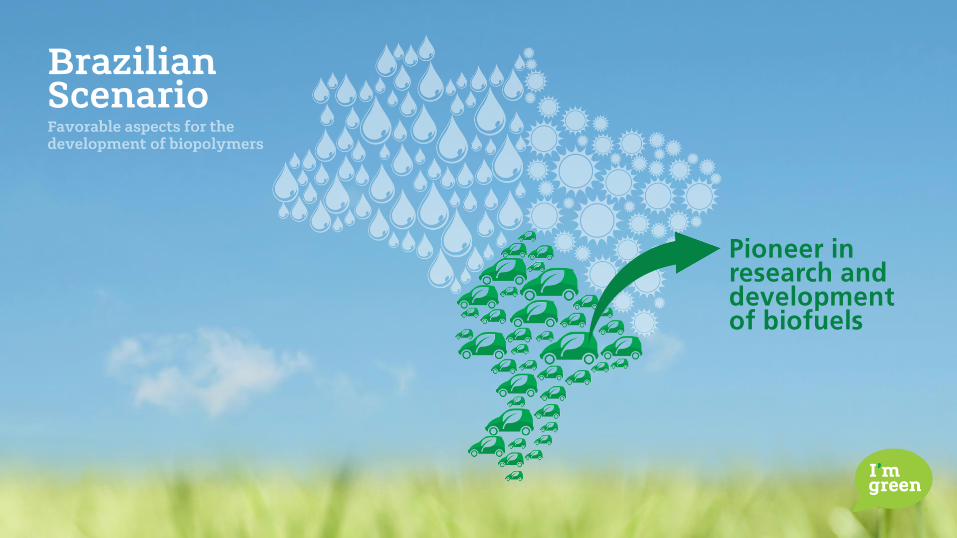
Brazilian Scenario Favorable aspects for the development of biopolymers
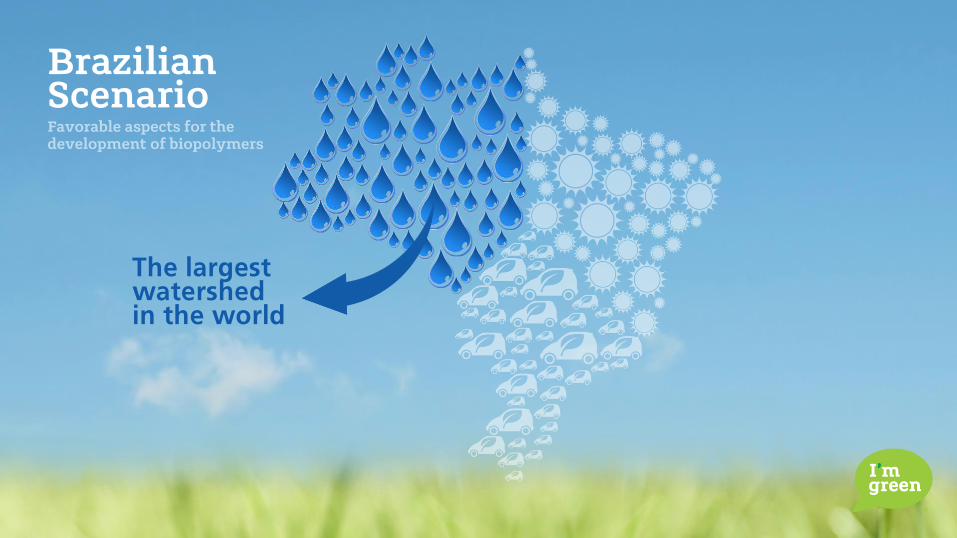
Brazilian Scenario Favorable aspects for the development of biopolymers
The largest watershed in the world
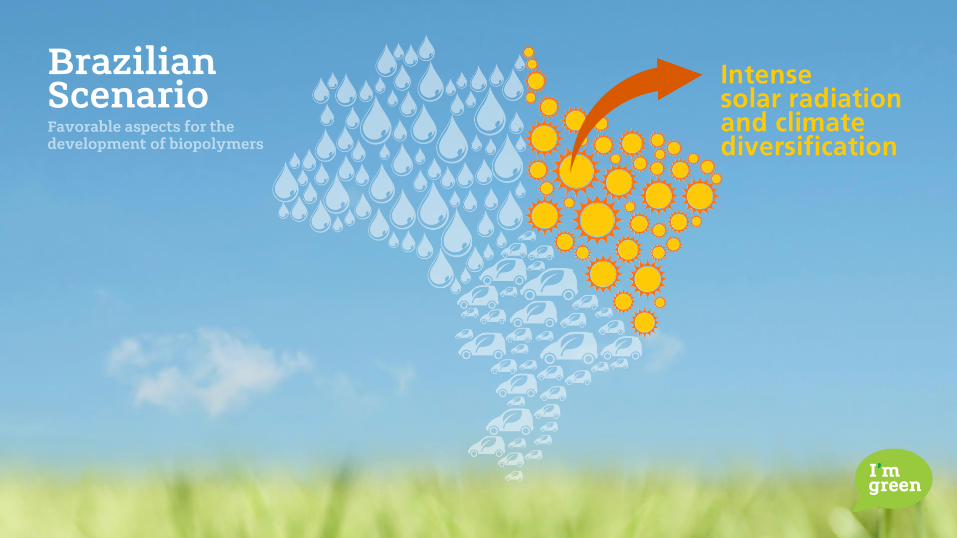
Intense solar radiation and climate diversification
Brazilian Scenario Favorable aspects for the development of biopolymers
Brazilian Scenario Favorable aspects for the development of biopolymers
Pioneer in research and development of biofuels
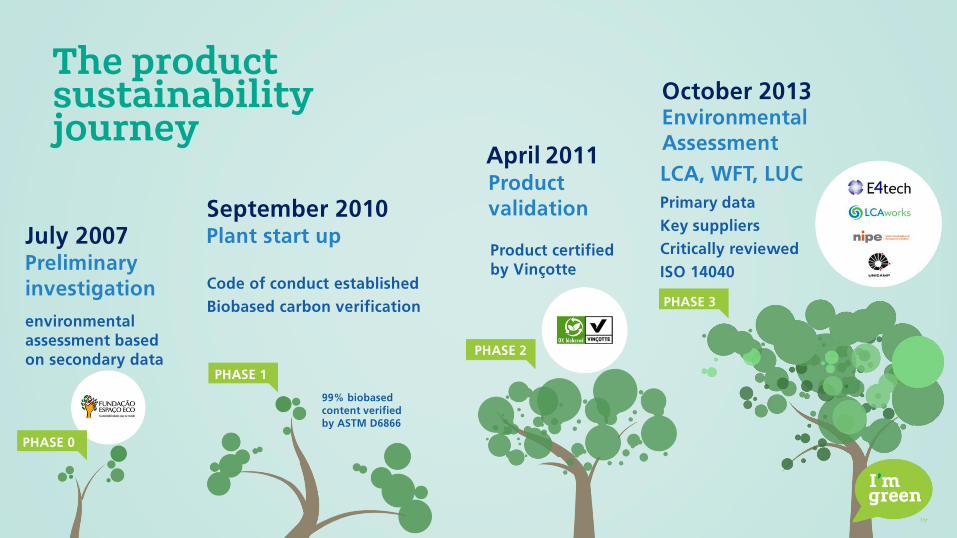
The product sustainability journey
July 2007 Preliminary
investigation
environmental
assessment based on secondary data
September 2010 Plant start up
99% biobased content verified by ASTM D6866
April 2011
Product certified by Vinçotte
October 2013
LCA, WFT, LUC
Primary data
Key suppliers
Critically reviewed
ISO 14040
PHASE 1
PHASE 0
PHASE 2
PHASE 3
Code of conduct established
Biobased carbon verification
Product
validation
Environmental
Assessment
Agenda
Brazilian Scenario
Product Sustainability
Renewable feedstock
LCA
WFT and LUC
Recyclability Responsible sourcing
Communication and education
Key learning
Conclusion
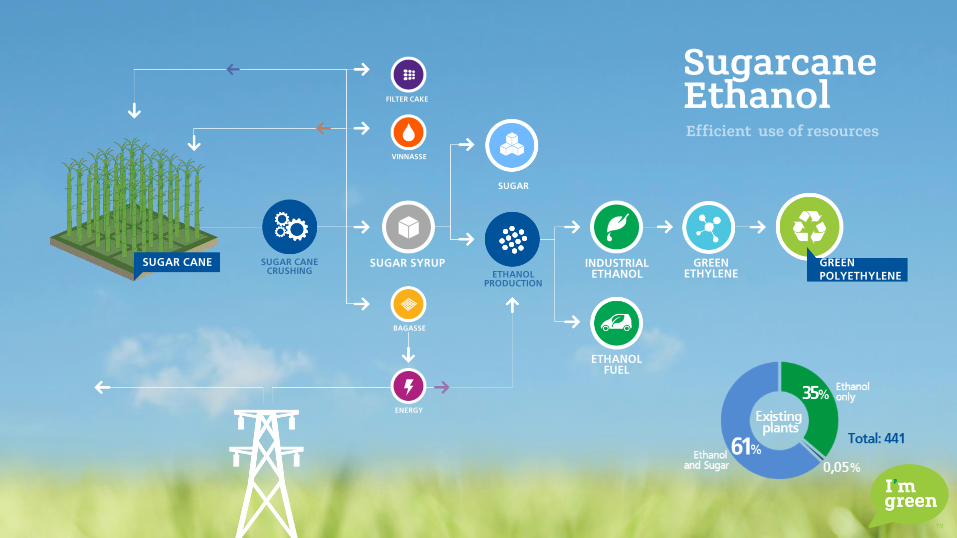
SUGAR CANE SUGAR CANE CRUSHING
SUGAR SYRUP ETHANOL
PRODUCTION
BAGASSE
VINNASSE
FILTER CAKE
ETHANOL FUEL
INDUSTRIAL ETHANOL
GREEN ETHYLENE
GREEN
POLYETHYLENE
Efficient use of resources
Sugarcane Ethanol
SUGAR
ENERGY
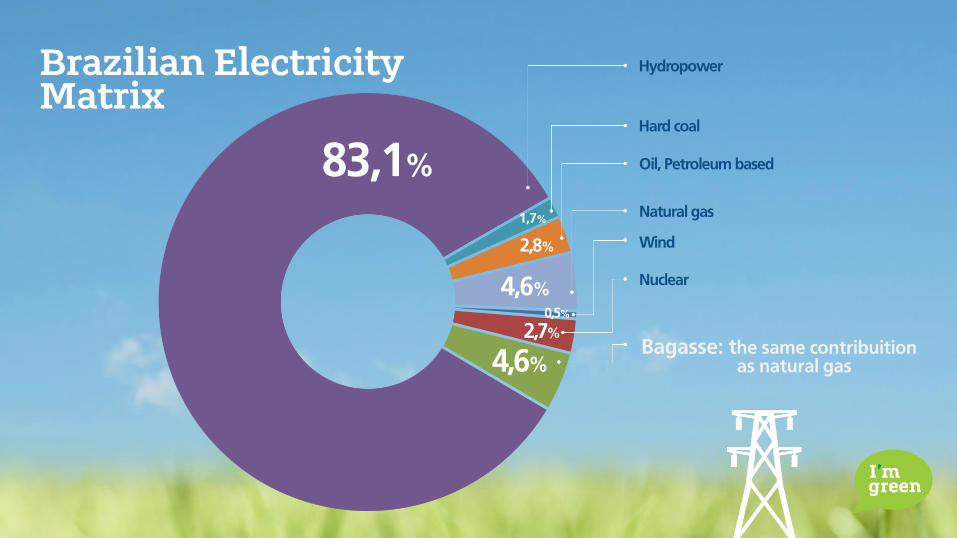
Brazilian Electricity Matrix
Hydropower
Hard coal
Oil, Petroleum based
Natural gas
Wind
Nuclear
Bagasse: the same contribuition as natural gas
83,1%
4,6%
2,7%
0,5%
4,6%
2,8%
1,7%
83,1%
2,7%
0,5%
4,6%
2,8%
1,7%
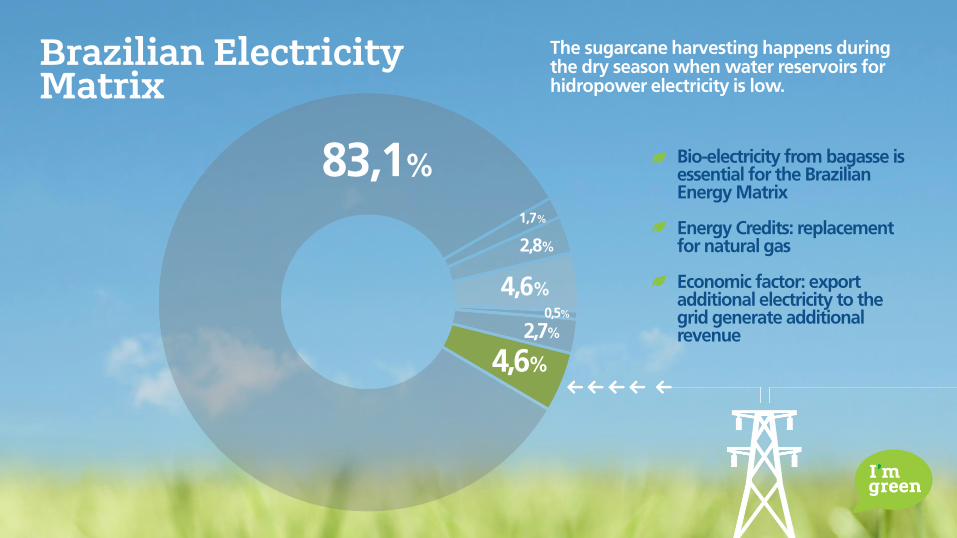
Bio-electricity from bagasse is essential for the Brazilian Energy Matrix Energy Credits: replacement for natural gas Economic factor: export additional electricity to the grid generate additional revenue
Brazilian Electricity Matrix
4,6%
The sugarcane harvesting happens during the dry season when water reservoirs for hidropower electricity is low.
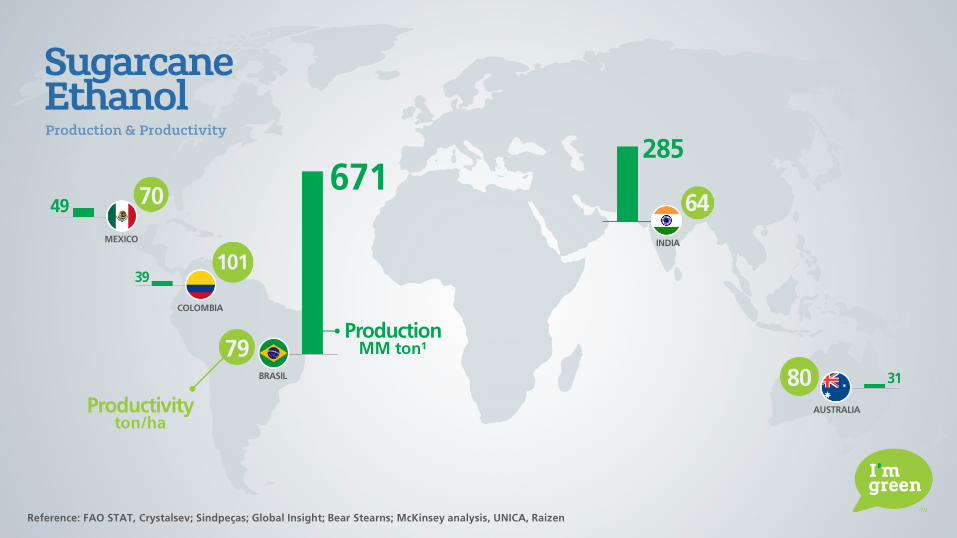
49 70
101 39
79
671 285
64
80 31
AUSTRALIA
INDIA
BRASIL
COLOMBIA
MEXICO
Productivity ton/ha
Production MM ton¹
Sugarcane Ethanol Production & Productivity
Reference: FAO STAT, Crystalsev; Sindpeças; Global Insight; Bear Stearns; McKinsey analysis, UNICA, Raizen
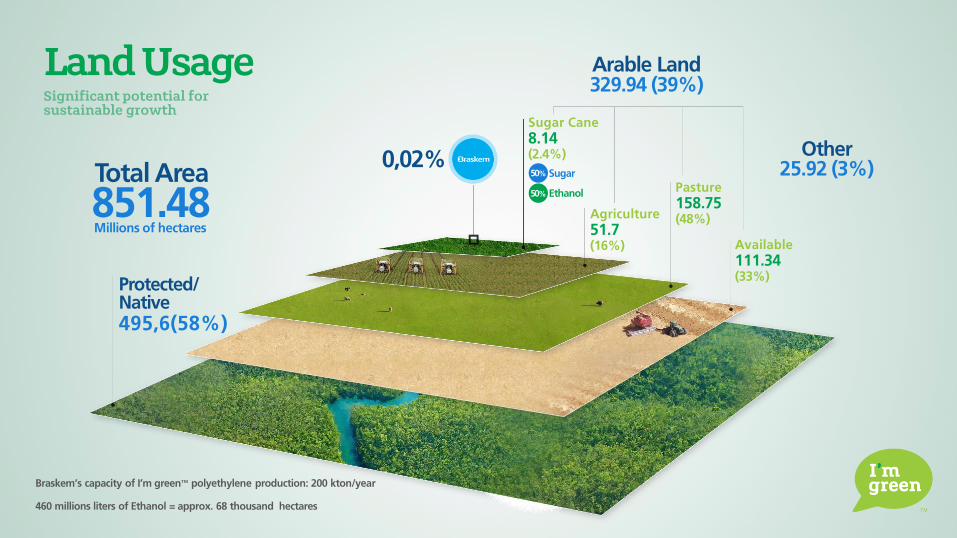
Total Area
851.48 Millions of hectares
Braskem’s capacity of I’m green™ polyethylene production: 200 kton/year 460 millions liters of Ethanol = approx. 68 thousand hectares
Protected/ Native 495,6(58%)
Available
111.34 (33%)
Pasture
158.75 (48%) Agriculture
51.7 (16%)
Sugar Cane
8.14 (2.4%)
Arable Land 329.94 (39%)
Other 25.92 (3%)
Land Usage Significant potential for sustainable growth
0,02% 50%
50%
Sugar
Ethanol
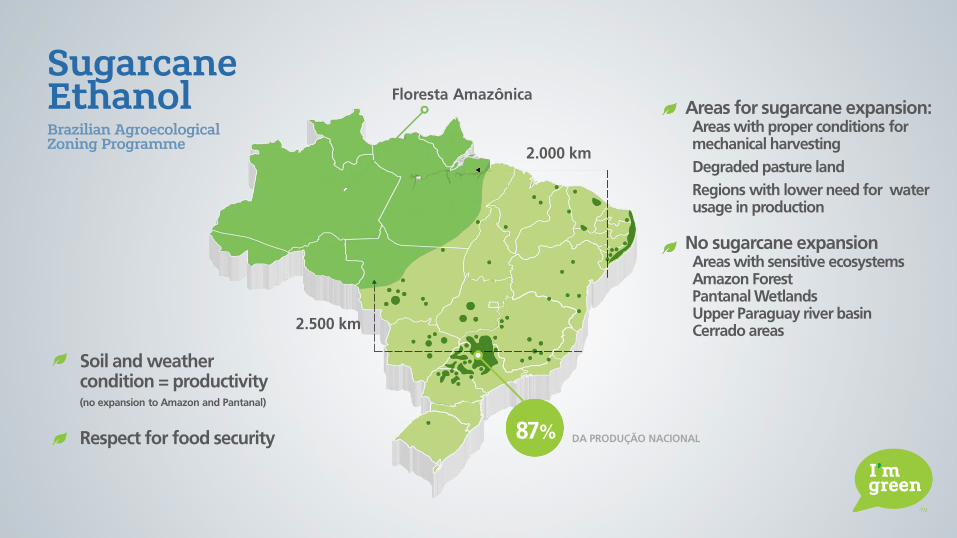
Sugarcane Ethanol Brazilian Agroecological Zoning Programme
87% DA PRODUÇÃO NACIONAL
Floresta Amazônica
2.000 km
2.500 km
Areas for sugarcane expansion: Areas with proper conditions for mechanical harvesting Degraded pasture land Regions with lower need for water usage in production
No sugarcane expansion Areas with sensitive ecosystems Amazon Forest Pantanal Wetlands Upper Paraguay river basin Cerrado areas
Soil and weather condition = productivity (no expansion to Amazon and Pantanal)
Respect for food security
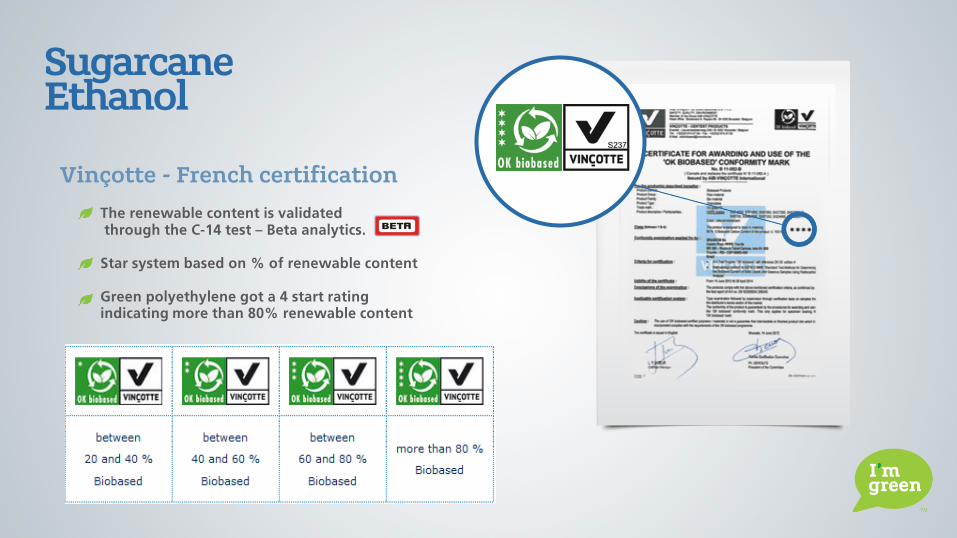
Sugarcane Ethanol
The renewable content is validated through the C-14 test – Beta analytics. Star system based on % of renewable content Green polyethylene got a 4 start rating indicating more than 80% renewable content
Vinçotte - French certification
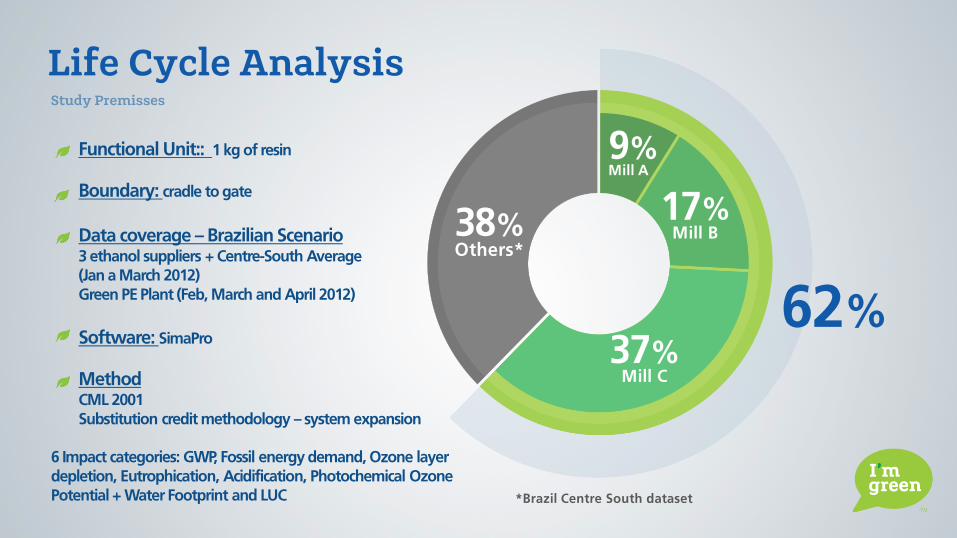
Life Cycle Analysis
62%
38% Others*
9% Mill A
17% Mill B
37% Mill C
Study Premisses
*Brazil Centre South dataset
Functional Unit:: 1 kg of resin
Boundary: cradle to gate
Data coverage – Brazilian Scenario 3 ethanol suppliers + Centre-South Average (Jan a March 2012)
Green PE Plant (Feb, March and April 2012)
Software: SimaPro
Method CML 2001 Substitution credit methodology – system expansion
6 Impact categories: GWP, Fossil energy demand, Ozone layer
depletion, Eutrophication, Acidification, Photochemical Ozone Potential + Water Footprint and LUC
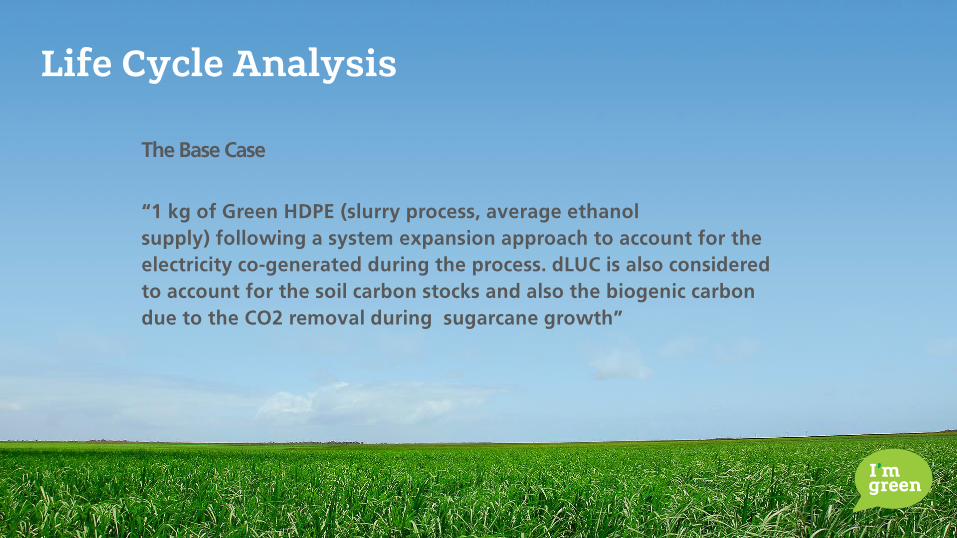
Life Cycle Analysis
The Base Case
“1 kg of Green HDPE (slurry process, average ethanol
supply) following a system expansion approach to account for the
electricity co-generated during the process. dLUC is also considered
to account for the soil carbon stocks and also the biogenic carbon
due to the CO2 removal during sugarcane growth”
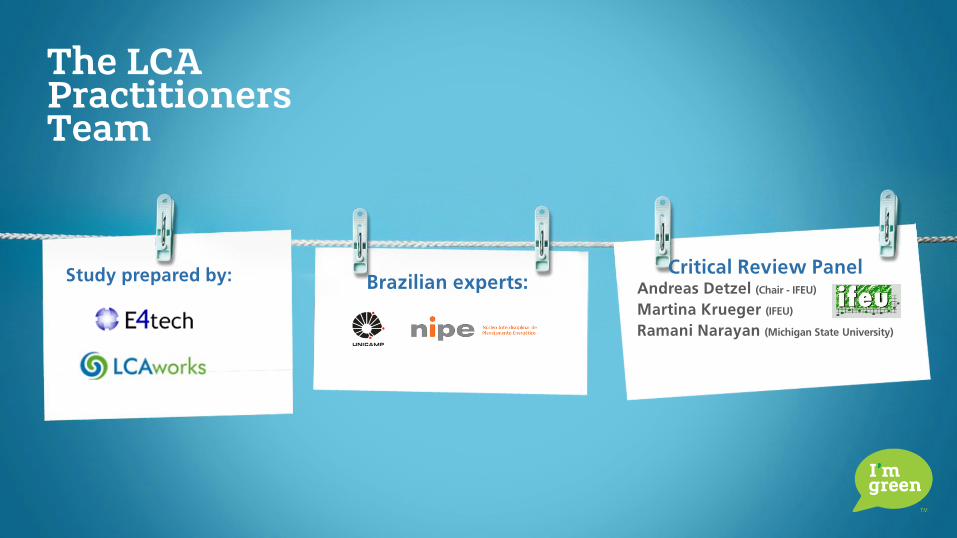
Study prepared by: Brazilian experts: Critical Review Panel
Andreas Detzel (Chair - IFEU)
Martina Krueger (IFEU)
Ramani Narayan (Michigan State University)
The LCA Practitioners Team
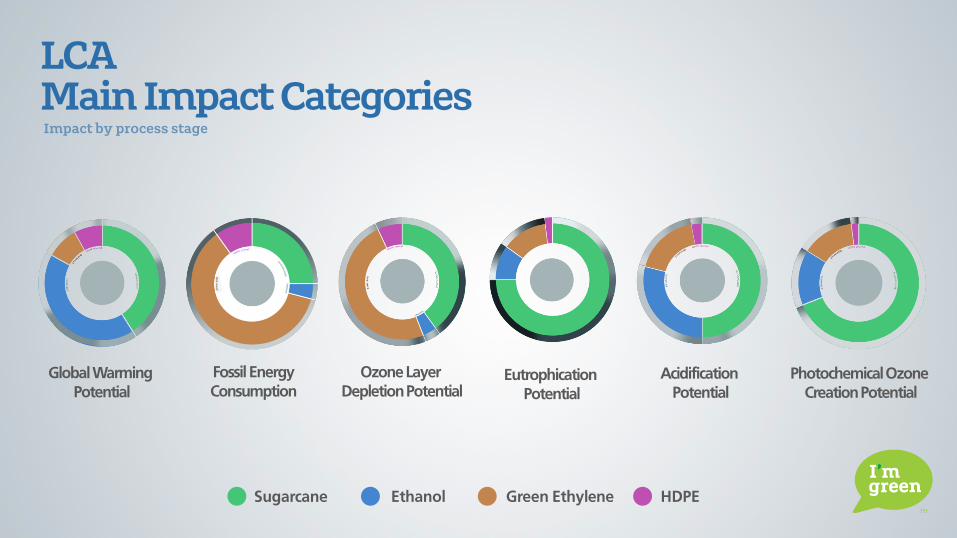
LCA Main Impact Categories
Fossil Energy
Consumption Ozone Layer
Depletion Potential Eutrophication
Potential
Acidification
Potential
Photochemical Ozone
Creation Potential
Global Warming
Potential
Sugarcane Ethanol Green Ethylene HDPE
Impact by process stage
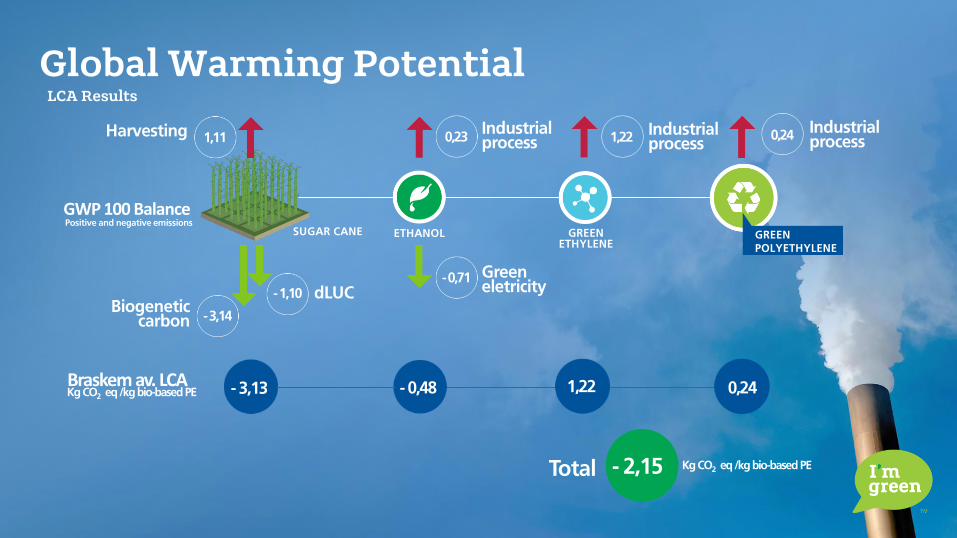
Global Warming Potential LCA Results
SUGAR CANE GREEN
POLYETHYLENE
- 3,14
ETHANOL GREEN ETHYLENE
GWP 100 Balance Positive and negative emissions
Braskem av. LCA Kg CO2 eq /kg bio-based PE
Total - 2,15
- 3,13 - 0,48 1,22 0,24
- 1,10
1,11
- 0,71
0,23 1,22 0,24
Biogenetic carbon
Green eletricity
Industrial process
Industrial process
Industrial process
Harvesting
dLUC
Kg CO2 eq /kg bio-based PE
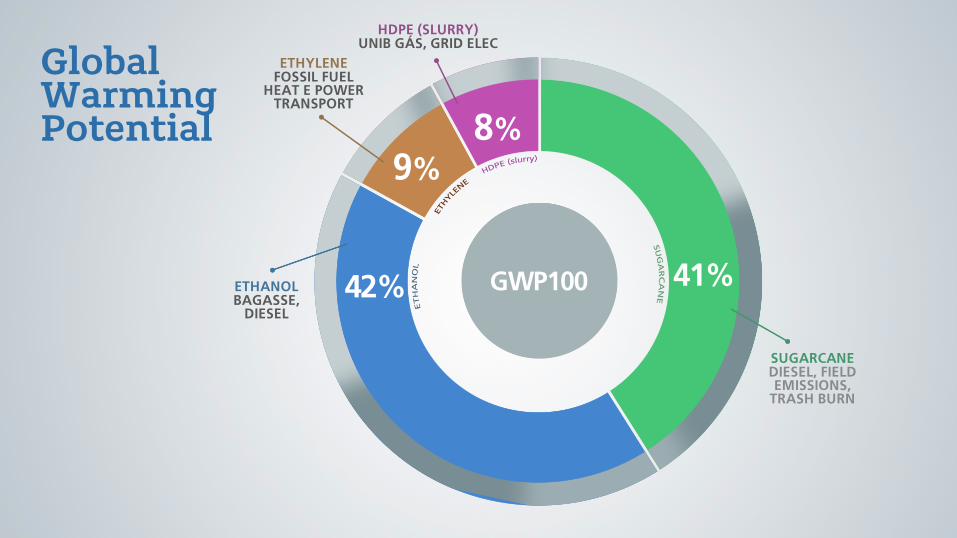
Global Warming Potential
GWP100
SUGARCANE DIESEL, FIELD EMISSIONS,
TRASH BURN
HDPE (SLURRY) UNIB GÁS, GRID ELEC
42% 41%
8%
9%
GWP100 ETHANOL BAGASSE,
DIESEL
ETHYLENE FOSSIL FUEL
HEAT E POWER TRANSPORT
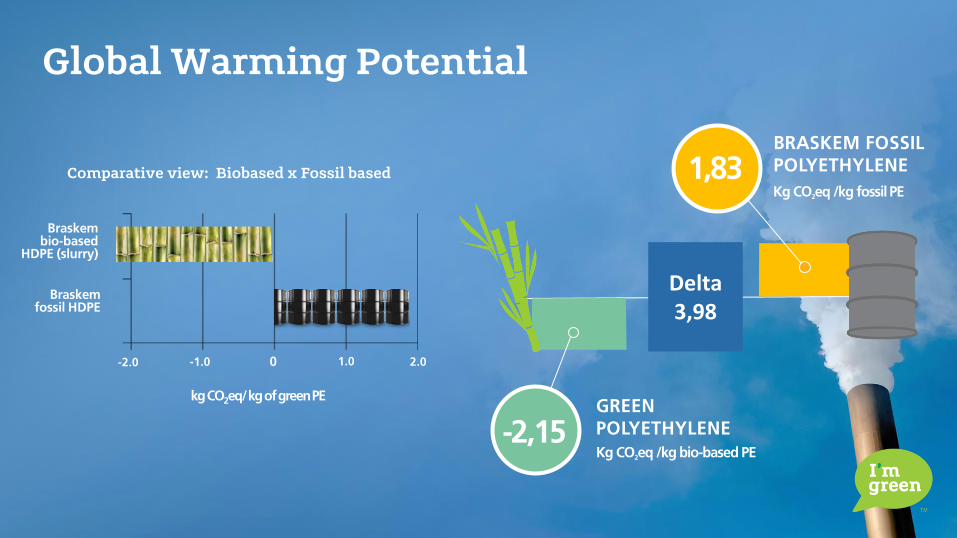
Global Warming Potential
-2,15 Kg CO2eq /kg bio-based PE
GREEN POLYETHYLENE
1,83 Kg CO2eq /kg fossil PE
BRASKEM FOSSIL POLYETHYLENE
Delta 3,98
kg CO2eq/ kg of green PE
Braskem bio-based
HDPE (slurry)
Braskem fossil HDPE
-2.0 -1.0 0 1.0 2.0
Comparative view: Biobased x Fossil based
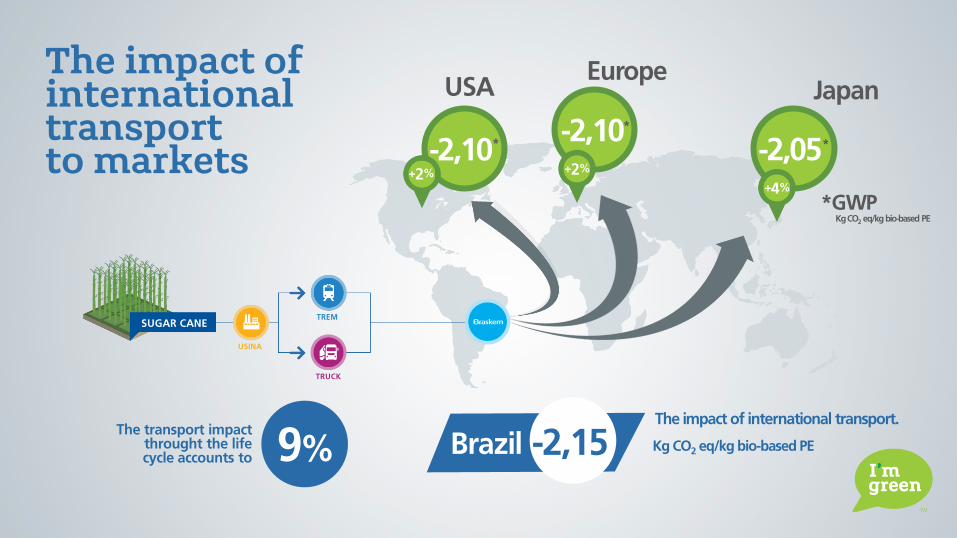
USA
2 + %
SUGAR CANE
USINA
TRUCK
The impact of international transport to markets
TREM
2 + %
4 + %
9% The transport impact
throught the life cycle accounts to
Europe Japan
The impact of international transport.
Kg CO2 eq/kg bio-based PE
*GWP
-2,10 * -2,10 *
-2,05 *
Kg CO2 eq/kg bio-based PE Brazil -2,15
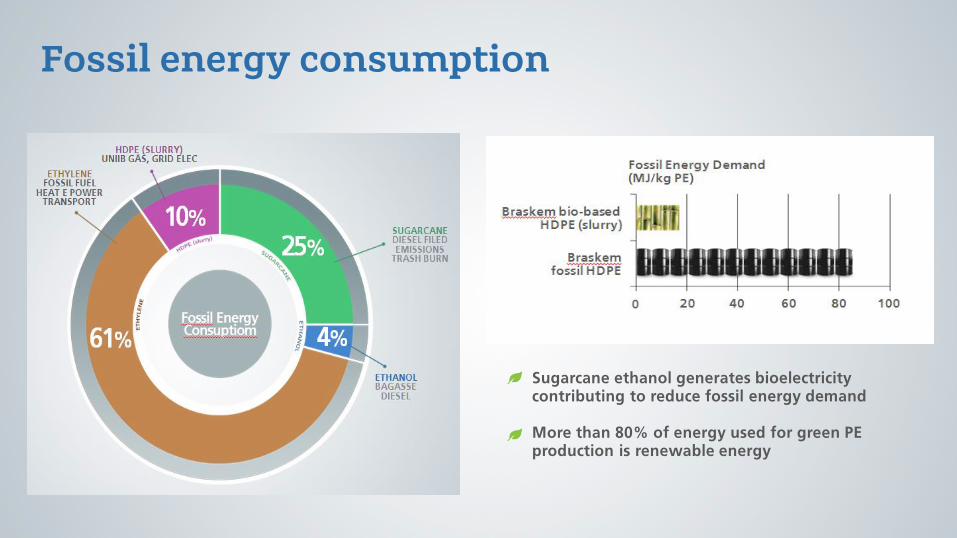
Fossil energy consumption
Sugarcane ethanol generates bioelectricity contributing to reduce fossil energy demand More than 80% of energy used for green PE production is renewable energy
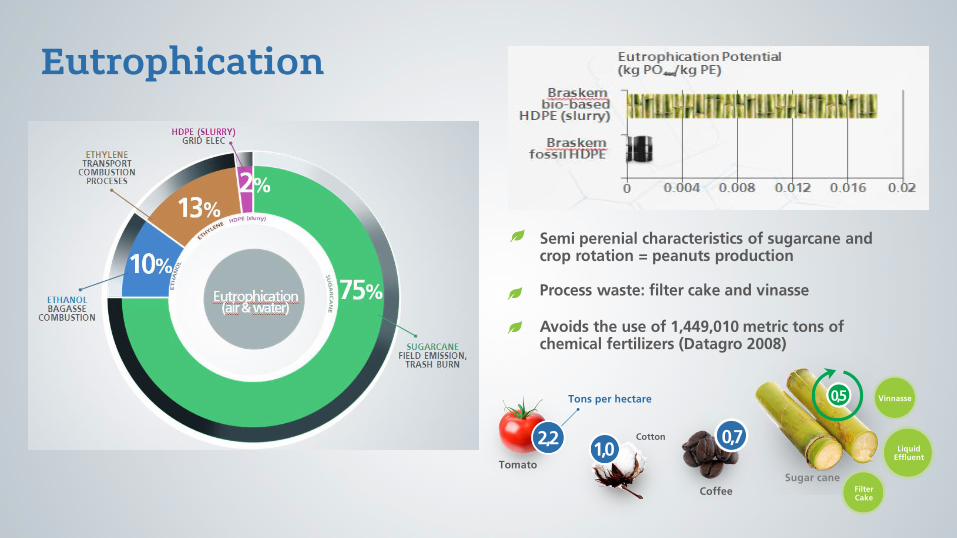
Eutrophication
Semi perenial characteristics of sugarcane and crop rotation = peanuts production Process waste: filter cake and vinasse
Avoids the use of 1,449,010 metric tons of chemical fertilizers (Datagro 2008)
Tomato
Tons per hectare
2,2 Cotton
1,0
Coffee
0,7
Filter Cake
Liquid Effluent
Vinnasse
Sugar cane
0,5
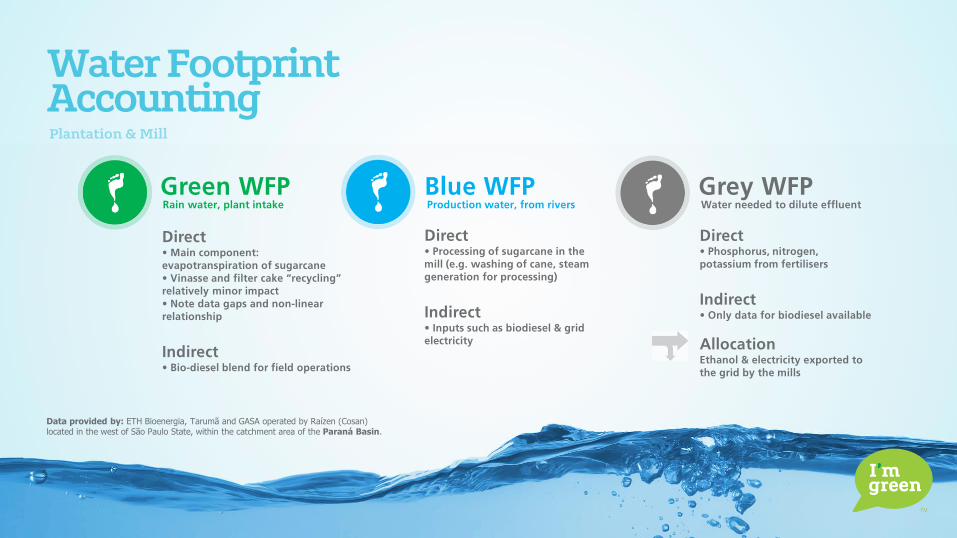
Water Footprint Accounting Plantation & Mill
Rain water, plant intake
Green WFP Production water, from rivers
Blue WFP Water needed to dilute effluent
Grey WFP
Data provided by: ETH Bioenergia, Tarumã and GASA operated by Raízen (Cosan) located in the west of São Paulo State, within the catchment area of the Paraná Basin.
Direct • Main component: evapotranspiration of sugarcane • Vinasse and filter cake “recycling” relatively minor impact • Note data gaps and non-linear relationship
Indirect • Bio-diesel blend for field operations
Direct • Processing of sugarcane in the mill (e.g. washing of cane, steam generation for processing)
Indirect • Inputs such as biodiesel & grid electricity
Direct • Phosphorus, nitrogen, potassium from fertilisers
Indirect • Only data for biodiesel available
Allocation Ethanol & electricity exported to the grid by the mills
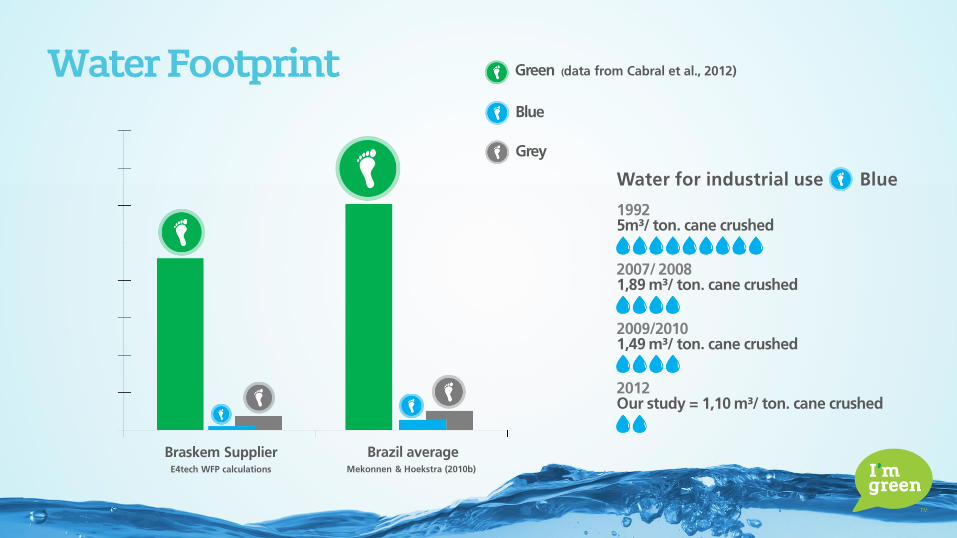
Braskem Supplier
E4tech WFP calculations
Brazil average
Mekonnen & Hoekstra (2010b)
Green (data from Cabral et al., 2012)
Blue
Grey
Water for industrial use Blue 1992 5m³/ ton. cane crushed 2007/ 2008 1,89 m³/ ton. cane crushed 2009/2010 1,49 m³/ ton. cane crushed 2012 Our study = 1,10 m³/ ton. cane crushed
Water Footprint
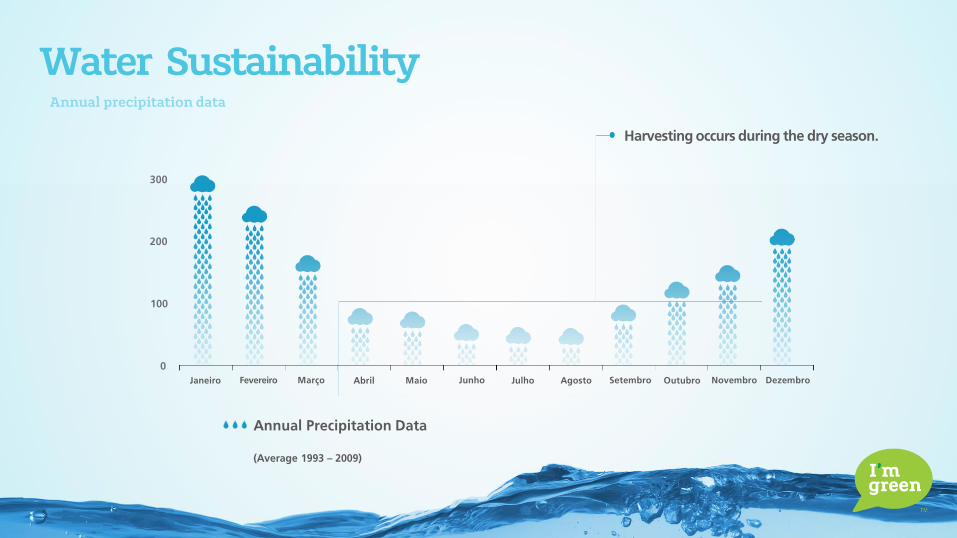
Water Sustainability
Harvesting occurs during the dry season.
Janeiro Fevereiro Março Abril Maio Junho Julho Agosto Setembro Outubro Novembro Dezembro
100
0
200
300
Annual Precipitation Data (Average 1993 – 2009)
Annual precipitation data
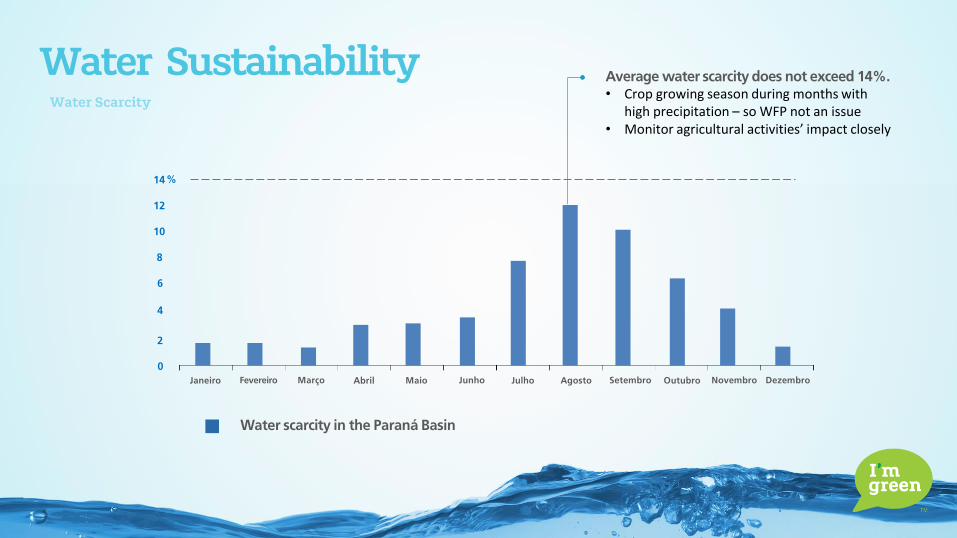
Water Sustainability Water Scarcity
Janeiro Fevereiro Março Abril Maio Junho Julho Agosto Setembro Outubro Novembro Dezembro
4
0
8
14
2
6
10
12
%
Average water scarcity does not exceed 14%. • Crop growing season during months with
high precipitation – so WFP not an issue • Monitor agricultural activities’ impact closely
Water scarcity in the Paraná Basin
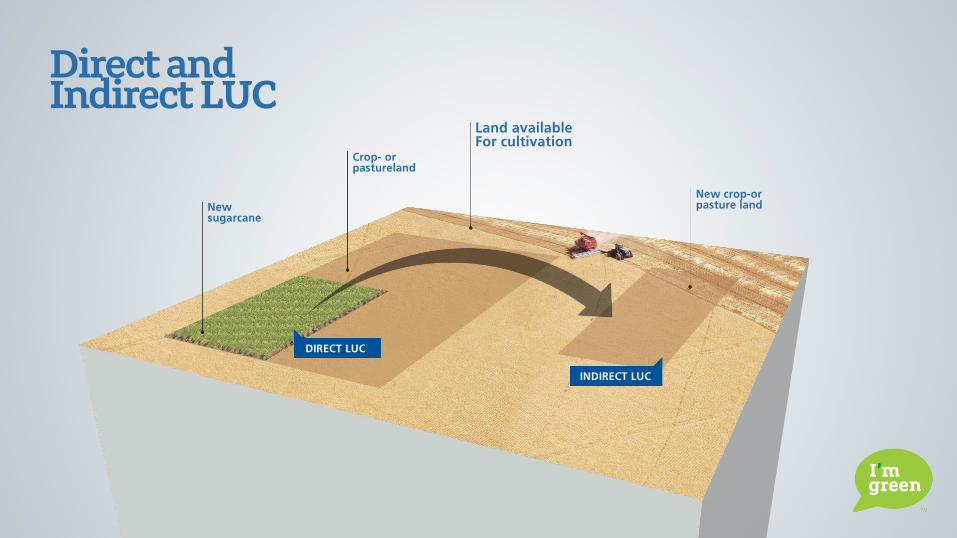
DIRECT LUC
INDIRECT LUC
Direct and Indirect LUC
New sugarcane
Crop- or pastureland
Land available For cultivation
New crop-or pasture land
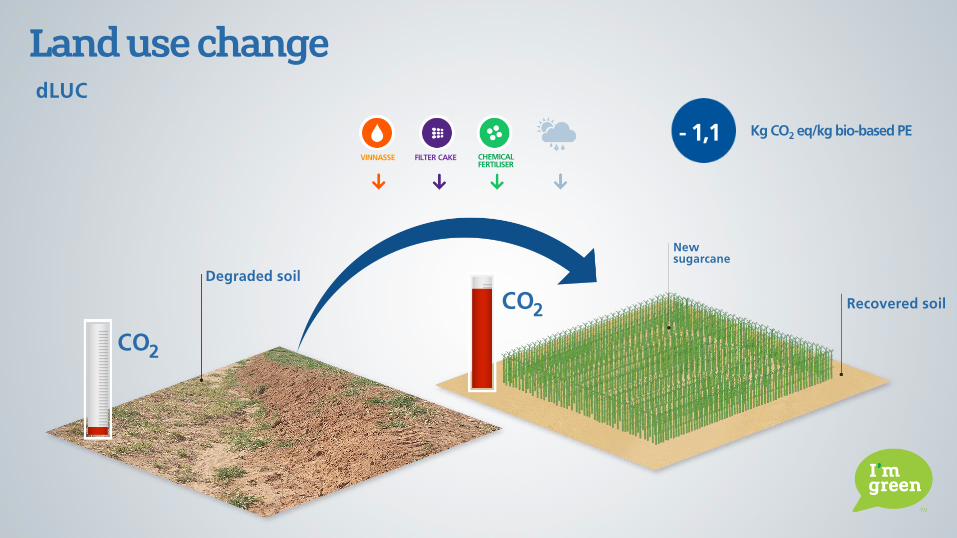
CO 2
Degraded soil
New sugarcane
Recovered soil
VINNASSE FILTER CAKE CHEMICAL FERTILISER
CO 2
Land use change
Kg CO2 eq/kg bio-based PE - 1,1
dLUC
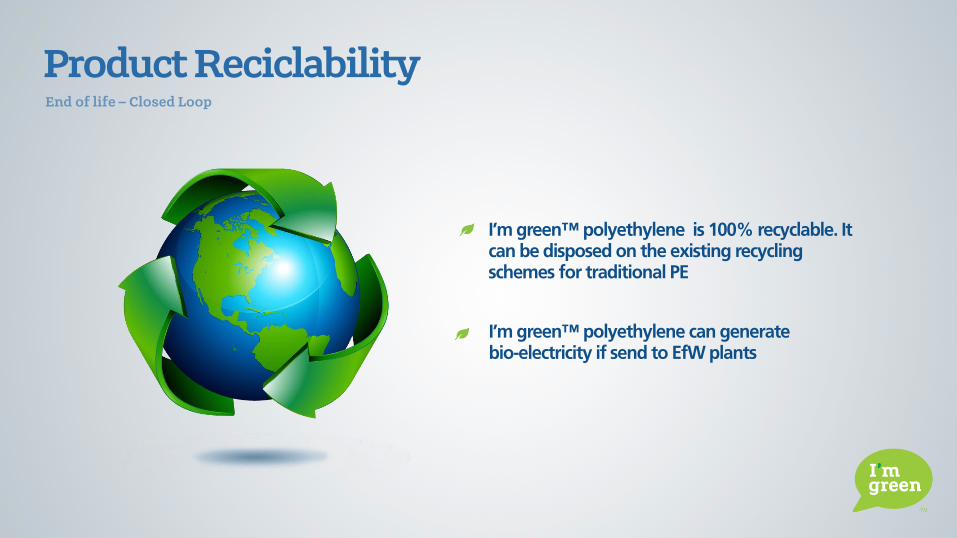
I’m green™ polyethylene is 100% recyclable. It can be disposed on the existing recycling schemes for traditional PE
Product Reciclability End of life – Closed Loop
I’m green™ polyethylene can generate bio-electricity if send to EfW plants
Agenda
Brazilian Scenario
Product Sustainability
Renewable feedstock
LCA
WFT and LUC
Recyclability
Responsible sourcing Communication and education
Key learning
Conclusion
CLIENTE OK
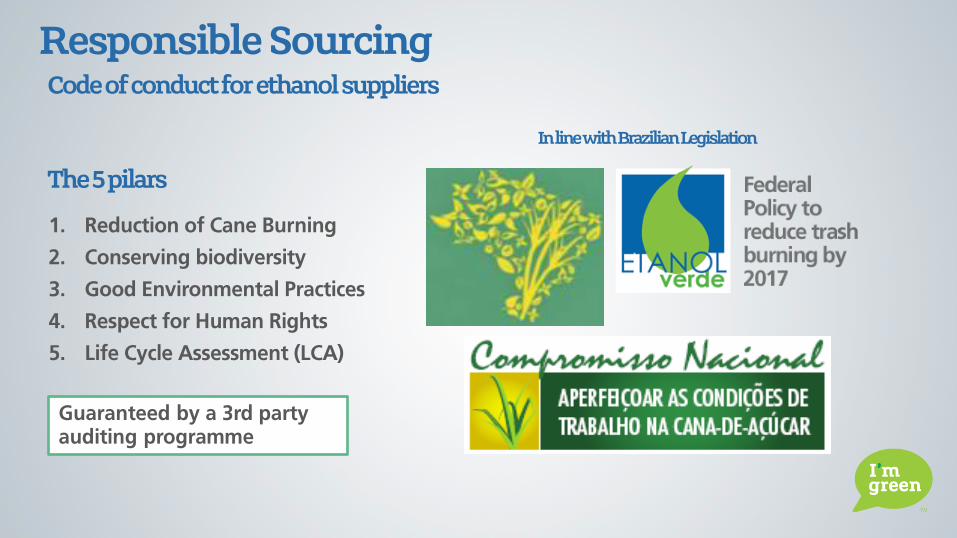
Code of conduct for ethanol suppliers
1. Reduction of Cane Burning
2. Conserving biodiversity
3. Good Environmental Practices
4. Respect for Human Rights
5. Life Cycle Assessment (LCA)
Responsible Sourcing
The 5 pilars
In line with Brazilian Legislation
Guaranteed by a 3rd party auditing programme
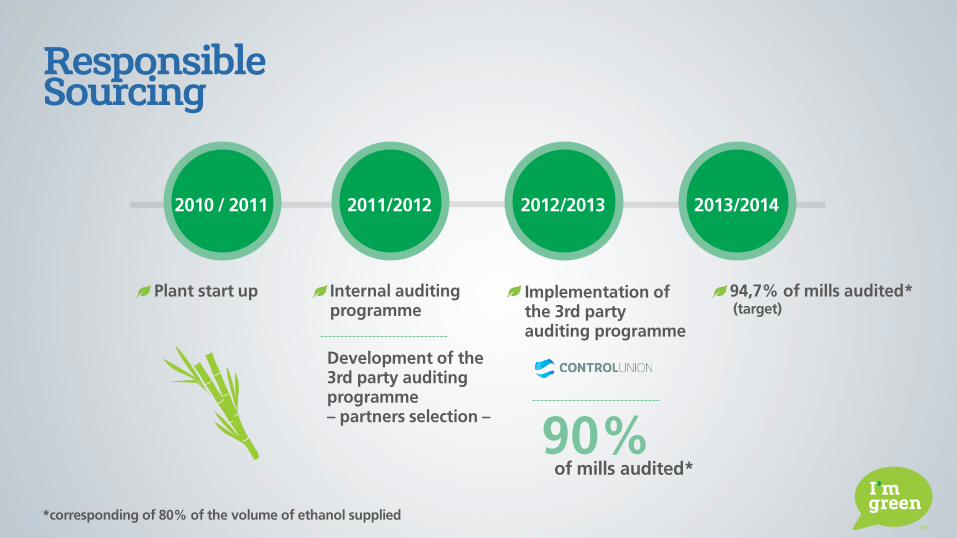
Responsible Sourcing
*corresponding of 80% of the volume of ethanol supplied
Plant start up
2010 / 2011 2011/2012 2012/2013 2013/2014
94,7% of mills audited* (target)
Implementation of the 3rd party auditing programme
Internal auditing programme
Development of the 3rd party auditing programme – partners selection –
90% of mills audited*
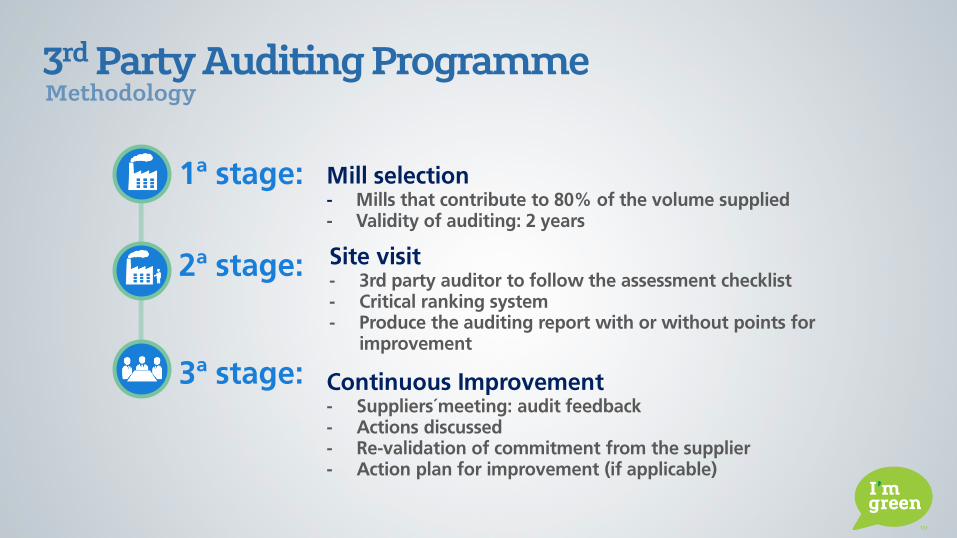
3rd Party Auditing Programme Methodology
1ª stage: Mill selection - Mills that contribute to 80% of the volume supplied - Validity of auditing: 2 years
2ª stage: Site visit - 3rd party auditor to follow the assessment checklist - Critical ranking system - Produce the auditing report with or without points for
improvement
3ª stage: Continuous Improvement - Suppliers´meeting: audit feedback - Actions discussed - Re-validation of commitment from the supplier - Action plan for improvement (if applicable)
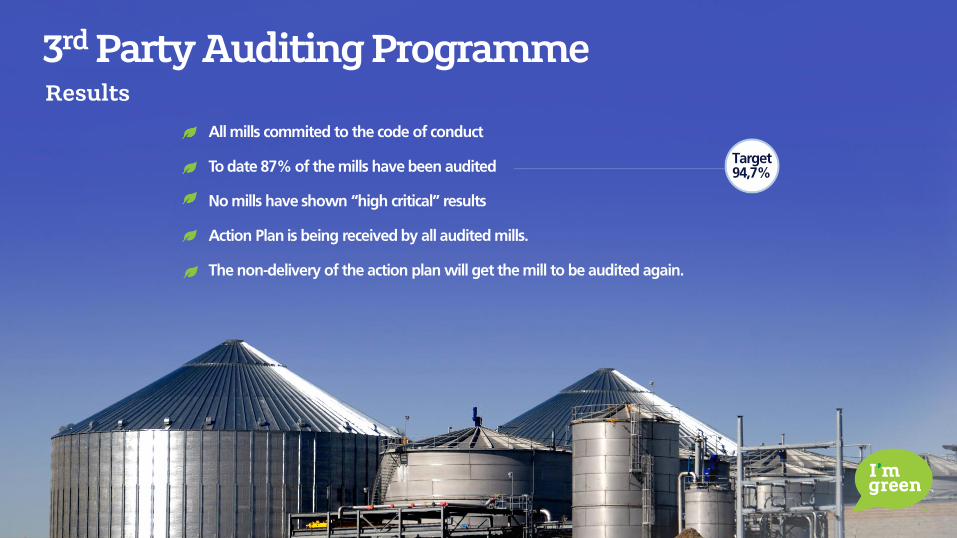
All mills commited to the code of conduct To date 87% of the mills have been audited No mills have shown “high critical” results Action Plan is being received by all audited mills. The non-delivery of the action plan will get the mill to be audited again.
Target 94,7%
3rd Party Auditing Programme Results
Responsible Sourcing
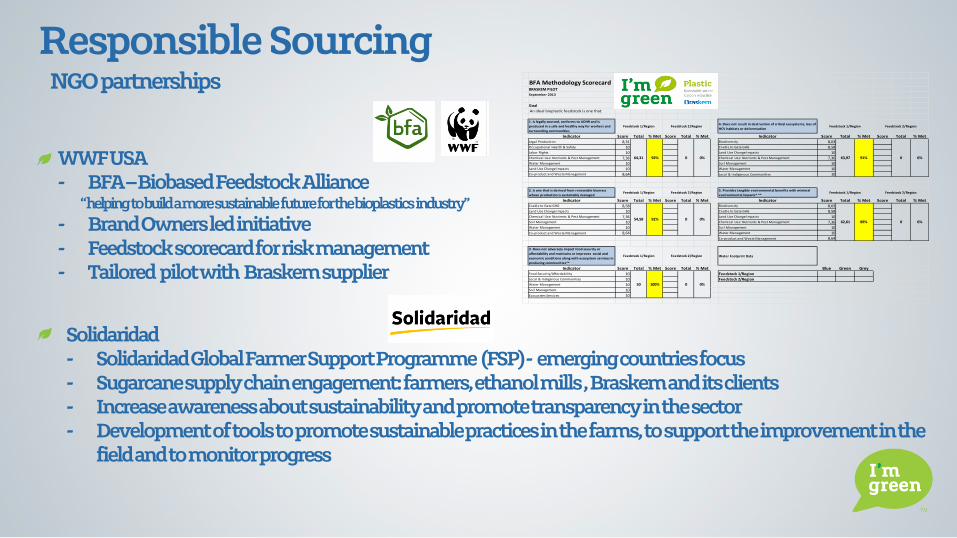
WWF USA - BFA – Biobased Feedstock Alliance “ helping to build a more sustainable future for the bioplastics industry”
- Brand Owners led initiative
- Feedstock scorecard for risk management - Tailored pilot with Braskem supplier
BFA Methodology ScorecardBRASKEM PILOT
Goal
An ideal bioplastic feedstock is one that:
1. Is legally sourced, conforms to UDHR and is
produced in a safe and healthy way for workers and
surrounding communities
4. Does not result in destruction of critical ecosystems, loss of
HCV habitats or deforestation
Indicator Score Total % Met Score Total % Met Indicator Score Total % Met Score Total % MetLegal Production 8,31 Biodiversity 8,03
Occupational Health & Safety 10 Cradle to Gate GHG 8,58
Labor Rights 10 Land Use Change Impacts 10
Chemical Use: Nutrients & Pest Management 7,36 Chemical Use: Nutrients & Pest Management 7,36
Water Management 10 Soil Management 10
Land Use Change Impacts 10 Water Management 10
Co-product and Waste Management 8,64 Local & Indigenous Communities 10
2. Is one that is derived from renewable biomass
whose production is sustainably managed
5. Provides tangible environmental benefits with minimal
environmental impacts* **
Indicator Score Total % Met Score Total % Met Indicator Score Total % Met Score Total % MetCradle to Gate GHG 8,58 Biodiversity 8,03
Land Use Change Impacts 10 Cradle to Gate GHG 8,58
Chemical Use: Nutrients & Pest Management 7,36 Land Use Change Impacts 10
Soil Management 10 Chemical Use: Nutrients & Pest Management 7,36
Water Management 10 Soil Management 10
Co-product and Waste Management 8,64 Water Management 10
Co-product and Waste Management 8,64
3. Does not adversely impact food security or
affordability and maintains or improves social and
economic conditions along with ecosystem services in
producing communities**
Water Footprint Data
Indicator Score Total % Met Score Total % Met Blue Green GreyFood Security/Affordability 10 Feedstock 1/Region
Local & Indigenous Communities 10 Feedstock 2/Region
Water Management 10
Soil Management 10
Ecosystem Services 10
0 0%
Feedstock 1/Region Feedstock 2/Region
50 100% 0 0%
54,58 91% 0 0%62,61 89%
91% 0 0%
Feedstock 1/Region Feedstock 2/Region Feedstock 1/Region Feedstock 2/Region
64,31 92% 0 0% 63,97
September 2013
Feedstock 1/Region Feedstock 2/Region Feedstock 1/Region Feedstock 2/Region
NGO partnerships
Solidaridad - Solidaridad Global Farmer Support Programme (FSP) - emerging countries focus
- Sugarcane supply chain engagement: farmers, ethanol mills , Braskem and its clients - Increase awareness about sustainability and promote transparency in the sector - Development of tools to promote sustainable practices in the farms, to support the improvement in the
field and to monitor progress

Agenda
Brazilian Scenario
Product Sustainability
Renewable feedstock
LCA
WFP and LUC
Recyclability
Responsible sourcing
Communication and education Key learnings
Conclusion
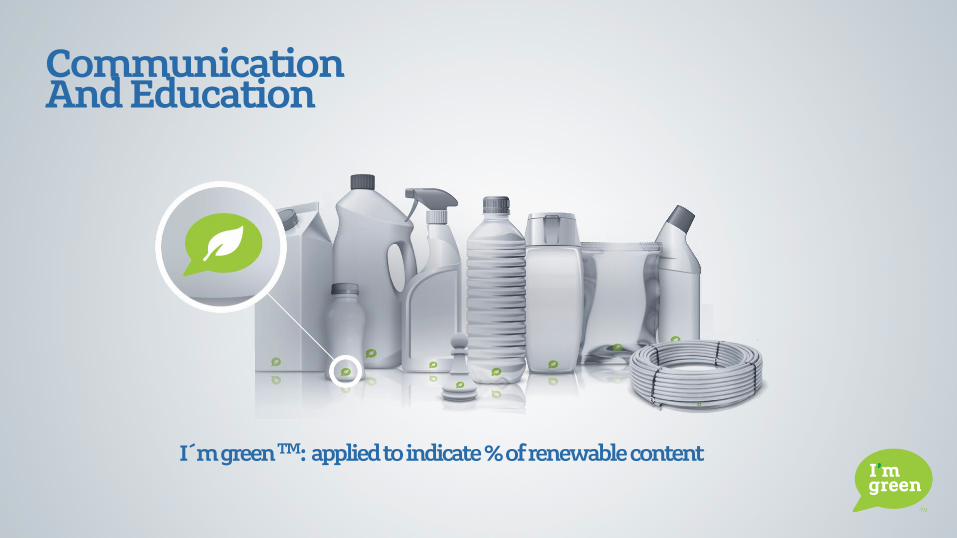
Communication And Education
I m green TM: applied to indicate % of renewable content

Agenda
Brazilian Scenario
Product Sustainability
Renewable feedstock
LCA
WFT and LUC
Recyclability
Responsible sourcing
Communication and education
Key learnings Conclusion
CLIENTE OK
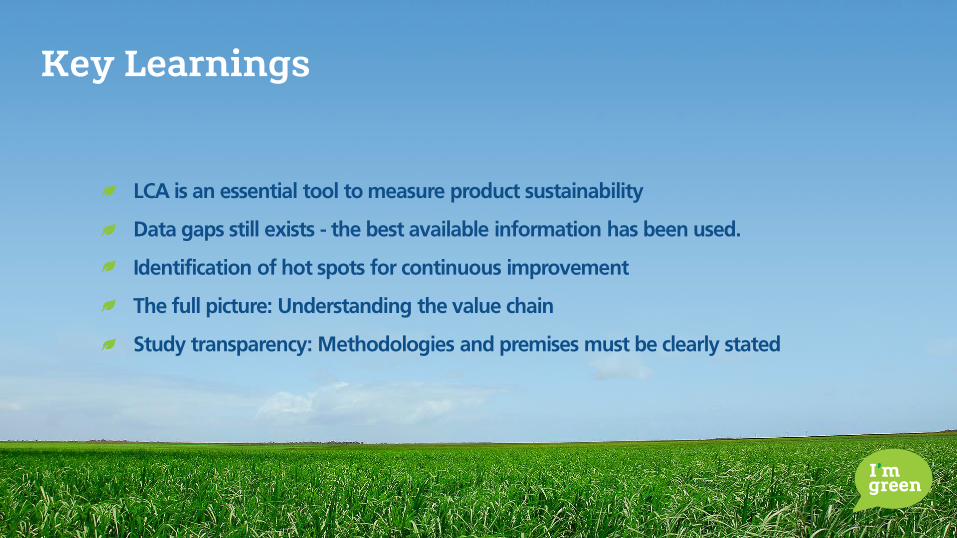
Key Learnings
LCA is an essential tool to measure product sustainability
Data gaps still exists - the best available information has been used.
Identification of hot spots for continuous improvement
The full picture: Understanding the value chain
Study transparency: Methodologies and premises must be clearly stated

Agenda
Brazilian Scenario
Product Sustainability
Renewable feedstock
LCA
WFT and LUC
Recyclability
Responsible sourcing
Communication and education
Key learnings
Conclusion
CLIENTE OK
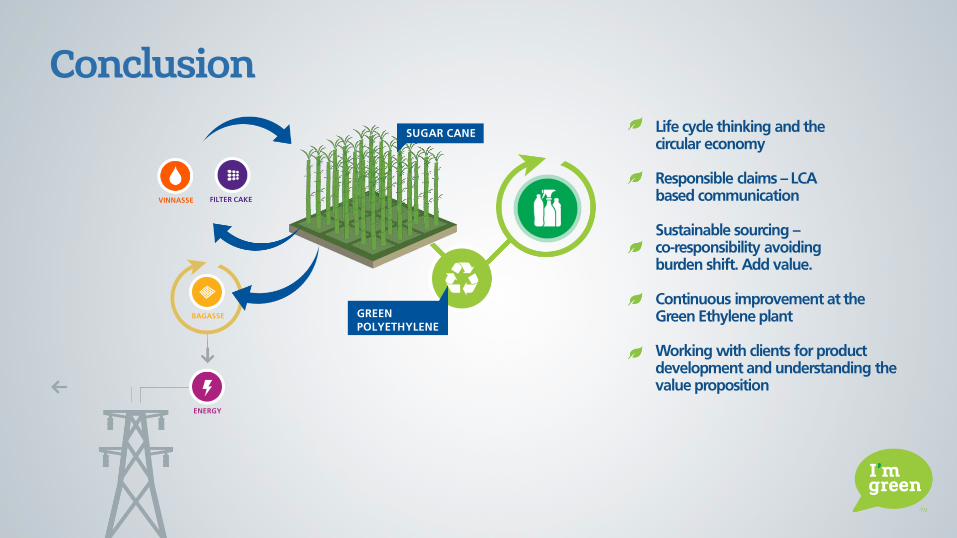
SUGAR CANE
GREEN
POLYETHYLENE BAGASSE
VINNASSE FILTER CAKE
Life cycle thinking and the circular economy Responsible claims – LCA based communication Sustainable sourcing – co-responsibility avoiding burden shift. Add value. Continuous improvement at the Green Ethylene plant Working with clients for product development and understanding the value proposition
Conclusion
ENERGY