april 1973 - nasa...r-739 traverse gravimeter experiment final report by sheldon w. buck, et al....
TRANSCRIPT

~v- / g9•~1
INASA-CR-128948) TRAVERSE GRAVIMETER N73-2449
EXPERIMENT Final Report (MassachusettsInst. of Tech.) ad$ p HC $9.50 CSCL 14B
./5i UnclasG3/14 05003
, ,
'CHARLES STARK DRAPERLABORATORY
P I 0 S. " IR01-
CAMBRIDGE, MASSACHUSETTS, 02139
[nI
R-739
TRAVERSE GRAVIMETER EXPERIMENT
FINAL REPORTby
Sheldon W. Buck, et al.
April 1973
/I
https://ntrs.nasa.gov/search.jsp?R=19730015763 2020-04-21T15:43:00+00:00Z

R-739
TRAVERSE GRAVIMETER EXPERIMENT
FINAL REPORT
by
Sheldon W. Buck, et al.
April 1973
THE CHARLES STARK DRAPER LABORATORY
A DIVISION OF MASSACHUSETTS INSTITUTE OF TECHNOLOGY
CAMBRIDGE, MASSACHUSETTS 02139
Approved:
Job B. Harper, Program ManagerTraverse Gravimeter Experiment
Date: __ 7_ 7__
Date: N 473
Date;741273
t

ACKNOWLEDGMENT
This report was prepared under DSR Project 55-45100, sponsored by the
Lyndon B. Johnson Space Center of the National Aeronautics and Space Administra-
tion through Contract NAS 9-11555.
The authors wish to express their sincere gratitude to all personnel who
took part in the Traverse Gravimeter Experiment. It was through their personal
commitment to this program and a desire to be part of a once-in-a-lifetime oppor-
tunity that success was achieved in building the first instrument at the Charles
Stark Draper Laboratory to reach the moon.
The authors also wish to express their appreciation to the following personnel
for their relations with the Draper Laboratory and contributions to the program:
Dr. Manik Talwani, Principal Investigator, of Lamont-Doherty
Geological Observatory of Columbia University for his stead-
fast support and cooperation.
Mr. Max Holley and Mr. Stanley Bachman of NASA/JSC for
their technical direction and program management.
Dr. Peter Mason of the Jet Propulsion Laboratory, assigned
to NASA Headquarters, for his personal interest and techni-
cal insight.
Mr. Stuart Law of Philco Corporation, assigned as our Flight
Controller at JSC Mission Control, for taking the time to
thoroughly understand the operation of this instrument.
Particular credit must be given to the engineering contributions of Arthur
D. Little Company, Inc. for overall thermal-design assistance and the design and
fabrication of the protective blanket for this instrument.
About one hundred persons from the Charles Stark Draper Laboratory
contributed directly to this program. Engineers from Groups 20, 22B, 22F, 23, 35,
37, 38, and 50 helped analyze, design, build and test the gravimeter. The authors
wish space permitted detailing each person's involvement, since credit for the success
that this program received is deservedly theirs.
ii

A special thank you to Mrs. Catherine Hall for her secretarial contributions
from our initial proposal, through arranging all our field and mission support trips,
to this final report.
And special recognition to Mr. John B. Harper of the Charles Stark Draper
Laboratory who provided the overall program management; and to Mr. Philip N.
Bowditch for his supervision, sincere interest, and advice, whose wisdom was
appreciated throughout the program.
The publication of this report does not constitute approval by the National
Aeronautics and Space Administration of the findings or the conclusions contained
herein.
iii

R-739
TRAVERSE GRAVIMETER EXPERIMENT
FINAL REPORT
ABSTRACT
A semiautomatic self-leveling lunar gravimeter has been designed for the
Apollo 17 mission. This Traverse Gravimeter,which is completely self-contained and
powered by an internal battery, was used to measure gravity at predetermined stops
along the route of the Lunar Rover Vehicle. The gravity sensor is a vibrating string
accelerometer (VSA) enclosed in a temperature-controlled oven and gimballed
leveling assembly.
This instrument is capable of resolving gravity differences as small as 0. 035
milligal (1 mgal = 0.001 cm/s) on the moon and yet also is able to measure the
earth' s gravity field of 980,000 milligals. Twenty-two measurements were taken on
the moon during the Apollo 17 mission, during which the VSA temperature never
varied more than 0. 0050°C. The flight results indicate an instrument accuracy of
better than 2 mgal.
by Sheldon W. Buck, et al.
April 1973
iv

TABLE OF CONTENTS
Section
PART I - FINAL ENGINEERING REPORT .......
1. INTRODUCTION ..............
2. EXPERIMENT PURPOSE ...........
3. GENERAL INSTRUMENT DESCRIPTION.....
4. VIBRATING STRING ACCELEROMETER .
4.1 Principle of Operation.........
5. ELECTRONICS ................
5.1 General Description..........
5.2 Circuit Description ...........
5.3 Gravity-Measurement Technique ..
5.4 Automatic Leveling System.......
5.5 Multiplexer and A/D Encoder......
5.6 The Phase-Locked-Loop Filter......
5.7 Temperature Control ..........
5.8 Power Supply.............
6. MECHANICAL DESIGN ............
7. THERMAL DESIGN ..............
7.1 Thermal Requirements .........
7.2 Thermal Design - General Description .
7.3 Inner Structure Design.........
7.4 Gimballed Structures ..........
7.5 Radiator ................
7.6 Case and Case-Mounted Electronics .
7.7 Battery and Phase-Locked Loop.....
7.8 Multilayer Thermal Blanket .......
7.9 Visual Thermal Performance Indications
7.10 Apollo 17 Mission - Thermal Results . . .
Page
3
4
5
7
8
.12
12
........ 3
.13
.. 4
16
18
.19
.19
21
28
28
29
31
36
36
38
40
41
44
46................ 46
v

TABLE OF CONTENTS (Continued)
Section Page
8. HUMAN FACTORS ................... .... 48
9. INSTRUMENT ERROR ANALYSIS . ............. .. ..... 53
9.1 Background Notes . .................. . 53
9.2 VSA Shock Sensitivity . ................. 53
9.3 A Bias (VSA) .................. ..... . 54
9.4 A Bias as f(T) (VSA). .................. 54
9.5 A SF. ......................... 55
9.6 A SF f(T). . .................. .... 55
9.7 Leveling (cos 0). . .................. . 55
9.8 Quantization . .................. ... 55
9.9 VSA Amplifier Power-Supply Sensitivity . ......... 56
9.10 VSA Amplifier Temperature Sensitivity . ......... 56
9.11 Slow-Loop Bias Uncertainty . .............. 56
9.12 Environment .................. .. . . . 56
9.13 Summary . .................. ... . 56
10. ENGINEERING TESTING ..................... 58
10.1 Performance Tests ................... ..... 58
10.2 Thermal Tests ..................... 59
10.3 Mechanical Tests ..................... 60
10.4 Field Tests ........................ 61
10.5 Flight-Unit Testing ................... ............... 63
11. MISSION RESULTS. ....................... 65
11.1 Discussion ....................... ......... 68
11.2 Conclusion ...................... .... 71
Appendix
A. Derivation of Sum Frequency and Higher-Order Termsof VSA Output ....................... ............................. 73
B. Gravimeter Electronics Schematic ................... 77
vi

TABLE OF CONTENTS (Continued)
Section
Append
C.
D.
E.
F.
G.
Page
lix
Calculation of Maximum Temperature on Vertical Surfof Multilayer Blanket ...............
Thermal Modeling and Mission Predictions ....
Thermal-Mathematical Computer Model Description.
Derivation of Leveling Error ...........
Analysis of Environmental Errors for the TG . . .
PART 2 - FINAL ADMINISTRATIVE REPORT.
1. PURPOSE..............
2. DELIVERABLE HARDWARE .....
2.1 Breadboard Unit.......
2.2 Engineering Unit.......
2.3 Structural Mock-up Unit . .
2.4 Thermal Mock-up. .......
2.5 Astronaut Interface Unit . .
2.6 Interface Mock-up Units . .
2.7 Training Mock-up Unit . .
2.8 Prototype Unit........
2.9 Qualification Unit .......
2.10 Flight Unit S/N 1.......
2.11 Flight Unit S/N 2.......
2.12 Ground Support Equipment .
3. DELIVERABLE DOCUMENTATION
ace... . . .. 81
... . . . . 83
... . . . . .91
... . . . . .97
... . . . . 101
... . . . . 107
... . . . . .109
... . . . . 110
... . . . . 111
... . . . . 111
... . . . . .111
... . . . . 112
... . . . . 112
... . . . . 112
....... 112
....... 112
... . . . . .113
.. . . . . . 113
... . . .. . 113
... . . . . .113
....... 114
3.1 Monthly Progress and Financial Management Reports .
3.2 Interface Information Documentation........
3.3 End Item Specifications..............
vii
. . . 115
. . . 116
. . . 116

TABLE OF CONTENTS (Continued)
Page
Engineering Drawings ................ ... .
Quality Assurance Plan .. . . . . . . . . . . .. .
Quality Test Specification ..............
Qualification Test Procedures ............
Qualification Test Report ..............
Acceptance Test Specification ............
Acceptance Test Procedures .............
Acceptance Review Reports .............
Reliability Documentation ..............
Safety Plan ....................
Management Plan .................
Spares Requirement ................
Review Minutes ..................
Integration and Pre-Launch Test Requirements Package
Hardware Support Requirements ...........
Operation and Instruction Manuals ..........
Acceptance Data Packages .............
Test Documentation ................
Final Report ...................
Technical Reports .................
4. ENGINEERING CHANGE PROPOSALS .............
5. PROGRAM MEETINGS ...............
5.1 Preliminary Design Review (PDR) .......
5.2 Delta Preliminary Design Review (APDR) .
5.3 Critical Design Review (CDR) .........
5.4 Qualification Test Readiness Review (QTRR) . .
5.5 Customer Acceptance Readiness Review (CARR).
BIBLIOGRAPHY ......................
viii
Section
3.4
3.5
3.6
3.7
3.8
3.9
3.10
3.11
3.12
3.13
3.14
3.15
3.16
3.17
3.18
3.19
3.20
3.21
3.22
3.23
117
117
118
118
118
118
119
119
119
. . 120
. . 120
. . 120
. . 121
121
. . 121
. . 121
122
. . 122
. . 125
. . 125
126
. . . . . 128
. . . . . 128
. . . . . 128
. . . . . 129
. . . . . 130
. . . . . 130
. . . . . 133
LIST OF ILLUSTRATIONS
F igure
3-:1 Traverse gravimeter ............. ...........
4-1 Schematic diagram VSA and support electronics .......
5-1 Response to a 1.5-degree step .........
6-1 Outline drawing of traverse gravimeter ..........
6-2 Cutaway view of traverse gravimeter ..... ......
6-3 Effect of rubber isolators ................
6-4 Gear-box assembly, Y axis ...............
7-1 Quad III stowage pallet temperatures . . .........
7-2 TG thermal design cutaway . . . . . . . . . . . .. . .
7-3 Apollo 17 lunar mission computerized thermal response
8-1 LED numeric display technique.............
8-2 Gravimeter ready for EVA 2 . . ..... . . . .
10-1 Scale factor and bias vs. time for prime flight gravimeter
10-2 Astronaut Cernan at Flagstaff ..............
10-3 Gravimeter interior detail................
11-1 Gravimeter installed before launch ............
11-2 Traverse gravity values from Apollo 17..........
11-3 Gravimeter being unloaded at Station 6 ..........
11-4 Traverse gravimeter mounted on geology pallet ......
D- 1 Hot-mission thermal response ..............
D-2 Normal-mission thermal response .. . . . . . ..... . .
D-3 Cold-mission thermal response.............
E-1 Thermal-mathematical analog model ...........
F-1 Error due to leveling system bias (assuming ± 3 arc minutependulum deadband)...................
G-1 Vibration sensitivity ..................
G-2 Phase-locked loop - Bode plot ..............
G- 3 Displacement sensitivity ..............
Page
17
.... 22
, . ... 23
.... 24
.... 26
.... 30
.... 32
.... 47
50
, . . . 51
59
.... 62
. .. . 64
.... 65
.... . 69
71
. .. . 72
. .... 86
. . . . 87
. .... 88
. .. . 92
. . . . 100
. . ... 102
. . ... 103
. . ... 105
ix
LIST OF TABLES
Page
GRAVIMETER TIMING ..................... 15
ELECTRICAL POWER DISSIPATIONS (IN WATTS). .......... 39
TEMPERATURE ALARMS AND CODES. . ............ 45
SUMMARY OF ERRORS. ........... .......... 57
APOLLO 17 TRAVERSE GRAVITY DATA. .............. 67
TGE THERMAL MISSION ASSUMPTIONS ............. ... 84
COLD-MISSION POWER-BUDGET BREAKDOWN ......... ..... 89
TGE - 14-NODE MODEL .. ......... ......... 93
THERMAL ANALOG MODEL - NODAL COUPLING ........ .... 94
x
Table
5-1
7-1
7-2
9-1
11-1
D-1
D-2
E-1
E-2

PART I
FINAL ENGINEERING REPORT
by
Sheldon W. Buck
John S. Eterno
Glenn Mamon
Richard T. Martorana
Robert G. Scott
William A. Vachon
1

PRECEDING PAGE BLANK NOT FILMED
SECTION 1
INTRODUCTION
In 2 years, a team of engineers, technicians, and others at the Charles
Stark Draper Laboratory designed, built, tested, and supported the operation of the
Traverse Gravimeter (TG) Experiment. The TG was proposed as a portable auto-
mated instrument to define the underground structure of lunar regions traversed by
a Lunar Rover Vehicle (LRV). This was the first time a series of precise gravity
measurements had been made on the surface of the moon.
It was hoped that the gravity readings would help solve the puzzle regarding
the geological structure of the Sea of Serenity, which is near the landing site called
"Taurus Littrow." The Sea of Serenity is represented by a large mascon on a
gravity map and it is hypothesized that this hugeqpositive gravity anomaly is caused
by a dense material such as basalt (lava) flooding a large plain.
The TG was transported to the lunar surface on the Lunar Module (LM)
descent stage of Apollo 17. After the LM 'landing, the TG was deployed on the lunar
surface and initial measurements were made in the vicinity of the lunar module.
Gravitational measurements were made at various stations where the LRV was
stopped for geological examinations. Upon initiation, the TG automatically levelled,
measured gravity, and conditioned the data to digitally display the measurement to
the astronaut upon his command. The results of each measurement were transferred
to earth by way of voice communication.
During the three traverses of Apollo 17, 22 gravity readings were taken at
ten different locations. The direct gravity reading variations covered a range of
49 mgal.
reeAgL -

SECTION 2
EXPERIMENT PURPOSE
Gravimetry is a major tool of geophysical exploration on earth where
instrumental methods and interpretive techniques have evolved to an advanced state.
Commercial gravimeters are available for use on land, on the sea-surface
and bottom, and in the air. None of these instruments is presently capable of meas-
uring lunar gravity against an earth-based value. Therefore, this report describes
the development of a gravimeter designed specifically for this task.
The first application of gravimetry to the moon was by means of a satellite.
This provided a most important contribution to lunar tectonics - the discovery of
positive gravity anomalies correlated with ringed maria, commonly called lunar mascons.
Future satellite gravity studies will no doubt contribute to further understanding of
large-scale structures (i.e., greater than 50 km). Only surface gravimetry, however,
can yield the fine resolution required for exploring such lunar features as ridges
surrounding the dark plains, edge effects of geological features, thickness variations
in the mantle rock or lava flows, and density variations in the valley-highland borders,
and for this purpose the traverse gravimeterexperiment was designed. Without serious
intervention in the astronaut's normal duties, a gravity map was obtained which yielded
information on the "third dimension" of the geological features observed in the course
of an Apollo mission. In this sense, the gravimeter was one of the most important
geological tools in lunar exploration. In delineating the extent of lateral density varia-
tions on the moon with a scale of less than 50 km, the gravimeter provided essential
clues to the question of the moon's origin and evolution.
4

SECTION 3
GENERAL INSTRUMENT DESCRIPTION
The traverse gravimeter (Fig. 3-1) consists of an instrument package inclu-
ding a battery-pack assembly, both enclosed in a multilayer insulating blanket
which provides thermal protection. The instrument is lightweight, completely self-
contained, and essentially automatic in operation, requiring no external power,
recording devices, or telemetry. The gravimeter is rectangular in shape with a
cylindrical surface at the front. It stands 20 inches high, 11 inches wide, and 9.75
inches deep, and weighs approximately 28 pounds. A folding handle at the top of the
instrument is used for hand carrying and for securing the instrument to the LRV
(Lunar Roving Vehicle) while three footpads at the base enable lunar-surface opera-
tions. A nine-digit display is found in the top of the case for visual readout of
gravity data. A radiator at the top provides the primary means for heat expulsion.
Both the display and radiator are protected from the dusty lunar environment by
hinged plastic insulating covers.
The inner structure consists of a two-axis gimbal system which contains a
vibrating-string accelerometer (VSA) housed in a thermally protected and evacuated
two-stage oven assembly (precision and intermediate ovens). The oven assembly is
enclosed in an electronic frame (E-frame) assembly of similar structural design
which is pivoted about its axis and supported by a middle gimbal assembly. The
middle gimbal controls the vertical positioning of the inner gimbal over a 30-degree
range, and the middle gimbal assembly is attached through bearings to the base
housing, with capacity to rotate through 210 degrees in order to invert the assembly
for VSA calibration). Stepper motors and a gear train provide the drive and position-
ing of the gimbal assemblies, the motors reacting to signals from pendulums which
work as level sensors. Heat for thermal protection of the inner (precision) oven is
supplied by a temperature-control system while the intermediate oven is thermally
protected by a preset on-off thermostat-heater combination.
The VSA employed as a gravity sensor was manufactured by the American
Bosch Arma Company. Low power, small size, accuracy, and the excellent results
obtained in an experimental sea gravimeter made the VSA the best candidate for use
in a lunar gravimeter.
5

When the base of the TG is within ± 15 degrees of the horizontal, the control
logic can level the system and permit measurement of the VSA difference frequency
which is stored until the astronaut commands a visual readout. The display consistsof nine digits, the first seven indicating the gravity reading and the last two showing
the precision oven temperature and the status of temperature alarms.
A quantization in excess of 0.035 mgal per digit is obtained on a visual read-
out with an overall accuracy better than 2.0 mgal. This new, self contained instru-
ment, powered by an internal 7.5 volt battery providing up to 375 watt hours of
energy for all modes of operation over a 15-day period, was designed to be light-
weight, reliable and simple to operate.
0 7
Fig. 3-1 Traverse gravimeter
6

SECTION 4
VIBRATING-STRING ACCELEROMETER
Gravity measurement with vibrating-string instruments was first accomplished
about 1950 by R. Gilbert for use on a submarine and for measurements in a borehole.
In the early sixties, other researchers made use of the vibrating-string accelero-
meter (VSA) in surface- ship gravimeters. In 1967 Dr. Charles Wing, formerly of
the Department of Earth and Planetary Sciences at the Massachusetts Institute of
Technology, perfected a gravimeter for surface ships and deep-sea-bottom experi-
ments using military-surplus VSA's. Several surface-ship gravimeters based on
Wing's initial design are in use today. These later gravimeters use VSA's built
originally by American Bosch Arma for the Atlas program.
The traverse gravimeter makes use of 8-year-old surplus second-generation
VSA's originally built by Arma for the Air Force for military applications. These
units are smaller in size than the Atlas first-generation instrument and more suit-
able for a small experimental package. A critical review was made of existing
accelerometers and gravimeters which could be modified for use on the moon.
Fourteen individual devices representing the best from each of four categories
(absolute, quartz, vibrating-string gravimeters, and accelerometers) were retained
for consideration. * As a result of these tests, the VSA appeared the most suitable
candidate for the program. The Arma units were built to withstand shock and
vibration inputs consistent with use in aerospace systems. The VSA employed in
the traverse gravimeter used less than a microwatt of power, and the drive ampli-
fiers used only 30 milliwatts. The difference frequency between two strings in the
VSA was amenable to ultraprecise determination of acceleration. The sum frequency
output could be used as an independent check on the scale factor of the instrument.
There were, however, some disadvantages to the use of a VSA. To obtain
the degree of stability required, the VSA required temperature stability of approxi-
mately 0.010°C. The instrument exhibited a drift in both bias and scale factor which
Wing, Charles, and Sheldon Buck, Experimental Proposal for Manned SpaceflightLunar Gravity Traverse Experiment, NASA, 10/17/69, pg 9.
Note: A complete bibliographical listing of all referenced documents is lincludedin the Bibliography at the end of Part II.
7

would need to be calibrated and verified to be repeatable across launch and trans-
lunar coast. The instrument also had a history of occasional tares (shifts) in bias
and scale factor if subjected to shock and vibration.
4.1 Principle of Operation*
A schematic diagram showing the VSA cross-section and the instrument
electronics is shown in Fig. 4-1. The VSA consists of two equal proof masses
suspended from separate beryllium-copper strings and joined by a soft spring.
Each string passes between the poles of a permanent magnet and both are rigidly
attached to the support structure. Cross supports hold the masses rigidly in the
transverse direction.
If an alternating current is applied to one of the strings, it will oscillate
within the field of the permanent magnet at a frequency equal to that of the exciting
current. As Fig. 4-1 indicates, the output of each drive amplifier is applied to a
string and the back EMF developed by the moving string is used as positive feed-
back to the amplifier. Each string-amplifier loop will thus oscillate as its natural
frequency.
Rayleigh derived the expression for the natural frequency of transverse
vibration of a string or wire in tension rigidly clamped at both ends.
f = - ( T) 1/2 2X (ES+T) 1/2 )
(1 - +-/ (4-1)
where
f = resonant frequency
T = tension
L = string length
m = mass of the string
X = radius of gyration of the string cross-section about its midplane
S = cross-sectional area of the string
E = modulus of elasticity
The term in the brackets accounts for about a 1% correction. Thus Eq.(4-1) may be
approximated by
1 T 1/2 (4-2)2 Lm) . (4-2)
Next consider a wire fixed at one end, and a small proof mass with a prestress
attached to the other end. Assume a fine cross-support for the mass and that the
entire system is accelerated. The Eq.(4-2) becomes
This derivation is based on previous work by George Bukow reported inCharles StarkDraper LaboratoryReport E-2721.
8

I:-o 2V p-pSINE WAVE
I o OUTPUT
9
: - - 2V p-pl SINE WAVE
I o OUTPUT
Fig. 4-1 Schematic diagram VSA and support electronics.
1 ( To+ MA 1/2
1 L1 m1
prestress
acceleration along the string
proof mass
Rewriting Eq. (4-3) in the form
1 1/2 ( 1/2
f fl t1 ) MA
9
where
To =
A =
M =
(4-3)
(4-4)

and expanding in a MacLaurin series
flT = -2'L1A 2 .]1 0 + '1 -MA/\ 2 + 1 (MA1 2 m 2T 1 0 16 (To) 3 J
(4-5)
The frequency can thus be represented by a power series of the acceleration
f = k01 + kll A+ k21A 2 + A (4-6)01 11 21 31 (4-6)
The usefulness of this device depends on the convergence of this series and its con-
vergence rate.
A unique approach to improving linearity was taken by American Bosch Arma in
designing the VSA for the Atlas ICBM. To the instrument already described is added
a mirror image attached to the end of a coil spring as was shown in Fig. 4-1. Now
instead of one frequency there are two, one for each wire.
If this second system is accelerated, the original string reads a positive
acceleration while the second string reads a negative acceleration. Equation (4-5)
becomes for the second frequency
1 To 1/2 1 (MA\ 1 (MA 1 (MA 3
2 2 kL 2 m2 L 2 2 1To) 8k0o) 16 'TO ) -(4- 7 )
and Eq.(4-6) becomes
f= k02 k 12 A + k 22 A- k 3 2 + ... (4-8)
The output of the two-string VSA is defined as the difference between f1 and f2
fl f2 = (k 0 1 -k 0 2 ) + (k+k12) A+ (k21-+k 2 ) A+(k 2 -k 2 2 ) A2 + (k3 1 + k 3 2 ) A3 +.. (4-9)
Defining
K = k01 - k02; K1 = (kl+ k 12 ); K2 = (k2 1 -k 2 2 ); K3 =(k 3 1 + k 3 2) (4-10)
10
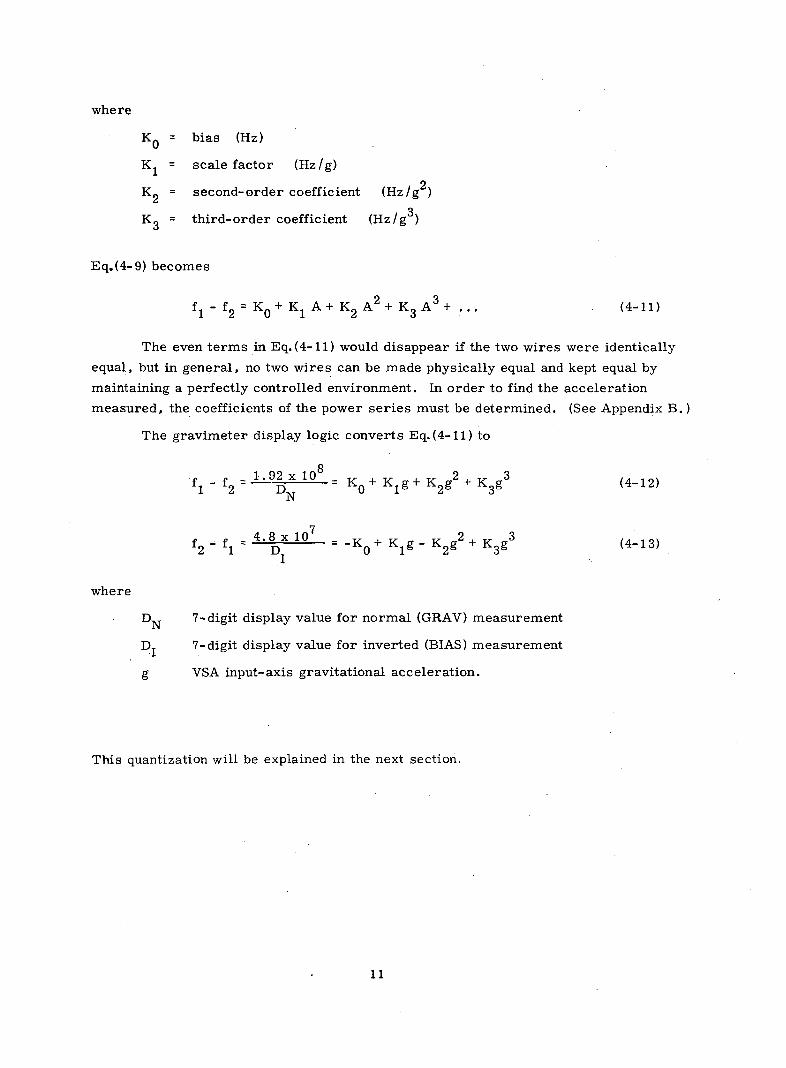
where
K = bias (Hz)0
K1 = scale factor (Hz/g)
K2 = second-order coefficient (Hz/g 2 )
K = third-order coefficient (Hz/g3)
Eq.(4-9) becomes
f - f2 = K + K A + K A + K A + . (4-11)
The even terms in Eq. (4-11) would disappear if the two wires were identically
equal, but in general, no two wires can be made physically equal and kept equal by
maintaining a perfectly controlled environment. In order to find the acceleration
measured, the coefficients of the power series must be determined. (See Appendix B. )
The gravimeter display logic converts Eq.(4-11) to
1.92 x 10⁸ 2 3f f2 = 92 Klg+ K2gK+ Kg3 (4-12)
N
4.8 x 10 7 2 3f2 f1 = D = + -K + 2K1g - K92g + K3g (4-13)
where
DN 7-digit display value for normal (GRAV) measurement
DI 7-digit display value for inverted (BIAS) measurement
g VSA input-axis gravitational acceleration.
This quantization will be explained in the next section.
11

SECTION 5
ELECTRONICS
5.1 General Description
The electronics for the traverse gravimeter is designed with the goals of
simplicity, minimum power consumption, and reliability as prime objectives.
The number of types of components was held to a minimum in order to provide
standardization and ease of testing. Integrated circuits were used for both analog
and digital functions. Analog electronics consist of the VSA oscillator-amplifiers,
mounted with the VSA in the precision oven; the temperature controller, multi-
plexer, and two pendulum-amplifier modules, which are located on the Electronics
frame (E frame); the power-supply module mounted on the main housing; and the
phase-locked loop mounted on the battery. Digital electronics are contained mainly
in the logic and display module located directly behind the numerical display.
The two basic modes of operation of the TG are determined by the ON/STBY
toggle switch on the display panel. In the standby mode (STBY position), used from
launch until lunar traverse, power is supplied only to the oven temperature controls
and VSA oscillator-amplifiers, maintaining a constant thermal environment for the
VSA. At least 5 to 20 minutes before the gravity measurements are to be made,
the system is placed in the operate mode (ON position of switch). Power is then
supplied to a crystal oscillator and to a small part of the mode-control logic.
To initiate a gravity measurement, the GRAV pushbutton is depressed,
supplying power to all system elements except the GRAVITY/BIAS and TEMP
displays. The INDICATOR MODE !light will then flash, indicating that the levelling
loops are in operation. When the VSA assembly is within 7 arc minutes of the
correct orientation with respect to gravity, the INDICATOR MODE light will
illuminate steadily; and, after a delay of approximately 60 seconds, the gravity
measurement cycle will begin. The instrument must remain level (within 7 arc
minutes) for approximately 30 seconds or else the levelling and delay will be auto-
matically recycled. Should a loss of phase lock occur during the measurement cycle,
the three most significant digits of the GRAVITY/BIAS display will be zero when
the operator activates the display. The levelling and measurement sequence must
then be restarted as described above. If no level disturbance occurs, the gravity
12

measurement takes an additional minute. When the measurement is complete, the
system automatically returns to the operate mode. Depressing the READ push-
button activates the GRAVITY/BIAS and TEMP displays. To conserve power, the
displays go off after 18 seconds, but may be reactivated by again depressing READ.
5. 2 Circuit Description
A schematic of the gravimeter electronics is shown in Appendix B. The
major circuits are discussed below.
The vibrating-string accelerometer (VSA) consists ideally of a pair of
single vibrating strings back to back. Separate, but equal masses, joined by a
soft isolating spring, are suspended by identical beryllium-copper strings. The
difference frequency between the two strings is a nearly linear indication of gravity.
Af =f f2 = K0 + Klg 2 + K 3 g3 +''' (5-1)
The scale factor, K1 , is normally about 128 Hz/g. The bias K0 will vary
from one accelerometer to another and will usually lie in the range of 3 to 15 Hz.
The stability of the scale factor is greater than that of the bias and is calibrated
on earth. The bias is updated on the moon at the beginning of EVA- 1 and at the
end of EVA- 3.
Each vibrating string passes through a magnetic field. The driving force
of the string is furnished by an oscillator amplifier whose output is a current
through the vibrating string and whose input is the back EMF created by the motion
of the string in its magnetic field. The natural frequency of oscillation of each
string is nominally about 9.5 kHz. The output voltage signal of each oscillator
amplifier is voltage limited to provide a constant-current source to drive the string.
The VSA amplifiers have a closed-loop gain of about 500 at 9.5 kHz, (the
natural frequency of oscillation of the VSA). The outputs of the VSA amplifiers are
fed to the phase-locked-loop module where the two outputs are mixed. The output
of the mixer is filtered to obtain the difference frequency and attenuate the sum
frequency. The difference frequency is the signal to which the phase-locked filter
is locked. The purpose of the phase-locked loop is to act as a narrow-band filter
to attenuate the possible residual vibrations of the Lunar Roving Vehicle (LRV)
which might occur when taking a measurement.
5. 3 Gravity-Measurement Technique
The VSA difference frequency is approximately 20 Hz on the moon. It is
desired to quantize this signal to approximately one part in 10 . If zero crossings
of the difference frequency were counted, it would take an extremely long time.
It is much simpler to perform a period measurement. The method for doing this is
explained in the following paragraphs.
13
There are really two timing clocks in the data readout. One is the 4-MHz
crystal oscillator; the other is the VSA difference frequency. Binary countdowns
from the 4-MHz oscillator provide the timing for the A/D encoder, the motor-drive
electronics, power-supply synchronization, level-light flasher, and, above all, the
gravity measurement itself. The 4-MHz oscillator is a temperature-compensated
crystal oscillator (TCXO) with an accuracy of 2.5 parts in 107. Although frequencies
as high as 4 MHz are not used in the gravimeter, 4 MHz was chosen based on the
superior performance of crystals at that frequency. The VSA difference frequency
acts as a clock to generate the gate during which time gravity is actually measured.
The gate-generator logic selects a fixed number of cycles of the VSA difference at
the appropriate time. The number of cycles selected is chosen to provide a gate
width of approximately 1 minute. In order to keep the gravity measurement time
approximately the same in all measurement modes, the number of cycles selected
differs in the various modes. As shown in Table 5-1, the relationship between the
gravity-measurement gate width, TG, and the difference frequency, Af, is 1536 in
the Moon-Gravity mode, 384 in the Moon-Bias mode, and 9216 in both of the earth-
measurement modes.
The logic that generates the gravity-measurement gate is prevented from
doing so, however, until the system has levelled in both axes within ± 7 arc minutes.
The gate-generator logic tests that the system is not only level but also has stayed
level for at least 10 to 15 seconds. If the system is oscillating and a nonlevel signal
is obtained, the gate-generator timing is recycled and a gravity measurement is not
performed. Once this level settling time has passed, the gravimeter goes on to
perform the gravity measurement. The gravity-measurement times will be constant
for successive measurements. Table 5-1 also indicates that the quantization is not
merely a function of the displayed number and the full-scaled value. The fact that
the displayed number consists of a relatively large bias that is considered constant
must be taken into consideration. If the bias were zero, then the quantization would
be simply g/N where N is the displayed number and g is the full-scale value (980
gals on earth; 162 gals on the moon). Since the function being measured consists of
a variable (K1 g) and a constant (K ), the actual quantization in milligals is:
( 1 g) ) (O )<0Klg) or - +
5.4 Automatic Levelling System
The seven-arc-minute level indication that permits a gravity measurement
to be performed comes from the levelling section. There are two pendulums in the
gravimeter. Each one is a two-axis device. One pendulum is used in the normal
14

TABLE 5-1
GRAVIMETER TIMING
Typical VSA Gravity Total Time PLLVSA Number of Quantization Measurement
Mode Bs Diff. Freq. After Level Hold TimeBias (Hz) Counts (mgal) Time(Hz) () (s) (s)
Moon-Normal 7 28.1 6.81 x 10⁶ 0.0315 54.5 126.5 36.0
Moon-Bias 7 14.1 3.41 x 10 0.0317 27.2 63.0 N/A
Earth-Normal 7 134.0 8.62 x 10⁶ 0.122 69.0 160.0 46.0
Earth-Bias 7 120.1 9.55 x 10⁶ 0.099 76.5 177.0 N/A
Gravity Measurement Time (s) 1536 Moon-Normal Clock frequency = 125 kHz
384 Moon-Bias Quantization = (K0 + g)Af N
N = Number of Counts9216 Earth
AfK0 = Bias
K 1 = Scale Factor

orientation and the other in the bias mode. The pendulums are excited with an ac
supply. The pendulum output signals are first normalized for scale factor, adjusted
for phase shift, and trimmed for quadrature rejection before they are amplified,
demodulated, buffered, and then multiplexed and sent to an A/D encoder. (In addi-
tion to the pendulum signals, the temperature monitor is also fed to the A/D encoder).
The outputs of the A/D encoder are strobed into storage flip-flops, and then decoded
to provide the information to the stepper-motor/gear-train assemblies to drive the
gimbals. The A/D encoder provides four states of information about the X and Y
axes of the pendulums: polarity, which determines the direction to slew the gimbals,
and thresholds at ± 32 arc minutes, ± 7 arc minutes, and ± 3 arc minutes. The
gimbal-gear-train ratio is 2700:1 so that each 90 degree step command to the stepper
motor drives the gimbal 2 arc minutes. Above ± 32 arc minutes, the stepper
motors are slewed at a fast clock rate of 122 arc minutes per second; below ± 32
arc minutes, a slow rate of 7.6 arc minutes per second is used. Below ± 3 arc
minutes the motors are not slewed at all, and power is removed from the stepper
motors. The ± 3-arc-minute deadband is well within the ± 7-minute threshold at
which a gravity reading is enabled. On the moon, the gimbals respond to a 15-
degree step in less than 20 seconds with only one overshoot. (The response to a 1.5
degree step is shown in Fig. 5-1).
5.5 Multiplexer and A/D Encoder
The A/D encoder is a 4-bit successive approximation encoder. The pendu-
lum signals are scaled at 1-arc-minute-per-bit, so that full-scale output from the
A/D is the ± 7 arc minute information. Polarity is obtained from the sign bit, and
the ± 3-arc-minute deadband is determined by proper combinatorial logic. Thirty-
two-arc-minute information for switching between the fast and slow levelling modes
is obtained by using two level comparators, one at + 32 arc minutes and the other at
- 32 arc minutes. The output of the multiplexer feeds both comparators as well as
the A/D encoder, and the logic strobes the data out at the appropriate time to separate
the information for the two gimbal axes.
The encoder sampling rate is 244 Hz/channel which is higher than the fastest
slew rate of the gimbal (61 pulses per second). The stepper-motor driver consists
of a two-bit shift register. The clock to this register is either the fast or slow
clock. Below 3 arc minutes the clock is inhibited. The outputs of the two flip-flops
in the shift register are gated to provide the four phases for driving the stepper-
motor windings. The stepper motor is driven either clockwise or counterclockwise,
depending on the polarity information from the pendulum. The temperature-monitor
signal that also is fed to the A/D encoder is scaled to 0.0050 C per bit. Therefore,
temperature information up to ± 0. 0350 C is obtained. This temperature information
is strobed at the time a gravity measurement is made and then transferred to the
display along with the gravity information.
16

FLIGHT UNIT AT 1/16 G
STEPPING RATE 180 arc min/s
* SWITCHING POINT +32 arc min
I I I I I I - I I I IDEAD BAND ±2 armic/1
SWITCHING POINT -32 arc min
ALPHA - PENDULUM SIGNALTHETA .......... GIMBAL POSITIONPENDULUM DAMPING RATIO 1.7
I I I I
2 3 4 5
TIME (seconds)
Fig. 5-1 Response to a 1.5-degree step.
120
100
80
60
40
20
0
- 20
-40
E
I-
w
LJII-
Ia--j
I-
- 60
- 80
- 100
- 1200 1
II
III
II

5.6 The Phase-Locked-Loop Filter
Possible vibration resonances that might be experienced on the LRV are
believed to be at frequencies of one Hz and higher. The VSA difference frequency,
as was mentioned before, will be approximately 20 Hz on the moon and will vary
with gravity. To filter this signal by conventional methods, a very narrow band-
pass filter would have to be built and its center frequency would have to track the
VSA difference frequency. By using a phase-locked loop, the problems of a very-
narrow-bandpass tracking filter are eliminated and a low-pass filter in the loop
provides the required filtering. Vibrations applied to the VSA will appear as
frequency modulation on the string frequencies. Most phase-locked loops are
designed to track the frequency-modulation components on a fixed carrier signal.
In this case, it is desired that the loop attenuate the modulation and produce only
the carrier. In other words, the average value of the VSA difference frequency
over a period of time is sought. Gravity information is contained in only the very-
low-frequency bandwidth of the phase-locked loop.
Providing a narrow-band low-pass filter in the loop requires a very low
closed-loop gain in order for the loop to be stable. A low-gain loop provides a very
small lock-in bandwidth. In order to acquire the signal in a relatively short period
of time, the phase-locked loop was designed with two modes: a wide-band mode for
acquiring the signal and a narrow-band mode for filtering the VSA signal. The VSA
string frequencies are mixed and filtered in the phase-locked loop. A ring-diode
demodulator is used as the mixer, and a low-pass filter allows the difference frequency
to pass through, but attentuates the sum frequency (approximately 19 kHz) to below
1 mV. The filtered sine wave feeds a zero-crossover detector to provide a square
wave compatible with logic. (The divide-by-six circuit shown merely scales the
difference frequency for earth measurements to be approximately 20 Hz.)
The wideband filter feeds a sample and hold circuit. The narrow-band signal
is summed with the output of the sample and hold circuit into the voltage-controlled
oscillator (VCO). In the wide-band mode, the gain of the narrow-band loop is so
small that is has very little effect on the summation signal to the VCO. Some time
after the gravimeter has levelled, but about 30 seconds before the gravity measure-
ment begins, the phase-locked loop is switched from the wide-band mode to the
narrow-band mode. At this time, the sample and hold circuit holds the sampled
voltage into the VCO. The narrow-band loop now takes over. The purpose of the
sample and hold circuit is to determine the approximate bias voltage the VCO
requires at the time of a measurement. The narrow-band filter provides the remainder
of this voltage. The narrow-band loop provides in excess of 40-dB attenuation at one
Hz. This is achieved by using a two-pole Butterworth filter as the low-pass filter.
The closed-loop response of the narrowband loop is that of a third-order system:
0.68
s + 2.1s2 + l.ls +0.68
18

5.7 Temperature Control
A proportional plus derivative temperature controller maintains the precision
oven to within 0. 0050°C. The precision inner oven contains the sensors and heaters
as well as the VSA and its amplifiers. The sensors are two thermistors located in
opposite arms of a four-arm bridge. The bridge is excited by a regulated low-
voltage ac supply. The excitation is kept low and regulated to minimize the effects
of self-heating. The bridge provides an output of about 18 mV/°F to the temperature
controller. The bridge signal is amplified in a high-gain preamplifier. By providing
most of the gain ac, the problem of dc offset and drift is minimized.
After ac amplification, the bridge error signal is demodulated in a standard
diode-ring phase-sensitive demodulator. The demodulated signal is buffered and
scaled to a sensitivity of 50 mV/0.0050 C. The buffered signal is the temperature-
monitor signal that is sent to the multiplexed A/D converter to provide information
on the temperature controller. The demodulated output is also sent to the propor-
tional plus derivative stage which provides the drive for the heaters. The time
constant of this stage is adjusted to match the natural frequency of the whole system,
which in turn is determined by the system gain and the time lag between heater and
sensor.
The output stage consists of four transistors physically located on the pre-
cision oven structure. Thus, the heat of these transistors is utilized to heat the
structure. Heater resistance, half in the collectors and half in the emitters of the
four transistors, is distributed to make gains of the transistors less critical, and
also to provide a uniform heat distribution to minimize temperature gradients.
5.8 Power Supply
In order to minimize power consumption, all analog circuits are operated
from plus and minus five volts. Low-power TTL is used for the logic circuits
operating at +5 volts. The only exceptions are the crystal oscillator which needs
+12 volts, the stepper motor which requires +28 volts, and the LED display which
requires +4 volts. The high power consumers which are the stepper motors, and
the display are energized only when required. Thus, the average power is kept
down by minimizing the duty cycle.
In the STBY mode, plus and minus 5-volt supplies are provided for the VSA
oscillator amplifiers and the temperature controller. The heater is supplied with
current from the battery. Therefore, the load on these supplies is essentially
constant throughout the mission. The tight regulation of 0.2% is required to mini-
mize the voltage sensitivity of the VSA amplifiers, as well as to provide a constant
thermal load in the oven. Changes in supply voltage result in phase-shift changes
in the VSA amplifiers. A change in phase-shift between input and output will result
in an apparent frequency change and produce gravity-measurement errors.
19

To supply the temperature-controller excitation and demodulator reference,
a low-power Colpitts oscillator is provided in the power supply. The oscillator drives
a reference transformer that supplies the bridge excitation and demodulator refer-
ence, and also the pendulum excitation. Feedback is provided around the Colpitts
oscillator to regulate the output to within ± 1% over temperature excursions and with
battery variations. As with the 5-volt standby supplies, the ac loads are practically
constant. The Colpitts oscillator also feeds a sine-wave amplifier which drives a
flea-power chopper. The chopped signal is rectified and is fed to the -5-volt regu-
lator. The plus and minus 5-volt regulators are similar and use an integrated-
circuit regulator with low internal dissipation.
When switched to the ON mode, the flea-power chopper output is enabled to
a low-level chopper. This chopper contains the circuitry to supply the unregulated
input to the +12-volt regulator for the crystal oscillator and the -5-volt regulator for
the analog circuitry used in the gravity-measurement modes. The - 5-volt supply is
not provided to these circuits in the ON mode. In addition, two other +5 volt regulators
are energized in the ON mode. One regulator energizes the voltage-controlled
oscillator (VCO) in the phase-locked loop. The other provides logic power for the
mode-control logic and the BCD counter that stores the gravity measurement. The
VCO supply is kept separate to provide isolation and to minimize the amount of load
variation.
In the GRAV and BIAS measurement modes all the other power supplies are
turned on except for the light-emitting diode (LED) display supply. The +5-volt
logic supply is enabled to all the logic circuitry as well as the gimbal electronics and
A/D converter. The -5-volt supply that is generated by the low-level chopper is
supplied to the high-level chopper. This chopper produces 28 volts for the stepper
motors.
The display (READ) mode enables the 4-volt regulator to be turned on. This
in turn, drives the LED display. In addition, the +5 volts for the logic is provided to
the LED display to energize the integrated-circuit decoders that are integral with
the display units.
To minimize the possibility of asynchronous noise, the 4-kHz ac supply is
synchronized with a 3. 906-kHz clock from the binary countdown during the measure-
ment modes of operation.
20

SECTION 6
MECHANICAL DESIGN
The mechanical design of the Traverse Gravimeter is illustrated in Figs.
6-1 and 6-2. The magnesium outer structure of the TG is rectangular in shape with
a cylindrical front. A folding handle at the top of the instrument is used for hand
carrying and for latching the instrument to the isoframe assembly on the pallet.
Three feet at the base of the instrument provide a stable support for lunar-surface
operations. Flight photographs indicate greater soil penetration by these inverted
mushroom feet than was encountered during field-trip operation.
The outer surface of the TG is enclosed in a multilayered insulation blanket
which provides thermal protection for the internal components. This blanket
covers all outer surfaces with the exception of the display panel, radiator cover,
the three feet, and carrying handle already mentioned. Details of the mechanical
design related to thermal protection and temperature control are described in
Section 7. The display and radiator covers are held closed by magnetic latches
during lunar-surface operation and by Velcro strips during launch and translunar
flight. The hinges sewn into the outer layer of the blanket were model-airplane-
type pin hinges which have very low friction and no residual stiffness. Neither
cover assembly was mechanically connected to the instrument housing and thereby
did not compromise the thermal protection.
The isoframe assembly mounts to the rear of the TG and provides vibration
isolation between the instrument and the pallet. To secure the TG to the isoframe
assembly the two rear feet are placed in a cradle in the isoframe and the carrying
handle is folded to a latched position. During the translunar phase of the mission,
three shoulder pins secure the TG to the isoframe which is mounted to the geology
tool pallet. · Each shoulder pin is held in place by a PIP (spring-loaded ball lock)
pin, and each of these shoulder-PIP pin combinations is removed by a steel-wire
lanyard prior to deployment on the lunar surface. The shoulder pins require a
reasonably close fit to avoid generating high-frequency vibrations which would
negate the low-pass-filter benefits of the isoframe.
21

HANDLE ACAM/SPRONE HANITHERMA
INDICATOR MODE LIGHTFLASH- LevellingON- MeasureOFF - Measurement Complete
PUSH BUTTONS
.SS'YING ACTION
ND OPERATION RADIATOR COVERLLY ISOLATED
DISPLAY COVER
VIB
i X -
HAIPEN
THE
FWD LE,AFT LEG ASS'Y THERI
ISOFR
Fig. 6-1 Outline drawing of traverse gravimeter.
22

HANDLE ASS'Y RADIATOR
COLLECTOR
ON/STBY SWITCH
THERMALDISPLAY PANEL ISOLATOR
DISPLAY HOUSING RADIATION
MACHINING SHIELD
PUSH BUTTONS SIDE MOUNTHARD MOUNTEDFOR LAUNCH -THERMALLYISOLATED ONLUNAR SURFACEGIMBAL HOUSING
E FRAME/E-FRAME BASE HOUSEMODULES MACHINING
INTERMEDIATE OVEN SIDE COVER
PRECISION OVEN GEAR BOX
VSA THERMALISOLATOR/SUPPORT
VSAAMPLIFIER MODULES
LOWER SHELFBATTERY SUPPORTMACHINING
MAIN COVER
PHASE- LOCK- LOOPMODULE
BATTERY PACK ASS'Y
Fig. 6-2 Cutaway view of traverse gravimeter.
23

The isolators were selected and supplied by Barry Division of Barry Wright
Corporation, who also analyzed the performance of the isoframe system for all
probable input combinations including three-axis vibration, shock, and accelera-
tions.
Space and interface limitation prevented the use of the isolator case supplied
by Barry so special ones were fabricated. The resilient element was a moulded
elastomer called Barry "Hi-Damp. "* Figure 6-3 shows the effect of the isoframe
on the VSA response to the LM a-axis flight random vibration levels.
I
0
0z
0,
zm
ITo
z
20 100 200 1000 2000
FREQUENCY IN Hz
Fig. 6-3 Effect of rubber isolators.
A comparison of some of the predicted and measured responses can be found inmemo GRV-T-196.
24

As described in Section 3, the inner structure of the TG consists of a two-
axis gimbal system which contains a vibrating string accelerometer (VSA) housed in
and thermally protected by a two-stage oven assembly designed to operate in a
vacuum environment. The oven assembly is enclosed in an electronics frame (E
frame) assembly of similar structural design. The E-frame assembly is pivoted
about its axis and supported by a middle gimbal assembly. The middle gimbal con-
trols the vertical positioning of the inner gimbal over a + 15 degree range. The
middle gimbal assembly is coupled through bearings to the base housing and can
rotate from -15 to +195 degrees. Stepper motors and a gear train provide the drive
and positioning of the gimbal assemblies. The stepper motors react to signals from
pendulums which act as level sensors.
The dip-brazed aluminum gimbal was designed to act dynamically as a com-
pliant spring between the instrument housing and the E-frame assembly. The thin-
shell gimbal structure has a natural frequency of 80 Hz in the LM a direction when
loaded by the mass of the E-frame/oven assembly. The oven assemblies were
previously shown to have a lowest natural frequency near 180 Hz. Thus the gimbal
acts as a low-pass filter for isolating the VSA input axis from vibration.
The gear box assemblies (Fig. 6-4) reduce the stepper motor output by 2700
to 1 in four stages. Thus, one pulse to the stepper motor produces a gimbal shaft
rotation of 2 arc minutes. An antibacklash sector gear was attached to the gimbal
shafts in order to reduce angular position uncertainty while allowing for reasonable
manufacturing and assembly tolerances. Beryllium was selected for the gear-box
housing to more closely match the thermal expansion of the stainless-steel gears,
bearings, and shafts. Silicone oil was used for lubrication. These gear-box
assemblies operated under high-vacuum conditions for periods up to 2 weeks and
with temperature excursions of 100°F without difficulty. A teardown inspection of
FS-2, the qualification model rebuilt as a spare flight unit revealed the Y-axis gear
box had lost its antibacklash due to improper operation and running beyond the
sector-gear limits during a BIAS measurement. However, the gear box assemblies
showed no degradation from thermal-vacuum or vibration testing. Limit switches
and a cam on the sector gear protect the gimbal assembly from overtravel while
making normal gravity measurements in case the TG was initially more than 15
degrees from vertical or accidentally knocked over. However, the lack of a cam
in the inverted position of the Y-axis gear box made the gravimeter vulnerable;
when after being initially level during a BIAS measurement, the case was tipped
beyond 15 degrees during the measurement portion of this mode. The flight crews
were cautioned about this operational problem and an emergency procedure was
developed to reengage the gear train without anti-backlash in the event this problem
occurred on the moon, which thankfully it did not.
25

900 STEPPER MOTOR
MICRO SWITCHESJA
SECTOR GEARCAM
Fig. 6-4 Gear-box assembly, Y axis.
-- A
II

The limited-travel gear box design permitted the use of a flexible wire
harness to be run through the gimbal assembly, thereby eliminating the need for
slip rings and allowing the use of coaxial shielded cables for the two VSA string
outputs in addition to the multiplexer output. Ball bearings lubricated with silicone
oil were used throughout the gimbal design. These bearings were preloaded to 100
pounds during assembly because of the anticipated 13-g peak combined launch loads.
Ninety percent by weight of the mechanical parts were fabricated of mag-
nesium because stiffness rather than stress was the limiting design parameter.
All mechanical parts were machined from bar or tooling stock to reduce total
manufacturing time and tooling costs. As an example, one completed isoframe
could be fabricated in a week.
A detailed stress analysis of the instrument and isoframe was performed by
Littleton Research and Engineering Corporation. The analysis included static,
dynamic, and acoustic inputs. Summaries of this work may be found in reports
C-207-1 through C-207-5 from this company. Teledyne Materials Research
supported the design and analysis effort with mechanical testing of materials and
components. The results were transmitted in their biweekly letter reports.
27

SECTION 7
THERMAL DESIGN
The concept for thermal control of the Lunar Traverse Gravimeter Experi-
ment package is that the gravity sensing and other control elements are thermally
isolated from the outer environment while a discrete path is provided for rejection
of absorbed as well as internally generated heat. Inherent in the thermal design
are mechanical constraints of low weight and volume. This section summarizes
only the key points in the thermal design; many details associated with the thermal
design and its modeling will be found in Appendices C, D, and E.
7.1 Thermal Requirements
The basic requirements of the TG thermal design were the following:
(1) Control the temperature of the Vibrating String Accelerometer (VSA)
and critical measurement circuitry which is temperature sensitive to
a prescribed temperature with sufficient stability that temperature-
induced gravity errors are a small part of the total error budget of the
instrument. It was determined that the VSA should operate at approxi-
mately 1220F and remain within ± 0. 01C throughout a lunar extra-
vehicular activity (EVA) while the external environment can vary from
-100 to +250°F.
(2) Choose a battery size such that it is adequate for the worst possible
mission in terms of electrical power consumption.
(3) Provide an adequate thermal environment in which electronic compo-
nents and modules as well as mechanical equipment can function
reliably.
The thermal environments for which the TG was designed were specified by
two parameters:
(1) The predicted thermal response of the Lunar Module (LM) Quad III
geology pallet during translunar stowage in the hottest and coldest
missions. This information was supplied by Grumman Aerospace
Corporation, the Lunar Module contractor, based on computer model
28
predictions. Figure 7-1 is a plot of the worst-case hot, nominal, and
cold pallet temperature histories during translunar stowage and the
post-touchdown thermal soak-back period prior to instrument removal.
(2) Sun elevation angle with respect to the lunar horizon during the lunar
stay. These angles were specified for each type of mission at the time
of landing as follows:
Hottest Mission: 20.3 degrees
Nominal Mission: 13.3 degrees
Coldest Mission: 6.8 degrees
During the lunar stay, it was required that the TG ride on the rear of the
LRV pallet during periods of extravehicular activity (EVA). An additional degree
of experiment flexibility, however, dictated that the TG be easily removed from
and replaced on the pallet in case it was deemed necessary to make all gravity
measurements on the ground due to excess LRV motion. Therefore, two distinct
mounting configurations were required of the TG; the hard-mounted translunar
stowage ride which must withstand launch and lunar landing, and a less restrictive
removable mounting for the lunar phase.
-Once the LM had landed, initiating the lunar phase of the mission, it was
required that the TG be able to survive the hottest or coldest Quad III soakback
temperature history (Fig. 7-1) for a maximum period of 17 hours and function
during the remaining lunar phase. The 17 hours was predicated on a maximum of
16 hours from landing to astronaut egress followed by an estimated 1-hour period
before the TG was removed from Quad III. The subsequent lunar time line was
defined as a 6-hour EVA followed by two 7-hour EVA's with 14-hour rest periods
after the first and second EVA.
At no time during the lunar stay could the TG thermal-control requirements
impact the parking attitude of the LRV. Furthermore, it was of utmost importance
that the thermal control of the TG require a minimum of participation on the part
of the astronauts. Such an emphasis ruled heavily against a deployable sun shield
or open Optical Surface Reflectors (OSR's) which must be constantly dusted.
7.2 Thermal Design - General Description
The thermal design finally chosen for the TG employed two key uniquenesses
of the experiment to full advantage. First, the fact that the TG was easily remov-
able from the LRV pallet for gravity measurements on the lunar surface enabled the
instrument to be placed in the shade of the LM for cooling during rest periods.
Second, the gravity data which was read in real time from the TG display by. the
astronaut could also contain thermal information. With such information, the
29

HOT TRANSLUNAR HOT LUNAR ORBIT
l1COLD TRANSLUNAR COLD LUNAR ORBIT -n
160
140-
120
100
80
60
40
20
0 -
-20 -
-40 --400 20 40 60 80 100 120 140 160 180
TIME ( Hours)
Fig. 7-1 Quad III stowage pallet temperatures.
NOMINAL MISSION
U-
Lu
I--
(LrU
I-C3
-. .

acquisition of which caused immeasureably small impact to the astronaut's time
line, real-time recommendations could be made by ground personnel should the
instrument's function become in danger for thermal reasons.
Thermal control was obtained from the time of launch to the completion of
the lunar mission. During stowage in the LM Quad III, hard-mount pins penetrated
the protective outer blanket and yet did not compromise the control capability.
During the lunar phase the TG was designed such that thermal control was com-
pletely automatic during even the hottest or coldest EVA. At that time the unit was
completely enclosed by the thermal blanket, isolating it from the heat and dust of
the lunar environment. During rest periods, it was placed in the shade of the LM
and its radiator exposed to outer space for cooling. With the high radiative cooling
capabilities afforded by the LM shade during the relatively long (14-hour) rest
periods, the overall instrument thermal design centered on building sufficient
thermal isolation into the TG that it could survive the hottest EVA with no cooling
required for up to 7 hours while in the sun on the LRV pallet. Samples of the TG
thermal response are found in Appendix D.
Figure 7-2 will help to describe the thermal design and will be referred to
often in the following sections. Basically, the desired thermal isolation from the
external environment was derived by a double oven on the inner structure surround-
ing the VSA, both of which contain temperature-control capabilities. In addition,
the complete outer surface of the TG was enveloped by a high-performance multi-
layer thermal insulation system. The details of the whole design will be found in
the following sections.
7.3 Inner Structure Design
The TG inner structure refers to the Vibrating-String Accelerometer
(VSA), Precision Oven (P), and Intermediate Oven (I).
The precision oven is a thin-walled body of revolution which houses the VSA
and the VSA amplifier. Machined from magnesium stock, displaying fairly good
thermal conductance (5. 75 Btu/h-in. - F), this unit displays negligible circumfer-
ential temperature gradients with the low heat-flow rates involved. Because the
VSA dissipates a very low level of constant power (approximately 10 5 watts) it is
possible to use the P oven as the primary means for temperature control rather
than the VSA itself.
A 0. 65-watt electrical heater is bonded to each end of the P oven for thermal
control at 1220F ± 10°F with an accuracy of better than ± 0.009 0 F. A temperature
of 1220F (500C) was selected as the minimum sensor temperature which would
permit a heat-rejection temperature-control mode in the hottest environment. The
VSA is mounted with the P oven using an aluminum flange for good coupling. It is
estimated that with a vacuum of less than 10 torr, the thermal resistance between
the VSA and P oven is approximately 2°F/watt.
31

SYMBOLS
- - - BONDED OVEN HEATERS O ..... E FRAMEO ..... P OVEN 4..... MIDDLE GIMBAL
( ..... I OVEN ..... RADIATOR ASSEMBLY
7-oDISPLAY COVER / LEVEL/MEAS LITE
PALLET SUPPORTS
-RADIATOR COVER
BATTERY
(340 WATT-HR, 45 A-HR)
SILVER-ZINC
MULTILAYER INSULATION BLANKET
Fig. 7-2 TG thermal design cutaway.
32

Within the P oven, and thermally attached to the P-oven structure, is the
amplifier for the VSA signal. The heat-dissipating transistors (power transistors)
of the P-oven temperature controller are also mounted directly to the P-oven
structure. The VSA amplifier is housed herein for temperature stability. The
driver transistors are installed here in order to minimize the electrical power
required for temperature control and also to make the temperature-control cir-
cuitry behave in a linear manner.
The sensor for the P-oven temperature control is a four-arm ac bridge
employing two thermistors in opposite legs and Vishay reference resistors in the
other legs. The thermistors are imbedded in drilled holes in the lower half of the
P oven. The Vishay resistors are bonded to the outer surface of the lower half of
the oven. The resistance of the thermistors is a nominal 810 ohms at 122°F. The
bridge is powered by only 1.6 volts (rms) in order to minimize self-heating effects.
The resultant bridge output sensitivity is approximately 18.7 millivolts/OF. Addi-
tional details are found in the electronic design section of this report (Section 5).
The surfaces of all ovens are gold plated prior to the installation of heaters
and components. The thermal radiative emissivity of the plating was measured at
0.041. Gold was chosen for its low emissivity and resistance to tarnishing and
degradation by handling.
Immediately outside the precision oven is the cylindrically symmetric I oven.
The P and I ovens are thermally isolated from each other by three conically oriented
strings like three legs of a tetrahedron. These strings are tensioned titanium rods
(0. 040 inch diameter). Centered below the strings is a high-thermal-resistance
spring-loaded hollow titanium ball mount used to tension the titanium strings. Cal-
culations and test data both indicate that with a pressure of less than 10-3 torr, the
thermal resistance between P and I ovens is approximately 85°F/watt.
Under certain conditions during laboratory tests it was desirable in order to
simulate outer-space thermal control to have a vacuum within the I oven. Therefore,
the covers for the supporting strings and the I-oven flange are vacuum sealed with
O-rings. In addition, all wires fed into or out of the I oven passed through hermetic
feed-throughs. In this manner, a vacuum pump may be put on an opening in the
bottom of the oven and a good vacuum achieved. More will be said on this point at
the end of this section.
A 1.5-watt heater is bonded to each end of the outer surface of the I oven.
The heaters are activated in an on-off manner by a thermostatic switch when the
I-oven temperature goes below 600F.
Because the primary thermal isolation of the VSA from the outer world is
between the P and I ovens, this area is extremely sensitive to many effects. A few
will be mentioned.
33

Residual gas pressure within the I oven can lead to molecular conduction and
a degraded thermal impedance. Detailed mathematical analogs of the thermal paths
between the ovens showed that, at a gas pressure of 1 micron within the ovens, the
thermal resistance is reduced by approximately 17% over the value at zero pressure.
The gas may arise from adsorbed and absorbed molecules as well as evaporation of
volatiles such as adhesives. To minimize this problem, the ovens and all compo-
nents except the VSA are initially vacuum baked at elevated temperatures for
extended periods. In addition, after the VSA is installed the unit is kept under
vacuum as much as possible in order to avoid contamination and continue the
evaporative cleaning process.
A second effect, which caused major control problems, was that of the elec-
trical wires between the VSA and the I oven and between the P oven and the I oven.
The wires caused the three following problems:
(1) Wires between the P and I ovens seriously degraded the overall
thermal impedance.
(2) The presence of jacketed wires on the outer surface of the P oven
contributed to radiative coupling to the I oven.
(3) Wires between the VSA and the I oven were heat paths which made the
VSA temperature respond to shifts in the I-oven temperature, inde-
pendent of the P-oven controller.
The first problem was solved by employing long-length low-conductance
manganin wires between the ovens. The second and third problems were solved by
heat stationing to the outer surface of the P oven all wires passing from or through
the P oven. A low-emittance aluminum tape (3M Scotch No. 425) was used wherever
possible to cover and fasten all exposed wires.
A steady-state 36-node thermal mathematical computer model of the inner
structure was created in order to explain and enhance the performance of P-oven
temperature control. The model accurately predicted temperature gradients within
the P oven as a function of the I-oven temperature as measured on a well-instru-
mented lab mockup.
Historically, early in the design phase, an important thermal-design require-
ment for the TG was that following its last earth-based calibration,the VSA should
never cool down from its operating temperature until the lunar mission was complete.
It was feared that large VSA scale-factor changes would result from thermal cycling
if the unit were to cool down and reheat. It was originally planned that the unit
would be kept under laboratory thermal control until 2 days prior to launch, at which
time it would be placed in the rocket. For the 2-day period on earth and the remainder
34

of the mission, the TG would control its temperature by internal battery power.
In order to achieve this goal while employing the same battery and heater sizes, it
was necessary to maintain a high P-to-I-oven thermal impedance by keeping a
vacuum within the I oven while on earth. After launch, a puncture device would
break a membrane on the I oven in order to use the vacuum of space as a pump.
The vacuum within the I oven was also necessary for earth-based laboratory tests
in which it was necessary for test purposes to replicate the environment seen by
the VSA in a lunar mission.
A major problem was the achievement and maintenance of a good vacuum
within the I oven during the 2-day prelaunch period during which no I-oven pumping
was available. In order to achieve a good I-oven vacuum, the covers for the suppor-
ting strings and the I-oven mating flange were vacuum sealed with O rings. All
wires fed into or out of the I oven were sent through hermetically sealed feed-
throughs. A pumping port and removable vacuum valve were designed for the I
oven. As mentioned earlier, all components within the I oven, except the VSA,
were vacuum baked in order to drive off molecules which could later evaporate and
degrade the vacuum. An Indium and rubber O-ring seal in parallel were planned for
all I-oven O rings in order to combat the gas permeability of rubber. Periodic
titanium flash gettering was also contemplated as a means of enhancing the vacuum.
Due to an extension of the mandatory period on the launch pad to 7 days and
the unavailability of external power to Quad III of the rocket during that period, the
TG battery had to be either enlarged or the thermal mission requirements altered.
In parallel, however, with the TG thermal design, precise laboratory tests were
being conducted in order to determine the amount of the VSA scale-factor shift due
to a cooldown from 122 0 F to 650F and back again a week later. These tests showed
that the scale-factor shift was less than 5 parts per million; well within the instru-
ment error budget. In light of changing requirements and the above test results, a
decision was made to launch the instrument cold and have a pressure-actuated
switch turn the instrument on to the standby mode when the pressure within the TG
case dropped below approximately 0.2 atmosphere during the rocket ascent. The P
oven would then come under thermal control at 122°F within 3 hours. The long
translunar stowage period (110 hours minimum) would enable the VSA to stabilize
at its normal operating temperature prior to lunar operations. Laboratory tests
had further shown that a 2- or 3-day period was required for the VSA to stabilize
after a thermal transient in order to minimie VSA bias drift.
35

7.4 Gimballed Structures
Enclosing the I oven is the E frame, another cylindrical magnesium struc-
ture of similar design to the P and I ovens. The E frame is thermally isolated from
the I oven in exactly the same manner as that of the I oven and the P oven. A
thermal resistance of approximately 470F/watt was achieved with a pressure of less-3than 10 torr.
Between the I oven and E frame a thin thermal radiation barrier is placed in
order to enhance the thermal impedance (not shown in Fig. 7-2). The barrier is
vacuum formed from Lexan and subsequently coated with metallic aluminum by
vacuum deposition. The barrier helps to reduce the radiative coupling between
jacketed wires and high-emittance portions of both the I oven and the E frame. The
barrier contained numerous holes owing to the presence of the pendulums on the E
frame and other protuberances on both structures.
As shown in Fig. 7-2, two electronic modules are placed on each end of the
E frame. While in the standby mode of operation, only the temperature-control
module dissipates electrical heat. While the operate and measure modes, all other
E-frame modules are electrical heat sources. Even though the E frame is not as
well isolated as the I oven, it will undergo temperature changes much attenuated
from those of the outer housing. It is for this reason that the E frame was chosen
for some of the analog electronics; which includes the amplifiers for the two, two
degree-of-freedom pendulums and the P-oven temperature-control circuitry.
After the analog signals are amplified in order to minimize errors, they are also
multiplexed at the E frame. They are then sent to the analog-to-digital converter
on the housing.
External to the E frame is the Middle (M) gimbal, which houses the axis
drive for the E-frame trunnion. The M gimbal is a gold-plated thin-walled
aluminum sphere with cutouts for the E-frame modules. It is a trunnion which is
bearing-pivoted to the side walls of the external housing. The thermal impedance
between the E frame and the M gimbal and between M gimbal and case were both
measured to be approximately 9° F/watt. This value takes into account the parallel
heat paths of radiation and conductance across the bearings.
7. 5 Radiator
A major mode of heat expulsion from the instrument is via an external
surface radiator. The external radiator has a surface area of 12 square inches to
radiate to space. The surface is formed by contigously bonding segments of second-
surface mirror material (fused silica) to a substrate of aluminum. The surfaces,
when newly manufactured, display an absorption coefficient to solar energy, a s , of
0. 083 and a normal thermal emittance of 0. 842. When covered with lunar dust and
36

subsequently cleaned with a soft bristle brush, tests indicate that the resultant solar
absorptance, a s , is less than 0.2.
If the radiator were not covered during times of LRV motion and local astro-
naut activity, it was felt that lunar dust would soon coat its surface and drastically
increase its solar absorptance. Constant radiator dusting by the astronaut was
deemed too time consuming. Secondly, if it were a cold mission, in which excessive
internal battery energy was being consumed for heat, an uncovered radiator would
drastically increase this consumption. Therefore, for dust protection and mission
flexibility a dust cover was designed for the radiator. Because the TG could
accept all heat inputs both radiative and electrical during an EVA with no required
cooling, the only time the radiator dust cover would be opened was for cooling
during rest periods in the LM shadow. In the LM shadow, however, the low a s of
an OSR is not necessary because there is no solar radiation. For this type of
mission the radiator could be a painted black surface with high values for both ces
and EH. It was, however, decided that for contingency purposes only a backup
means of deriving a level of cooling in the open sunlight should be incorporated.
Thus, the inclusion of the OSR's on the radiator surface.
The 12-square-inch size was selected such that the astronaut could employ
one standard operating procedure for both hot or cold thermal missions. In a cold
mission, though, a larger radiating surface with the instrument in the shade of the
LM could lead to overcooling and excess battery energy consumption.
A study was made to observe the effects of the presence of the LM on TG
radiative cooling during rest periods. It was found that for the worst possible TG
location in the LM shadow, the I-oven temperature was 50F hotter at the end of the
lunar mission than if the LM presence were neglected. This effect was deemed of
small order.
Part of the design of the radiator involves the transfer of energy from within
the unit to the radiating surface. The design requires that the heat being liberated by
the E frame be radiatively absorbed by the spherical shell which envelopes the upper
surface of the E frame. In order to maximize this coupling, the inner surface of the
hemisphere was painted flat black and the end surface of the E-frame modules was
of a black electronic conformal coating. The heat received by the hemisphere is
conveyed to the external radiating surface via a hollow rod of aluminum with a
cross-sectional area of approximately 0.1 square inch. At the top surface, this
rod attached to the 12-square-inch rectangular radiating area to which the second
surface mirrors are bonded (see Fig. 7-2).
Considerable design effort was expended in mechanically mounting and yet
thermally isolating the radiator assembly from the case structure such that as the
37

radiator expels heat it draws a minimum from the outer housing. High-strength
epoxy fiberglass laminate (NEMA G-10) material was used for three hemisphere
mounts and two upper radiator mounts. A net thermal resistance of approximately
390 F/watt was achieved between the radiator assembly and the case.
7.6 Case and Case-Mounted Electronics
The outer case structure is composed of basically two distinct parts: the
base housing on which all mechanical components are mounted, and the case covers.
All such parts, fabricated of magnesium, are buffed and gold plated on the inner
surfaces and nonbuffed gold plated on the outer surfaces.
The base housing itself is machined from a solid piece of magnesium and
has an average wall thickness of approximately 0.060 inch. For the heat-flow rates
involved in the TGE, the case was found to be approximately an isothermal boundary.
In order to provide a smooth surface on which the multilayer insulation
thermal protection system or blanket could readily mount, the recessed areas on
the outer surface of the base housing were filled with a semirigid light-weight foam,
and all screws were flush flat-head screws. All mounting holes for external
members such as feet and handles contained flanges that were flush with the outer-
housing dimensions. In general, the inner portions of these penetrations were
raised bosses on the inner-case surface.
The case itself acts as a heat sink for three heat-dissipating electronic
modules; the power supply, crystal oscillator, and logic-display analog-to-digital
(A/D) converter. Table 7-1 lists all module powers in different operating modes.
A portion of the power supply contributes heat throughout the mission in the standby
mode in order to provide power for P-oven bridge excitation. In the operate and
measure mode, considerable power-supply heat is dissipated. Negligible heat is
dissipated at the crystal oscillator during only operate and measures modes of
operation. The logic-display A/D converter dissipates no power in the standby
mode, low power while in operate mode, but considerable power during measure
and display modes.
The nine-digit display employs light-emitting diodes (LED's) which exhibit
a decreasing light output intensity with increased temperatures. At temperatures
of 175°F the output intensity of most LED's is approximately half the value emitted
at 750 F. Because of the high level of ambient light on the moon in sunlight, combined
with the visually degrading effects of the astronaut's helmet sun filters, it is of utmost
importance to maintain a high value of LED light output. The large mass of the dis-
play module was used as the immediate LED heat sink. Special LED mounting sur-
faces were machined on a thickened portion of the aluminum display-module housing.
The module was itself well coupled to the TG case as a heat sink. By such action,
38

TABLE 7-1
ELECTRICAL POWER DISSIPATIONS (IN WATTS)
Operation TRAVERSEMode Standby Measure Displayve. of Operate
(Stowage, Operate (Incremental (Dur15-second andMeasure plusSoakbackAmount) Display for 10
and Rests) (Incremental) DspaModule Meas/Trav
VSA Amp and Sensors 0.030 0.030 - - 0.030
E Frame
Temp Controller 0.0175 0.0175 - - 0.0175
2 Pend Amps 0.002 0.002 0.018(195s) - 0.0036
Multiplexer 0.023 0.023 - 0.023
2 Pendulums 0.0028 0.0028 - - 0.0028
1/2 Stepper Motor 2.7 (15 s) - 0.0187
Total (E Frame) 0.0453 0.0453 - - 0.0682
Middle Gimbal
1 Stepper Motor -. - 5.4 (15 s) - 0.0374
Case Mounted:
Logic-A/D Display - 0.258 1.9 (195 s) 11.158 0.5075
0.025Xtal Osc. - 0.025 0025 - 0.02725
(195 s)
Power Supply 0.127 0.776 (195 s) 8.538 1.087
1/2 Stepper Mode - - 2.7 (15 s) - 0.0187
Total (Case) 0.127 1.059 - 19.696 1.64045
Phase-Lock Loop - 0.495 0.04 0.4990. 0.499(on Battery) (195 s)
Indicator Light _ 0.33 (15 s)(In Display Cover) +
1.3?5(180 s)
TOTALS 0.2023 1.6293 - 2 2 3558
39

the modules were kept well within acceptable limits for all types of thermal
missions. More details on the mechanical design of the display are included in
Section 8 where human-factors design considerations are discussed.
A thermal constraint was, however, imposed on the use of the display. Each
time the data was displayed for approximately 15 to 18 seconds the LED's would
dissipate in excess of 11 watts of power very locally. In development tests, it was
found that near the LED location the temperature would rise approximately 5 F per
display reading. Right at the LED's the temperature change was not known but was
felt to be considerably higher. Therefore, for reliability and maximum LED per-
formance, it was recommended that no more than two successive displays be
initiated. If a third display was required, a wait of at least 2 minutes is necessary.
7.7 Battery and Phase-Locked Loop
The TG power source is a 45 ampere-hour (nominal 7.5 volts) silver-zincsecondary (rechargeable) battery. It is placed in the bottom portion of the TG for
mechanical stability. The battery size is dictated by the power requirements for
thermal control in the worst-case cold mission.
Because the battery exhibits a sensitivity to temperature, efforts were
made to control its thermal environment. At high temperatures, self discharge
within the battery posed a problem on overall life expectancy. An easily achievable
design goal of keeping the temperature below 125 F was specified. At low tempera-
tures, the cell voltage decreases, again limiting the amount of energy that can be
derived. More important, however, is the fact that in the TG certain voltage
regulators require a minimum driving voltage in order to function. As a result, a
minimum battery temperature of 40°F was specified. To ensure this, a 1-watt heater,
controlled in an on-off mode by a thermostat, was installed in the battery. The
maximum duty cycle on the heater, under the coldest conditions, was estimated to
be approximately 2/3rds, leaving a 50% heater power margin. An overly large
heater was not selected for fear of causing large voltage changes at the battery when
turned on. Such changes could potentially influence the sensitive electronic control
and measurement circuitry on the inner structure. This same fear existed on the
heater selection for the I oven. In selecting the battery heater it was estimated that
battery self-heating due to internal resistance was negligible. Because the battery
contained a heater it became a factor in the system power budget, necessitating
good thermal isolation from the surrounding case structure.
The temperature-sensitive phase-locked loop filter was mounted to the
upper surface of the battery in order to achieve thermal stability. The phase-locked
loop is sensitive to rates of temperature change during a measurement and not to
the value of temperature itself. It was located on the battery for three reasons:
40

(1) It is too large to put on an inner structure member or E frame.
(2) It could take advantage of the large thermal mass of the battery in
order to minimize its time rate of temperature change.
(3) It's own electrical power dissipation can augment the battery control
power required in a cold mission, minimizing the total energy
consumed.
A maximum rate of temperature change of 0.020 F/minute was obtained.
The presence of the phase-locked loop further emphasized the desire for the thermal
isolation of the battery from the case. The battery itself was mounted to the case
with hollow plastic (NEMA G-10) standoffs which exhibited a total thermal conduc-
tance of 0.092 Btu/h. 0 F. The outer surface of the battery was buffed and gold
plated. The phase-locked loop module was potted within its housing and covered
with low emittance aluminum tape in order to minimize radiation interchange with
the case. The total radiative view area from battery/phase-locked loop and the
case was approximately 0.0587 square feet; which, when combined with the thermal
mass resulted in a first-order thermal time constant of 75 hours relative to the
TGE case.
7.8 Multilayer Thermal Blanket
All external surfaces of the TG are covered with a multilayer thermal
protection system or blanket designed jointly with, and fabricated by, the Arthur D.
Little Company of Cambridge, Massachusetts. The blanket is a critical component
in the thermal performance of the TG because it minimizes the thermal response
of the case to external thermal changes and therefore enhances the performance of
not only the critical inner structure, but also the case-mounted modules. In an
instrumented test, the thermal blanket displayed an overall effective emittance
(including covers) of less than 0.01. This effective emittance can be seen in the
following radiative equation for heat flow rate as a function of temperature differ-
ence:
4 4q = eAff (T-T 4)(7-1)q= oA s eeff (Ts c Tase
where
eff = blanket effective emittance
A = blanket surface areas
Ts = blanket surface temperature
Tcase TG case temperature
a = Stefan-Boltzmann constant
41

The above emittance produced an equivalent linear conductance through the blanket
of approximately 0.07 Btu/h -0 F at a 1000 F case temperature.
The body of the blanket is 3/8-inch thick and contains 10 layers of double
aluminized mylar, each layer of which is spaced apart by 2 layers of dacron bridal-
veil material. The outer surface of the blanket is an enclosure of 3.2-ounce-weight
blue dacron cloth for abrasion resistance and as a container for the blanket itself.
The blanket assembly is basically two separate pieces which mate at a part-
ing line around the lateral surfaces of the TG. In order to assemble the blanketto the TG, first the top portion of the blanket is installed as a unit. Subsequently
the TG is inverted and the lower portion is interwoven at the parting line layer-
by-layer. The parting line itself is distributed in the form of five staggered steps
of 2 aluminized layers per step over a distance of approximately 1.5 inches. This
means of assembly is simple and yet minimizes radiative leakages at the parting
line. The parting line of the outer dacron cover is sealed by a hand lacing with
nylon cord. Lacing is employed in favor of a zipper because it is less bulky.
An important feature of the blanket is the fact that the three push-buttons in
the display area are activated by pushing on the outer surface of the blanket in 1-
inch circular spots labelled BIAS, GRAV, and READ. The force for button depres-
sion is transmitted through the blanket itself. This design feature minimizes
blanket penetrations and therefore heat leaks.
In order to provide the force for button activation with minimum compression
and damage to the blanket, the button areas contain discs of rigid foam stitched into
the blanket. Good blanket fatigue life with such a design was observed.
The main body of the blanket has four large and eight small penetrations.
The large penetrations are for the display and radiator, over which hinged covers
are sewn; and the two ends of the outer gimbal mounts, over which removeable cups
are fastened. The display and radiator covers are fabricated of five layers of
vacuum-formed vacuum-coated polysulfone plastic spaced apart by a low conductance
rigid foam. The covers overlap the main body of the blanket by approximately one-
half inch in order to minimize thermal short circuits by the blanket surface. The
covers are pivoted on plastic hinges stitched into the blanket itself and fastened to
the covers. The launch-load hold-down for the covers is by a removeable orange
velcro piece which is discarded at the lunar surface. The cover fastening for
lunar operations is by a soft magnetic latch which provides a latching force of
approximately twice the earth weight of the cover. This latch is not strong enough
to overturn the TG when the covers are opened while the TG is resting on the lunar
surface. The display cover is held open by an arm which bears a magnet that
contacts a pole piece on the top surface of the blanket when the cover is pivoted 90
degrees.
42

A light is mounted in the top surface of the display cover which indicates
when the instrument is levelling itself (flashing light) and when a measurement is
being made (solid light). The light is mounted to an aluminum heat sink which
distributes the electrical heat throughout the top of the display cover.
The other large penetrations to the main blanket body are the outer gimbal
mounts. These cup-shaped covers also consist of five layers of vacuum-formed
vacuum-coated polysulfone plastic with each layer separated by two layers of bridal
veil and a layer of double aluminized mylar. The gimbal-mounted covers are
separate portions of the blanket which are installed as the layers of the lower portion
of the blanket are installed.
The eight small blanket penetrations comprise three hard-mount penetrations,
two of which are used for soft mounting during lunar operations; two handle pene-
trations, and three bottom penetrations for the feet. The following is a tabular
breakdown of the heat leaks through the blanket due to the small penetrations:
Penetrations Quantity Conductance (Btu/h- F)
Hardmount/Softmount 3 0. 0066
Handle 2 0. 00372
Feet 3 0. 0046
Total 8 0. 0149
It can be seen that the penetration conductance is small compared to the equivalent
blanket conductance of 0.07 Btu/h-°F.
Polysulfone plastic was chosen for all vacuum-formed portions of the blanket
because it exhibits good strength properties up to a temperature of approximately
3250 F. Lexan plastic was ruled out because its softening temperature is approxi-
mately 280 F. It can be seen by an analysis in Appendix C that thermally black
adiabatic vertical surfaces looking at a flat hot moon can attain temperatures of
close to 280°F when receiving simultaneous solar input and radiation from the moon.
The sun elevation angle at which one would obtain a maximum temperature on a
vertical adiabatic surface much like that of the blanket is 26. 6 degrees. All TG
missions, whether cold or hot, could have been exposed to this sun elevation angle.
It was feared that either the side cones or the front of the display cover could
soften and distort under such conditions. As a result polysulfone plastic was
adopted for all plastic parts of the blanket.
43

7. 9 Visual Thermal Performance Indications
Based on the interface information provided by the Grumman Aerospace
Corporation specifying temperature bounds on the Quad III LRV pallet (Fig. 7-1)
the thermal design as described was very adequate to achieve the mission require-
ments. It was, however, desirable to receive positive confirmation of thermal
performance during a real mission. In addition, if the interface temperatures were
altered late in the program or in error, the thermal mission could be marginal or
in jeopardy. Furthermore, the real-time ability to implement lunar-surface con-
tingency procedures pointed out the need for knowledge of the TGE thermal conditions
and safety margins.
As described earlier, the fact that the astronaut would manually read gravity
data and voice it to earth in real time provided a simple means of simultaneously
receiving thermal information. The last two digits of the nine-digit data display
were chosen as coded thermal information. The coding is given in Table 7-2. The
eighth digit codes both the sign of the ninth digit and four gross thermal conditions
on the instrument; nominal, cold, warm, and very warm. None of the eight-digit
indications can alone specify a failure or even a time of failure. They can, however,
give an excellent indication of the general thermal health of the instrument. If the
time is known when the indication changes from one condition to another, as will be
seen later, thermal-math models enable the prediction of the safety margin or the
expected time before a thermal failure occurs.
A cold indication is registered by a thermostat on the battery which activates
for temperatures below 47°F. This thermostat is the second one found on the battery.
Using one for control during a cold mission and one for cold-mission indication
eliminates electronic logic which would be associated with the 400F control thermo-
stat. The battery was selected for the cold-alarm switch because in a cold mission
the battery energy output and the control of its own temperature is of major impor-
tance.
The warm indication is derived from a thermostat mounted on the I oven
which closes for temperatures in excess of 950 F. If such an indication is seen, it
is felt to be a good sign in that the unit is not in danger of overheating and yet
minimizes battery energy required for heating.
If the battery temperature is above 47 F and the I oven is below 95°F, a
nominal thermal mission is indicated. This is the most desirable type of mission
from a battery-power and thermal-control point of view and is indicated by either
a zero or one in the eighth display digit. A zero was observed throughout the
Apollo 17 lunar mission.
44

TABLE 7-2
TEMPERATURE ALARMS AND CODES
EIGHTH DIGIT NINTH DIGIT
Shift of P-Oven Temperature From OriginalDigit I Oven (T I) Battery (T B ) Set Point
60 < T < 950°F
60 < T I < 95°F
60 < T I < 95°F
60 < T I < 95°F
95 < T I < 110°F
95< T I < 110°F
110°F < T I
110F < T.I1
47°F < TB
47°F < TB
40 < TB < 47°F
40 < TB < 470 F
47°F < TB
47°F < TB
47°F < TB
47°F < TB
+ 0.009°F
- 0. 009°F
+ 0.009°F
- 0. 009°F
+ 0.009°F
- 0. 009°F
+ 0.009°F
- 0.0090F
per unit of ninth
per unit of ninth
per unit of ninth
per unit of ninth
per unit of ninth
per unit of ninth
per unit of ninth
per unit of ninth
digit
digit
digit
digit
digit
digit
digit
digit
(.1-

The very warm indication (6 or 7) is again derived from a thermostat on the
I oven which activates when the temperature is nominally above 110 0 F. This alarm
is included primarily to indicate the status of the I oven immediately upon removal
of the TGE from Quad III. If the I-oven temperature is above 110OF at the beginning
of the first EVA it was a mission rule that the astronaut place the TG in the shade
of the LM and not take it on the first traverse. At the completion of the first EVA
and rest (20 hours total),the TG I oven should have cooled below 110F such that
it should be able to complete the remainder of the mission normally.
As seen in Table 7-2, the 9th digit of the display represents how many
increments the precision oven temperature has deviated from its nominal set point.
Each digit represents an increment of 0.0090F. The sign of this increment is coded
into the eighth digit.
During the flight of Apollo 17, personnel from both NASA and MIT, who were
cognizant of every phase and function of the TG, were present in Mission Control in
Houston. Any anomalous temperature behavior, as shown by the 8th and 9th digits,
could have been interpreted by these personnel and recommendations made.
7.10 Apollo 17 Mission - Thermal Results
The Apollo 17 mission finally launched at 0:33 hours (EST) on 7 December
1972 after a 2-hour-40-minute hold. The translunar stowage thermal prediction,
shown in Fig. 7-1 was supplied by Grumman personnel in real time. The timeline
is completely nominal in that time lost during the launch pad hold was made up
during the translunar phase. It can be seen that at the time of landing (14:55 hours,
EST, 11 December 1972) the LRV pallet temperature was estimated to be 24°F.
Premission thermal predictions for a nominal mission (see Fig. 7-1) estimated that
the pallet temperature at landing should be approximately 27 F.
Figure 7-3 is a computerized estimate of the lunar mission thermal response
from the time of landing based on the initial conditions established by the full trans-
lunar stowage history. It can be seen that approximately 5 hours after landing, the
TGE was removed from Quad III, the hardmount pins removed, and the unit placed in
the operate mode for EVA 1. At no time during the lunar mission did the I-oven
temperature reach 95°F to indicate a warm mission, nor did the battery temperature
drop to 47°F to indicate a cold mission. The mission was completely nominal. This
fact was borne out by every lunar surface data reading for which a zero appeared in
the eighth display digit every time. The ninth digit was similarly constant during the
lunar mission, always reading a digit one. Thus, it is concluded that Apollo 17
experienced a slightly colder than nominal mission and the P oven controlled within
0. 0050 C throughout the lunar mission.
46

140
130130VEN (1) Translunar Stowage Pallet
History Supplied by Grumman
120 (2) C (case/pallet) = 0.032 Btu/h-°F
I-OVEN VERY WARM REGION \ ' 3 H110 I-OVEN VERY W '-(3) 5-Hour Quad III Soakback110
(4) Landing Sun Angle =13.30
100 / / / / / I.OVEN WARM REGION/100LL
7
- 90-
.--
SOAKBACK
40TTRYC /CLD RGION
70
0 10 20 30 40 50 60
TIME (hours after lunar landing)
Fig. 7-3 Apollo 17 lunar mission computerized thermal response.
47

SECTION 8
HUMAN FACTORS
Flight-crew-operation considerations impacted the gravimeter design in
several areas besides the obvious size and weight constraints. The two prime
human-factor-engineering problems were the development of the instrument display
panel and the latch for securing the gravimeter to the isoframe on the geology pallet.
A red light-emitting diode (LED) display was selected early in the program
for low-electrical-power requirements for light-emitting efficiency and for direct-
drive compatibility with the digital logic. A display breadboard was built and tested
in a brightly sunlighted ambient. This breadboard demonstrated several serious
problems in visibility (readability). These problems consisted of several different
characteristics but could be grouped together as exhibiting poor display "contrast"
under the test conditions. The objectionable characteristics observed were:
1) bright first-surface reflections from the faceplate, 2) objectionable secondary
(internal) reflections, 3) poor background color (white/grey) of the LED background,
and 4) internal light scattering.
Readability of a display can be expressed by measuring the brightness of a
display and the brightness of the background and comparing them as a ratio. This
ratio is called "contrast." More specifically, contrast (C) is
B 1 - B 2C 1 (8-1)B
where
B 1 = the brightness of the LED characterB 2 = apparent brightness of the background
From this equation, contrast can be improved by increasing the brightness of the
display or by decreasing the apparent brightness of the background.
A red or grey filter is normally used for this type of display to suppress the
undesirable characteristics noted above. However, a filter of this type absorbs 75
to 90% of the light emitted by the LED. The traverse gravimeter display could not
48

tolerate a loss of this magnitude under the brightly sunlighted ambient of the lunar
surface. A display system was utilized which uses no light absorbing filters.
Figure 8-1 illustrates the design features of the gravimeter display panel.
In order to enhance contrast, B1 was increased by selecting LED's for maxi-
mum light output (efficiency). This increased the brightness by 50%. The apparent
background brightness, B 2 , was improved by using a dark substrate and coloring
the adjacent microcircuitry black. The first-surface external reflections were
minimized by tilting the display faceplate 20 degrees to the Line of Sight (LOS).
The reflection of the observer's LOS was thereby directed to a black surface (the
underside of the display cover). The LED display was recessed into the traverse
gravimeter so that the observer was looking into a shallow dark well. This limited
the observer to a 20 degrees viewing angle but greatly enhanced the readability.
The stray light in the system was trapped in a seven-layer baffle (see Fig. 8-1).
Finally, the scattered light from the LED was minimized by painting the LED
package exterior black except for a small viewing window.
Field test results indicated the gravimeter display was difficult to read when
not shaded from direct sunlight-or under bright diffuse lighting conditions. No
trouble was anticipated during lunar operations because there would be no atmos-
phere and shadows would appear black. During the mission debriefings, the crew
was asked for their comments which confirmed our design assumptions. Indeed,
the crew said they would recommend this type of display for future spaceflight
applications. By careful attention to preserving light transmission and enhancing
contrast, a light-emitting diode can be designed for a high ambient-light background.
The mounting system which attaches the traverse gravimeter to the isoframe
has two modes of operation. The first is the launch/boost phase or "hard mount"
and the other is the Lunar Rover phase.
In the first, the traverse gravimeter is rigidly attached to the isoframe by
means of stainless-steel mounting pins secured into stainless steel bushings in the
TG base housing by means of ball-lock (PIP) pins. (The ball-lock pins and mounting
pins are connected by a lanyard which is pulled by the astronaut.)
There are three bushings in the base housing; one in each side, and one in
the bottom. No effort was made to thermally isolate the traverse gravimeter from
the pallet in the launch/boost mode, but provisions had to be made in the mounts to
provide this isolation on the moon.
Fastened to each bushing is a thin walled (0. 030-inch) tube made of laminated
epoxy glass (NEMA G-10). When the "hard" support pins (concentric with the G-10
tube) are removed by the astronaut, the two side mounts "drop" a small distance
(0. 020 inch) and come to rest on small lips of the support fitting mounted on the
49

20 VIEWING CONE(FIELD OF VIEW) '
( O VIEW) -PRIMARY REFLECTIONSOF SUNLIGHT & HELMET
VISOR IMPINGE UPONBLACK SUNSHADE
SOLAR ELEVATION ANGLE iDISPLAY /150 NOMINAL . .I PA TE
I I f('WTT3A DLED PACKAGE
DISPLAY
SECONDARYREFLECTIONS
Fig. 8-1 LED numeric display technique.

isoframe. These side mounts provide thermal isolation between the traverse
gravimeter and the isoframe, and at the same time provide structural support for
the Lunar Rover environment.
The carrying handle is used to secure the traverse gravimeter in place on the
Rover (see Fig. 8-2). A cam is fastened to the pivot portion of the handle which is
free when the handle is vertical. When the handle is rotated (about 45 degrees for-
ward) the cam comes in contact with a spring (on the isoframe fitting). When the
handle is in contact with the isoframe, the spring is "over center" on the cam, and
a lug on the spring comes in contact with the NEMA G-10 side mount. Thus,
upward motion of the traverse gravimeter is prevented by this attachment. To
release this lock, and remove the TG from the Rover, the astronaut must rotate
the handle to the vertical position.
Fig. 8-2 Gravimeter ready for EVA 2.
51

To prevent rotation of the traverse gravimeter about the side mounts the two
back feet (of the TG) are restrained by brackets mounted on the isoframe. System
constraints were due to operational, thermal, and volumetric requirements (both
on the Rover and in the LM).
Operationally the requirements were for one-hand operation (by the astronaut)
in removing and installing the traverse gravimeter. The release forces of the
handle and pins were subject to astronaut approval.
The design was influenced by thermal consideration because of the thermal
isolation required on the moon. Also, a minimum number of penetrations through
the thermal blanket was essential. The handle had to be mounted to the TG by
means of a thin-walled NEMA G-10 cylinder, since it contacted the isoframe.
There was also a volume constraint. The volume in the LM storage area was
bounded by the pallet carrying handles. Thus, the handle on mounts could not
exceed those limitations. On the Rover, another restraint was the clearance
required between the traverse gravimeter blanket and the Rover fender, when the
pallet was rotated 90 degrees. Because of this, the TG (and the mounting system)
had to be located as close to the pallet as possible.
The gravimeter was removed from the Rover six times during the flight.
The flight commander commented during EVA 1 that remounting the gravimeter was
a "piece of cake. " During EVA 3, Captain Cernan mentioned that the accumulation
of lunar soil (dirt) was making "even the gravimeter" more difficult to relatch.
The gravimeter attachment proved very reliable as on previous field trips over
rough terrain. When the geology pallet swung open, while the crew was driving the
Rover between Station 9 and the Lunar Module, the traverse gravimeter remained
secure although other tools were lost as the tail gate undoubtedly swung back and
forth against its stops.
52

SECTION 9
INSTRUMENT ERROR ANALYSIS
The gravimeter error analysis describes the component constribution to
system errors. The analysis takes into account all known major error sources.
9.1 Background Notes
The vibrating-string accelerometers produce a signal (the difference fre-
quency of the two string outputs) that can be expressed as a series in gravity.
Af = f-f = K + Klg + K 2g + K 3 g +... (9-1)
where
Af = difference frequency
Ko = bias (Hz)
K scale factor (Hz/g)1 2K = 2nd order correction term (Hz/g 2 )
2 3K = 3rd order correction term (Hz/g3 )
For the data reduction, K2 and K 3 will be used (higher order terms are
negligible), but for the error analysis, we can consider
Af = K 0 + Klg (9-2)
In the instrument error budget, K0 is called the VSA "bias" and K1 is the
"scale factor."
9.2 VSA Shock Sensitivity
We can find the VSA sensitivity to mechanical shocks as follows:
Af - K 0
g K1 (9-3)
g K 129.1 (AK 0 ) for K1 constant (9-4)1
53

K0 7.21A Kg 2 ( 1) (AK 1 ) for K0 constant (9-5)
K1 (129.1)
To keep the absolute error in a gravity measurement less than 5 mgal,
therefore, the scale factor shift during launch must be less than 0.012 Hz/g.
Launch vibration testing indicated that a worst-case scale-factor shift was 0.0003
Hz/g, so that this term can be reasonably ignored.
To keep the same 5-mgal error however, the bias shift would need to be
less than 0.00065 Hz. Since vibration testing indicated this shift is quite possible,
provision was made for measuring and updating the bias on the moon to correct for
a launch shift.
(Field tests indicated that Rover vibration and gravimeter deployment were
below the threshold for causing bias shifts, and normal procedures did not plan for
bias updates at each traverse station. Post-flight analysis implied, however, that
Rover-deployment shifts were the greatest error sources although no exact cause
could be found.)
9.3 ABias (VSA)
This is the random portion of the bias term which is not reflected in the
linear bias drift equation. The 1a value of this term is provided by regression
analysis of bias as a function of time on actual VSA's which are temperature
controlled to about ± 0. 001°C. A typical value of the ABias is 0.1 mgal for a good
instrument.
9.4 ABias as f (T) (VSA)
This term is the change in bias due to change in temperature of the VSA.
Assumption is that the actual temperature of the VSA is the indicated temperature
± 0.01°C and is equally likely to be anywhere in that range.
0.02 .006 0 C = T (9-6)
A typical value of the temperature sensitivity of bias is 5 mgal/°C for a
good instrument. Therefore, the 1a value fonABias f (T) is (0. 006) (5) = 0. 03mgal.
For a uniformly distributed random variable between a and -a, the standard devi-
ation is 2aVrl
54

9.5 ASF
Determination of the linear scale factor by a least-squares regression to
actual data taken from good, but typical, VSA's leaves a random portion unaccounted
for by the regression equation. The la value for SF is 0. 04 ppm. The con-
tribution to system measurement error then is a linear function of the value of g
being measured. Therefore, on the moon, the la error term should be:
(0.04) (10 6 ) (1.6) (105 mgal) = 0.0064 mgal (9-7)
9.6 ASF f(T)
Using the same value for the la temperature deviation as in6 Bias f (T),
and using the ASF assumptions as before, we can calculate the measurement error
due to the change in scale factor which is a function of temperature. The sensi-
tivity of scale factor to changes in temperature is typically 35 ppm/ 0 C. On the
moon, the la error value is:
(35) (10 6 ) (0.006) (0.16) (106) = 0.035 mgal (9-8)
9.7 Leveling (cos 0)
This is the error term due to the slight offset of the VSA input axis from
vertical. The pendulums level the gimbal assembly to within ± 3 arc minutes of
their null. There is, in addition, a slight angular offset of the pendulum null from
the VSA input axis.
Appendix F details the derivation of the following error. With the typical
pendulum-VSA angle of 1 arc minute and a typical pendulum deadband of ± 3 arc
minutes, the standard deviation of the gravity measured will be:
g= 0.04 mgal (moon) (9- 9)
9.8 Quantization
There is a slight loss of accuracy in the measurement due to the digital
readout. The quantization (mgal/count) can be considered a range over which each
count may be. If we assume a uniform distribution, then the variance a2 is found
by
o 12 (9-10)12
55

where:
Q = quantization in mgal
a = standard deviation in mgal
(See chart in Appendix C)
For typical cases
a2 = 0. 0002 mgal 2 (moon) (9-11)
9.9 VSA Amplifier Power-Supply Sensitivity
Tests indicate that good but typical VSA amplifiers can show a sensitivity
of approximately 0.4 ppm to changes of 0.2% in power-supply voltages. The power-
supply outer limits on VSA amplifier voltage is ± 1/4%. The short-term random
noise of the power supply is about 0.04% (this would affect short-term repeatability).
Again, taking the most conservative distribution (uniform) the la value of power
supply changes would be 0.4% = 0.12%12
so on the moon(0.4 x 10- 6) (x 106) (02.2%) 0.04 mgal (9-12)
( 0.2% o
9.10 VSA Amplifier Temperature Sensitivity
VSA amplified temperature sensitivity is 2 mgal/°C so that the la gravity
error on the moon is
(2/°C) (0.006°C) a 0. 012 mgal (9-13)
9.11 Slow-Loop Bias Uncertainty
The slow-loop uncertainty is a shift around any constant linear bias drift
in the phase-locked loop. Earth tests imply a la value for the phase-locked loop
of 0.5 mgal on earth, which becomes 0.1 mgal on the moon.
9.12 Environment
We conservatively pick 0.1 mgal as a la error due to Rover vibration
(or equivalent surface motion), although the curves in the appendix show this as a
"maximum" level. (See Environmental Error Analysis, Appendix G).
9.13 Summary
In evaluating the resultant total system error, it should be kept in mind that
the summation in Table 9-1 implies that all the terms are independent. Obviously,
there will be significant correlations between the three terms which are functions
56

of temperature. However, these terms are all relatively small, and therefore
their correlations should not add significantly to the system error.
Finally, it is reasonable to treat the resultant system error as normally
distributed (by Central Limit Theorem) which therefore implies that approximately
68% of the time the system will operate within the ± la errors derived in Table 9-1.
TABLE 9-1
SUMMARY OF ERRORS
57
Moon
Term Source v v
1 ABias 0.1 0. 0100
2 ABias f(T) 0.03 0.0009
3 G A SF 0.01 0. 0001
4 G A SF f(T) 0.035 0. 0012
5 Leveling 0.04 0. 0016
6 Jitter 0.10 0.0100
7 Environment 0.10 0.0100
8 Loop Bias 0.10 0. 0100
9 VSA Amp f (PS) 0.04 0.0016
10 Quantization - 0.0002
11 VSA Amp f (T) 0.012 0. 0001
Total (a 2 0.0457
y -0. 21cT T

SECTION 10
ENGINEERING TESTING
The Traverse Gravimeter was designed to be a completely self-contained
instrument for measuring lunar gravity differences of one part in 10 million. It
was planned that the unit would operate for 15 days, sealed in a protective blanket,
using the vacuum of space to provide adequate thermal isolation for the precision
oven assembly around the vibrating-string accelerometer (VSA) used as a gravity
sensor. It was, therefore a very difficult instrument to test in the one-g air-filled
earth environment.
After the basic design was verified by electrical breadboard and mechanical
mock-up testing, an engineering model was built to preliminary flight standards.
This model provided the first test of the gravimeter as a working system. The unit
was continually updated, throughout the test program, to the latest flight hardware
design, and proved quite useful in test evaluation and concept verification.
10.1 Performance Tests
Provision was made for general performance testing by including a vacuum
fitting in the intermediate oven design, thereby allowing the double-oven tempera-
ture-control system to maintain a stable temperature for the VSA. A different
countdown logic was also incorporated to scale the accelerometer output on earth
for the display format of the lunar mode. Pressure-switch bypasses and an
external power plug completed the test modification.
The initial performance tests with the engineering model were 6-hour
stability tests made on a large granite slab isolated from the surrounding floor.
These tests checked gravimeter drift and determined the standard deviation
(repeatability) of the displayed output in a constant-gravity environment. Seventy-
two measurements were normally made during this period to maximize the data
sample. Other tests were also run to determine VSA-bias and scale-factor stability,
(see Fig. 10-1). Accurate logs were kept to follow these values throughout the test
program. These performance tests verified the ability of the gravimeter to con-
sistently measure gravity to the desired accuracy over a period of time approxi-
mating a lunar traverse.
58

129.1460 -
129.1455 -
SCALEFACTOR
(Hz/g)
129.1450
129.1445 -
7.220 -
7.218 -
BIAS 7.216 -
(Hz)
7.214 -
7.212 -
7.210
1 2 3 4 5 6. '-*.II-u -' 14 I ' HI -1
1 WORKMANSHIP VIBRATION TEST2 PERFORMANCE TEST
3 THERMAL VACUUM TEST4 SHIPPING PREPARATION5 LAST CAMBRIDGE DATA6 KSC DATA
9
O ,0O \ EXTRAPOLATEDa o/0 a CURVE
0 p 0 FOR FLIGHTo-
eo °° ° op
10 11
TIME (months)
12
Fig. 10-1 Scale factor and bias vs. time for prime flight gravimeter.
10.2 Thermal Tests
The next step in testing was the verification of the system's ability to
measure gravity in the thermal environment of the moon. The thermal-vacuum
chamber, with a detailed Rover-pallet simulator, was used to produce the environ-
mental inputs of possible lunar missions to the gravimeter. A well-instrumented
but nonfunctional thermal model was used in the early design stages to define
performance parameters, prepare the test apparatus, and develop a mathematical
computer model of the gravimeter.
Thermal testing of individual modules verified their ability to withstand the
temperature extremes expected. It remained for the engineering model, this time
complete with blanket and battery, to ensure that the gravimeter would give accurate
data under thermal-vacuum conditions simulating those of a real mission. These
59
t
engineering tests also were used to update the computer model of the gravimeter.
The accuracy of the computer predictions of gravimeter temperature profiles
proved invaluable in evaluating different mission conditions without the time and
expense of the thermal-vacuum facility. (A complete description of the test
apparatus and TG thermal-vacuum tests may be found in another report. ):
10.3 Mechanical Tests
Concern over the ability of the gravimeter (particularly the VSA) to with-
stand the Saturn V launch motivated considerable vibration testing. A mechanical
model accurately simulating the dynamics of the gravimeter but containing a vibra-
tion accelerometer in place of the VSA was used to evaluate the shock and vibration
environment of the VSA. Although the VSA parameters (bias and scale factor) were
known to be sensitive to shocks, it was felt that the levels experienced at the inner
(precision) oven were low enough to preclude VSA damage.
The engineering model underwent vibration testing in April 1972, using
"workmanship" vibration levels. The test was run for 1 minute, and the gravimeter
was checked afterwards to ensure that no damage was caused. The test was then
continued for 3 more minutes, and the gravimeter was again checked, but this time
there was no VSA output. A teardown inspection*:-:.' revealed that one of the VSA
string-mass-cross-tie systems had broken. Further investigation showed that
the VSA mass system had secondary vibration modes at frequencies close to those
of the oven-gimbal structure.
Two major design changes were then initiated. First, the wires used to
hold the intermediate-oven to the electronics frame (inner gimbal) were increased
in diameter to change the oven resonant frequencies, at a slight decrease in
thermal efficiency. Second, a shock-abosrbing isolation frame was designed to
interface between the Rover pallet and the gravimeter. Later engineering testing
and the Qualification and Acceptance Testing of the flight gravimeters verified the
ability of the improved design to survive the full flight vibration levels with accep-
table bias and scale factor shifts.
Dafnoulelis, C.V., R.T. Martorana, and W.A. Vachon, Thermal-Vacuum Testof the Apollo 17 Lunar Traverse Gravimeter Experiment, Charles Stark DraperLaboratory Report E-2759, April 1973.
See memos GRV-112-A, GRV-167-T, and Internal Failure Report TG017.
60

10.4 Field Tests
Field testing proved to be an invaluable aid in developing procedures for
using the gravimeter during the flight and in giving the flight crew experience with
a working instrument in near-flight configuration. The engineering model was
modified with a new front foot and a flight-like blanket. The front foot incorporated
an external power-input plug and switch and a temperature-control circuit to enable
use without a vacuum pump. The front cover and flight-like blanket had a trap-door
installed to facilitate battery changing between field trips for a faster turn-around
time. This prototype thus resembled a flight unit yet would give accurate data on
earth..
The first field trip was to Kennedy Space Center (KSC) in July 1972. An
electromagnetic interference test was held with all other Rover equipment on
Apollo 17, and the results indicated no problems for the gravimeter. While at
KSC, a test was made using the training Rover to evaluate the traverse shock
environment of the Rover. The gravimeter experienced two bias shifts, but at the
end of the test it was discovered that the pallet latch was loose and that the pallet
had more free play than usual. (This served to invalidate the Rover test, although
a loose dust-covered latch would plague the flight gravimeter at the end of the
mission. )
It was decided to replace the engineering model VSA with one of better
performance, which had just become available (the two best VSA's were saved for
the primary and spare flight units.) The KSC test was eventually repeated in October
with a better VSA and a latched Rover tailgate. This series of tests demonstrated no
major reaction to Rover rides.
Two field tests were made with the astronauts. One was a trip to Black
Hawk, California, a site which was hoped to be geologically similar to the Taurus
Littrow landing site. The traverse gravimeter not only showed excellent agreement
with a commercial survey gravimeter but also gave valuable insight into the sub-
surface structure of the area. (The techniques used by the Principal Investigator in
evaluating the Black Hawk data proved quite useful to him in making real-time
inputs to the flight plan. )
The second trip with the flight crew was to Flagstaff, Arizona for a full
dress rehearsal with training equipment, communications links, etc. (See Fig. 10-2).
The gravimeter performed as expected, and valuable experience was gained for the
mission support crew.
As the time line became finalized at NASA, some of the geologists became
worried at the prospect of waiting 3 minutes at the beginning of each stop on the
traverse before being allowed to pan the TV camera. The original constraint was
61

Fig. 10-2 Astronaut Cernan at Flagstaff.
62

imposed for fear of the gravimeter measurements being affected by Rover vibrations
excited by the TV camera. Gravimeter performance (stability) tests were run at
Johnson Spacecraft Center (JSC) on a Rover suspended by 90-foot "bungee cords"
to off-load 5/6 of the weight and produce lunar dynamic responses. These tests
were run, with the TV and other systems running, to search for possible vibration
sources. No other instrument, including the TV, appeared to have any effect on
gravimeter accuracy, and the TV constraint was relaxed.
10. 5 Flight-Unit Testing
The flight units (primary and spare) went through extensive, quality-control-
witnessed tests to qualify the design and accept both units. These tests were largely
repeats of engineering tests run on the prototype, designed to get additional opera-
ting parameters peculiar to each unit. One exception was the phase-lock-loop
warm-up data taken during thermal-vacuum testing on each flight unit. Switching
the gravimeter from STBY to ON produced a noticeable transient in normal gravity
readings (when the phase-lock-loop was used). Tests showed that, within 20
minutes, the loop stabilized, but that the first reading could be especially mislead-
ing. For this reason the flight procedures called for turning the gravimeter ON at
least 5 minutes before the first gravity measurement of each EVA. As may be seen
in the flight data, when turned on, only READ is pressed, to get temperature-alarm
data immediately, about 10 minutes before the first GRAV measurement.
After both flight units passed acceptance tests, periodic measurements were
made in Cambridge before shipment and at KSC just prior to the flight to update the
scale-factor value and verify the drift rate. Figure 10-3 shows the flight unit after
removal of all of the test connections. After sealing each unit in flight-ready status,
it was checked in a vacuum chamber to verify all connections and pressure-switch
operations. These tests maximized the confidence in the functioning and accuracy
of both units.
63

I_~;~.~~_~~.:--:::--~-_-: -::~ii~ ~-::I:; ii .- i::::i~-:i:i:::: : i ::: i:: :i :: -.- : - : :::::: : - ::i ii:- ::::::--_:: i:il::::::;- :::~i:::i:ii;~':~i~--8ii~~:i'i: i--::-i-:;:::-~;
~ * ~ - I __ _i~'-_~~_ ~~ ::i: :::,::::::_;::-,
iii iil::~i-i:-:~~i~-*
; ::::::;:::- :- ::ii : :''- ':l'i :il:;~i-: ': :::::: .-:~ii-i: iiii--:l::::: ::-l:-iiii::::::::::':::' :: 'i --:ii:i_:_::::::
-: ::- :i:: :: .. ;-~i~-i:.i.:-:; ; ;. --;;; -..- :i~ i: ~ :ii : :: i:::-:i:: -..-i---i:;::::::i~iiii_~-~~~-~~~-II :':-:: : : :::: '-:i i:::::::: : ;
: :: :::::::i::~:: :: :::il:i
- - : I:i:i--:it:
R~ I I
:ii;-~i;':~::::'-: :;:
::::::::::::
iii~ i~~:~~~~
.~~ :a~ nS
:::;i:i:::: ::-:i:-:~ I
:: -.--.. -:-::::: ~:~:-;: : -. ::::: :i :;--:-:: :::: -; ::::::::ii -
':;l:i~~::: : ::::::::i: ::i:::;:: ' : ': :":- -::- i'::::::':':::: i:- ::i--:::::i:: :I~.- ~~-::::: i:i:i:i i-i i
:;:-::ii:: i::::: ---i:i: : : :: :i:::;i:: ;:~:_~~:~-:-__ ,, I:: ii:: ~i~-:-l--,-::~:::lili::i::ii~ :_~
~~EIP~ II~IIIIIIII~ 3~~:g,: _i~-
i-:::---i-~aii
;;----
Fig. 10-3 Gravimeter interior detail.
64

SECTION 11
MISSION RESULTS
Final assembly of the prime flight gravimeter began during the early hours
of Monday, 27 November 1972, following 4 weeks of testing at the Kennedy
Spaceflight Center. Daily checks were made on FS-l's scale factor and bias in
order to confirm instrument-drift trends as shown in Fig. 10-1. A functional test
was performed with the flight-configured gravimeter installed in a vacuum chamber
followed by a fit check with the geology pallet. The traverse gravimeter was
installed in Quad III of the lunar module (LM-12) inside the protective shroud of the
Saturn 5 launch vehicle on a rainy Tuesday evening (see Fig. 11-1).
Ti4
Fig. 11-1 Gravimeter installed before launch.
65

The flight of Apollo 17 began at 12:33 A.M., E.S.T., Thursday, 7 Decem-
ber 1972 following a false start earlier in the evening. As the huge rocket thunderedskyward, the traverse gravimeter came to life at an altitude of 50,000 feet when a
baroswitch completed the circuit to the internal battery. During the next 4 days, the
precision VSA oven reached 122 F and stabilized after the cold start.
In order to understand the flight results, it is necessary to convert the
instrument display readings. The displayed number is a nine-digit number consis-
ting of seven gravity digits followed by the temperature digits. At the beginning ofeach traverse, readings 1, 10, and 18 on Table 11-1, the display was read upon
turning the STBY/ON switch to ON. For these readings, only the eighth digit is
meaningful; the eighth digit indicates the status of various temperature alarms
(see Section 7). The ninth digit is valid during any gravity or bias measurement.
A displayed number less than 7 indicates the VSA temperature is in control.
The conversion of the displayed number to gravity in milligals is performed
as follows:
8 3.92x 10 K Klg+ 2g+ 3g (11-1)
DN 2 g
4.8x 10 = -K + Klg- K2g2+ K3g3 (11-2)
(In computing K2g2 and K 3g3, a value of 0. 167 g is assumed for g.)
where
D =DN = Displayed value for gravity (normal) measurement
DI = Displayed value for bias (inverted) measurement
K = Bias
K1 = VSA scale factor
K2 = VSA second-order term
K = VSA third-order term
For the purpose of these preliminary calculations, the following values are
used based on laboratory tests:
K2 -0.00034 Hz/g2
K = 0.00300 Hz/g3
K1 = 129.14550 Hz/g
66

TABLE 11- 1
APOLLO 17 TRAVERSE GRAVITY DATA
Reading EVA S TG Updated LM Gravity Differencee ofNo. No. Display Baseline Display ± 2o mgal 2 L Reading
1 LM xxxxxxx- Oy Temperature
2 LM 6700031-01 6700031 0 ± 15 - ± 0.49 GRAV on Rover
3 LM 6700172-01 6700172 0 ± 20 - i 0.65 GRAV on Surface
4 LM 3374540-01 6700172 N/A - BIAS on Surface
5 1 Alsep 6700026-01 6700172 -146 ± 20 4.74 i 0.65 GRAV on Rover
6 Sta. la 6700129-01 6700172 -43 ± 20 1.40 ± 0.65 GRAV on Rover
7 SEP 6700101-01 6700172 -71 ± 20 2.30 ± 0.65 GRAV on Rover
8 LM 0001330-01 6700172 N/A GRAV on Surface
9 - LM 6700215-01 6700200 15 ± 25 -0.49 ± 0.81 GRAV on Surface
10 - - LM xxxxxxx- Oy 6700200 N/A Temperature
11 LM 6700177-01 6700200 -23 ± 25 0.75 i 0.81 GRAV on Surface
12 Sta. 2 6701552-01 6700200 1352 ± 25 -43.88 ± 0.81 GRAV on Rover
13 Sta. 2a 6701235-01 6700200 1035 ± 25 -33.59 ± 0.81 GRAV on Rover
14 2 Sta. 3 6700497-01 6700200 297 ± 25 -9.64 ± 0.81 GRAV on Rover
15 Sta. 4 6700125-01 6700200 -75 ± 25 2.43 ± 0.81 GRAV on Rover
16 Sta. 5 6700314-01 6700200 114 ± 25 -3.70 ± 0.81 GRAV on Rover
17 LM 6700235-01 6700250 -15 ± 30 0.49 ± 0.97 GRAV on Surface
18 - LM xxxxxxx-Oy 6700250 N/A Temperature
19 LM 6700270-01 6700250 20 ± 30 -0.65 ± 0.97 GRAV on Surface
20 Sta. 6 6701098-01 6700250 848 ± 30 -27.52 ± 0.97 GRAV on Surface
21 Sta. 8 6700960-01 6700250 710 ± 30 -23.04 ± 0.97 GRAV on Rover
22 3 Sta. C 6701173-01 6700425 748 ± 50 -24.28 ± 1.62 GRAV on Surface
23 Sta. 9 6700378-01 6700425 -47 ± 50 1.53 ± 1.62 GRAV on Rover
74 Sta. 9 6700571-01 6700600 -29 ± 75 0.94 ± 2.43 GRAV on Surface
25 LM 6700107-01 N/A N/A GRAV on Surface
26 1 LM 3374171-01 N/A N/A BIAS on Surface
Weighted Average for Sta. 8 =
-23.20 mgalSta. 9
= + 1.30 mgal
Absolute value for LM =
162,694.45 mgal

11.1 Discussion
The traverse gravimeter functioned throughout all three EVA's. The last
two digits were 0 and 1 for every gravity and bias measurement, indicating excel-
lent temperature control and that at no time during the EVA's did any of the
temperature alarms activate.
The value of bias computed at the beginning of EVA 1 (readings 3 and 4) was
7.21592 Hz. A predicted value of bias based on laboratory test was 7.2144 Hz.
Total shift during the translunar phase was 0. 0015 Hz. This corresponds to about
an 11-mgal bias shift, which is considered reasonable as compared to typical bias
shifts experienced during acceptance and vibration testing. A 141-count (4. 6-mgal)
shift also occurred while taking the traverse gravimeter off the Rover at the LM
site (readings 2 and 3). At this time, it was suspected that a shock due to handling
caused this shift. At the end of EVA 1, the first displayed reading (reading 8) was
000xxxx, indicating loss of lock in the phase-lock loop. In order to induce this
(especially on the surface), the traverse gravimeter must have been hit, rather
severely, during a measurement. The measurement was repeated and a reasonable
reading was obtained. This reading at the LM site was 1.4 mgal lower than reading 3.
EVA 2 went fairly smoothly. A large gravity change was found at Station 2.
This caused the Principal Investigator to request an additional reading on the way
to Station 3. This reading is indicated in Table 11-1, as Station 2A. The closeout
reading at the end of EVA 2 (reading 17) was close to the closeout of EVA 1 (read-
ing 9) or 0.7 mgal different. This EVA was considered most valuable by the
Principal Investigator.
During EVA 3, no reading was taken at Station 7, due to time-line consider-
ations. At Stations 8 and 9, readings were taken both on and off the Rover. The
differences off the Rover were 6.9 and 6.2 mgal less than on the Rover for Stations 8
and 9 respectively. This is not much different from the 4.5-mgal difference
obtained at readings 2 and 3 at the beginning of EVA 1. The fact that the changes
were of the same magnitude and in the same direction, indicated that some type of
Rover motion, or astronaut handling, or surface phenomena, may have induced
this. On the way from Station 9 to the LM site, the pallet on which the traverse
gravimeter was mounted swung open. Previous experience indicates that the
shock effect that may have resulted from this could cause a bias shift. At the LM
site at the end of EVA 3, both a gravity and bias measurement were obtained on the
surface (readings 25 and 26) to close out the traverse. Figure 11-2 summarizes
the results.
As a result of the shifts on readings 3, 22, and 24, post-mission engineering
tests were run on the flight spare and engineering prototype gravimeters. (Reference
68

Staa 3
" ;i !! ° . mgal
Stat 1+1.4. mgal
-ngal
Fi. SE Typ 01 Sta 9++ 1.3 mga
CD Sta 5-33.6,-3.7
Sta 3
-43.+23 mg
Fig. 1-2 Trversegravit valus fr I Apol 7

GRV-228-T). These tests indicated that repeatable one-way shifts could be induced
by hitting the gravimeter handle supports. The spare flight gravimeter (FS-2)
recovered from these shifts in about 1 hour, while the engineering model largely
failed to recover, exhibiting a "staircase" shock reaction.
It appears that the flight gravimeter had a staircase reaction to being
transferred from the Rover to the ground (see Fig. 11-3). If we assume that each
surface deployment resulted in an upward shift, and that the gravimeter, if left
alone, would stay at that new value, we get the gravity deviations listed in Table
11-1. The "updated LM Baseline" represents the equivalent reading that the unit
would give if transferred to the LM at that time. It is used to compute the devia-
tions needed for the gravity measurement. The ± 2-a column reflects a 95% con-
fidence level, and is shown increasing since the gravimeter performance appeared
to degrade with the number of shocks. The new LM baseline is roughly the average
of any readings taken before being mounted on the Rover again. In the case of
readings 22 and 24, the confidence factor is inflated because no accurate closeout
was made for EVA 3.
The last two readings (25 and 26) are confusing. It is known that the tail-
gate flew open during the drive from Station 9 back to the LM. This would normally
be a severe shock-inducing environment for the gravimeter. The last two readings
however, imply a bias shift of only 0.0006 Hz from the start of EVA 1, and a scale
factor shift of 0. 006 Hz/g. This is the opposite relative reaction of bias and scale
factor. In our harshest vibration testing, the bias changed 0. 007 Hz and the scale
factor only 0.003 Hz/g, (a more typical example). We have never seen a scale
factor shift of the magnitude implied by the last two measurements without a far
worse bias shift (see Fig. 10-1). For this reason the last two readings are con-
sidered inconsistent and were not used in the data reduction. It may be noted that
the BIAS reading alone corresponds to a GRAV reading of 6700541, if we assume
no scale-factor change and absorb all of the shift in the bias term (a reasonable
approximation based on past data). This is more consistent with the 6700600 base-
line assumed for Station 9.
The absolute value of gravity may be determined from the data. It is felt
that readings 3 and 4 provide the most-complete least-suspect measurements to
take for the transfer, and they yield a value of 162,694.45 mgals at the LM site.
Figure 11-4 shows the gravimeter mounted on the Rover at the start of
EVA 2.
70

Raproduced fromst available cOPY-
Fig. 11-3 Gravimeter being unloaded at Station 6.
11.2 Conclusion
The traverse gravimeter performed well throughout all three EVA's.
Temperature control was excellent. There is no reason to believe that there were
any electronic problems. Gravimeter performance appeared to be degraded by
shocks, however. First, the Rover-to-surface deployment presented an unantici-
pated shock hazard. Second, the tailgate's opening at the end of EVA 3 appeared to
stress the instrument. Despite these problems, gravimeter data, in particular
during the crucial EVA 2, appeared useful and accurate.
'71

Fig. 11-4 Traverse gravimeter mounted on geology pallet.
The Principal Investigator's findings from the gravimeter readings are
summarized in a paper presented at the Annual Conference of the American Geo-
physical Union in Washington, D.C. in April 1973 .
'Talwani, M., G. Thompson, B. Bent, H. Kahle, S. Buck, TraverseGravimeter Results on Apollo 17, to be published by NASA as part ofthe preliminary science report.
72

APPENDIX A
DERIVATION OF SUM FREQUENCY AND
HIGHER-ORDER TERMS OF VSA OUTPUT
A. 1 Sum Frequency Derivation
A further manipulation of the power series representing the outputs of the
two VSA strings reveals helpful interrelationships between the sum frequency,
f + f2' and the instrument scale factor. From Eqs (4-5) and (4-7) an expression
for fl + f 2 can be obtained as
T 1/2
f + f m (L2m2) 1F 1 L __12 + (§1) /2)
() lml
A M 1
2T q L a t a g to
This series converges very quickly and to a good approximation to
(A-l)
T 1/2
1 fl+2 2 (lT12+ 1
(L 2m 2) 1
Using the expressions for f1 and f2 in Eqs.(4-5) and (4-7), it can be seen that
T 1/f f1 1 0
l m2 T l) 1/2 (L 2 m 2 ) 1/2
1 MA + 1
TO L m1) 1 (L2m 2 2)
1 A) 1+6 To lml ) 1/2 (Lm2 )1 '
73
(A-2)
(A-3)

Comparing Eq.(A-3) to Eq.(4-11) one obtains
K (1 1/2 (A-4)4T 1m (L2m2) 2
Thus
Rfl + (A-5)1 f2
where
R =M ( ) Hz2/gLlm ) (Lm2
The term R will vary only if the lengths of the individual strings vary. R
will be largely insensitive to changes in sensed input since the lengths of the strings
will change in opposite directions. R will vary with changes in temperature; since
for temperature variations, changes in the lengths of both strings will be of the
same polarity.
A. 2 Derivation of Higher-Order Terms
Referring again to the power-series expression for the difference frequency
Eq.(A-3), similarities are apparent between the K0 and K 2 terms and between K1
and K3 terms.
Equating the fourth term in Eq. (A- 3) to K3, one obtains
M2K1K 1 (A-6)3 = 2
8T0
T= 2T0 (A-7)
K 2 M1
Thus
K1 1/2 K13
1 2K3 2 R2 (fl + f2 )2
74

Before proceeding further it is helpful to write Eq.(4-8) for input accelera-
tions of plus and minus one g
( 1f)=g lf(+g) = K + K 1 g+ K2 g 2 + K 3 (A-9)
(fl2)g Af( g) = -K 0 + K1 g - K 2 g 2 + K 3 (A-10)
The sum and difference of Eqs.(A-9) and (A-10) are
Af(+g) + Af(_g)= 2K 1 g+ 2K 3 (A-ll)
Af(+g)- Af(g)= 2KO + 2K g2 (A-12)
Equation (A-8) can now be substituted into Eq.(A-11) to give an expression
for the instrument scale factor in terms of the difference frequency counts at plus
and minus one g input and the sum frequency.
K Af(+ g) + Af(g) - (+ g) + Af(g)) (A-13)1 22 16 (fl + f2)
Then by use of Eq.(A-8), the value for K3 can be determined.
In an analogous fashion, the interrelationship between the K0 and K2 terms
can be used to determine unique values for K0 and K2; i.e.,
K = (f(+g) - Af(g)) (1+ 2 K 3 /K 12 ) (A-14)
-2 K K0K2= 2 (A-15)
K1
75

PRECEDING PAGE BLANK NOT FILMED
APPENDIX B
GRAVIMETER ELECTRONICS SCHEMATIC
? ea"' - f

I
Page intentionally left blank

APPENDIX C
CALCULATION OF MAXIMUM TEMPERATURE
ON VERTICAL SURFACE OF MULTILAYER BLANKET
As mentioned in Section 7, a vertical adiabatic surface on a flat moon
receiving both solar and lunar radiation can reach a temperature above that of the
moon. The following is a derivation of the governing relationship. A maximum
blanket temperature and sun angle are calculated based on the assumption of pure
black-body radiation.
First, parameters are defined:
S Solar radiation flux constant = 442 Btu/h-ft2
e = Solar absorbtivity
0 = Sun elevation angle
EH = Infrared emittance
F = View factor from vertical surface to moon = 0.5s,m
F = View factor from vertical surface to outer space = 0.5s,o
T Moon temperaturem
T = Surface temperatureS
A steady-state heat balance can be written for a unit area of an adiabatic
vertical surface perpendicular to the solar plane as follows:
Qin Qut 0 (C- 1 )
4 4 4S a Cos 0 + e F (T m -T 4) F T 4 0 (C-2)S 0 H0 EH smo s =HF
The blanket surface can be assumed to be adiabatic in that on the order of
one percent of the net thermal flux on the blanket is conducted inward to the TGE
case.
If the lunar surface is assumed to be a pure black-body absorber and
radiator the following expression for moon temperature may be substituted:
81

4 ST =- sin 0
m a (C-3)
which, after including the view factors, leaves the following equation for the
temperature of a vertical adiabatic surface as a function of sun angle:
S a S 1/4Ts (= (, e cos 0 + . 5 sin 0(C-4)
If the blanket surface is a pure black-body radiator a s = eH = 1.0, the
equation simplifies. By taking the derivative with respect to 0 and setting it equal
to zero, it is found that the sun angle for maximum thermal radiation is 26.6
degrees, producing surface temperatures of approximately 274°F.
82

APPENDIX D
THERMAL MODELING AND MISSION PREDICTIONS
The thermal design of the TGE relied heavily on computerized predictions
of thermal performance in many different conditions. Initially the computer model
of the thermal analog was created purely from mathematical calculations of thermal
transport coefficients and thermal masses. The model was then put through a
mathematically simulated environment equivalent to a worst-case lunar mission
(cold and hot) and the performance observed. As design deficiencies or needs
were observed, the design and the math model were altered. When it became
clear that there was a thermal design that worked mathematically, a thermal mock-
up was built, instrumented, and tested. Specific tests were conducted in a vacuum
chamber (see Section 10) and the results correlated with mathematical simulations
of the tests. The math model was altered where its response did not match that of
the mock-up. Subsequently, the math model was put through a full worst-case
lunar simulation and design margins observed. The resulting mathematical
computer model is described in Appendix E.
In order to mathematically model the instrument, definite mission assump-
tions were required. Some involved a definition of the environment (see Section
7. 1) and others were somewhat contrived to lend to mathematical analysis. Table
D-1 is a summary of the base line assumptions required to model the nominal,
hot, and cold missions. The hot and cold missions represent worst-case assump-
tions.
Table D-1 requires a brief explanation. The blanket for the TGE is of a
deep, almost cobalt-blue color, selected to be a good optical background for
reading the display. In lab measurements, both the dacron fabric and the painted
plastic exhibited a solar absorptance and infrared emittance of approximately 0.6
and 0.9 respectively. In a cold mission, these real values were retained in the
assumptions because they represent the worst case. In the hot and nominal
missions, however, it was assumed that the blanket was covered with lunar dust,
approximated by a s= EH = 1.0.
83

TABLE D-1
TGE THERMAL MISSION ASSUMPTIONS
HOT MISSION NORMAL MISSION COLD MISSION
(1) Quad III PalletTemperature
(2) Post-TouchdownQuad III Soak-back
(3) Landing SunElevation
(4) Blanket SurfaceCharacteristics
(5) Pallet-to-CaseConductance inStowage
(6) Rest Periods
(7) No. of GravityMeasurementsper Traverse
Hottest as supplied byGrumman (160-hourduration)
20 hours
20.30
as eH 1.0
0.032 Btu/h-°F
Edge of LM Shadow
10
500 F during translunar andsoakback (160-hour trans-lunar)
6 hours
13.30
as eH 1.
0.032 Btu/h-°F
In full LM Shadow
10
Coldest as supplied byGrumman (160-hourduration)
6 hours
6.80
as = 0.6, EH 0.9s H
0.128 Btu/h- 0 F
In full LM Shadow
10
I I

It was found in modeling the instrument and later in tests that during the
Quad III stowage period, during which time the three hard-mount pins were
present, the pallet-to-case conductance through the pins was an important para-
meter in specifying the initial conditions for the lunar mission. If the conductance
was very low, as in the hot and nominal missions, the case is well isolated and its
own internal heat dissipation during the long translunar coast warms the unit well
above the pallet temperature. Therefore, a low conductance is again a worst-case
hot assumption. In the cold mission, though, the opposite is true. The worst-
case cold assumption is when the unit is well coupled to the cold pallet. The
numbers used were measured during thermal-vacuum tests of the thermal mockup
and engineering model.
As described earlier, during lunar rest periods the TG is placed in the
shade of the LM for cooling. While in the shade, though, the instrument can still
receive radiative heat inputs from the LM and nearby warm lunar terrain that has
a clear view to the TG. This could be especially true in a mountainous regionsuch as the Apollo 17 Taurus-Littrow site. Rather than spend time constantly accoun-
ting for such effects, it was assumed for modeling purposes that the TGE sits on the
shaded edge of the LM shadow in hot missions and receives no radiative flux from
the LM and hot moon in the nominal and cold missions.
The period of time during which the TG must remain in Quad III following
lunar landing is an important parameter in the hot mission only. If the LM Quad III
is pointing directly at the sun following landing, the TG should be removed within
20 hours of landing or it runs the risk of overheat later in the mission.
The computer predictions for thermal performance of the TG during hot,
nominal, and cold missions are shown in Figs. D-1 to D-3. The time line begins
at the time of lunar landing and extends through three EVA's. Key points to observe in
these three figures are the following:
(1) The P oven and VSA temperatures are controlled at 1220F.
(2) In order to maintain P-oven control, the maximum permissible
I-oven temperature is 1170F.
(3) The hottest temperatures for the I oven and battery occur approxi-
mately 2 to 3 hours following the first EVA.
(4) The portions of the TG which are most physically removed from
the case respond progressively less severely to the case thermal
response.
85

10 20 30 40 50 60 70
TIME (hours after lunar landing)
Fig. D-1 Hot-mission thermal response.
160
150
140
130
120
110
100
U-ILon
wa-
cc
G
LU
CJ
2w
90
80
70
600

130
120
110
oU-
Lu
0
a
wI-co 2
40 I0 10 20 30 40 50 60 70
TIME (hours after lunar landing)
Fig. D-2 Normal-mission thermal response.

100
90
Coldest Quad III ConditionI.OVEN
80 - C pallet/case 0.128 Btu/h-OF
70
60 -o0 E FRAMEwr 50 BATTERY
CASEEL 40w7-
1010 20 30 40 50 60
-LUNAR TIME (hours after lunar landing)LANDING
Fig. D-3 Cold-mission thermal response.
It should be noted that in a hot mission the temperature change of the I
oven between the beginning of EVA 1 and the hottest temperature is approximately
5°0 F. This fact graphically explains the 1100°F very warm alarm on the I oven.
This alarm led to the mission rule that if the alarm was seen at the beginning of
EVA 1 the TG would be placed in the LM shade for cooling until EVA 2. If only a
warm alarm were seen, the hottest the I oven could be is 1100 F, resulting in a peak
I-oven temperature of approximately 115°F during the subsequent rest period.
With a 117OF red-line limit on the I oven, P-oven control is assured.
The computerized thermal prediction for the cold mission (Fig. D-3) also
enables the computation of the worst-case electrical power consumption. Power is
potentially dissipated for four functions: electronics power for gravity measure-
ment and display, P-oven control power, I-oven control power, and battery control
power. The I-oven control power is found to be always zero, even in the coldest
mission, because its minimum temperature is only approximately 620 F. Table D-2
is a breakdown of the electrical power consumed by each source during each mission
88

TABLE D-2
COLD-MISSION POWER-BUDGET BREAKDOWN
ASSUMED CONDITIONS: (1) Prelaunch Temperature = 600°F Throughout
(2) 160-Hour Translunar Stowage Period
(3) Landing Sun Elevation Angle = 6.8 degrees
(4) 6-Hour Quad III Soakback Period
Heat Source
Electronics P Oven Battery Heater TotalsMission (Watt-hours) (Watt-hours) (Watt-hours) (Watt-hours)
Phase
0 - 3 Hours 0.46 3.9 0 4.36
3 - 166 Hours
(Included 6-hour 28.5 91.5 28.8 148.8
Quad III Soak)
Lunar Operations51.8 29.9 8.0 89.7
(48 Hours)
Totals 80.76 125.3 36.8 242.86
coCD

phase. The first 3 hours of translunar stowage is a separate category in that
during that time the P oven is assumed to be warming up from a 60 F ground
ambient temperature to 122 0F. The total energy dissipation of 242.86 watt-hours
should be compared with the manufacturer's battery rating of 340 watt-hours.
Only 71% of the battery energy would be consumed in the worst case cold mission
while maintaining complete thermal control.
90

APPENDIX E
THERMAL-MATHEMATICAL COMPUTER MODEL DESCRIPTION
As described in Appendix D, a strong tool for designing and evaluating the
thermal performance of the TG was a mathematical analog of the thermal design
of the complete instrument. The analog model employed most often for analysis
is shown in Fig. E-1. The model consists of 14 separate structures or surfaces
which are represented as nodes. The nodes are represented as junction points in
an equivalent resistive and capacitive electronic circuit. The thermal mass, mcp,
(mass times specific heat) of each structure is the direct equivalent to electrical
capacitance, nodal temperature the equivalent of voltage, and thermal transfer,
whether by conduction, convection, or radiation is represented by a resistance.
Our modeling was confined to vacuum only, eliminating convection transfer. The
resistances in Fig. E-1 are only directly equivalent to linear electrical resistors
when thermal conduction is the sole mode of heat transfer between the two nodes
concerned. In this case, the equivalent resistance is L/KA, where L is the length
between nodes, A the average area through which the heat must flow, and K the
thermal conductivity of the material.
In addition to conduction resistances there is in general a parallel, non-
linear resistance (not shown in Fig. E-1) which accounts for the radiation heat
transfer. The radiation thermal transfer between nodes is generally of the form
a A EQ F (THo 4 TCold4 ), where eEQ is an equivalent emittance factor and F
the geometrical view factor between the surfaces. In the tabulation of resistances
which will follow, the radiative terms include the product A EEQF and have the
units of area.
Electrical power is put directly into each node as heat. Solar heating when
present is put directly into the TG case node with an attenuation factor of 0. 01,
equal to the measured average effective emittance of the multilayer blanket.
Cyclic or varying powers, such as the display-mode power which is present for
only 15 seconds after the display button is pushed, are input as an average heat
over a full EVA, depending on the number of expected display readings.
Table E-1 is a list and description of the nodes of the thermal analog model.
The thermal mass of each node, mp , is also given. Table E-2 is a list of nodalP
91

VSA
0
OP
0PHASE-LOCKED
PHASE-LOCKED
COLD MOON HOT MOON
*PATH 6-14 PRESENT ONLY WHEN IN LM SHADE
**PATHS 7-10 & 9-10 PRESENT ONLY WHEN RADIATOR DUST COVER CLOSED.PATH 7-9 PRESENT ONLY WHEN RADATOR DUST COVER OPEN.
Fig. E-1 Thermal-mathematical analog model.
92

TABLE E-1
TGE - 14-NODE MODEL
Node Location Thermal MassNo. (Btu/OF)
VSA
Precision Oven (Isothermal Node at
temperature of 1220F at all times that
the Intermediate-oven temperature is
less than 1170 F
Intermediate Oven
Electronics Frame
Middle Gimbal
Case, Electronics Power Supply, Logic,
Display, and Crystal Oscillator
External Surface Radiator
Lunar Surface and Lunar Roving Vehicle
(temperature-controlled nodes at same
temperatures)
Space
Dust Cover for External Surface Radiator
Battery
Phase-Locked Loop
Internal Radiator Hemisphere
Cold Lunar Shade
_______ L I
0. 091
Constant Temp.
0.259
0. 629
0.577
3.328
0.042
Variable-Temp.Sink
Constant Temp.(0°R)
0
1.49
0.219
0. 042
Constant Temp.(-100°F)
93
1.
2.
3.
4.
5.
6.
7.
8.
9.
10.
11.
12.
13.
14.

TABLE E-2
THERMAL ANALOG MODEL - NODAL COUPLING
-1Coupling Coefficients
Connecting Nodes Radiation Conduction
(ft2 ) (Btu/h-OF)
1
2
3
4
4
4
4
4
5
5
5
5
6
6
6
6
6
6
6
7
7
7
9,space
11
2
3
4
5
6
11
12
13
6
11
12
13
7
8
9
11
12
13
14
10
9
13
10
12
0.00674
0.0138
0.03443
0.0026
0.0053
0.00055
0.087
0.025
0.0031
0.00055
0.003
0.0318
0.01762
0.0535
0.0052
0.01582*
0.00072**
0.06086**
0.072**
1.7
0.0401
0.056
0.278
0.050
0.308
0.007
0.01
0.092
0.007
0.08
0.01*
0.139
1.0
* Path 6-14 present only when in LM shade.
** Paths 7-10 and 9-10 present only when radiator dust cover closed.Path 7-9 present only when radiator dust cover open.
94

conduction and radiation transfer coefficients for each node during an EVA on the
Rover. It should be noted that for some nodes only one mode of transfer is given
because it was found to dominate. Secondly, the Rover pallet is not given as a
separate node because it is assumed to be at the local hot lunar temperature which
is assumed to be a function only of the sun elevation angle.
The multinode model was solved in its most general nonlinear transient form
on a digital computer. The solution technique, developed by the Arthur D. Little
Company of Cambridge, Massachusetts, employs backward differencing techniques
which enable relatively large solution time steps to be taken and a stable solution
obtained. The linear portion of the solution is handled by a Gauss-Seidel iterative
technique while the nonlinear portion (radiation terms) is handled by a Newton-
Raphson technique. The transfer coefficients were stored in the computer as ele-
ments of a vector eliminating the need for an n x n matrix of coefficients, most
of which are zero, when one solves n simultaneous first-order differential equations.
95

PRECEDING PAGE BLANK NOT FLED
APPENDIX F
DERIVATION OF LEVELING ERROR
G = [1 - cos 0T] g
G/g = 1 - cos
G/g z 2 2
T
2 '
T 1 [1 2
T 1 2
2x= 0 ,X
-2 = E (z-Z)2 } = E Z 2} -(E {ZI ) 2 (A)
EIZ2 } = E {(x2Y)
(F-l)
= 4 [E {x2 + E y2} + 2 E xy]
E IZ = Ex-yj}
(F-2)
= [E x} + E y]
If we assume that x and y are uncorrelated yet have the same distribution function,-
E {x = E{y
E gx2 } = E {y2
Ej(x-3)(y-y):= E xy - E {x} E {yj : 0
E {xy = E x } E y
Reasonable, since knowing x gives no information about y, yet both axesshould have the same type of distribution.
97
Define Y y,2
Then
with
and

Now, Eq.(F-1) becomes
E 1{2 } = 4 [E x2l + E 1{x2 + 2(E Ixf )2]
(F-3)
2= [E Ix 2 + (E x} )2]
and Eq.(F-2) becomes
E 1Z4 =2[E {x + E {xI] =E {x (F-4)
Thus, Eq.(A) becomes:
Z2 = (E ix 2 } + (E {x, )2) ( 2E x )2
2 = 1 [E x2 - (E {xi )2] (B)
but x can now be represented as 02 (dropping the axis-subscript), so that
2= 21[E l04e _(E 1802 )2] (C)
For a uniform distribution of 0 between a and b,
1p () a<<bP (0) b a a< 0 < bb-a
0 otherwise
i.e.
P(8)
a 06 b
98

b
E 1:2} = f
a
b
E to41 = fa
2 dOe 3
0 b-a -3 (b-a)
04 dOb-a
b 3 3b 3-a3 (b- a)
a
b 5 - a5
5 (b- a)
Therefore, Eq.(C) becomes
2 -1 _5 - 33a) 2Z 2 5 (ba - 3 (b-a)
(where a and b are in radians)
From this we get
g o = ( Z) x 106 mgal
moongmoon
= (aZ) x - 6 mgal
Figure F-1 is a plot of error due to leveling system bias.
99
then
and
Initial Offset a (+3 min) b (-3 min) Z
e0 min min (rad) mim (rad) (g's)
0 -3 (-8.73 x 10- 4 ) 3 (8.73 x 10 - 4 ) 0.161 x 10 - 6
4 -3-61 -2 (-5.8 x 10- 4 ) 4 (1.16 x 10 - 3 ) 0.262 x 10 6
3 0 (0) 6 (1.75 x 10 - 3 ) 0.642 x 10- 6
5 2 (5.8 x 10 - 4 ) 8 (2.33 x 10- 3 ) 1.05 x 10- 6
10 7 (2.04 x 10- 3 ) 13 (3.78 x 10- 3 ) 2.08 x 10- 6
With Wider Deadband

EARTH
0.3
(mgal)
0.2
0.1
00 2 4 6
INITIAL LEVELING OFFSET, 0 o (arc minutes)
8 10
Fig. F-1 Error due to leveling system bias (assuming ± 3 arc minute pendulum deadband).
100
MOON
0.4 1

APPENDIX G
ANALYSIS OF ENVIRONMENTAL ERRORS FOR THE TG
The important information in the VSA signal lies in the difference frequency
of the two string outputs. This difference frequency is, basically, proportional to
the measured gravity (125 Hz/g being a typical scale factor). If the input axis of the
VSA is subjected to vibration (primarily from the Rover), the signal will be
frequency-modulated. If we measure this frequency at a point such that the signal
proportional to the gravity at that point is F, then we will measure Z where
Z = F + Asin wt (G-1)
where A represents the amplitude (in Hz), and w the frequency (in rad/s) of the
vibration disturbance.
If we time average Z for T seconds we get
T
Z Z dt (G-2)
0
or Z - F = A - cos )T (G-3)
Let Z - F be called E since it is, in fact, an error in our measurement.
Then
2AE 2(G-4)Emax (T4
This error in frequency measurement can be converted to a gravity error
by the scale factor (125 Hz/g). Amplitude A can also be converted from a frequency
amplitude to an acceleration amplitude, whence
E= A max125 ' g =125
101

PHASE-LOCK-LOOP FILTERAND TIME AVERAGING
ALLOWABLEACCELERATION
(g's)
CoI-.
60-SECONDTIME AVERAGING
ROVERf (Hz) FREQUENCY
1.23 Hz
Fig. G-1 Vibration sensitivity.

If we want E to be a maximum of 10-7 g, theng
2C m -7m = 10-7 (G-6)
Cm = 1.9 x 10 5f
where X = 2orf (G-7)
This defines a high-frequency error for our measurement. If, instead,
there is a very-low-frequency disturbance, clearly C = 10 7 is the maximum- 7that we can tolerate for a measured error of 10 g.
With these two assymptotes the "60-second TIME AVERAGING" curve in
Fig. G-1 can be generated.
The phase-lock loop acts like a frequency filter on a frequency-modulated
signal, so that its filtering characteristics (a third-order roll-off-with break
frequency equal to 0.14 Hz) (see Fig. G-2) can be interpreted as an increase in
allowable vibration error. With this knowledge, the phase-lock-loop curve in
Fig. G-1 can be generated.
10I
- - - WORST-CASE ESTIMATE
0 0
-10 --- 45
-20 --90A fm
(dB)
-30 - -135
SLOW LOOP
BREAD BOARD # 2
-40 OPENLOOP m-40 -180
G m 10 dB
-50 CALC WORSTCASE m 36 -225
CALC WORST CASE Gm 6 dB \
-60 I so i -2700.01 0.1 fm M 1.0
Fig. G-2 Phase-locked loop - Bode plot.
103

Let us denote these curves as x (f) in g's.
Then
x (fG-8)
since we want x (f) in inches where x (f) is in g's,
(f) 390 in. /sec 2 = (f) 10GX M 9 x ,22=2K (G-9)
10Thus, Fig. G-3 can be generated by adding log (-) to Fig. G-1.
f
G. 1 Sculling Error
Due to coupling between the vertical- and horizontal-vibration modes of the
Rover, there is a rectified error in the gravity measurement. This error can be
expressed as
E = i (t) 0 (t) = uO sin2 t (G-10)s
(E = 0 (G-1)max 2
where
ui = horizontal acceleration
0 = angle of displacement
From the Rover, we know
1..ui = - X (G-12)
and 0 = 0.18 U
where
= vertical acceleration
Thus,
(Es) = 009 (U)2 = 0.01 (X)2 (G-13)max
104

PHASE-LOCK-LOOP FILTERAND TIME AVERAGING
ALLOWABLEDISPLACEMENT
(in.)
f(Hz)
.t SCULLINGMAXIMUM
\ 60-SECONDTIME AVERAGING
10
ROVERFREQUENCY
1.23 Hz
Fig. G- 3 Displacement sensitivity.
102
10
10-1
10-2
10-3oI-.
10-4
10-5
10-6
10-7
10-3 10-1
N
I
I
'
4, 10210310-2

To keep this error less than 10 - 7 then,
2 -52 = 10 (G-14)max
-3max = VTx 10 g (G-15)
This is shown as "SCULLING MAXIMUM" in Fig. G-1 (and its corresponding
displacement of 3 x 10 - 2 inches at 1.23 Hz).
106

PART II
FINAL ADMINISTRATIVE REPORT
by
Ralph Bailey
Robert P. Malieswski
107

PRECEDING PAGE BLANK NOT FILMED
SECTION 1
PURPOSE
The purpose of this part of the report is to provide a record of the tasks
accomplished to design, develop, fabricate, test, and deliver a flight
qualified Traverse Gravimeter Experiment, including associated
hardware and documentation.
This report has been prepared in a logical sequence considering all
program tasks as they appear in the contract and Statement of Work
(S. O. W. ). Time sequence and organizational sequence are not
considered relevant.
109 '

SECTION 2
DELIVERABLE HARDWARE
The items to be delivered were as follows:
Unit Description
1 Breadboard Unit
2 Engineering Unit
3 Structural/ThermalMock-up
4 Interface Mock-up
5 Training Mock-up
6 Prototype Unit
7 Qualification Unit
8 Flight Unit #1
9 Flight Unit #2Refurbished Prototype
10 GSE Prototype
11 GSE #1
12 GSE #2
Reference
TGE INSTRUMENT
Preliminary Designand Concept Evaluation
Section 1. 4.4 ofExhibit B
Section 1. 4. 6 ofExhibit B
SectionExhibitfor LM
1. 4. 7 ofB - one eachand Rover
Section 1. 4. 7 ofExhibit B
Section 1. 4. 3 ofExhibit B
Section 1. 4. 2 ofExhibit B
Section 1. 4. 1 ofExhibit B
Section 1. 4. 1 ofExhibit B
Section 1. 4. 8 ofExhibit B
DeliverySchedule
Residual
Residual
Residual
7-1-71
8-1-71
12-1-71To be returned toContractor forrefurbishment asFlight Unit #2
1-15-72
4-11-72
5-15 -72
12-1-71 1 set
2-1-72 1 set
4-11-72 1 set
110

2.1 Breadboard Unit
Development of the Breadboard Unit began in January 1971 and was com-
pleted in August 1971. The Breadboard Unit is considered residual
hardware.
The Breadboard Unit verified the gravimeter conceptual design and was
used to demonstrate the functional and operational modes at the Critical
Design Review in September 1971 thereby establishing design baseline.
Thermal testing of the Oven Assemblies for design evaluation was also
accomplished using the Breadboard Unit.
2. 2 Engineering Unit
The development of the Engineering Unit began in January 1971 and the
assembly was completed in September 1971. The Engineering Unit is
considered residual hardware.
The unit was used to verify environmental design goals and instrument
performance. Environmental testing was performed using dummy-mass
modules to verify design and environmental and functional tests;
actual modules were completed to verify performance. Failure of the
VSA during vibration testing initiated the design of a vibration shock
mount (ISOFRAME) which was fabricated and successfully tested.
Upon completion of all engineering tests, the Engineering Unit was
retrofitted with a flight spare E Frame/Oven Assembly and was used
for all field tests relative to astronaut/pallet/Rover interface verifi-
cation.
2.3 Structural Mock-up Unit
The structural mock-up was developed to test the mechanical integ-
rity of the gravimeter design. Effort began April 1971 and testing
was conducted through March 1972. The structural mock-up is con-
sidered residual hardware.
Vibration tests with the shock mount attached to the structural mock-up
verified the design of the Isoframe.
The thermal blanket was installed on the structural mock-up and was
vibrated successfully in the X, Y and Z flight axes.
111

2.4 Thermal Mock-up
The development of a thermal mock-up unit required for simulated-mis-
sion environmental testing verified the calculations obtained from the
computer thermal model.
The thermal resistances of the gimbal bearings, temperature-controlled-
heater sizes, hot-mission thermal margin, and the cold-mission power
budget were determined by environmental testing.
This effort was started June 15, 1971 and completed November 15, 1971.
The thermal mock-up unit is considered residual hardware.
2.5 Astronaut Interface Unit
An astronaut interface model was presented at the Delta Preliminary
Design Review in Houston April 15, 1971 for JSC evaluation. This
unit was requested by JSC, but was not considered contractual hard-
ware.
2.6 Interface Mock-up Units
The development of two interface mock-up units required for astronaut,
lunar rover vehicle, and lunar module stowage pallet interface verifica-
tion was started April 1971 and completed March 1972.
The Interface mock-up S/N 001 was sold off and hand carried to JSC
March 29, 19'72.
The Interface mock-up S/N 002 has not been sold off pending JSC
action.
2. 7 Training Mock-up Unit
The development of a Training mock-up unit for Interface verification
and astronaut training was started in April 1971 and delivered to JSC
October 29, 1971; reference GRV-54-L, TGE Monthly Progress Report
for October 1971.
A retrofit kit for the training unit was sold off and shipped February 24,
1972.
2.8 Prototype Unit
The requirement for the production prototype was deleted from the
contract by MSC acceptance of Engineering Change Proposal number
11. The ECP was submitted November 5, 1971 and approved by JSC
March 2, 1972 (reference CCA Number 4). [Where applicable, Class A
parts of the prototype unit were utilized for the flight units.
112

2.9 Qualification Unit
The requirement for a Qualification unit was deleted from the contract
by Contract Change Amendment number 4, March 2, 1972.
2. 10 Flight Unit S/N 1
Flight unit S/N 1 effort started September 1971 and was certified for
acceptance testing at QTRR, July 20, 1972. The flight unit was tested
successfully, sold off, and shipped to Kennedy Spacecraft Center
November 1, 1972.
2.11 Flight Unit S/N 2
Flight Unit S/N 2 was used for formal acceptance and qualification test-
ing. The flight unit was certified at QTRR, July 20, 1972. The flight
unit was then reworked and functionally retested for flight spare status.
This effort started December 1971 and was sold off and shipped to
Kennedy Spacecraft Center November 6, 1972.
2. 12 Ground Support Equipment
Development of ground support equipment started in February 1971 and
was completed in October 1972. In July 1972 additional ground support
end items were developed to support the instrument during transporta-
tion, handling, and testing at Kennedy Spacecraft Center.
2. 12. 1 GSE Prototype
Prototype ground support equipment was used to support functional and
environmental qualification and acceptance testing performed at the
Charles Stark Draper Laboratory. GSE prototype hardware is considered
residual.
2. 12.2 GSE #1, GSE #2
Ground support equipment for flight systems S/N 1 and S/N 2 was sold
off and delivered to Kennedy Spacecraft Center, October 26, 1972.
113
SECTION 3
DELIVERABLE DOCUMENTATION
Documentation items were to be delivered as follows:
Exhibit ASection
Item Reference No.
1 5.2. 1
2
3
4
5
6
7
8
9
10
11
12
13
14
15
16
17
5. 2. 23
5. 2. 2
5.2. 3
5. 2.4
5. 2. 5
5. 2. 6
5. 2. 7
5.2. 8
5.2. 9
5. 2. 10
5. 2. 11
5. 2. 12
5. 2. 13
5. 2. 14
5.2. 15
5.2. 16
18 5. 2.17
Document
Monthly Progress and FinancialManagement Reports
Interface Information Documentation
End Item SpecificationsPrelim - 3 wks prior to CDRFinal - 2 wks after CDR
Engineering Drawings
Quality Assurance Plan
Quality Test Specification
Qualification Test Procedures
Qualification Test Report
Acceptance Test Specification
Acceptance Test Procedure
Acceptance Review Reports
Reliability Program Plan
Safety Plan
Management Plan
Spares Requirements
Review Minutes
Pre-Launch Test RequirementsPackage
Hardware Support Requirements
114
Do cumentType
II
II
I
I
I
I
II
II
I
II
I
I
I
I
I
I
II
II
Exhibit ASection
Item Reference No.
19 5.2.18
20 5.2.19
21 5.2.20a
22 5.2.2b
23 5. 2. 20c
24 5.2.20d
25 5.2.20e
26 5.2.21
27 5.2.22
3. 1 Monthly Progress
Document
Operation and Instruction Manuals
Acceptance Data Packages
Certification Test Specification
Other Test Specifications
Test Procedures
Test Reports
GSE Calibration Data Reports
Final Report
Technical Reports
and Financial Management Reports
Monthly progress and financial management reports were submitted
to JSC in accordance with the contract schedule. Reports were sub-
mitted as follows:
Date Submitted
17 February 1971
25 March 1971
7 May 1971
2 June 1971
7 July 1971
5 November 1971
5 November 1971
5 November 1971
8 November 1971
24 November 1971
22 December 1971
9 March 1972
9 March 1972
9 March 1972
21 April 1972
25 May 1972
28 June 1972
Reference
GRV-14-L
GRV-19-L
GRV-20-L
GRV-25-L
GRV-30-L
GR V -48-L
GRV-48-L
GRV-48-L
GRV-49-L
GRV-54-L
GRV-57-L
GRV-63-L
GRV-63-L
GRV-63-L
GRV-66 -L
GR;V-71-L
GRV-75-L
115
DocumentType
II
II
I
I
II
II
II
I
II
Year
1971
1972
Month
January
February
March
April
May
June
July
August
September
October
November
December
January
February
March
April
May

Month Year Date Submitted Reference
June 1972 14 August 1972 GRV-79-L
July 29 August 1972 GRV-86-L
August 2 October 1972 GRV-93-L
September 9 November 1972 GRV-95-L
October 9 November 1972 GRV-95-L
November December 1972 GRV-98-L
3. 2 Interface Information Documentation
MIT/CSDL attended interface meetings and supplied technical inter-
face requirements that were approved by GAEC and JSC. No deliver-
able Type I - Interface Information Documentation was generated by
MIT/CSDL. The Traverse Gravimeter Experiment complies to the
Interface requirements as defined in the CE IDS 2025000.
3. 3 End Item Specifications
Contract End Item Specifications for the TGE 2025000 and TGE/GSE
2025900 were prepared in accordance with the requirements of para-
graph 5.2.2 Exhibit A, S. O. W. Traverse Gravimeter. After initial
release the specifications were controlled and maintained by MIT/CSDL
Design Review Board and Configuration Control Board in accordance
with the requirements of E-2509 NASA Experiments Configuration Plan,
approved by JSC May 4, 1971; reference EG14-71-87-EH.
Revision B to Contract End Item Detail Specification, Part I - Perform-
ance/Design and Qualification Requirements for the Traverse Gravi-
meter experiment, 2025000 was approved by JSC on May 31, 1972
(ECR 20510). Revision B reflects the final performance and design re-
quirements of the TGE.
Revision D to Contract End Item Detailed Specification, Part II - Product
Configuration and Acceptance Test Requirements for the Traverse Gravi-
meter Experiment, 2025000 was approved by JSC on 14 October 1972
(ECR 20578). Revision D reflects the final configuration of the TGE.
Revision C to Contract End Item Detail Specification, Performance/
Design and Qualification Requirements for the Traverse Gravimeter
Ground Support Equipment, 2025900 was approved by JSC on 25 October
1972 (ECR 20610). Revision C reflects the final configuration of the
Ground Support Equipment.
116

3. 4 Engineering Drawings
Engineering drawings were prepared to the normal drafting standards
of MIT/CSDL and met the content and format requirements of paragraph
5. 2. 3, Exhibit A, S. O. W. Traverse Gravimeter Experiment. The
following deliverable drawings were prepared:
275 Flight Hardware Mechanical Drawings
75 Electrical Assemblies
100 Source Control Documents (SCD's)
17 Schematics
130 Ground Support Equipment drawings
All deliverable drawings were maintained and controlled by Engineering
Change or Release order and approved by MIT/CSDL Design Review
Board and Configuration Control Board in accordance with the require-
ments of E-2509 NASA Experiments Configuration Plan approved by
JSC May 4, 1971; reference EG14-71-87-EH.
3. 5 Quality Assurance Plan
The Quality Assurance Plan was prepared in accordance with paragraph
5. 2. 4, and Appendix I, Exhibit A, S. O. W. Traverse Gravimeter
Experiment. The plan was approved by JSC, reference NASA memo
EG 14-71-87-EH, and subsequently implemented.
3. 5. 1 Quality Operating Plan
Quality Operating Procedures (QOP) were submitted to JSC to fulfill
requirements for a Quality Operating Plan.
3. 5.2 Process Specifications
Process Specifications for welding and soldering were prepared and
implemented in accordance with the contractual welding and soldering
requirements; reference TGE Process Specifications 5000, 5006 and
GRV-57-T, Review of PS5000 - Weld Specification.
3.5.3 Corrosion, Contamination, and JSC Criteria and Standards
The requirements for corrosion prevention, contamination control and
MSC Criteria and Standards, MSC8080, were met and incorporated in
the hardware build documentation; reference GRV-69-L, GRV-72-L,
GRV-110-A and GRV-74-L, MSC Criteria and Standards for TGE and
Ground Support Equipment.
117

3.6 Quality Test Specification
The Qualification Test Specification 2025808 was prepared in accordance
with the requirements of the TGE Contract End Item Detail Specification
2025000, Part I. The document was initially released May 10, 1972
ECR No. 20379 and approved by JSC May 31, 1972; reference EG9-
72 -88.
The following revisions to the document were incorporated through
the approval of Engineering Change Releases.
Revision ECR No. MSC Approval Date
A 20509 July 7, 1972
B 20536 August 11, 1972
C 20556 September 20, 1972
D 20576 October 4, 1972
3.7 Qualification Test Procedures
The Qualification Test Procedures, 2025810, were prepared and met
the content of paragraph 5. 2. 6 Exhibit A, S. O. W. Traverse Gravi-
meter Experiment. The document was initially released and approved
June 1, 1972; reference ECR No. 20475.
The following revisions were formally submitted and approved by MIT/
CSDL Design Review Board and Configuration Control Board and sub-
mitted to JSC.
Revision ECR No. MIT/CSDL Approval Date
A 20508 July 7, 1972
B 20557 August 30, 1972
C 20575 October 4, 1972
The Qualification Support Battery test procedure was prepared and
approved August 28, 1972; reference GRV 209T, ERR No. P-10187.
3. 8 Qualification Test Report
Results of qualification tests were documented in Qualification Test
Report 2025815 and submitted to JSC, November 23, 1972; reference
GRV-97-L.
3. 9 Acceptance Test Specification
The acceptance test requirements for the Traverse Gravimeter Exper-
iment were incorporated in the Contract End Item Detail Specification
2025000, Part II.
118

3. 10 Acceptance Test Procedures
The Acceptance Test Procedure, 2025811, was prepared and met the
content of paragraph 5. 2.9, Exhibit A, S. O. W. Traverse Gravimeter
Experiment.
The document was initially released and approved July 14, 1972;
reference ECR No. 20513. Revision A was formally submitted and
approved September 9, 1972; reference, ECR No. 20558.
3. 11 Acceptance Review Reports
An Acceptance Review Report was prepared for the Customer Accept-
ance Readiness Review; October 19, 1972, and met the requirements of
paragraph 5. 2. 10, Exhibit A. S. O. W. Traverse Gravimeter; reference
GRV94L, Minutes of QAR and CARR, Traverse Gravimeter.
The Review Item Dispositions and the Open Item List were closed out
prior to sell off of the equipment; reference Acceptance Data Packages.
3. 12 Reliability Documentation
The reliability program documentation was prepared and the reliability
plan was implemented in accordance with paragraph 5.2. 11, and Appendix
II, Exhibit A, S. O. W. Traverse Gravimeter Experiment.
3. 12. 1 Reliability Program Plan
The Reliability Program Plan 2025805 was prepared and submitted for
JSC approval March 29, 1971; reference GRV-18-L, Submittal of
Reliability Program Plan. The Reliability Program Plan was approved
May 4, 1971; reference NASA Memo EG14-71-87EH.
3. 12.2 Nonmetallic Materials
The nonmetallic materials used in the Traverse Gravimeter Experiment
were identified and a list submitted to JSC September 21, 1972; reference
GRV-90-L.
3. 12. 3 Failure Modes and Effects Analysis
Failure Modes and Effects Analysis were completed in accordance with
Quality Operating Procedure Number 18. The Failure Modes and Effects
Analysis report was presented at the Critical Design Review. Copies
of the report were submitted to JSC September 27, 1972; reference
GRV-92-L, NASA memo EG 9-72-20, GRV-52-L.
119

3. 12. 4 Problem Failure Reporting and Corrections
Problem Failure Reporting and Corrections were prepared and incor-
porated in the end item data packages.
3. 12. 5 Electrical, Electronic and Electromechanical Parts List
The Electrical, Electronic and Electromechanical Parts List was pre-
pared and submitted to JSC January, 1972. The Parts List was up-
dated as requested by JSC and resubmitted April 6, 1972 and September 6,
1972; reference GRV-62-L, GRV-107-A, GRV-89-L, NASA memo
EG9-72-19.
3. 12. 6 Deviation and Waiver Reports
Deviation and Waiver Reports were formally submitted to JSC and were
shipped as part of the end item acceptance data packages.
3. 13 Safety Plan
The Safety Plan 2025804 was prepared in accordance with the requirements
of Paragraph 5. 2. 12 and Appendix IV, Exhibit A, S. O. W. Traverse Grav-
imeter Experiment.
The Safety Plan was initially released and submitted July 21, 1971;
reference GRV32L. JSC approved the document September 27, 1971;
reference, EG9-71-161-EH.
3.14 Management Plan
The Management Plan, E2509 "NASA Experiments Configuration Plan"
was prepared and met the content of paragraph 5. 2. 13, and Appendix
III Exhibit A, S. O. W. Traverse Gravimeter Experiment.
The Management Plan was submitted December, 1970 and approved by
JSC May 4, 1971; reference EG14-71-87-EH.
3. 15 Spares Requirements
The Spares Requirement document was prepared and met the content
of paragraph 5. 2. 14, Exhibit A, S. O. W. Traverse Gravimeter Exper-
iment. The document was submitted February 23, 1971; reference
GRV16L.
Additional spares requirements are identified in the Acceptance Data
Packages.
120

3. 16 Review Minutes
The Review Minutes for the Preliminary Design Review and the Critical
Design Review were prepared and met the requirements of paragraph
5.2. 15 Exhibit A, S. O. W. Traverse Gravimeter Experiment.
The Preliminary Design Review minutes were approved by JSC,
March 8, 1971, reference, GRV-17-L, Minutes of Preliminary Design
Review, Traverse Gravimeter Experiment.
The Critical Design Review minutes were approved by JSC, September
29, 1971, reference GRV/DOC 71-25, Minutes of Critical Design Review,
Traverse Gravimeter Experiment.
The final disposition of action items (RID's) defined at CDR were submit-
ted to JSC November 9, 1971, reference GRV-50-L, Disposition of RID's
originated at CDR.
3. 17 Integration and Pre-Launch Test Requirements Package
Pre-Launch Test Requirements 2025806 was initially released and approved
(ECR 20614) by JSC October 27, 1972. The test requirements package
was prepared to describe the TGE test requirements and Pre-Launch Test
Specifications and Procedures. Included in the package were special
handling instructions for the TGE, detailed test procedures to be per-
formed at KSC and operation instructions for the Ground Support Equip-
ment to be used at KSC.
3. 18 Hardware Support Requirements
A document containing the Hardware Support Requirements for the
Traverse Gravimeter Experiment was not formally prepared.
Internal MIT/CSDL memos and verbal agreements between JSC, KSC,
GAEL, and MIT/CSDL defined the extent of support required.
3. 19 Operation and Instruction Manuals
The Traverse Gravimeter Operation and Instruction manual 2025899 was
prepared and met the requirements of paragraph 5.2. 18, Exhibit A,
S. O. W. Traverse Gravimeter Experiment. The manual was submitted
to JSC, September 18, 1972; reference GRV-91-L Transmittal of Type II
Documentation.
Special handling for the TGE and operations and instructions for the
Ground Support Equipment are contained in the Pre-Launch Test
Requirements document 2025806; reference: Customer Acceptance
Readiness Review (CARR) Review Item Disposition (RID), number four.
121

3. 20 Acceptance Data Packages
Acceptance Data Packages for each deliverable end item of flight and
GSE hardware were prepared in accordance with the requirements of
paragraph 5. 2. 19 Exhibit A, S. O. W. Traverse Gravimeter Experiment
and Section 7, Appendix I, Traverse Gravimeter Experiment-Quality
Program Requirements. Data packages were shipped with each deliver-
able end item.
3.21 Test Documentation
3. 21. 1 Certification Test Specification
The Certification Test Specification 2025807 was prepared in accordance
with the technical requirements of the TGE Contract End Item Detail
Specification, 2025000. The document was released at Revision A and
approved by JSC June 6, 1972; reference EG9-72-83.
The following revisions to the documents were incorporated through the
approval of Engineering Change Releases.
Revision ECR Number JSC Approval Data
B 20511 5/31/72
C 20608 10/20/72
The Ground Support Equipment for the TGE is classified as MSE Class II
and thereby eliminated the need for a GSE Certification Test Specification.
3. 21. 2 Other Test Specifications
The Certification Test Specification 2025807, Qualification Test Specifica-
tion 2025808, and the TGE Contract End Item Detail Specification, 2025000,
Part II defined the performance criteria and test requirements for the
Traverse Gravimeter Experiment.
3. 21. 3 Test Procedures
Test procedures were prepared for each type of test and met the require-
ments of paragraph 5. 2. 20c, Exhibit A, S. O. W. Traverse Gravimeter
Experiment. The following test procedures were prepared and approved
by MIT/CSDL Design Review Board and Configuration Control Board and
submitted to JSC as Type II documents:
122

QUA LIFICATION'TEST PROCEDURES
NUMBER REV. ECR No.APPROVAL
DATE
Launch Depressurizatio
TG Visual Inspection
TG Workmanship Vibral
TG Performance Test
TG Current Monitor
TG Temperature Test
Baseline Verification To
TG Level Test
TG Thermal Vacuum
Qualification Vibration
Operational Test During
Vibration Verification
Isoframe/MechanicalUnit Vib.
TG Isoframe Inspection
(Traverse Gravimeter)
n 25085 IR
25055 IR
tion 25030 IRA
20545 IRABC
25015 IRAB
25025 IRA
est 25075 IRAB
25020 IRAB
25035 IRA
25080 IR
, TV 25036 IRA
25076 IR
20475
20475
2047520550
20492205352055320597
204752051920547
2047520549
204752052020554
205172054820567
20521
20542
2052820551
20531
(Isoframe)
25081
25056
IR 20532 7/28/72
IR 20540 8/17/72
ACCEPTANCE TEST PROCEDURES
NUMBER REV. ECR No.APPROVAL
DATE
(Traverse Gravimeter)
Launch Depressurization
TG Weight & CG Inspection
TG Blanket Inspection
TG Workmanship Vibration
25086
25057
25058
25030
IR 20541A 20555
IR 20561
IR 20562
IR 20475A 20550
123
TITLE
5/24/72
5/24/72
5/24/729/14/72
6/8/728/17/729/14/7210/17/72
5/24/727/14729/14/72
5/24/729/14/72
5/24/727/14/729/14/72
7/14/727/14/7210/4/72
7/21/728/2/72
8/17/72
7/26/729/14/72
7/28/72
TITLE
8/17/729/14/72
9/14/72
9/14/72
5/24/729/14/72

ACCEPTANCE TEST PROCEDURES (Continued)
NUMBER REV. ECR No.APPROVAL
DATE
(Traverse Gravimeter)
TG Performance Test 25045 IRABC
TG Current Monitor 25015 IRAB
TG Temperature Test 25025 IRA
Baseline Verification Test 25075 IRAB
TG Level Test 25020 IRAB
TG Thermal Vacuum Test 25037 IRA
Operational Test 25036 IRDuring TV A
Vibration Verification 25076 IR
Assembly of Thermal 25200 IRBlanket
TGE Assembly andDisassembly Procedures
TG Isoframe Inspection
25201
20492205352055320597
204752051920547
2047520549
204752052020554
205172054820567
2052120552
2052820551
20531
20568
6/8/728/17/729/14/7210/17/72
5/24/727/14/729/14/72
5/24/729/14/72
5/24/727/14/729/14/72
7/14/729/14/7210/4/72
7/21/729/14/72
7/26/729/14/72
7/28/72
10/4/72
IR 20581 9/15/72
(Isoframe)
25056 IR 20540 8/17/72
Breakout Box
I Oven Vacuum Fixture
Pushbutton A ctuator
Level/Measure Light
Power Panel Assembly
Earth Moon Adapter
Tee Connector Assembly
ound Support Equi
25905
25900
25901
25903
25902
25906
25904
.pment)
IR 20559
IR 20559
IR 20559A 20570
IR 20559A 20599
IR 20607
IR 20574A 20583B 20613
IR 20587A 20612
124
TITLE
9/14/72
9/14/72
9/14/729/26/72
9/14/7210/12/72
10/2/72
10/2/7210/25/7210/26/72
10/2/7210/25/72

3.21. 4 Test Reports
The following Test Reports have been prepared for the tests conducted
in accordance with the requirement of the Contract End Item Detail
Specification, 2025000, and meet the content of paragraph 5. 2. 20d.
1. Traverse Gravimeter FS-2 Qualification Unit TestReport - 2025814, submitted to JSC November, 1972.
2. Traverse Gravimeter Pre-Installation Test Report -2025806, submitted to JSC November 1972.
3. Calculated Effective Emittance of Radiator Cover Basedon Engineering Tests - GRV-199-T. Submitted to JSC,June 26, 1972.
4. Wire Test Requirements of MSCM 8080 Standard 95A;reference GRV-127-T. Submitted to JSC, December, 1971.
3.21.5 Calibration Data Reports.
Ground support equipment that required calibration was calibrated and
tagged by MIT/CSDL Calibration Department prior to sell off of the equip-
ment. Calibration Data Reports for each deliverable set of GSE were not
prepared in accordance with paragraph 5. 2. 20e, Exhibit A, S. O. W.
Traverse Gravimeter Experiment.
3.22 Final Report
This two-part document comprises the final report on the Traverse Gravimeter
Experiment.
3.23 Technical Reports
The following technical reports were prepared and contain the results of
studies and analyses performed during the development phase of the
program:
1. Testing of aVibrating String Accelerometer for use in aLunar Gravimeter - E-2721. Submitted to JSC December, 1972.
2. Traverse Gravimeter for the Lunar Surface E-2603. Submittedto JSC July, 1972.
3. Traverse Gravimeter Final Engineering Report. Part I of this document.
4. Five-Day Mission Evaluation Report - GRV-227-T. Submitted to JSCDecember, 1972.
5. Traverse Gravimeter Users Guide. Submitted to JSCApril, 1971.
6. Traverse Gravimeter Training Unit Manual. Submittedto JSC March 29, 1972.
7. Interim Test Plan of the Traverse Gravimeter Experiment-ITP 202500. Submitted to JSC, May, 1972.
8. Lunar Gravimeter Interim Study Report E2535. Submittedto JSC, December 15, 1970.
125
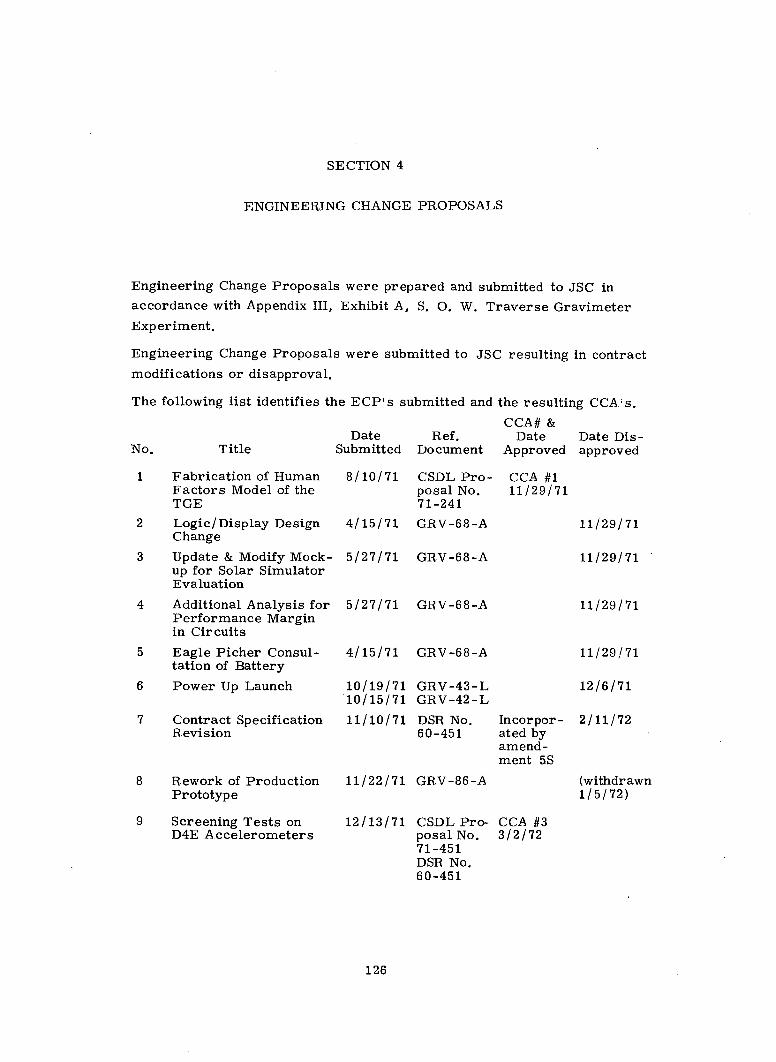
SECTION 4
ENGINEERING CHANGE PROPOSALS
Engineering Change Proposals were prepared and submitted to JSC in
accordance with Appendix III, Exhibit A, S. O. W. Traverse Gravimeter
Experiment.
Engineering Change Proposals were submitted to JSC resulting in contract
modifications or disapproval.
The following list identifies the ECP's submitted and the resulting CCA s.
Title
CCA# &Date Ref. Date
Submitted Document ApprovedDate Dis-approved
1 Fabrication of HumanFactors Model of theTGE
2 Logic/Display DesignChange
3 Update & Modify Mock-up for Solar SimulatorEvaluation
4 Additional Analysis forPerformance Marginin Circuits
5 Eagle Picher Consul-tation of Battery
6 Power Up Launch
7 Contract SpecificationRevision
8 Rework of ProductionPrototype
9 Screening Tests onD4E Accelerometers
8/10/71 CSDL Pro-posal No.71-241
4/15/71 GRV-68-A
5/27/71
5/27/71
GRV-68-A
GRV-68 -A
CCA #111/29/71
11/29/71
11/29/71
11/29/71
11/29/71
12/6/71
2/11/72
(withdrawn1/5/72)
4/15/71 GRV-68-A
10/19/71 GRV-43-L10/15/71 GRV-42-L
11/10/71 DSR No. Incorpor-60-451 ated by
amend-ment 5S
11/22/71 GRV-86-A
12/13/71 CSDL Pro-posal No.71-451DSR No.60-451
CCA #33/2/72
126
No.

CCA# &Date Ref. Date
Submitted Document Approved
10 Screening of 54LSeries IntegratedCircuits
11 Alternate ContractApproach
12 Capability Retention:Post AcceptanceTesting and Operation-al Support
13 Vibration Isolation
14 Astronaut FieldTraining
15 Spare E- FrameAssembly
1/17/72 GRV-94-L
3/2/72 GRV-101-A
3/3/72 GRV-102-A
5/24/72 GRV-112-A
5/9/72 GRV-118-AGRV-122-A.
7/24/72 GRV-131-A
127
No. TitleDate Dis-approved
CCA #21/5/72
C'CA #43/30/72
CCA #66/29/72
CCA #55/2/72
CCA #77/12/72
CCA #88/14/72

SECTION 5
PROGRAM MEETINGS
5. 1 Preliminary Design Review (PDR)
The preliminary Design Review (PDR) was held at the Charles Stark
Draper Laboratory, Cambridge, Mass., on February 23 and 24, 1971.
Copies of all presentation material was distributed to all attendees
at the time of presentation. Each distrubution included:
87 View Graphs
1 TGE Functional Description
1 Preliminary Copy of Part I of Contract End Item Specification
1 Agenda
Additionally, the Spares Requirements list was submitted for approval as
required by the contract.
Meeting minutes were submitted to JSC and all attendees on February 26,
1972; reference GRV-17-L.
Elaboration and detailed design information relative to thermal design
was requested by NASA personnel in attendence and was made the sub-
ject of a subsequent meeting.
5.2 Delta Preliminary Design Review (APDR)
The Delta Preliminary Design Review was held at Johnson Spacecraft
Center, Houston, Texas on April 15, 1971.
Detailed design information relating specifically to the TGE thermal design,pallet interface, and astronaut controls and displays was presented. Ana-
lytical results from a thermal model of the instrument indicated the feasi-
bility of operating on thermal inertia during a traverse with the radiator
closed.
The basic thermal design was approved as were the controls, display and
TGE/pallet interface designs.
The final disposition of action items (RID's) defined at APDR were submit-
ted to JSC June 14, 1971; reference GRV-65-T, "RID's from Delta PDR
on April 15, 1971. "
128
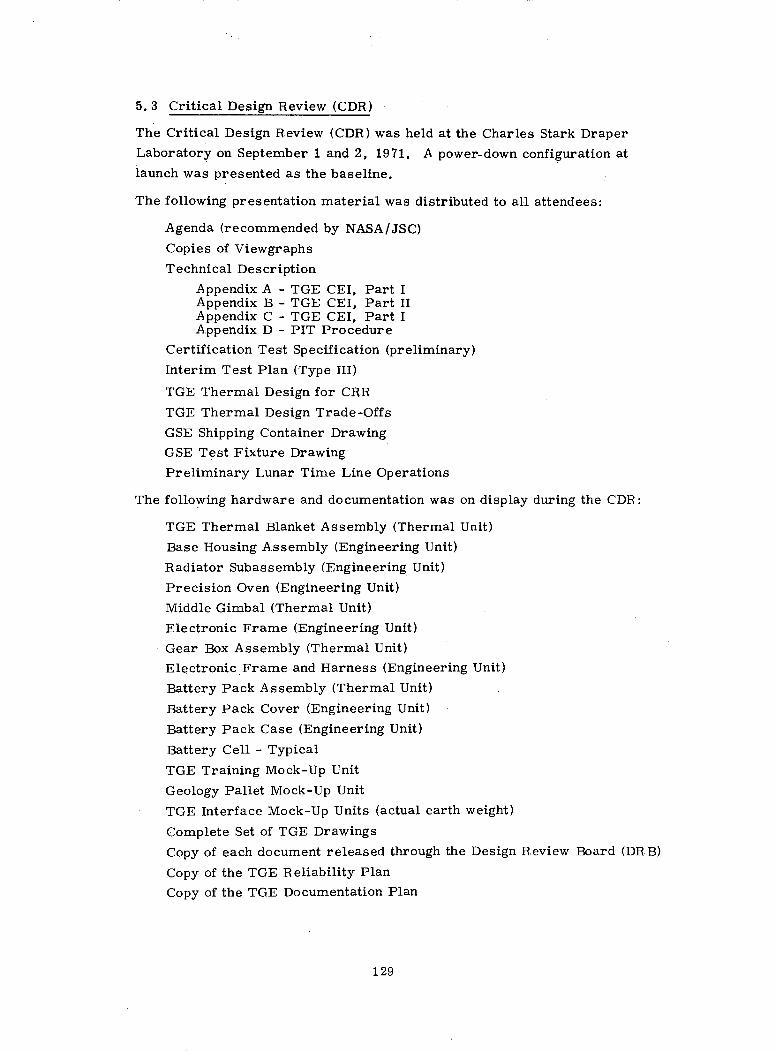
5. 3 Critical Design Review (CDR)
The Critical Design Review (CDR) was held at the Charles Stark Draper
Laboratory on September 1 and 2, 1971. A power-down configuration at
launch was presented as the baseline.
The following presentation material was distributed to all attendees:
Agenda (recommended by NASA/JSC)
Copies of Viewgraphs
Technical Description
Appendix A - TGE CEI, Part IAppendix B - TGE CEI, Part IIAppendix C - TGE CEI, Part IAppendix D - PIT Procedure
Certification Test Specification (preliminary)
Interim Test Plan (Type III)
TGE Thermal Design for CRR
TGE Thermal Design Trade-Offs
GSE Shipping Container Drawing
GSE Test Fixture Drawing
Preliminary Lunar Time Line Operations
The following hardware and documentation was on display during the CDR:
TGE Thermal Blanket Assembly (Thermal Unit)
Base Housing Assembly (Engineering Unit)
Radiator Subassembly (Engineering Unit)
Precision Oven (Engineering Unit)
Middle Gimbal (Thermal Unit)
Electronic Frame (Engineering Unit)
Gear Box Assembly (Thermal Unit)
Electronic Frame and Harness (Engineering Unit)
Battery Pack Assembly (Thermal Unit)
Battery Pack Cover (Engineering Unit)
Battery Pack Case (Engineering Unit)
Battery Cell - Typical
TGE Training Mock-Up Unit
Geology Pallet Mock-Up Unit
TGE Interface Mock-Up Units (actual earth weight)
Complete Set of TGE Drawings
Copy of each document released through the Design Review Board (DR B)
Copy of the TGE Reliability Plan
Copy of the TGE Documentation Plan
129

The meeting opened with a presentation of the program goals, accomplish-
ments and schedule. Subsequent presentations defined design objectives
and parameters including construction and packaging techniques of the
instrument. Development testing was identified and the Interface, Train-
ing and Breadboard Units were demonstrated. Proposed ground support
equipment, KSC preflight operations and a Lunar Operations Time Line
were identified.
Engineering drawings, SCD's and the reliability program were reviewed
in a separate meeting.
Meeting minutes were submitted to JSC; reference GRV/DOC 71-25,
Minutes of Critical Design Review, Traverse Gravimeter Experiment.
The final disposition of action items (RID's) defined at CDR were sub-
mitted to JSC November 9, 1971; reference GRV-50-L, Disposition
of RID's Originated at CDR.
5. 4 Qualification Test Readiness Review (QTRR)
The Qualification Test Readiness Review was held at the Charles
Stark Draper Laboratory on July 18, 19 and 20, 1972. The Traverse
Gravimeter Serial Number (FS-2) was certified for qualification test-
ing after MIT/CSDL closed out the action items (RID's) generated at
QTRR; reference GRV-133A - Minutes of Traverse Gravimeter QTRR
and FTRR, 18 - 20, July 1972.
The Traverse Gravimeter, serial number (FS-1) was certified for flight
acceptance testing upon completion of the build cycle.
Program documentation was presented and examined to verify that the
documentation reflected the design presented at CDR in September, 1971.
The final disposition of action items (RID's) defined at QTRR, and the
meeting minutes were submitted July 25, 1972 and approved by JSC
July 29, 1972; reference GRV-133A. Additional close out of pending
action items was completed via telephone conversations with JSC.
5.5 Customer Acceptance Readiness Review (CARR)
A Customer Acceptance Readiness Review was held at Charles Stark
Draper Laboratory, October 18, 1972. A Flight Worthiness Certification
document for the Traverse Gravimeter, serial number, FS-1 and FS-2,
was issued by JSC.
130
A Qualification Assessment Review was held to review the qualification
test data for the Traverse Gravimeter, serial number, FS-2. The test
data was approved by JSC resulting in the issuance of a JSC Certifi-
cation Test Review document.
The Pre-Installation Test Procedure was reviewed. JSC's request
that special handling procedures for the TGE, and instructions for the
operation of Ground Support Equipment be incorporated in the PIT document,
eliminated the need for a separate Operations and Instruction manual for
the GSE.
The Ground Support Equipment for the Traverse Gravimeter and related
documentation was reviewed and open items were identified by JSC.
The MIT/CSDL Office of Naval Research was directed by the JSC program.
Technical Manager to verify the close out of all open items prior to delivery
of any hardware.
The QAR and CARR meeting minutes were prepared and approved by JSC
October 19, 1972; reference GRV-94-L, Minutes of QAR and CARR,
Traverse Gravimeter.
131

BIBLIOGRAPHY
Reference
P.S. 5000
P.S. 5006
E-2535
NAS 9-11555
E-2509
GRV- 14-L
GRV-16-L
GRV- 17-L
2025805
C.C.A. No. 4
GRV-19-L
GRV-18-L
GRV- 110-A
GRV-65-T
GRV- 69-L
CEI 2025000
GRV- 20-L
GRV- 72-L
GRV-25-L
GRV- 57-T
GRV- 74-L
c.>
co
C,
W
00I
II\t I
! k
Subject
Weld Specification
Solder Specification
Lunar Gravimeter Interim Study Report
Contract for Traverse Gravimeter Experiment
NASA Experiments Configuration Plan
Monthly Progress Report, January
Submittal of TGE Spares Requirements
Minutes of Preliminary Design Review -Traverse Gravimeter Experiment
Reliability Program Plan
Alternate Contract Approach
Monthly Progress Report, February
Submittal of Reliability Program Plan
MSC Criteria and Standards for TGE and GSE
Traverse Gravimeter Users Guide
RID's from Delta Preliminary Design Review
MSC Criteria and Standards for TGE and GSE
TGE Contract End Item Specification
Monthly Progress Report, March
MSC Criteria and Standards for TGE and GSE
Interim Test Plan for the Traverse Gravimeter Experiment
Monthly Progress Report, April
Review of P.S. 5000 Weld Specification
MSC Criteria and Standards for TGE and GSE
To DateFrom
MIT/DL
MIT/DL
MIT/DL
NASA
MIT/DL
MIT/DL
MIT/DL
MIT/DL
MIT/DL
NASA
MIT/DL
MIT/DL
MIT/DL
MIT/DL
MIT/DL
MIT/DL
MIT /DL
MIT/DL
MIT /DL
MIT/DL
MIT/DL
MIT/DL
MIT /DL
NASA
NASA
NASA
MIT/DL
NASA
NASA
NASA
NASA
NASA
MIT/DL
NASA
NASA
NASA
NASA
NASA
NASA
NASA
NASA
NASA
NASA
NASA
NASA
NASA
3/1/70
3/1/70
12/15/70
1/17/71
1/28/71
2/17/71
2/22/71
2/26/71
3/1 /71
3/2/71
3/25/71
3/29/71
4/11/71
4/14/71
4/15/71
5/3/71
5/4/71
5/7/71
5/25/71
5/26/71
6/2/71
6/2/71
6/12/71

BIBLIOGRAPHY (Continued)
Reference
GRV-32-L
GRV-30-L
GRV-50-L
EG9-71- 161-EH
GRV/DOC 71-25
CEI- 2025900
C-207-01
E.C.P. No. 11
GRV-48-L
GRV- 48-L
GRV- 48- L
GRV-49-L
GRV-57-L
GRV- 54-L
GRV-127-T
EG 9-72-20
GRV-63-L
GRV-63-L
GRV-63-L
GRV-62-L
Subject
Submittal of TGE Safety Plan
Monthly Progress Report, May
Disposition of RID's originated at CDR
Approval of TGE Safety Plan
Minutes of Critical Design Review -Traverse Gravimeter Experiment
GSE Contract Item Specification
Stress Analysis of Traverse Gravimeter
Alternate Contract Approach
Monthly Progress Report, June
Monthly Progress Report, July
Monthly Progress Report, August
Monthly Progress Report, September
Monthly Progress Report, November
Monthly Progress Report, October
Wire Test Requirements of MSCM 8080 Standard 95A
Critical Failures
Monthly Progress Report, December
Monthly Progress Report, January
Monthly Progress Report, February
Response to NASA Memos EG 9-72-19, 14, 20
To Date
I-c0;
From
MIT /DL
MIT /DL
MIT/DL
NASA
MIT/DL
MIT/DL
LittletonResearchandEngineeringCorp
MIT/DL
MIT/DL
MIT/DL
MIT/DL
MIT/DL
MIT/DL
MIT/DL
MIT/DL
NASA
MIT/DL
MIT /DL
MIT/DL
MIT/DL
NASA
NASA
NASA
MIT /DL
NASA
NASA
MIT /DL
NASA
NASA
NASA
NASA
NASA
NASA
NASA
NASA
MIT/DL
NASA
NASA
NASA
NASA
7/2/71
7/7/71
9/9/71
9/27/71
9/29/71
10/25/71
10/29/71
11/5/71
11/5/71
11/5/71
11/5/71
11/8/71
11/22/71
11/24/71
12/13/71
2/10/72
3/9/72
3/9/72
3/9/72
3/9/72

BIBLIOGRAPHY (Continued)
Reference
C-207-2
C-207-3
TG-017
GRV-167-T
GRV-107-A
GRV- 66-L
GRV- 167-T
EG 14-71-87-EH
ECR 20379
EG 9-72-19
C-207-4
GRV-71-L
ECR 20511
ECR 20510
EG 9-72-88
Subject
Calculated Natural Frequencies of Vibration of theTraverse Gravimeter
Estimated Acoustic Response of the Traverse Gravimeter
Internal Failure Report
Test Procedure - 24 March 1972
Traverse Gravimeter Training Unit Manual
Submittal of Electrical, Electronic andElectromechanical Parts List
Monthly Progress Report, March
Test Procedure - 24 March 1972
Approval of TGE Plans
Quality Test Specification Initial Release
Electrical, Electronic and Electromechanical Parts List
Finite Element Stress Analysis of TGE - Sub-Base
Monthly Progress Report, April
Certification Test Specification, Rev. B
CEI 202500 Part I Revision for TGE Performance & Design
MSC Approval of Quality Test Specification
To Date
coen
From
LittletonResearchandEngineeringCorp
LittletonResearchandEngineeringCorp
MIT/DL
MIT /DL
MIT/DL
MIT/DL
MIT /DL
MIT/DL
NASA
MIT/DL
NASA
L ittletonResearchandEngineeringCorp
MIT/DL
MIT/DL
MIT/DL
NASA
MIT/DL
MIT/DL
NASA
NASA
NASA
NASA
NASA
NASA
MIT /DL
NASA
MIT/DL
MIT /DL
NASA
NASA
NASA
MIT/DL
3/14/72
3/14/72
3/24/72
3/24/72
3/29/72
4/6/72
4/21 /72
4/24/72
5/4/72
5/10/72
5/15/72
5/15/72
.5/25/72
5/31/72
5/31/72
5/31/72

BIBLIOGRAPHY (continued)
Reference
ECR 20475
EG 9-72-83
C-207-5
GRV- 196-T
GRV- 199-T
GRV-79-L
ECR- 20509
ECR-20508
E-2603
ECR- 20513
GRV- 133-A
EFCR-20536
GRV-79-L
ERR P-10187
GRV-209T
GRV- 86-L
ECCR 20557
R-729(ND 2025899)
GRV 89-L
ECR 20558
Subject From
Qualification Test Procedures 2025810, Initial Release
Approval of TGE Certification Test Specification 2025807
Finite Element Stress Analysis of Redesigned TGE Sub-Base
Traverse Gravimeter Experiment - Isolator NaturalFrequencies and Maximum Acceleration (Predictedand Actual)
Calculated Effective Emittance of Radiator CoverBased on Engineering Tests
Monthly Progress Report, May
Quality Test Specification, Rev. A
Quality Test Procedures, Rev. A
Traverse Gravimeter for the Lunar Surface
Acceptance Test Procedures Initial Release
Minutes of QTRR and FTRR
Quality Test Specification, Rev. B
Monthly Progress Report, June
Qualification Support Battery Test Procedure
Transmittal of Qualification Support Battery Test Procedure
Monthly Progress Report, July
Qualification Test Procedures, Rev. B
Traverse Gravimeter Operation and Instruction Manual
Electrical, Electronic and Electromechanical Parts List
Acceptance Test Procedures, Revision A
MIT/DL
MIT/DL
LittletonResearchandEngineeringCorp
MIT/DL
MIT/DL
MIT /DL
MIT/DL
MIT /DL
MIT/DL
MIT/DL
MIT/DL
MIT/DL
MIT/DL
MIT/DL
MIT/DL
MIT/DL
MIT /DL
MIT/DL
MIT/DL
MIT/DL
To Date
NASA
NASA
MIT/DL
NASA
NASA
NASA
NASA
NASA
NASA
NASA
NASA
NASA
NASA
NASA
NASA
NASA
NASA
NASA
NASA
NASA
6/1/72
6/6/72
6/8/71
6/13/72
6/26/72
6/28/72
7/7/72
7/7/72
7/7/72
7/14/72
7/20/72
8/11/72
8/14/72
8/28/72
8/29/72
8/29/72
81/30/72
9/72
9/6/72
9/9/72
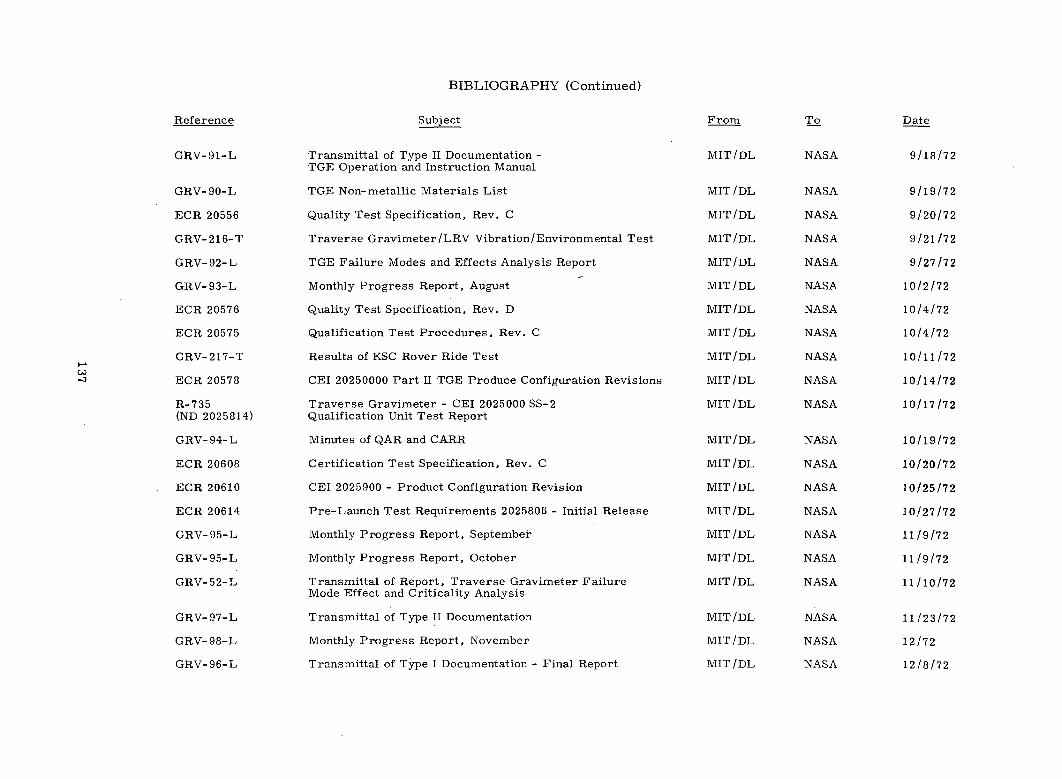
BIBLIOGRAPHY (Continued)
Reference
GRV- 91-L
GRV- 90-L
ECR 20556
GRV-216-T
GRV- 92-L
GRV-93-L
ECR 20576
ECR 20575
GRV-217-T
ECR 20578
R-735(ND 2025814)
GRV- 94-L
ECR 20608
ECR 20610
ECR 20614
GRV- 95-L
GRV- 95-L
GRV-52-L
GRV- 97-L
GRV-98-L
GRV- 96-L
Subject
Transmittal of Type II Documentation -TGE Operation and Instruction Manual
TGE Non-metallic Materials List
Quality Test Specification, Rev. C
Traverse Gravimeter/LRV Vibration/Environmental Test
TGE Failure Modes and Effects Analysis Report
Monthly Progress Report, August
Quality Test Specification, Rev. D
Qualification Test Procedures, Rev. C
Results of KSC Rover Ride Test
CEI 20250000 Part II TGE Produce Configuration Revisions
Traverse Gravimeter - CEI 2025000 SS-2Qualification Unit Test Report
Minutes of QAR and CARR
Certification Test Specification, Rev. C
CEI 2025900 - Product Configuration Revision
Pre-Launch Test Requirements 2025806 - Initial Release
Monthly Progress Report, September
Monthly Progress Report, October
Transmittal of Report, Traverse Gravimeter FailureMode Effect and Criticality Analysis
Transmittal of Type II Documentation
Monthly Progress Report, November
Transmittal of Type I Documentation - Final Report
c-3
From
MIT /DL
MIT /DL
MIT/DL
MIT/DL
MIT/DL
MIT /DL
MIT/DL
MIT /DL
MIT /DL
MIT /DL
MIT /DL
MIT/DL
MIT/DL
MIT /DL
MIT /DL
MIT /DL
MIT /DL
MIT/DL
MIT/DL
MIT/DL
MIT /DL
To
NASA
NASA
NASA
NASA
NASA
NASA
NASA
NASA
NASA
NASA
NASA
NASA
NASA
NASA
NASA
NASA
NASA
NASA
NASA
NASA
NASA
Date
9/18/72
9/19/72
9/20/72
9/21/72
9/27/72
10/2/72
10/4/72
10/4/72
10/11/72
10/14/72
10/17/72
10/19/72
10/20/72
10/25/72
10/27/72
11/9/72
11/9/72
11/10/72
11/23/72
12/72
12/8/72

BIBLIOGRAPHY (Continued)
Subject
Five Day Mission Evaluation Report
Testing of a Vibrating String Accelerometerfor use in a Lunar Gravimeter
Summary of Post-Mission Test Results
Traverse Gravimeter Experiment Final Report
Thermal-Vacuum Test of the Apollo 17Lunar Traverse Gravimeter Experiment
C
Reference
GRV-227-T
E-2721
GRV-228-T
R-739
E-2759
To DateFrom
MIT /DL
MIT/DL
MIT /DL
MIT/DL
NASA
NASA
NASA
NASA
12/14/72
12/15/72
2/21/73
4/73