april 2012 market reports
DESCRIPTION
Combined April 2012 Market ReportsTRANSCRIPT

Monthly Indicators A RESEARCH TOOL PROVIDED BY THE COASTAL CAROLINAS ASSOCIATION OF REALTORS®
April 2012 Quick Facts
23456789
10111213
All data comes from the Coastal Carolinas Association of REALTORS® Multiple Listing Service. Provided by South Carolina REALTORS®. Powered by 10K Research and Marketing. | 1
- 6.6%Change in
Closed SalesSingle-Family Only
Click on desired metric to jump to that page.
Sometimes the best answers aren't right under your nose. For example, the most popular market indicator is home prices. But prices are what we call a lagging indicator, because they reflect closed sales. Leading indicators are forward-looking. Watch activity related to list price received at sale, days on market and months supply of inventory to see how sellers might be regaining their pricing power. Favorable supply-demand trends may be ticking away from the buyer for the first time in years. Moral of the story: Price is but a single picture in the gallery.
New Listings in the Coastal Carolinas region were down 1.5 percent for detached homes and 17.8 percent for condos. Pending Sales increased 32.9 percent for single-family homes and 26.2 percent for condos.
The Median Sales Price was down 0.3 percent to $157,500 for single-family properties but increased 15.0 percent to $115,000 for condo units. Months Supply of Inventory decreased 27.5 percent for single-family units and 18.7 percent for townhouse-condo units.
When monitoring residential real estate activity, it is always important to keep tabs on the overall economy and job growth. Preliminary Q1-2012 GDP growth came in at 2.2 percent, which, while disappointing to some observers and slower than Q4-2011, still signals economic expansion and not contraction. Expedited bank processing and easing lending standards are also encouraging developments.
- 9.7%Change in
Closed SalesCondo Only
- 8.1%Change in
Closed SalesAll Properties
Single-Family Market OverviewCondo Market OverviewNew ListingsPending SalesClosed SalesDays On Market Until Sale
Months Supply of Inventory
Median Sales PriceAverage Sales PricePercent of List Price ReceivedHousing Affordability IndexInventory of Homes for Sale

Single-Family Market Overview
Key Metrics Historical Sparklines 4-2011 4-2012 + / – YTD 2011 YTD 2012 + / –
All data comes from the Coastal Carolinas Association of REALTORS® Multiple Listing Service. Provided by South Carolina REALTORS®. Powered by 10K Research and Marketing. | Click for Cover Page | 2
15.2
155 + 22.4%
- 15.9%
- 27.5%
4,098
11.0
138
--
-- --
--
--Months Supplyof Homes for Sale
Inventory of Homes for Sale
$163,000 $160,000
+ 0.6%
- 1.4% 181 181 + 0.2%
- 1.8%
+ 1.0% 94.4% 95.0%
- 6.9%
- 0.3%
- 6.5%
386 513 + 32.9% 1,451 1,753 + 20.8%
2,975740 729 - 1.5% 3,181
366 342 - 6.6% 1,224
New Listings
Pending Sales
Closed Sales
93.9% 94.8%
Housing Affordability Index
Days on Market Until Sale
Median Sales Price
Average Sales Price
Percent ofList Price Received
$209,163
Key market metrics for the current month and year-to-date figures for Single-Family Homes Only.
1,284 + 4.9%
138
4,874
182 179
155 + 22.4%
--
$212,722 $203,794 - 4.2%
$157,950 $157,500
$194,752
4-2009 4-2010 4-2011 4-2012
4-2009 4-2010 4-2011 4-2012
4-2009 4-2010 4-2011 4-2012
4-2009 4-2010 4-2011 4-2012
4-2009 4-2010 4-2011 4-2012
4-2009 4-2010 4-2011 4-2012
4-2009 4-2010 4-2011 4-2012
4-2009 4-2010 4-2011 4-2012
4-2009 4-2010 4-2011 4-2012
4-2009 4-2010 4-2011 4-2012
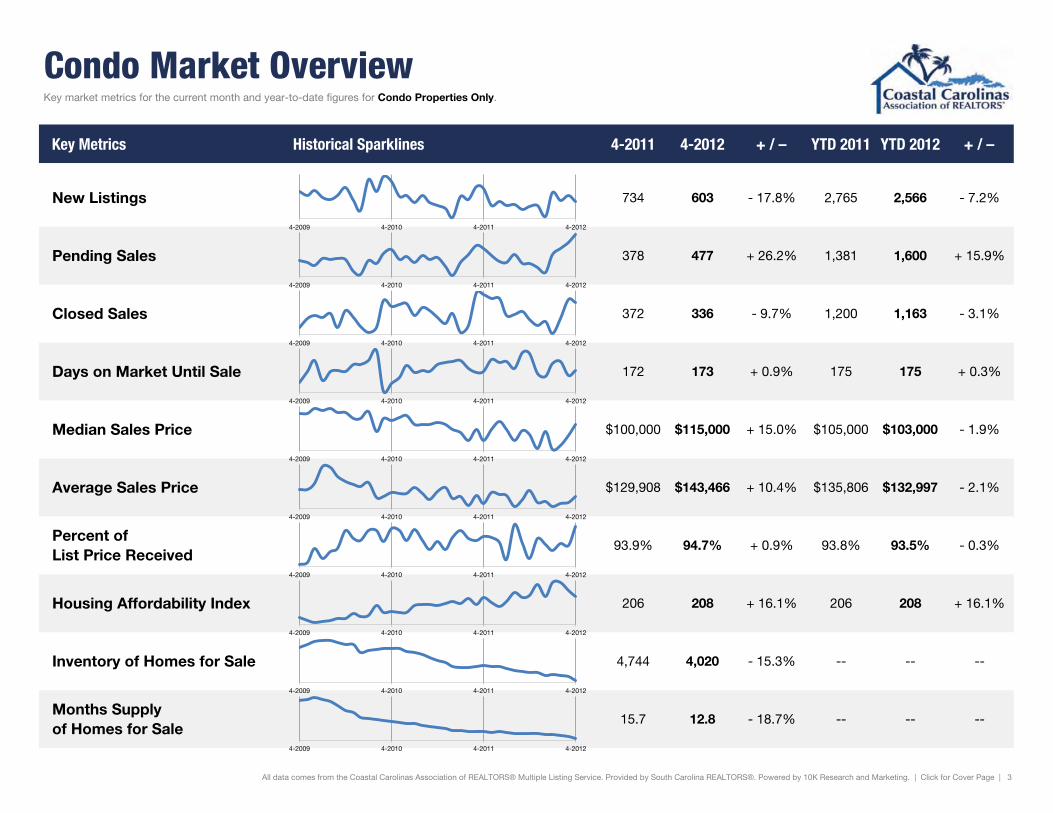
Condo Market Overview
Key Metrics Historical Sparklines 4-2011 4-2012 + / – YTD 2011 YTD 2012 + / –
All data comes from the Coastal Carolinas Association of REALTORS® Multiple Listing Service. Provided by South Carolina REALTORS®. Powered by 10K Research and Marketing. | Click for Cover Page | 3
--
Months Supplyof Homes for Sale
15.7 12.8 - 18.7% -- -- --
Inventory of Homes for Sale 4,744 4,020 - 15.3% -- --
- 0.3%
Housing Affordability Index 206 208 + 16.1% 206 208 + 16.1%
Percent ofList Price Received
93.9% 94.7% + 0.9% 93.8% 93.5%
- 1.9%
Average Sales Price $129,908 $143,466 + 10.4% $135,806 $132,997 - 2.1%
Median Sales Price $100,000 $115,000 + 15.0% $105,000 $103,000
- 3.1%
Days on Market Until Sale 172 173 + 0.9% 175 175 + 0.3%
Closed Sales 372 336 - 9.7% 1,200 1,163
Key market metrics for the current month and year-to-date figures for Condo Properties Only.
- 7.2%
Pending Sales 378 477 + 26.2% 1,381 1,600 + 15.9%
New Listings 734 603 - 17.8% 2,765 2,566
4-2009 4-2010 4-2011 4-2012
4-2009 4-2010 4-2011 4-2012
4-2009 4-2010 4-2011 4-2012
4-2009 4-2010 4-2011 4-2012
4-2009 4-2010 4-2011 4-2012
4-2009 4-2010 4-2011 4-2012
4-2009 4-2010 4-2011 4-2012
4-2009 4-2010 4-2011 4-2012
4-2009 4-2010 4-2011 4-2012
4-2009 4-2010 4-2011 4-2012
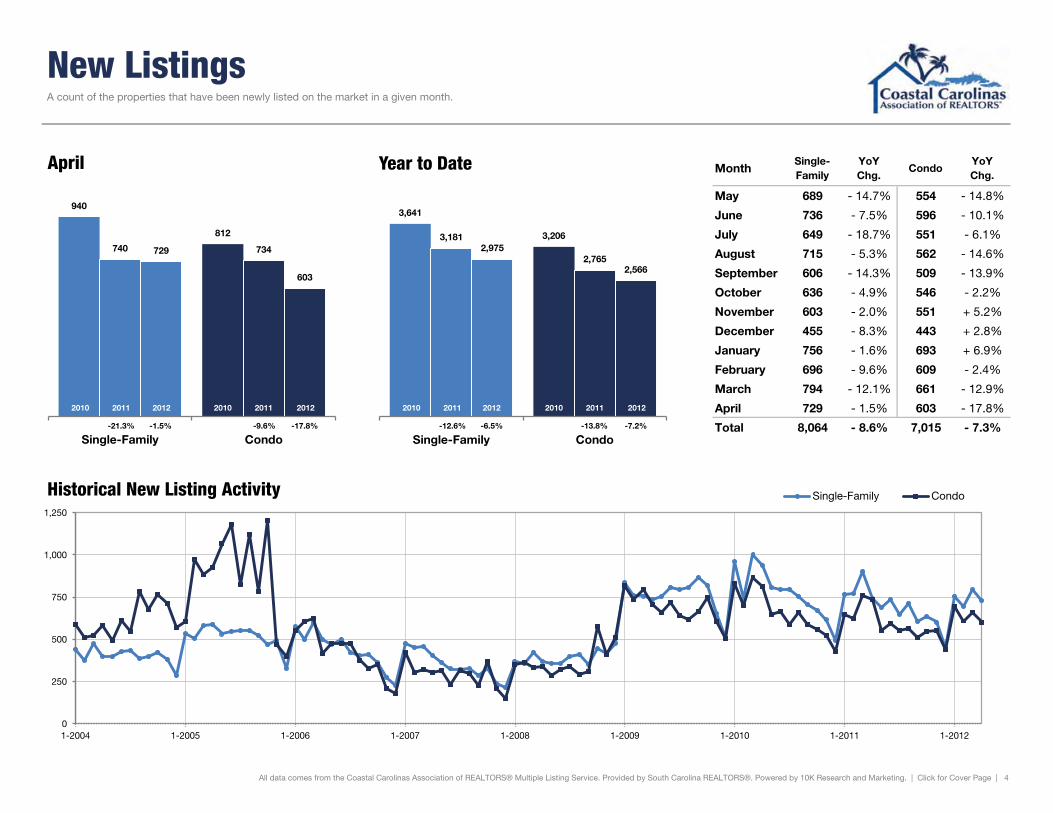
New Listings
MonthSingle-Family
YoYChg.
CondoYoYChg.
May 689 - 14.7% 554 - 14.8%
June 736 - 7.5% 596 - 10.1%
July 649 - 18.7% 551 - 6.1%
August 715 - 5.3% 562 - 14.6%
September 606 - 14.3% 509 - 13.9%
October 636 - 4.9% 546 - 2.2%
November 603 - 2.0% 551 + 5.2%
December 455 - 8.3% 443 + 2.8%
January 756 - 1.6% 693 + 6.9%
February 696 - 9.6% 609 - 2.4%
March 794 - 12.1% 661 - 12.9%
April 729 - 1.5% 603 - 17.8%
Total 8,064 - 8.6% 7,015 - 7.3%
All data comes from the Coastal Carolinas Association of REALTORS® Multiple Listing Service. Provided by South Carolina REALTORS®. Powered by 10K Research and Marketing. | Click for Cover Page | 4
A count of the properties that have been newly listed on the market in a given month.
940
812
740 734 729
603
Single-Family Condo
April
0
250
500
750
1,000
1,250
1-2004 1-2005 1-2006 1-2007 1-2008 1-2009 1-2010 1-2011 1-2012
Historical New Listing Activity Single-Family Condo
-17.8% -9.6% -1.5% -21.3%
2012 2011 2010 2012 2011 2010
3,641
3,206 3,181
2,765 2,975
2,566
Single-Family Condo
Year to Date
-7.2% -13.8% -6.5% -12.6%
2012 2011 2010 2012 2011 2010
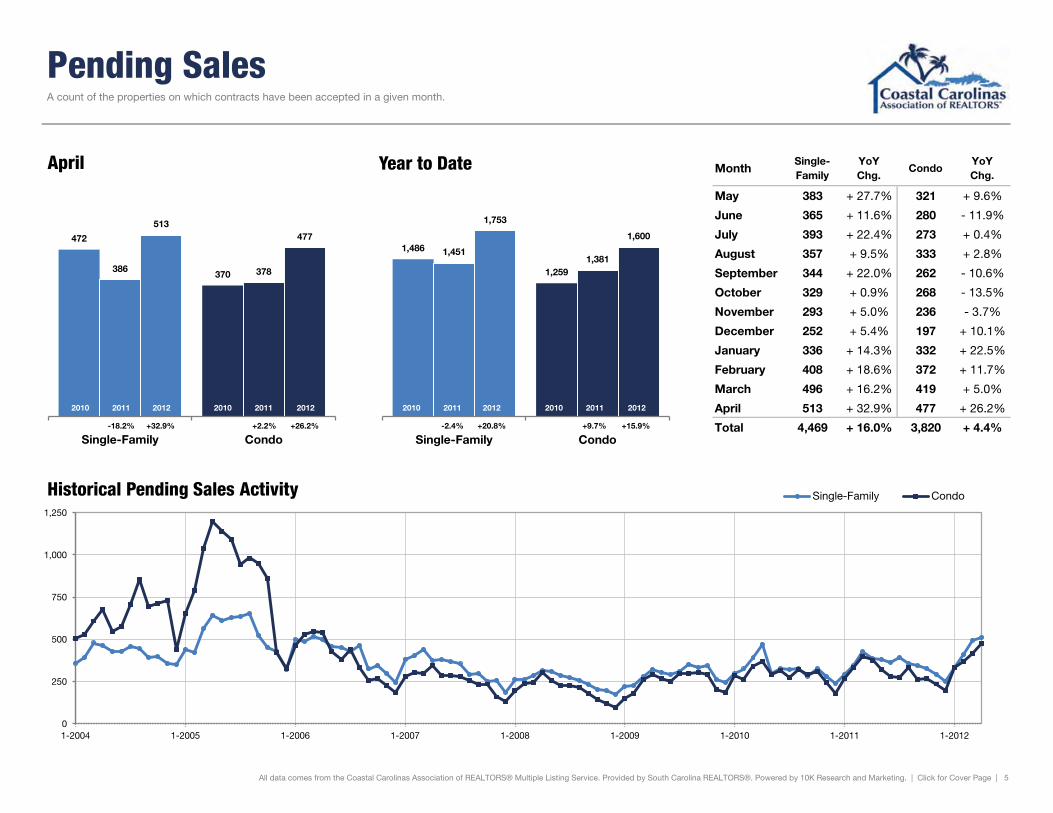
Pending Sales
MonthSingle-Family
YoYChg.
CondoYoYChg.
May 383 + 27.7% 321 + 9.6%
June 365 + 11.6% 280 - 11.9%
July 393 + 22.4% 273 + 0.4%
August 357 + 9.5% 333 + 2.8%
September 344 + 22.0% 262 - 10.6%
October 329 + 0.9% 268 - 13.5%
November 293 + 5.0% 236 - 3.7%
December 252 + 5.4% 197 + 10.1%
January 336 + 14.3% 332 + 22.5%
February 408 + 18.6% 372 + 11.7%
March 496 + 16.2% 419 + 5.0%
April 513 + 32.9% 477 + 26.2%
Total 4,469 + 16.0% 3,820 + 4.4%
All data comes from the Coastal Carolinas Association of REALTORS® Multiple Listing Service. Provided by South Carolina REALTORS®. Powered by 10K Research and Marketing. | Click for Cover Page | 5
A count of the properties on which contracts have been accepted in a given month.
472
370 386 378
513 477
Single-Family Condo
April
0
250
500
750
1,000
1,250
1-2004 1-2005 1-2006 1-2007 1-2008 1-2009 1-2010 1-2011 1-2012
Historical Pending Sales Activity Single-Family Condo
+26.2% +2.2% +32.9% -18.2%
2012 2011 2010 2012 2011 2010
1,486
1,259
1,451 1,381
1,753
1,600
Single-Family Condo
Year to Date
+15.9% +9.7% +20.8% -2.4%
2012 2011 2010 2012 2011 2010
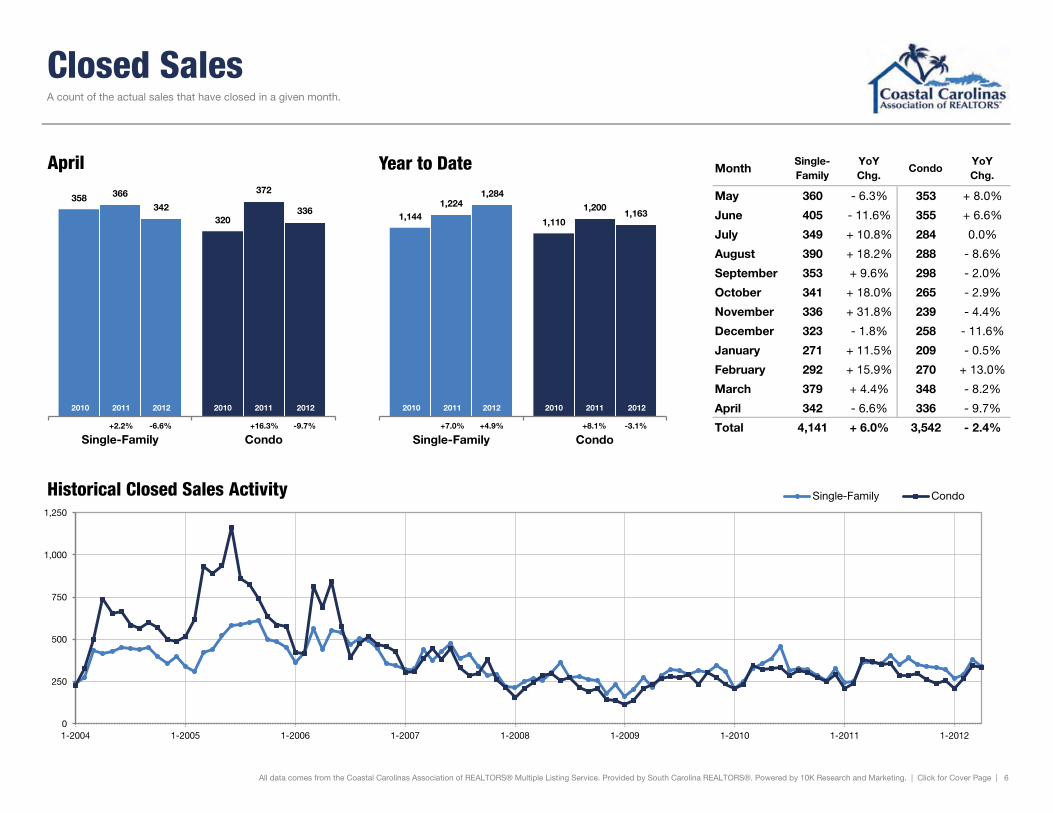
Closed Sales
MonthSingle-Family
YoYChg.
CondoYoYChg.
May 360 - 6.3% 353 + 8.0%
June 405 - 11.6% 355 + 6.6%
July 349 + 10.8% 284 0.0%
August 390 + 18.2% 288 - 8.6%
September 353 + 9.6% 298 - 2.0%
October 341 + 18.0% 265 - 2.9%
November 336 + 31.8% 239 - 4.4%
December 323 - 1.8% 258 - 11.6%
January 271 + 11.5% 209 - 0.5%
February 292 + 15.9% 270 + 13.0%
March 379 + 4.4% 348 - 8.2%
April 342 - 6.6% 336 - 9.7%
Total 4,141 + 6.0% 3,542 - 2.4%
All data comes from the Coastal Carolinas Association of REALTORS® Multiple Listing Service. Provided by South Carolina REALTORS®. Powered by 10K Research and Marketing. | Click for Cover Page | 6
A count of the actual sales that have closed in a given month.
358
320
366 372
342 336
Single-Family Condo
April
0
250
500
750
1,000
1,250
1-2004 1-2005 1-2006 1-2007 1-2008 1-2009 1-2010 1-2011 1-2012
Historical Closed Sales Activity Single-Family Condo
-9.7% +16.3% -6.6% +2.2%
2012 2011 2010 2012 2011 2010
1,144 1,110
1,224 1,200
1,284
1,163
Single-Family Condo
Year to Date
-3.1% +8.1% +4.9% +7.0%
2012 2011 2010 2012 2011 2010
Days on Market Until Sale
MonthSingle-Family
YoYChg.
CondoYoYChg.
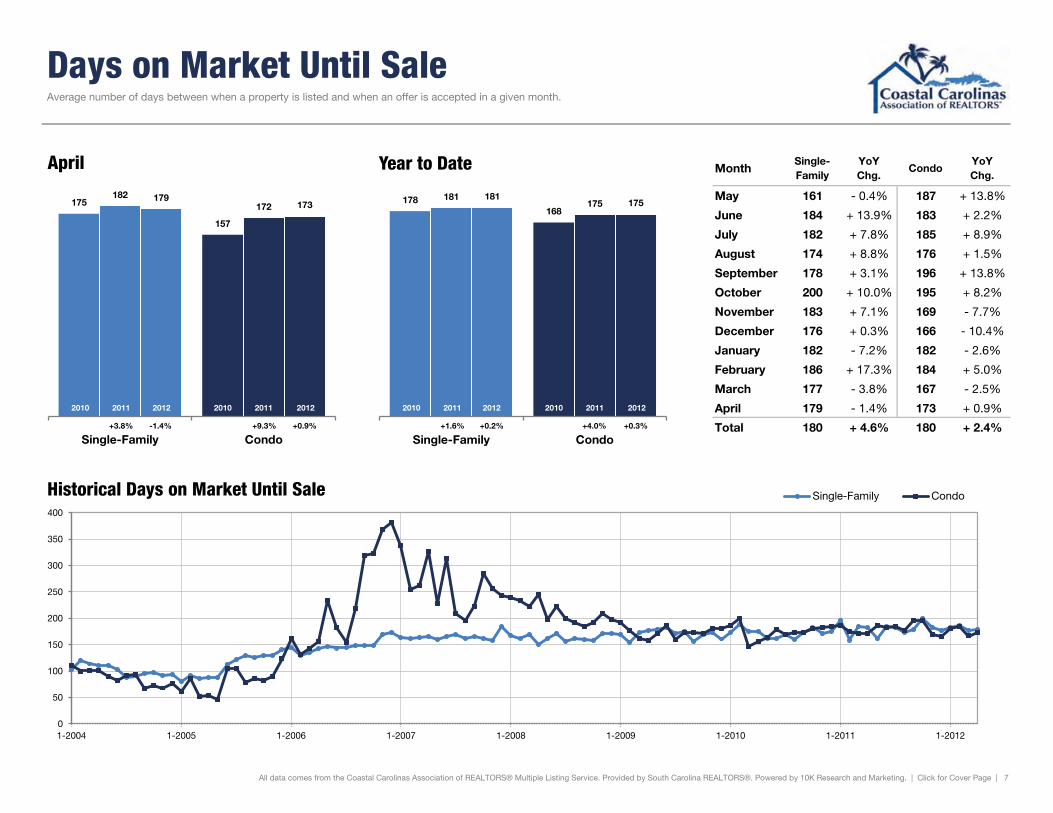
May 161 - 0.4% 187 + 13.8%
June 184 + 13.9% 183 + 2.2%
July 182 + 7.8% 185 + 8.9%
August 174 + 8.8% 176 + 1.5%
September 178 + 3.1% 196 + 13.8%
October 200 + 10.0% 195 + 8.2%
November 183 + 7.1% 169 - 7.7%
December 176 + 0.3% 166 - 10.4%
January 182 - 7.2% 182 - 2.6%
February 186 + 17.3% 184 + 5.0%
March 177 - 3.8% 167 - 2.5%
April 179 - 1.4% 173 + 0.9%
Total 180 + 4.6% 180 + 2.4%
All data comes from the Coastal Carolinas Association of REALTORS® Multiple Listing Service. Provided by South Carolina REALTORS®. Powered by 10K Research and Marketing. | Click for Cover Page | 7
Average number of days between when a property is listed and when an offer is accepted in a given month.
175
157
182 172
179 173
Single-Family Condo
April
0
50
100
150
200
250
300
350
400
1-2004 1-2005 1-2006 1-2007 1-2008 1-2009 1-2010 1-2011 1-2012
Historical Days on Market Until Sale Single-Family Condo
+0.9% +9.3% -1.4% +3.8%
2012 2011 2010 2012 2011 2010
178 168
181 175
181 175
Single-Family Condo
Year to Date
+0.3% +4.0% +0.2% +1.6%
2012 2011 2010 2012 2011 2010
Median Sales Price
MonthSingle-Family
YoYChg.
CondoYoYChg.
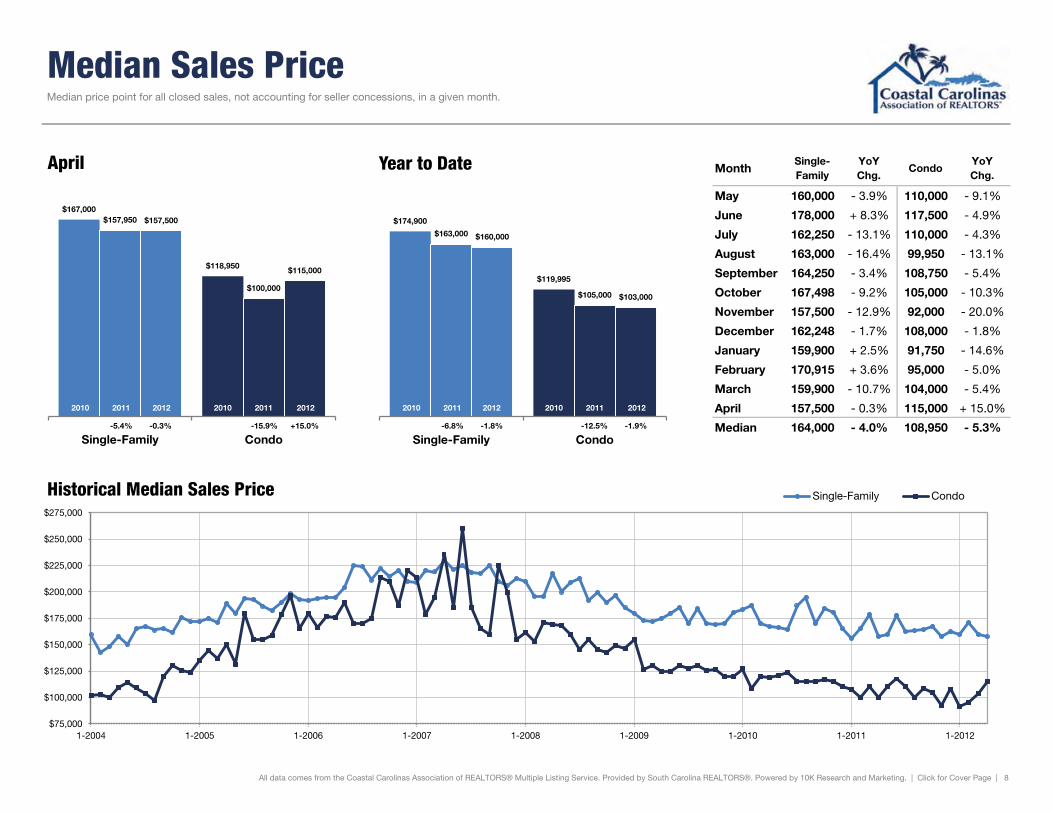
May 160,000 - 3.9% 110,000 - 9.1%
June 178,000 + 8.3% 117,500 - 4.9%
July 162,250 - 13.1% 110,000 - 4.3%
August 163,000 - 16.4% 99,950 - 13.1%
September 164,250 - 3.4% 108,750 - 5.4%
October 167,498 - 9.2% 105,000 - 10.3%
November 157,500 - 12.9% 92,000 - 20.0%
December 162,248 - 1.7% 108,000 - 1.8%
January 159,900 + 2.5% 91,750 - 14.6%
February 170,915 + 3.6% 95,000 - 5.0%
March 159,900 - 10.7% 104,000 - 5.4%
April 157,500 - 0.3% 115,000 + 15.0%
Median 164,000 - 4.0% 108,950 - 5.3%
All data comes from the Coastal Carolinas Association of REALTORS® Multiple Listing Service. Provided by South Carolina REALTORS®. Powered by 10K Research and Marketing. | Click for Cover Page | 8
Median price point for all closed sales, not accounting for seller concessions, in a given month.
$167,000
$118,950
$157,950
$100,000
$157,500
$115,000
Single-Family Condo
April
$75,000
$100,000
$125,000
$150,000
$175,000
$200,000
$225,000
$250,000
$275,000
1-2004 1-2005 1-2006 1-2007 1-2008 1-2009 1-2010 1-2011 1-2012
Historical Median Sales Price Single-Family Condo
+15.0% -15.9% -0.3% -5.4%
2012 2011 2010 2012 2011 2010
$174,900
$119,995
$163,000
$105,000
$160,000
$103,000
Single-Family Condo
Year to Date
-1.9% -12.5% -1.8% -6.8%
2012 2011 2010 2012 2011 2010

Average Sales Price
MonthSingle-Family
YoYChg.
CondoYoYChg.
May 196,421 - 11.0% 149,441 + 0.5%
June 225,291 + 6.5% 146,627 - 1.1%
July 203,465 - 6.1% 145,251 - 8.6%
August 195,946 - 16.9% 123,658 - 16.2%
September 207,648 - 1.7% 137,638 + 0.3%
October 220,292 + 0.0% 154,308 + 1.9%
November 205,868 - 11.5% 132,004 - 17.3%
December 221,155 + 12.9% 133,374 - 4.5%
January 203,746 + 5.4% 123,451 - 14.0%
February 205,867 - 1.5% 129,473 + 3.1%
March 210,487 - 9.1% 131,355 - 8.6%
April 194,752 - 6.9% 143,466 + 10.4%
Average 191,165 - 3.3% 137,987 - 4.4%
All data comes from the Coastal Carolinas Association of REALTORS® Multiple Listing Service. Provided by South Carolina REALTORS®. Powered by 10K Research and Marketing. | Click for Cover Page | 9
Average sales price for all closed sales, not accounting for seller concessions, in a given month.
$213,979
$150,947
$209,163
$129,908
$194,752
$143,466
Single-Family Condo
April
$100,000
$150,000
$200,000
$250,000
$300,000
$350,000
1-2004 1-2005 1-2006 1-2007 1-2008 1-2009 1-2010 1-2011 1-2012
Historical Average Sales Price Single-Family Condo
+ 10.4% - 13.9% - 6.9% - 2.3%
2012 2011 2010 2012 2011 2010
$215,664
$149,608
$212,722
$135,806
$203,794
$132,997
Single-Family Condo
Year to Date
- 2.1% - 9.2% - 4.2% - 1.4%
2012 2011 2010 2012 2011 2010

Percent of List Price Received
MonthSingle-Family
YoYChg.
CondoYoYChg.
May 93.9% - 1.5% 93.8% - 0.6%
June 94.4% - 0.4% 93.3% - 0.3%
July 94.3% - 0.6% 91.9% - 2.7%
August 94.0% - 0.6% 94.9% + 1.5%
September 94.7% + 0.1% 93.2% + 0.5%
October 94.2% - 0.8% 92.0% - 1.5%
November 94.2% + 0.3% 93.7% + 1.0%
December 94.1% - 0.2% 93.1% - 0.6%
January 95.5% + 1.6% 92.7% - 1.8%
February 95.3% + 0.8% 93.3% - 0.4%
March 94.6% - 0.7% 93.1% - 0.5%
April 94.8% + 1.0% 94.7% + 0.9%
Average 89.1% + 0.4% 87.6% + 0.7%
All data comes from the Coastal Carolinas Association of REALTORS® Multiple Listing Service. Provided by South Carolina REALTORS®. Powered by 10K Research and Marketing. | Click for Cover Page | 10
Percentage found when dividing a property’s sales price by its last list price, then taking the average for all properties sold in a given month, not accounting for seller concessions.
94.1% 94.5% 93.9% 93.9% 94.8% 94.7%
Single-Family Condo
April
90%
92%
94%
96%
98%
100%
1-2004 1-2005 1-2006 1-2007 1-2008 1-2009 1-2010 1-2011 1-2012
Historical Percent of List Price Received Single-Family Condo
+0.9% -0.7% +1.0% -0.3%
2012 2011 2010 2012 2011 2010
94.3% 94.1% 94.4% 93.8% 95.0% 93.5%
Single-Family Condo
Year to Date
-0.3% -0.3% +0.6% +0.1%
2012 2011 2010 2012 2011 2010

Housing Affordability Index
MonthSingle-Family
YoYChg.
CondoYoYChg.
May 138 + 7.8% 195 + 17.5%
June 128 + 8.1% 187 + 12.6%
July 138 - 3.3% 196 + 7.4%
August 141 + 13.5% 216 + 4.5%
September 142 + 18.8% 206 + 13.7%
October 138 + 6.6% 210 + 8.0%
November 147 + 10.7% 232 + 10.9%
December 143 + 14.4% 207 + 20.4%
January 148 + 5.3% 238 + 5.3%
February 144 + 7.8% 238 + 23.2%
March 150 + 10.2% 221 + 17.2%
April 155 + 22.4% 208 + 16.1%
Average 143 + 10.2% 213 + 13.1%
This index measures housing affordability for the region. An index of 120 means the median household income was 120% of what is necessary to qualify for the median-priced home under prevailing interest rates. A higher number means greater affordability.
All data comes from the Coastal Carolinas Association of REALTORS® Multiple Listing Service. Provided by South Carolina REALTORS®. Powered by 10K Research and Marketing. | Click for Cover Page | 11
128
175
138
206
155
208
Single-Family Condo
April
75
100
125
150
175
200
225
250
1-2008 1-2009 1-2010 1-2011 1-2012
Historical Housing Affordability Index Single-Family Condo
+16.1% +9.2% +22.4% -2.1%
2012 2011 2010 2012 2011 2010
128
175
138
206
155
208
Single-Family Condo
Year to Date
+16.1% +9.2% +22.4% -2.1%
2012 2011 2010 2012 2011 2010

Inventory of Homes for Sale
MonthSingle-Family
YoYChg.
CondoYoYChg.
May 4,814 - 9.8% 4,710 - 15.4%
June 4,808 - 9.3% 4,689 - 13.9%
July 4,709 - 11.1% 4,628 - 14.4%
August 4,666 - 10.7% 4,534 - 14.5%
September 4,557 - 11.5% 4,464 - 13.5%
October 4,528 - 10.5% 4,420 - 11.3%
November 4,499 - 10.0% 4,428 - 9.8%
December 4,234 - 10.6% 4,270 - 9.3%
January 4,281 - 10.0% 4,313 - 7.7%
February 4,253 - 11.9% 4,287 - 8.4%
March 4,194 - 14.7% 4,215 - 10.5%
April 4,098 - 15.9% 4,020 - 15.3%
Average 3,287 - 16.7% 4,105 - 15.0%
All data comes from the Coastal Carolinas Association of REALTORS® Multiple Listing Service. Provided by South Carolina REALTORS®. Powered by 10K Research and Marketing. | Click for Cover Page | 12
The number of properties available for sale in active status at the end of a given month.
5,272 5,586
4,874 4,744
4,098 4,020
Single-Family Condo
April
500
1,500
2,500
3,500
4,500
5,500
6,500
1-2004 1-2005 1-2006 1-2007 1-2008 1-2009 1-2010 1-2011 1-2012
Historical Inventory of Homes for Sale Single-Family Condo
-15.3% -15.1% -15.9% -7.5%
2012 2011 2010 2012 2011 2010
Months Supply of Inventory
MonthSingle-Family
YoYChg.
CondoYoYChg.
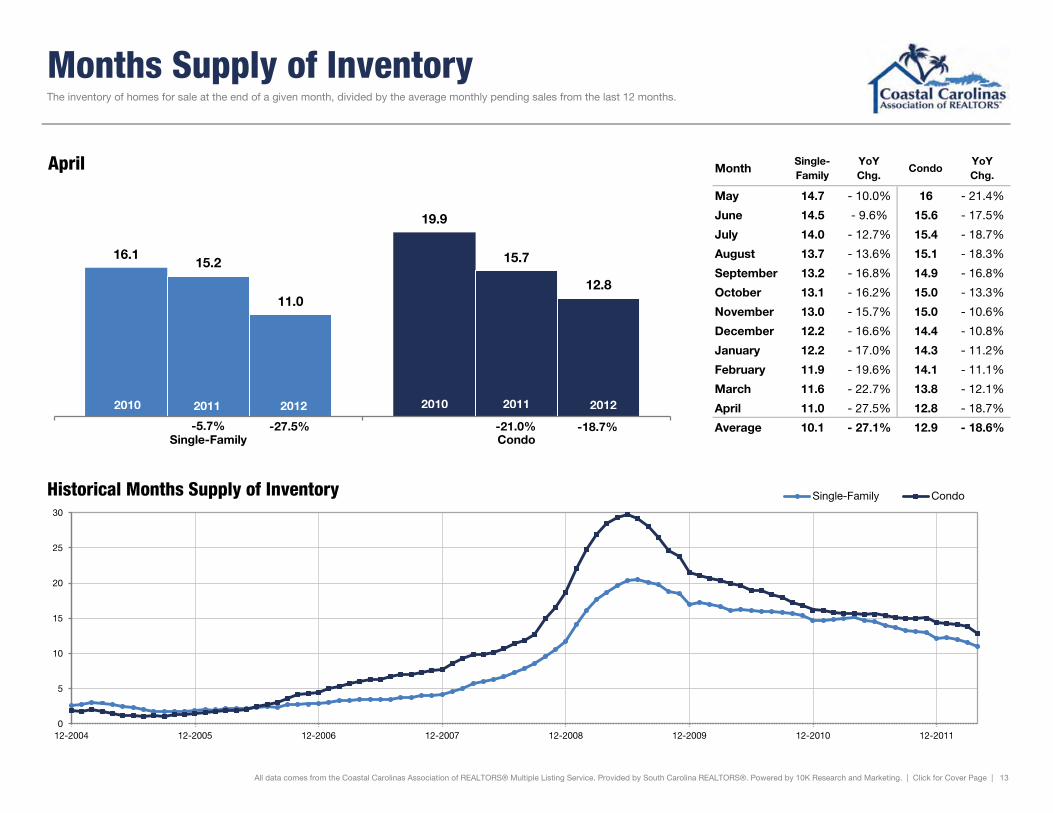
May 14.7 - 10.0% 16 - 21.4%
June 14.5 - 9.6% 15.6 - 17.5%
July 14.0 - 12.7% 15.4 - 18.7%
August 13.7 - 13.6% 15.1 - 18.3%
September 13.2 - 16.8% 14.9 - 16.8%
October 13.1 - 16.2% 15.0 - 13.3%
November 13.0 - 15.7% 15.0 - 10.6%
December 12.2 - 16.6% 14.4 - 10.8%
January 12.2 - 17.0% 14.3 - 11.2%
February 11.9 - 19.6% 14.1 - 11.1%
March 11.6 - 22.7% 13.8 - 12.1%
April 11.0 - 27.5% 12.8 - 18.7%
Average 10.1 - 27.1% 12.9 - 18.6%
All data comes from the Coastal Carolinas Association of REALTORS® Multiple Listing Service. Provided by South Carolina REALTORS®. Powered by 10K Research and Marketing. | Click for Cover Page | 13
The inventory of homes for sale at the end of a given month, divided by the average monthly pending sales from the last 12 months.
16.1
19.9
15.2 15.7
11.0 12.8
Single-Family Condo
April
0
5
10
15
20
25
30
12-2004 12-2005 12-2006 12-2007 12-2008 12-2009 12-2010 12-2011
Historical Months Supply of Inventory Single-Family Condo
-18.7% -21.0% -27.5% -5.7%
2012 2011 2010 2012 2011 2010
Grand Strand Market Report Contents Active Inventory 2
SFR Inventory Trends 3
Condo Inventory Trends 4
Closed Sales – SFR 5
Avg. Sales Price – SFR 6
Median Sales Price – SFR 7
Median Sales Price – SFR (Distressed & Non-Distressed) 8
Median Sales Price – SFR (Cash & Conventional Transactions) 9
SFR Sales – (% Cash vs. % Conventional) 10
Sales to List Price Ratio – SFR 11
Closed Sales – Condo 12
Avg. Sales Price – Condo 13
Median Sales Price – Condo 14
Median Sales Price–Condo (Distressed & Non-Distressed) 15
Median Sales Price – Condo (Cash & Conventional Transactions) 16
Condo Sales – (% Cash vs. % Conventional) 17
Sales to List Price Ratio – Condo 18
Closed Sales – Residential Lot 19
Avg. Sales Price – Residential Lot 20
Median Sales Price – Residential Lot 21
Median Sales Price – Res. Lot (Non-Distressed) 22
Sold to List Price Ratio – Residential Lot 23
Distressed Inventory 24
Distressed Sales 25
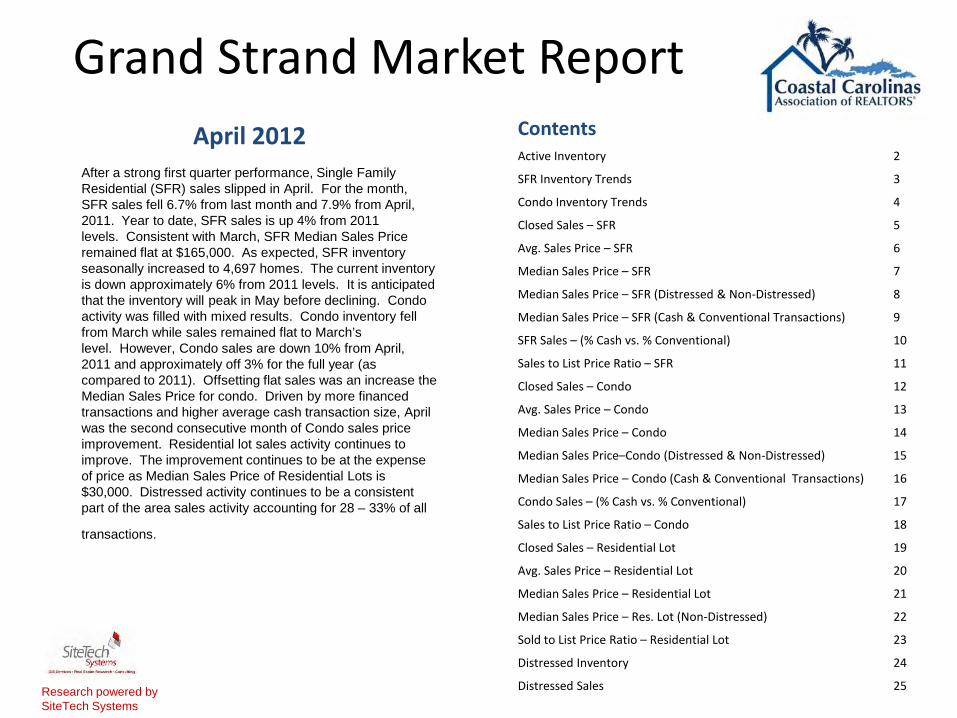
April 2012
Research powered by SiteTech Systems
After a strong first quarter performance, Single Family Residential (SFR) sales slipped in April. For the month, SFR sales fell 6.7% from last month and 7.9% from April, 2011. Year to date, SFR sales is up 4% from 2011 levels. Consistent with March, SFR Median Sales Price remained flat at $165,000. As expected, SFR inventory seasonally increased to 4,697 homes. The current inventory is down approximately 6% from 2011 levels. It is anticipated that the inventory will peak in May before declining. Condo activity was filled with mixed results. Condo inventory fell from March while sales remained flat to March’s level. However, Condo sales are down 10% from April, 2011 and approximately off 3% for the full year (as compared to 2011). Offsetting flat sales was an increase the Median Sales Price for condo. Driven by more financed transactions and higher average cash transaction size, April was the second consecutive month of Condo sales price improvement. Residential lot sales activity continues to improve. The improvement continues to be at the expense of price as Median Sales Price of Residential Lots is $30,000. Distressed activity continues to be a consistent part of the area sales activity accounting for 28 – 33% of all
transactions.
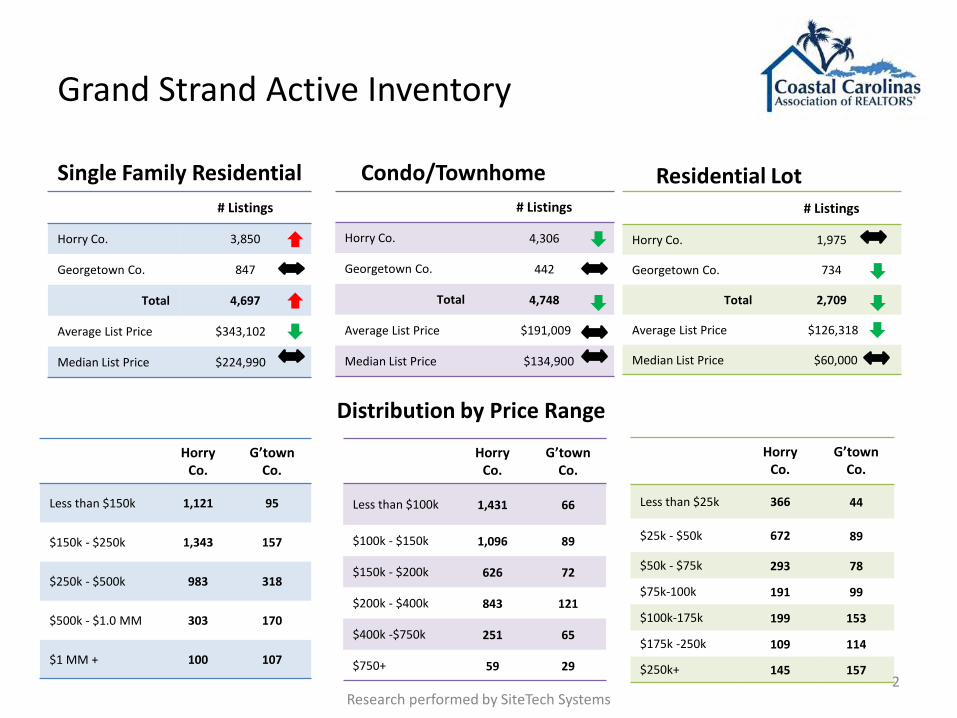
Grand Strand Active Inventory
Single Family Residential # Listings
Horry Co. 3,850
Georgetown Co. 847
Total 4,697
Average List Price $343,102
Median List Price $224,990
Condo/Townhome # Listings
Horry Co. 4,306
Georgetown Co. 442
Total 4,748
Average List Price $191,009
Median List Price $134,900
Horry Co.
G’town Co.
Less than $150k 1,121 95
$150k - $250k 1,343 157
$250k - $500k 983 318
$500k - $1.0 MM 303 170
$1 MM + 100 107
Horry Co.
G’town Co.
Less than $100k 1,431 66
$100k - $150k 1,096 89
$150k - $200k 626 72
$200k - $400k 843 121
$400k -$750k 251 65
$750+ 59 29
Distribution by Price Range
2 Research performed by SiteTech Systems
Residential Lot # Listings
Horry Co. 1,975
Georgetown Co. 734
Total 2,709
Average List Price $126,318
Median List Price $60,000
Horry Co.
G’town Co.
Less than $25k 366 44
$25k - $50k 672 89
$50k - $75k 293 78
$75k-100k 191 99
$100k-175k 199 153
$175k -250k 109 114
$250k+ 145 157
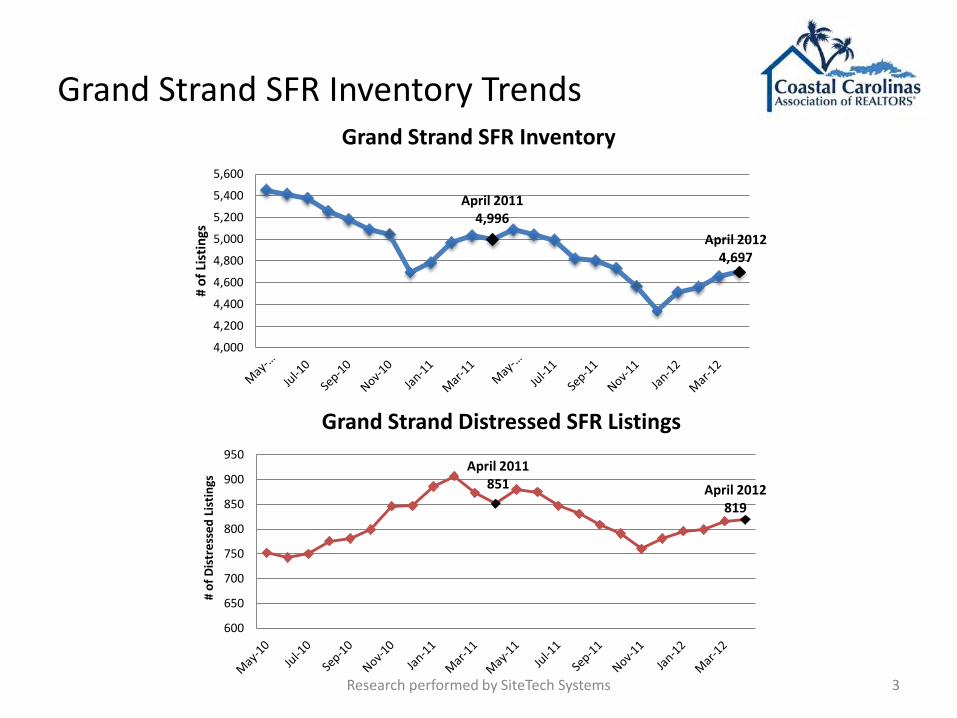
Grand Strand SFR Inventory Trends
Research performed by SiteTech Systems 3
April 2011 4,996
April 2012 4,697
4,000
4,200
4,400
4,600
4,800
5,000
5,200
5,400
5,600
# of
Lis
ting
s
Grand Strand SFR Inventory
April 2011 851 April 2012
819
600
650
700
750
800
850
900
950
# of
Dis
tres
sed
List
ings
Grand Strand Distressed SFR Listings
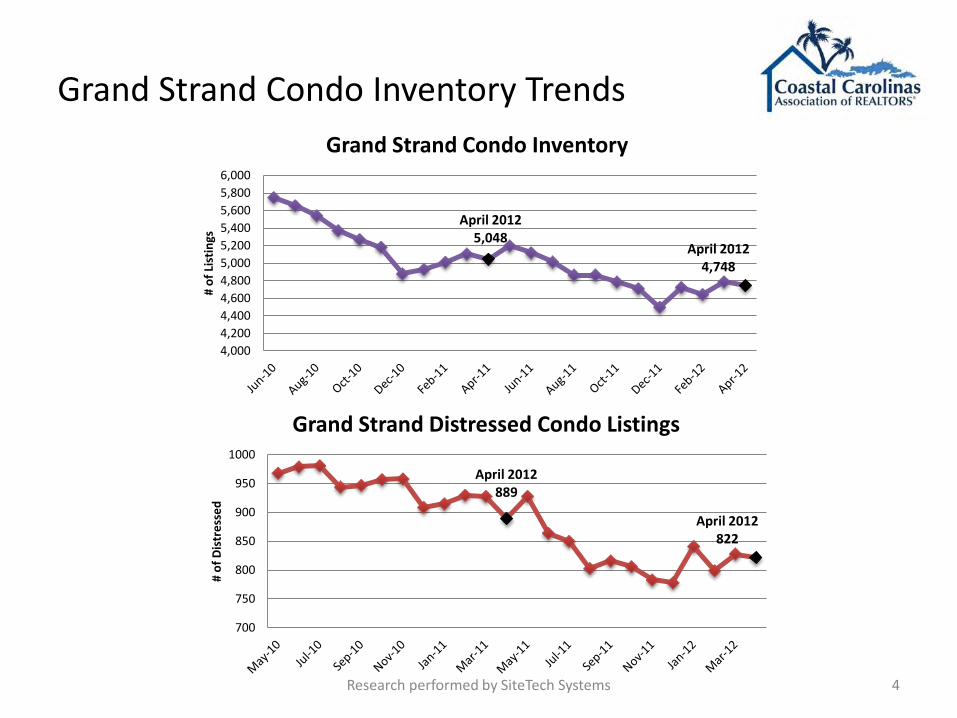
Grand Strand Condo Inventory Trends
Research performed by SiteTech Systems 4
April 2012 5,048
April 2012 4,748
4,000 4,200 4,400 4,600 4,800 5,000 5,200 5,400 5,600 5,800 6,000
# of
Lis
ting
s
Grand Strand Condo Inventory
April 2012 889
April 2012 822
700
750
800
850
900
950
1000
# of
Dis
tres
sed
Grand Strand Distressed Condo Listings
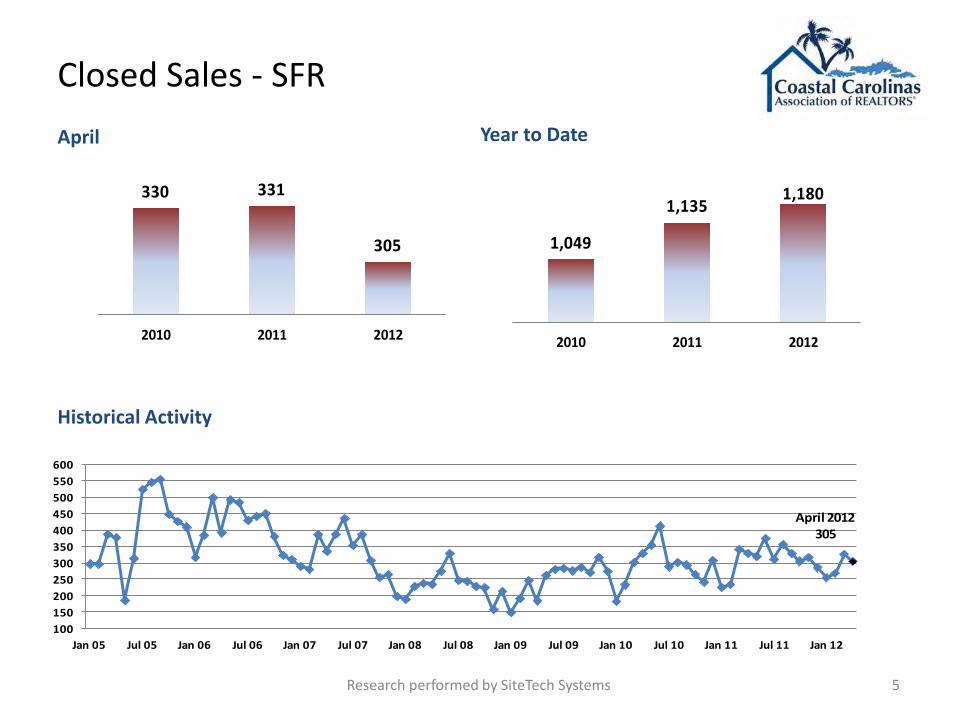
Closed Sales - SFR
April Year to Date
April 2012305
100150200250300350400450500550600
Jan 05 Jul 05 Jan 06 Jul 06 Jan 07 Jul 07 Jan 08 Jul 08 Jan 09 Jul 09 Jan 10 Jul 10 Jan 11 Jul 11 Jan 12
Historical Activity
5 Research performed by SiteTech Systems
330 331
305
2010 2011 2012
1,049
1,1351,180
2010 2011 2012
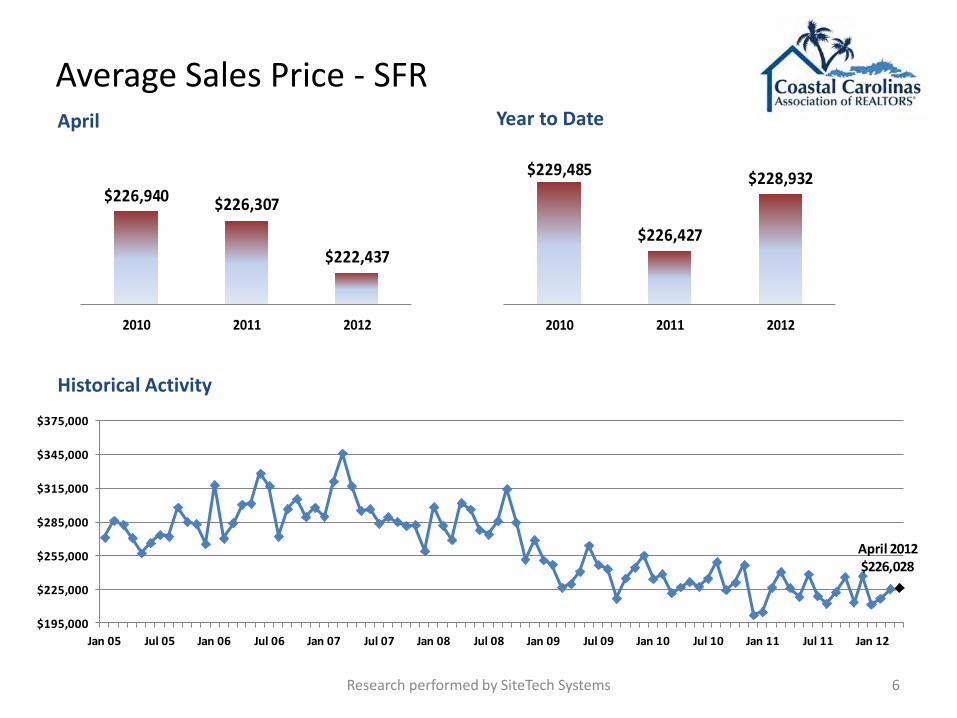
Average Sales Price - SFR April Year to Date
April 2012$226,028
$195,000
$225,000
$255,000
$285,000
$315,000
$345,000
$375,000
Jan 05 Jul 05 Jan 06 Jul 06 Jan 07 Jul 07 Jan 08 Jul 08 Jan 09 Jul 09 Jan 10 Jul 10 Jan 11 Jul 11 Jan 12
Historical Activity
6 Research performed by SiteTech Systems
$226,940 $226,307
$222,437
2010 2011 2012
$229,485
$226,427
$228,932
2010 2011 2012

Median Sales Price - SFR April
$171,500
$164,000
$169,990
2010 2011 2012
Year to Date
April 2012$169,990
$150,000
$160,000
$170,000
$180,000
$190,000
$200,000
$210,000
$220,000
$230,000
$240,000
$250,000
Jan 05 Jul 05 Jan 06 Jul 06 Jan 07 Jul 07 Jan 08 Jul 08 Jan 09 Jul 09 Jan 10 Jul 10 Jan 11 Jul 11 Jan 12
Historical Activity
7 Research performed by SiteTech Systems
$184,000
$170,000$174,900
2010 2011 2012
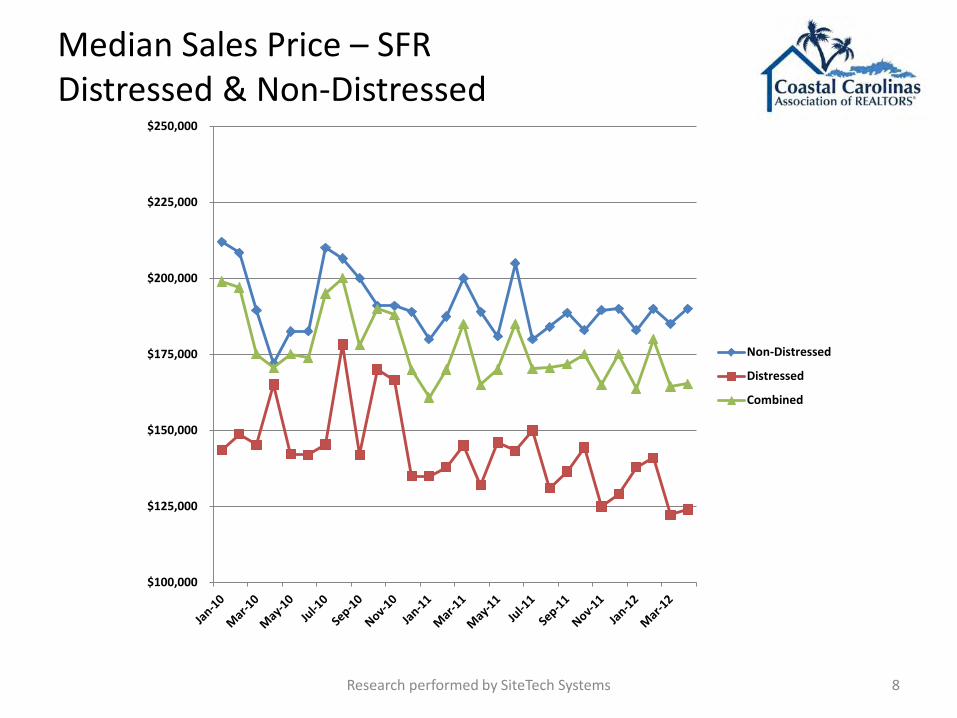
Median Sales Price – SFR Distressed & Non-Distressed
8 Research performed by SiteTech Systems
$100,000
$125,000
$150,000
$175,000
$200,000
$225,000
$250,000
Non-Distressed
Distressed
Combined
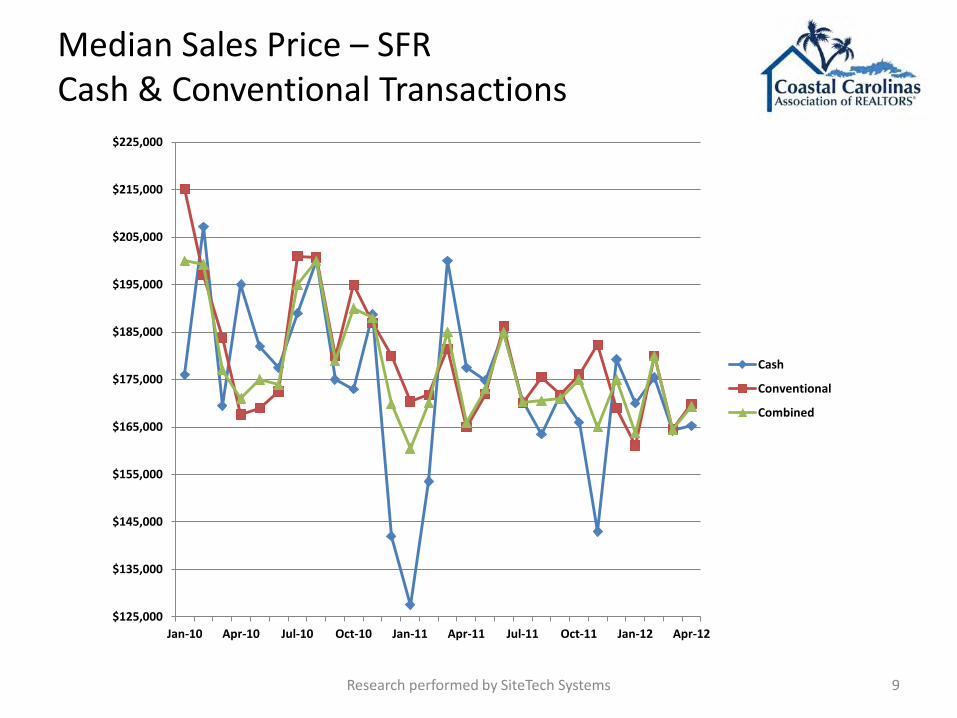
Median Sales Price – SFR Cash & Conventional Transactions
9 Research performed by SiteTech Systems
$125,000
$135,000
$145,000
$155,000
$165,000
$175,000
$185,000
$195,000
$205,000
$215,000
$225,000
Jan-10 Apr-10 Jul-10 Oct-10 Jan-11 Apr-11 Jul-11 Oct-11 Jan-12 Apr-12
Cash
Conventional
Combined
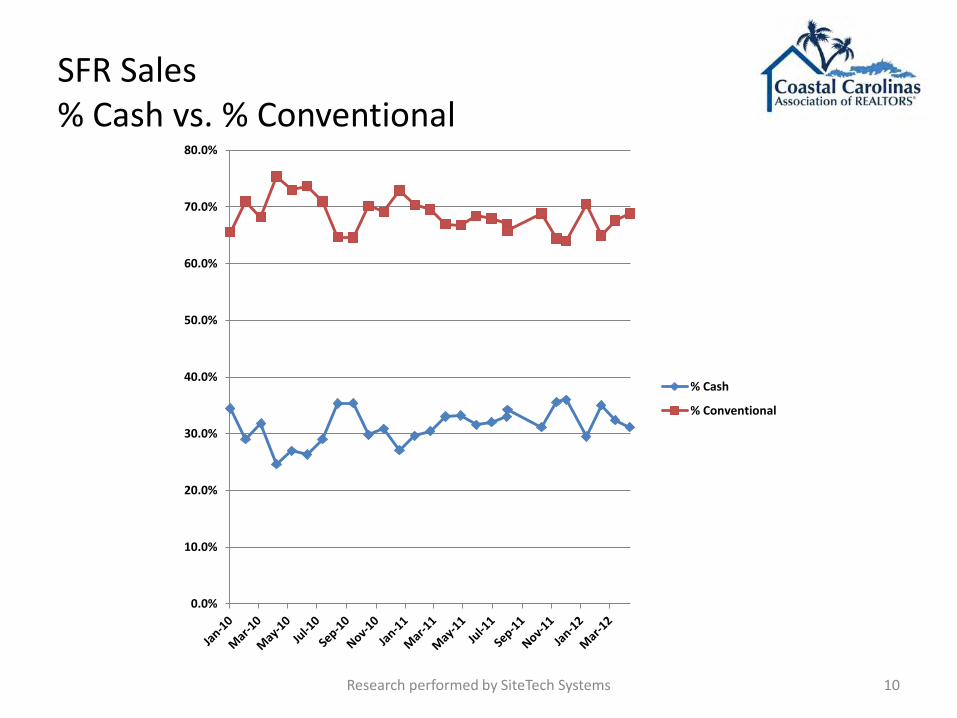
SFR Sales % Cash vs. % Conventional
Research performed by SiteTech Systems 10
0.0%
10.0%
20.0%
30.0%
40.0%
50.0%
60.0%
70.0%
80.0%
% Cash
% Conventional

Sold to List Price Ratio - SFR
April
89%
86%
91%
2010 2011 2012
Year to Date
April 201291%
83
85
87
89
91
93
95
97
99
Jan 05 Jul 05 Jan 06 Jul 06 Jan 07 Jul 07 Jan 08 Jul 08 Jan 09 Jul 09 Jan 10 Jul 10 Jan 11 Jul 11 Jan 12
Historical Activity
11 Research performed by SiteTech Systems
89%
87%
90%
2010 2011 2012
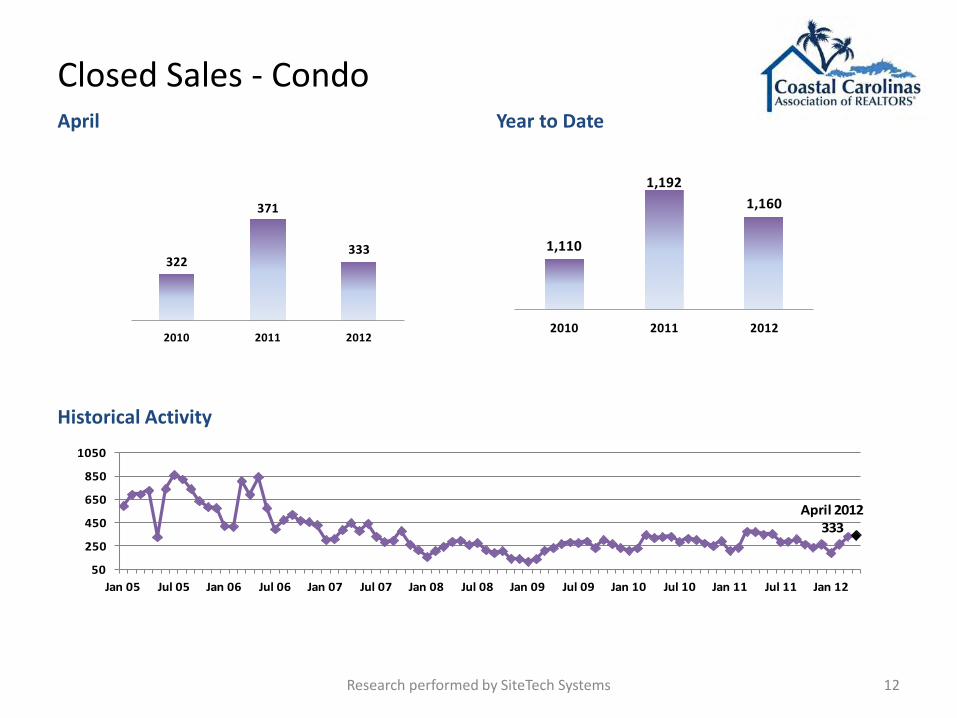
Closed Sales - Condo April
322
371
333
2010 2011 2012
Year to Date
Historical Activity
12
April 2012333
50
250
450
650
850
1050
Jan 05 Jul 05 Jan 06 Jul 06 Jan 07 Jul 07 Jan 08 Jul 08 Jan 09 Jul 09 Jan 10 Jul 10 Jan 11 Jul 11 Jan 12
Research performed by SiteTech Systems
1,110
1,1921,160
2010 2011 2012

Average Sales Price - Condo April Year to Date
April 2012$141,857
$100,000
$150,000
$200,000
$250,000
$300,000
$350,000
$400,000
Jan 05 Jul 05 Jan 06 Jul 06 Jan 07 Jul 07 Jan 08 Jul 08 Jan 09 Jul 09 10-Jan 10-Jul 11-Jan 11-Jul Jan 12
Historical Activity
13 Research performed by SiteTech Systems
$152,253
$133,738
$141,857
2010 2011 2012
$150,067
$136,851 $131,486
2010 2011 2012

Median Sales Price - Condo April
$121,000
$105,000
$115,000
2010 2011 2012
Year to Date
April 2012$115,000
$75,000
$95,000
$115,000
$135,000
$155,000
$175,000
$195,000
$215,000
$235,000
$255,000
$275,000
Jan 05 Jul 05 Jan 06 Jul 06 Jan 07 Jul 07 Jan 08 Jul 08 Jan 09 Jul 09 Jan 10 Jul 10 Jan 11 Jul 11 Jan 12
Historical Activity
14 Research performed by SiteTech Systems
$120,000
$105,000 $103,000
2010 2011 2012
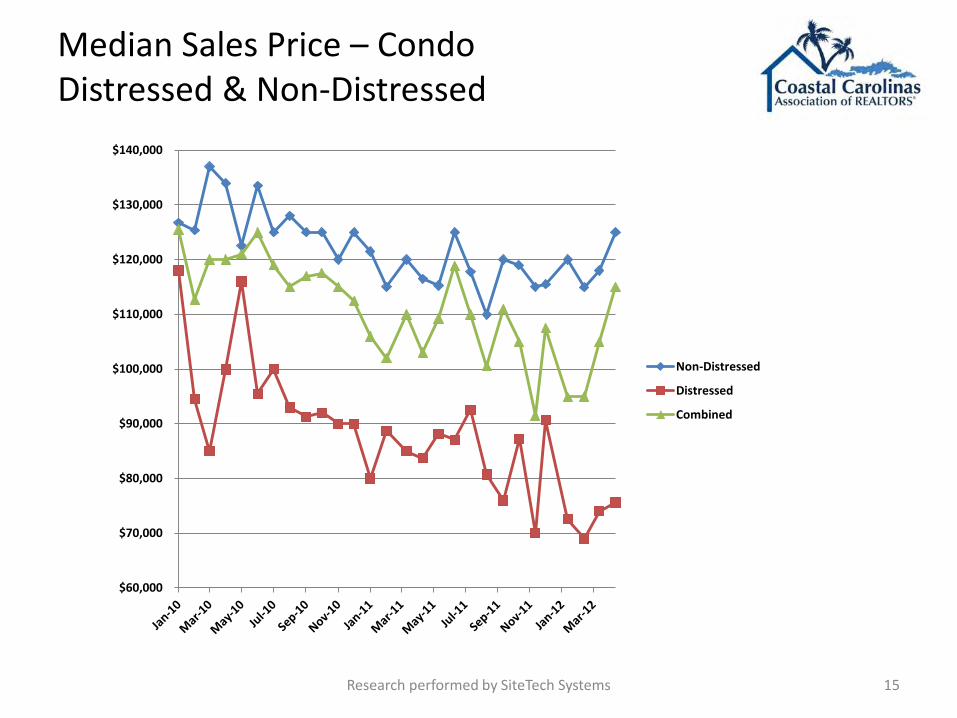
Median Sales Price – Condo Distressed & Non-Distressed
15 Research performed by SiteTech Systems
$60,000
$70,000
$80,000
$90,000
$100,000
$110,000
$120,000
$130,000
$140,000
Non-Distressed
Distressed
Combined

Median Sales Price – Condo Cash & Conventional Transactions
16 Research performed by SiteTech Systems
$50,000
$70,000
$90,000
$110,000
$130,000
$150,000
$170,000
Jan-
10
Feb-
10
Mar
-10
Apr
-10
May
-10
Jun-
10
Jul-1
0 A
ug-1
0 Se
p-10
O
ct-1
0 N
ov-1
0 D
ec-1
0 Ja
n-11
Fe
b-11
M
ar-1
1 A
pr-1
1 M
ay-1
1 Ju
n-11
Ju
l-11
Aug
-11
Sep-
11
11-O
ct
11-N
ov
Dec
-11
Jan-
12
12-F
eb
Mar
-12
Apr
-12
Cash
Conventional
Combined
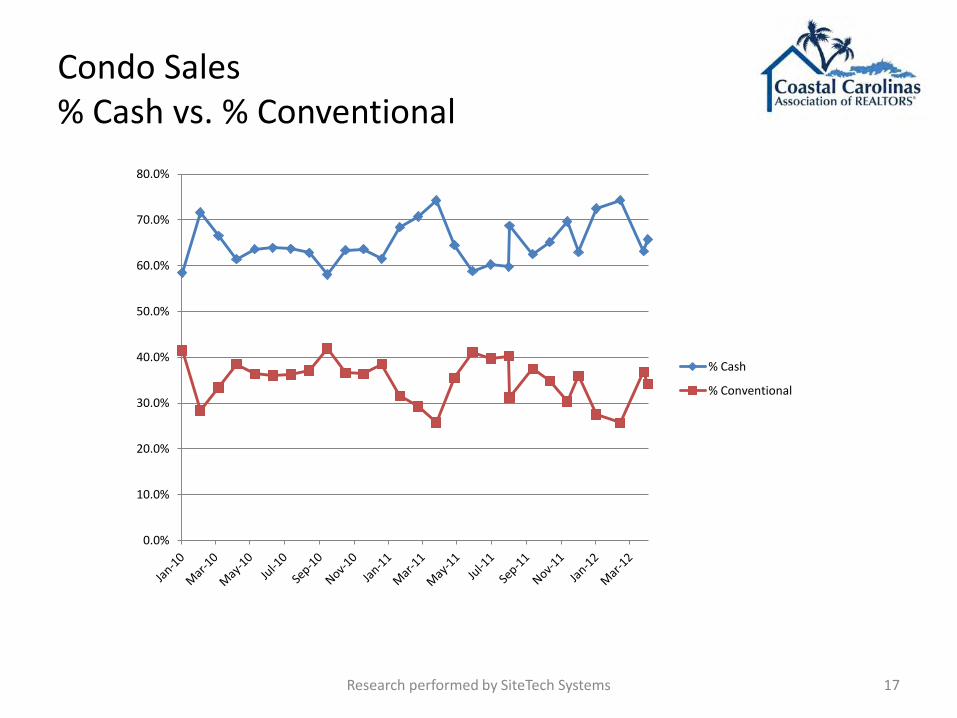
Condo Sales % Cash vs. % Conventional
Research performed by SiteTech Systems 17
0.0%
10.0%
20.0%
30.0%
40.0%
50.0%
60.0%
70.0%
80.0%
% Cash
% Conventional

Sold to List Price Ratio - Condo April
86%87%
89%
2010 2011 2012
Year to Date
April 201289%
75
80
85
90
95
100
105
Jan 05 Jul 05 Jan 06 Jul 06 Jan 07 Jul 07 Jan 08 Jul 08 Jan 09 Jul 09 Jan 10 Jul 10 Jan 11 Jul 11 Jan 12
Historical Activity
18 Research performed by SiteTech Systems
85%
87% 87%
2010 2011 2012

Closed Sales – Residential Lot
5365
121
2010 2011 2012
Year to Date
April 2012121
10
60
110
160
210
260
310
Jan 05 Jul 05 Jan 06 Jul 06 Jan 07 Jul 07 Jan 08 Jul 08 Jan 09 Jul 09 Jan 10 Jul 10 Jan 11 Jul 11 Jan 12
Historical Activity
19
April
Research performed by SiteTech Systems
186221
341
2010 2011 2012

Average Sales Price – Residential Lot April Year to Date
April 2012$52,194
$0
$50,000
$100,000
$150,000
$200,000
$250,000
$300,000
Jan 05 Jul 05 Jan 06 Jul 06 Jan 07 Jul 07 Jan 08 Jul 08 Jan 09 Jul 09 Jan 10 Jul 10 Jan 11 Jul 11 Jan 12
Historical Activity
20 Research performed by SiteTech Systems
$52,258
$103,402
$52,194
2010 2011 2012
$79,830 $75,986 $64,649
2010 2011 2012
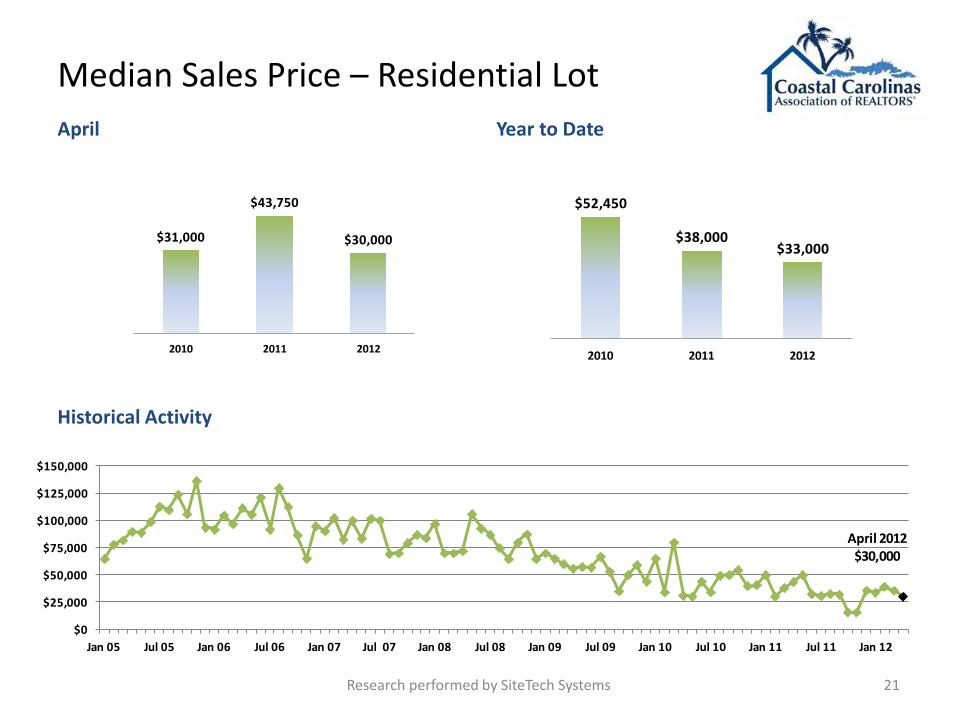
Median Sales Price – Residential Lot April
$31,000
$43,750
$30,000
2010 2011 2012
Year to Date
April 2012$30,000
$0
$25,000
$50,000
$75,000
$100,000
$125,000
$150,000
Jan 05 Jul 05 Jan 06 Jul 06 Jan 07 Jul 07 Jan 08 Jul 08 Jan 09 Jul 09 Jan 10 Jul 10 Jan 11 Jul 11 Jan 12
Historical Activity
21 Research performed by SiteTech Systems
$52,450
$38,000 $33,000
2010 2011 2012

Median Sales Price – Res. Lot (Non-Distressed)
April
$42,750
$66,450 $60,000
2010 2011 2012
Year to Date
Historical Activity
22 Research performed by SiteTech Systems
$59,000$55,000
$49,250
2010 2011 2012
April 2012 $60,000
$-
$10,000
$20,000
$30,000
$40,000
$50,000
$60,000
$70,000
$80,000
$90,000
Jan 10
Apr 10
Jul 10
Oct 10
Jan 11
Apr 11
Jul 11
Oct 10
Jan 12

Sold to List Price Ratio – Residential Lot April Year to Date
77%
72%
69%
2010 2011 2012
April 201267%
40
50
60
70
80
90
100
110
Jan 05 Jul 05 Jan 06 Jul 06 Jan 07 Jul 07 Jan 08 Jul 08 Jan 09 Jul 09 Jan 10 Jul 10 Jan 11 Jul 11 Jan 12
Historical Activity
23 Research performed by SiteTech Systems
74%72%
67%
2010 2011 2012
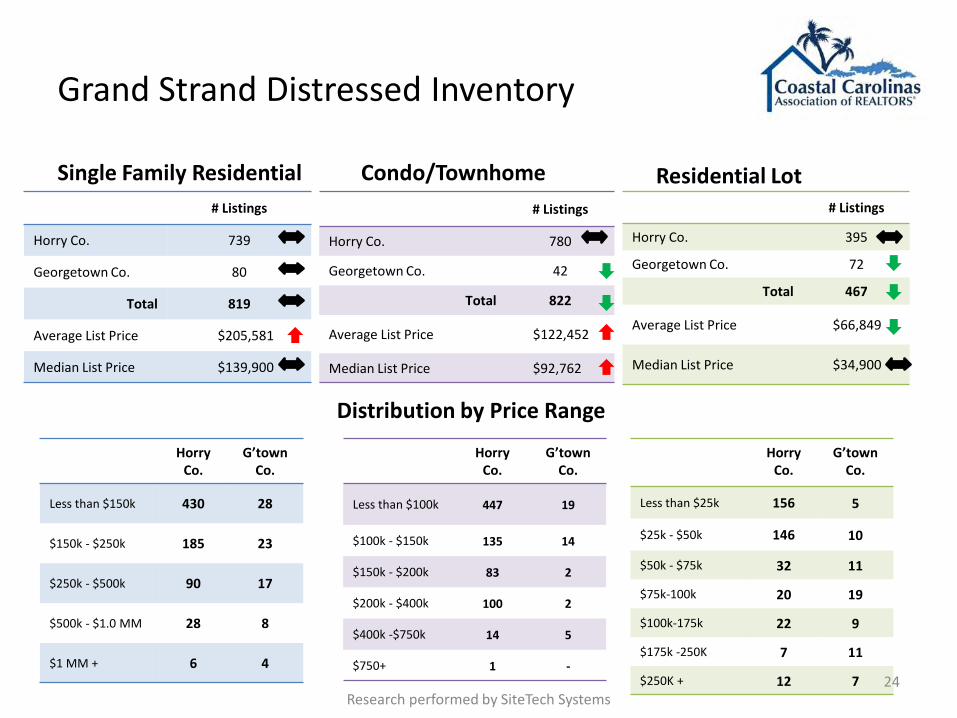
Grand Strand Distressed Inventory
Single Family Residential # Listings
Horry Co. 739
Georgetown Co. 80
Total 819
Average List Price $205,581
Median List Price $139,900
Condo/Townhome # Listings
Horry Co. 780
Georgetown Co. 42
Total 822
Average List Price $122,452
Median List Price $92,762
Horry Co.
G’town Co.
Less than $150k 430 28
$150k - $250k 185 23
$250k - $500k 90 17
$500k - $1.0 MM 28 8
$1 MM + 6 4
Distribution by Price Range
24 Research performed by SiteTech Systems
Residential Lot # Listings
Horry Co. 395
Georgetown Co. 72
Total 467
Average List Price $66,849
Median List Price $34,900
Horry Co.
G’town Co.
Less than $25k 156 5
$25k - $50k 146 10
$50k - $75k 32 11
$75k-100k 20 19
$100k-175k 22 9
$175k -250K 7 11
$250K + 12 7
Horry Co.
G’town Co.
Less than $100k 447 19
$100k - $150k 135 14
$150k - $200k 83 2
$200k - $400k 100 2
$400k -$750k 14 5
$750+ 1 -
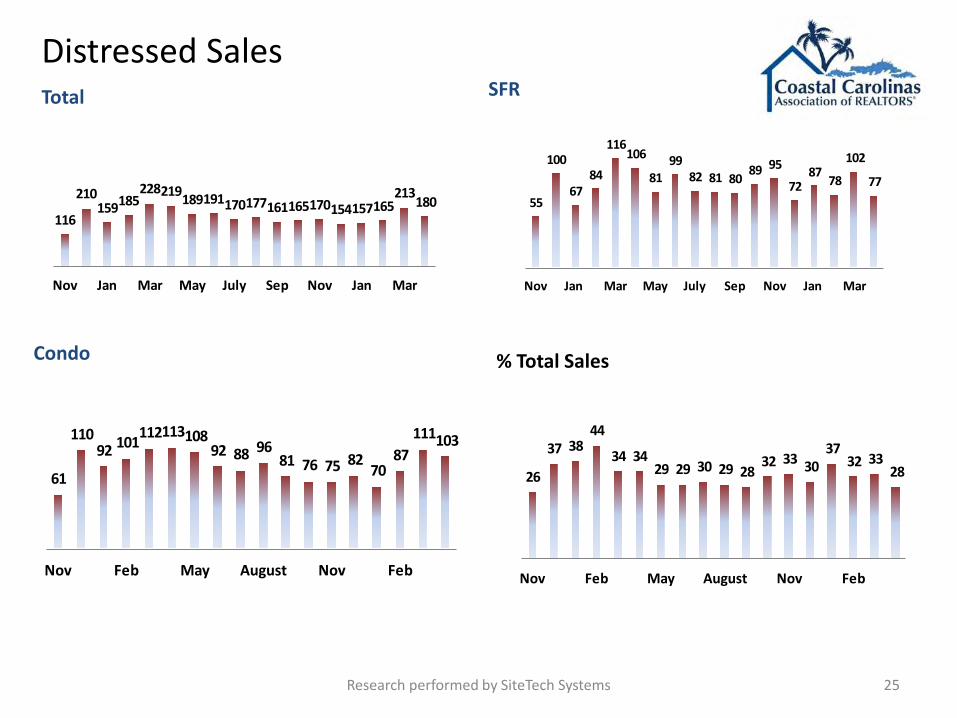
Distressed Sales Total
116
210159185
228219189191170177161165170154157165213
180
Nov Jan Mar May July Sep Nov Jan Mar
SFR
55
100
67 84
116 106
81 99
82 81 80 89 95
72 87
78
102
77
Nov Jan Mar May July Sep Nov Jan Mar
Condo
25 Research performed by SiteTech Systems
61
110 92 101
112 113 108 92 88 96
81 76 75 82 70
87 111 103
Nov Feb May August Nov Feb
% Total Sales
26
37 38 44
34 34 29 29 30 29 28
32 33 30 37
32 33 28
Nov Feb May August Nov Feb
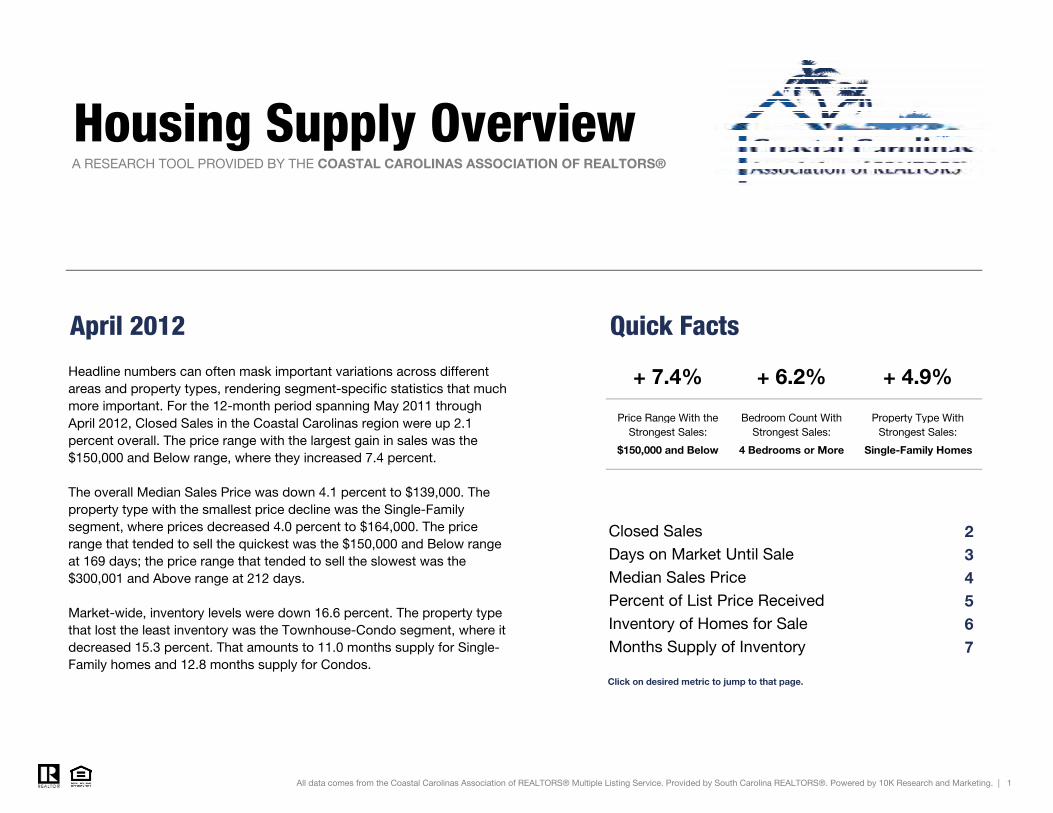
April 2012 Quick Facts
Housing Supply Overview
+ 7.4% + 4.9%Headline numbers can often mask important variations across different areas and property types, rendering segment-specific statistics that much more important. For the 12-month period spanning May 2011 through A il 2012 Cl d S l i h C l C li i 2 1
+ 6.2%
Price Range With the Bedroom Count With Property Type With
A RESEARCH TOOL PROVIDED BY THE COASTAL CAROLINAS ASSOCIATION OF REALTORS®
$150,000 and Below 4 Bedrooms or More
234567
Median Sales PricePercent of List Price ReceivedInventory of Homes for SaleMonths Supply of Inventory
All data comes from the Coastal Carolinas Association of REALTORS® Multiple Listing Service. Provided by South Carolina REALTORS®. Powered by 10K Research and Marketing. | 1
April 2012, Closed Sales in the Coastal Carolinas region were up 2.1 percent overall. The price range with the largest gain in sales was the $150,000 and Below range, where they increased 7.4 percent.
The overall Median Sales Price was down 4.1 percent to $139,000. The property type with the smallest price decline was the Single-Family segment, where prices decreased 4.0 percent to $164,000. The price range that tended to sell the quickest was the $150,000 and Below range at 169 days; the price range that tended to sell the slowest was the $300,001 and Above range at 212 days.
Market-wide, inventory levels were down 16.6 percent. The property type that lost the least inventory was the Townhouse-Condo segment, where it decreased 15.3 percent. That amounts to 11.0 months supply for Single-Family homes and 12.8 months supply for Condos.
Click on desired metric to jump to that page.
Price Range With the Strongest Sales:
Bedroom Count With Strongest Sales:
Property Type With Strongest Sales:
Single-Family Homes
Closed SalesDays on Market Until Sale
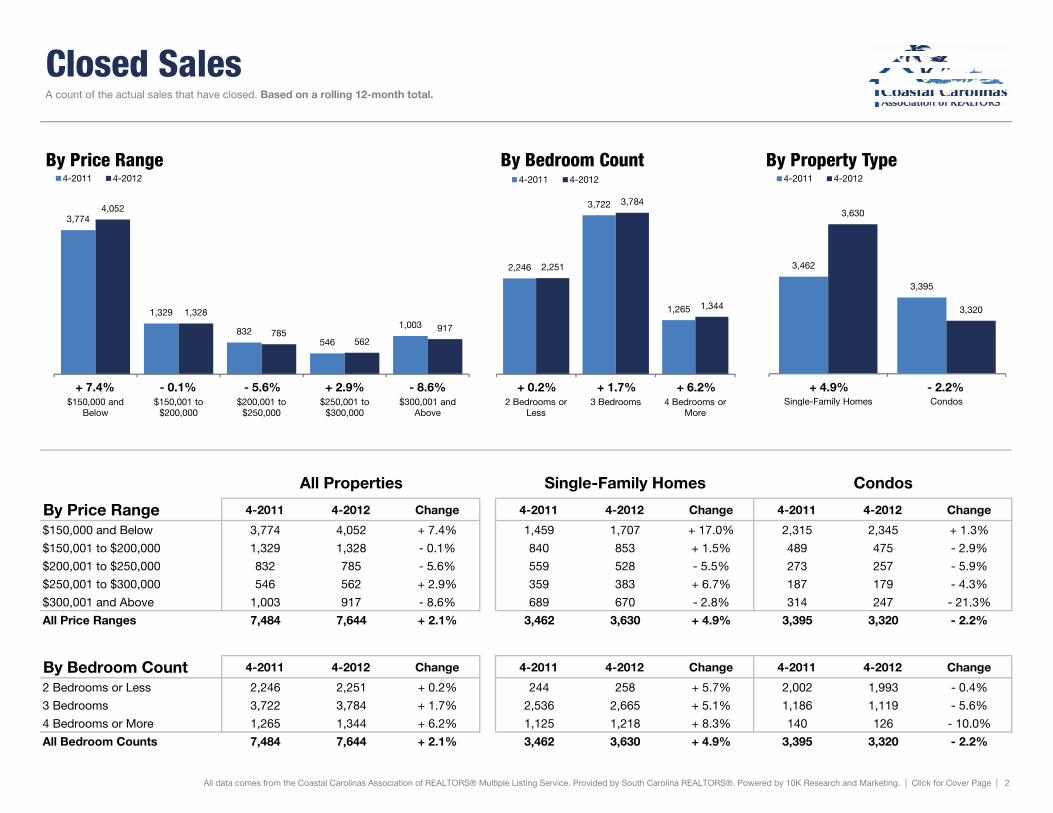
Closed Sales A count of the actual sales that have closed. Based on a rolling 12-month total.
3,774
1,329
832546
1,003
4,052
1,328
785562
917
$150,000 and Below
$150,001 to $200,000
$200,001 to $250,000
$250,001 to $300,000
$300,001 and Above
By Price Range4-2011 4-2012
2,246
3,722
1,265
2,251
3,784
1,344
2 Bedrooms or Less
3 Bedrooms 4 Bedrooms or More
By Bedroom Count4-2011 4-2012
+ 7.4%
3,462
3,395
3,630
3,320
Single-Family Homes Condos
By Property Type4-2011 4-2012
- 0.1% - 5.6% + 2.9% - 8.6% + 4.9% - 2.2%+ 0.2% + 1.7% + 6.2%
By Price Range 4-2011 4-2012 Change 4-2011 4-2012 Change 4-2011 4-2012 Change
$150,000 and Below 3,774 4,052 + 7.4% 1,459 1,707 + 17.0% 2,315 2,345 + 1.3%
$150,001 to $200,000 1,329 1,328 - 0.1% 840 853 + 1.5% 489 475 - 2.9%
$200,001 to $250,000 832 785 - 5.6% 559 528 - 5.5% 273 257 - 5.9%
$250,001 to $300,000 546 562 + 2.9% 359 383 + 6.7% 187 179 - 4.3%
$300,001 and Above 1,003 917 - 8.6% 689 670 - 2.8% 314 247 - 21.3%
All Price Ranges 7,484 7,644 + 2.1% 3,462 3,630 + 4.9% 3,395 3,320 - 2.2%
By Bedroom Count 4-2011 4-2012 Change 4-2011 4-2012 Change 4-2011 4-2012 Change
2 Bedrooms or Less 2,246 2,251 + 0.2% 244 258 + 5.7% 2,002 1,993 - 0.4%
3 Bedrooms 3,722 3,784 + 1.7% 2,536 2,665 + 5.1% 1,186 1,119 - 5.6%
4 Bedrooms or More 1,265 1,344 + 6.2% 1,125 1,218 + 8.3% 140 126 - 10.0%
All Bedroom Counts 7,484 7,644 + 2.1% 3,462 3,630 + 4.9% 3,395 3,320 - 2.2%
All data comes from the Coastal Carolinas Association of REALTORS® Multiple Listing Service. Provided by South Carolina REALTORS®. Powered by 10K Research and Marketing. | Click for Cover Page | 2
All Properties Single-Family Homes Condos

Days on Market Until Sale Average number of days between when a property is listed and when an offer is accepted. Based on a rolling 12-month average.
164174 174 180
214
169
190182
198212
$150,000 and Below
$150,001 to $200,000
$200,001 to $250,000
$250,001 to $300,000
$300,001 and Above
By Price Range4-2011 4-2012
171168
198
176178
194
2 Bedrooms or Less
3 Bedrooms 4 Bedrooms or More
By Bedroom Count4-2011 4-2012
+ 3.2%
172
175
180 180
Single-Family Homes Condos
By Property Type4-2011 4-2012
+ 9.1% + 4.2% + 10.3% - 0.9% + 4.6% + 2.8%+ 2.9% + 6.0% - 1.7%
By Price Range 4-2011 4-2012 Change 4-2011 4-2012 Change 4-2011 4-2012 Change
$150,000 and Below 164 169 + 3.2% 157 171 + 8.4% 168 168 - 0.1%
$150,001 to $200,000 174 190 + 9.1% 165 177 + 6.7% 188 214 + 13.8%
$200,001 to $250,000 174 182 + 4.2% 166 176 + 6.0% 192 193 + 0.5%
$250,001 to $300,000 180 198 + 10.3% 177 188 + 6.0% 185 228 + 22.8%
$300,001 and Above 214 212 - 0.9% 220 212 - 3.5% 199 212 + 6.4%
All Price Ranges 174 180 + 3.7% 172 180 + 4.6% 175 180 + 2.8%
By Bedroom Count 4-2011 4-2012 Change 4-2011 4-2012 Change 4-2011 4-2012 Change
2 Bedrooms or Less 171 176 + 2.9% 163 179 + 10.2% 172 176 + 2.0%
3 Bedrooms 168 178 + 6.0% 163 175 + 7.7% 180 185 + 3.1%
4 Bedrooms or More 198 194 - 1.7% 196 191 - 2.6% 209 226 + 7.9%
All Bedroom Counts 174 180 + 3.7% 172 180 + 4.6% 175 180 + 2.8%
All data comes from the Coastal Carolinas Association of REALTORS® Multiple Listing Service. Provided by South Carolina REALTORS®. Powered by 10K Research and Marketing. | Click for Cover Page | 3
All Properties Single-Family Homes Condos

Median Sales Price Median price point for all closed sales, not accounting for seller concessions. Based on a rolling 12-month median.
$99,000
$155,000
$270,000
$90,000
$150,000
$252,000
2 Bedrooms or Less 3 Bedrooms 4 Bedrooms or More
By Bedroom Count4-2011 4-2012
$145,000
$170,828
$115,000
$139,000
$164,000
$108,000
All Properties Single-Family Homes Condos
By Property Type4-2011 4-2012
- 4.0% - 6.1%- 9.1% - 3.2% - 4.1%- 6.7%
By Bedroom Count 4-2011 4-2012 Change 4-2011 4-2012 Change 4-2011 4-2012 Change
2 Bedrooms or Less $99,000 $90,000 - 9.1% $110,000 $90,700 - 17.5% $98,000 $90,000 - 8.2%
3 Bedrooms $155,000 $150,000 - 3.2% $155,000 $149,900 - 3.3% $155,000 $157,475 + 1.6%
4 Bedrooms or More $270,000 $252,000 - 6.7% $265,000 $250,000 - 5.7% $290,000 $297,000 + 2.4%
All Bedroom Counts $145,000 $139,000 - 4.1% $170,828 $164,000 - 4.0% $115,000 $108,000 - 6.1%
All data comes from the Coastal Carolinas Association of REALTORS® Multiple Listing Service. Provided by South Carolina REALTORS®. Powered by 10K Research and Marketing. | Click for Cover Page | 4
All Properties Single-Family Homes Condos
p g y

Percent of List Price Received Percentage found when dividing a property’s sales price by its last list price, then taking the average for all properties sold, not accounting for seller concessions. Based on a rolling 12-month average.
93.7%
95.2%95.0%
95.4%
93.1%93.4%
95.0%
94.6%
95.2%
93.8%
$150,000 and Below
$150,001 to $200,000
$200,001 to $250,000
$250,001 to $300,000
$300,001 and Above
By Price Range4-2011 4-2012
93.2%
94.8%
93.8%
92.9%
94.6%
93.9%
2 Bedrooms or Less
3 Bedrooms 4 Bedrooms or More
By Bedroom Count4-2011 4-2012
- 0.3%
94.6%
93.6%
94.4%
93.3%
Single-Family Homes Condos
By Property Type4-2011 4-2012
- 0.2% - 0.4% - 0.3% + 0.7% - 0.2% - 0.3%- 0.3% - 0.2% + 0.1%
By Price Range 4-2011 4-2012 Change 4-2011 4-2012 Change 4-2011 4-2012 Change
$150,000 and Below 93.7% 93.4% - 0.3% 94.0% 93.6% - 0.4% 93.5% 93.2% - 0.3%
$150,001 to $200,000 95.2% 95.0% - 0.2% 95.9% 95.7% - 0.2% 94.0% 93.9% - 0.1%
$200,001 to $250,000 95.0% 94.6% - 0.4% 95.6% 95.6% - 0.0% 93.8% 92.8% - 1.1%
$250,001 to $300,000 95.4% 95.2% - 0.3% 96.2% 96.0% - 0.2% 93.9% 93.0% - 1.0%
$300,001 and Above 93.1% 93.8% + 0.7% 92.9% 93.7% + 0.9% 93.8% 94.3% + 0.4%
All Price Ranges 94.1% 93.9% - 0.2% 94.6% 94.4% - 0.2% 93.6% 93.3% - 0.3%
By Bedroom Count 4-2011 4-2012 Change 4-2011 4-2012 Change 4-2011 4-2012 Change
2 Bedrooms or Less 93.2% 92.9% - 0.3% 92.1% 91.2% - 0.9% 93.3% 93.2% - 0.2%
3 Bedrooms 94.8% 94.6% - 0.2% 95.2% 95.0% - 0.2% 94.0% 93.7% - 0.3%
4 Bedrooms or More 93.8% 93.9% + 0.1% 93.9% 93.9% + 0.1% 93.5% 93.5% + 0.0%
All Bedroom Counts 94.1% 93.9% - 0.2% 94.6% 94.4% - 0.2% 93.6% 93.3% - 0.3%
All data comes from the Coastal Carolinas Association of REALTORS® Multiple Listing Service. Provided by South Carolina REALTORS®. Powered by 10K Research and Marketing. | Click for Cover Page | 5
All Properties Single-Family Homes Condos

Inventory of Homes for Sale The number of properties available for sale in active status at the end of the most recent month. Based on one month of activity.
4,071
1,596
946768
2,237
3,327
1,287
866660
1,978
$150,000 and Below
$150,001 to $200,000
$200,001 to $250,000
$250,001 to $300,000
$300,001 and Above
By Price Range4-2011 4-2012
3,014
4,250
2,051
2,599
3,552
1,734
2 Bedrooms or Less
3 Bedrooms 4 Bedrooms or More
By Bedroom Count4-2011 4-2012
- 18.3%
4,874 4,744
4,098 4,020
Single-Family Homes Condos
By Property Type4-2011 4-2012
- 19.4% - 8.5% - 14.1% - 11.6% - 15.9% - 15.3%- 13.8% - 16.4% - 15.5%
By Price Range 4-2011 4-2012 Change 4-2011 4-2012 Change 4-2011 4-2012 Change
$150,000 and Below 4,071 3,327 - 18.3% 1,492 1,103 - 26.1% 2,579 2,224 - 13.8%
$150,001 to $200,000 1,596 1,287 - 19.4% 874 720 - 17.6% 722 567 - 21.5%
$200,001 to $250,000 946 866 - 8.5% 565 538 - 4.8% 381 328 - 13.9%
$250,001 to $300,000 768 660 - 14.1% 474 409 - 13.7% 294 251 - 14.6%
$300,001 and Above 2,237 1,978 - 11.6% 1,469 1,328 - 9.6% 768 650 - 15.4%
All Price Ranges 9,618 8,118 - 15.6% 4,874 4,098 - 15.9% 4,744 4,020 - 15.3%
By Bedroom Count 4-2011 4-2012 Change 4-2011 4-2012 Change 4-2011 4-2012 Change
2 Bedrooms or Less 3,014 2,599 - 13.8% 304 255 - 16.1% 2,710 2,344 - 13.5%
3 Bedrooms 4,250 3,552 - 16.4% 2,768 2,314 - 16.4% 1,482 1,238 - 16.5%
4 Bedrooms or More 2,051 1,734 - 15.5% 1,801 1,528 - 15.2% 250 206 - 17.6%
All Bedroom Counts 9,618 8,118 - 15.6% 4,874 4,098 - 15.9% 4,744 4,020 - 15.3%
All data comes from the Coastal Carolinas Association of REALTORS® Multiple Listing Service. Provided by South Carolina REALTORS®. Powered by 10K Research and Marketing. | Click for Cover Page | 6
All Properties Single-Family Homes Condos
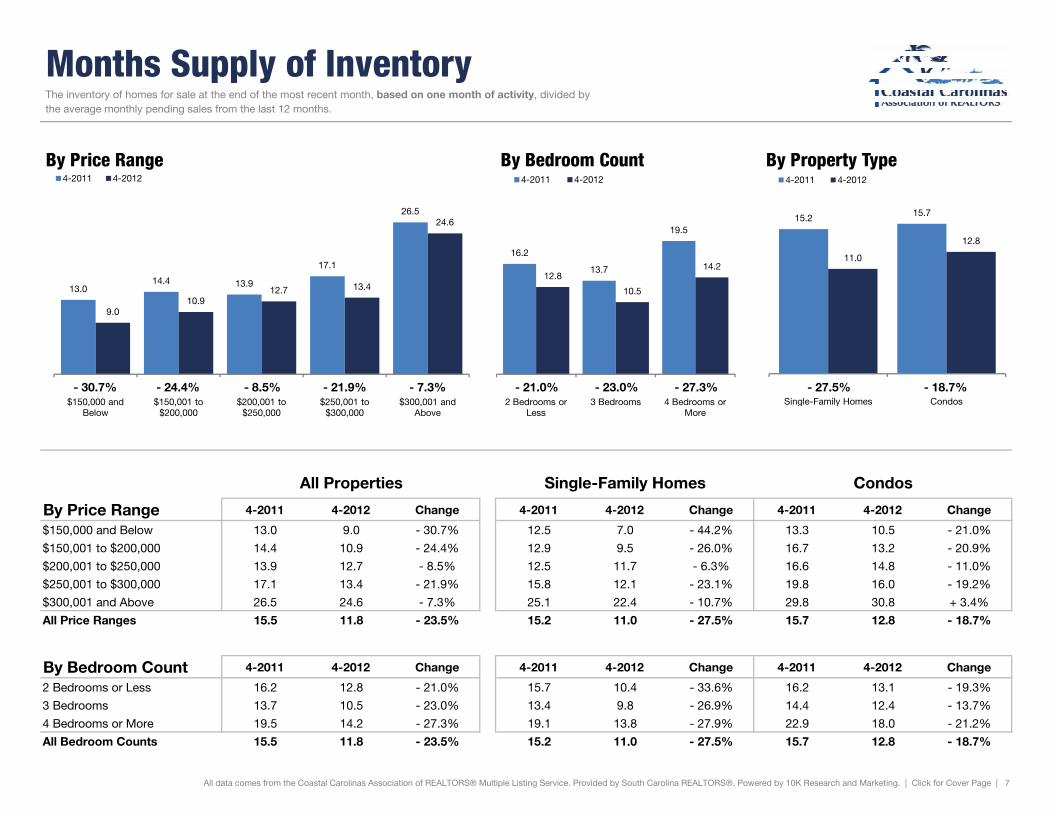
Months Supply of Inventory The inventory of homes for sale at the end of the most recent month, based on one month of activity, divided by the average monthly pending sales from the last 12 months.
13.014.4 13.9
17.1
26.5
9.010.9
12.7 13.4
24.6
$150,000 and Below
$150,001 to $200,000
$200,001 to $250,000
$250,001 to $300,000
$300,001 and Above
By Price Range4-2011 4-2012
16.2
13.7
19.5
12.8
10.5
14.2
2 Bedrooms or Less
3 Bedrooms 4 Bedrooms or More
By Bedroom Count4-2011 4-2012
- 30.7%
15.2 15.7
11.0
12.8
Single-Family Homes Condos
By Property Type4-2011 4-2012
- 24.4% - 8.5% - 21.9% - 7.3% - 27.5% - 18.7%- 21.0% - 23.0% - 27.3%
By Price Range 4-2011 4-2012 Change 4-2011 4-2012 Change 4-2011 4-2012 Change
$150,000 and Below 13.0 9.0 - 30.7% 12.5 7.0 - 44.2% 13.3 10.5 - 21.0%
$150,001 to $200,000 14.4 10.9 - 24.4% 12.9 9.5 - 26.0% 16.7 13.2 - 20.9%
$200,001 to $250,000 13.9 12.7 - 8.5% 12.5 11.7 - 6.3% 16.6 14.8 - 11.0%
$250,001 to $300,000 17.1 13.4 - 21.9% 15.8 12.1 - 23.1% 19.8 16.0 - 19.2%
$300,001 and Above 26.5 24.6 - 7.3% 25.1 22.4 - 10.7% 29.8 30.8 + 3.4%
All Price Ranges 15.5 11.8 - 23.5% 15.2 11.0 - 27.5% 15.7 12.8 - 18.7%
By Bedroom Count 4-2011 4-2012 Change 4-2011 4-2012 Change 4-2011 4-2012 Change
2 Bedrooms or Less 16.2 12.8 - 21.0% 15.7 10.4 - 33.6% 16.2 13.1 - 19.3%
3 Bedrooms 13.7 10.5 - 23.0% 13.4 9.8 - 26.9% 14.4 12.4 - 13.7%
4 Bedrooms or More 19.5 14.2 - 27.3% 19.1 13.8 - 27.9% 22.9 18.0 - 21.2%
All Bedroom Counts 15.5 11.8 - 23.5% 15.2 11.0 - 27.5% 15.7 12.8 - 18.7%
All data comes from the Coastal Carolinas Association of REALTORS® Multiple Listing Service. Provided by South Carolina REALTORS®. Powered by 10K Research and Marketing. | Click for Cover Page | 7
All Properties Single-Family Homes Condos