april 2019 edition - sure dividend · 2019-10-13 · current holds ... now that oil prices have...
TRANSCRIPT

Return to Top 10 List
Sure Dividend International
INVESTING IN NON-U.S. HIGH-QUALITY DIVIDEND SECURITIES
April 2019 Edition
By Ben Reynolds, Nick McCullum, Bob Ciura, Josh Arnold, & Samuel Smith
Edited by David Morris
Published on April 21st, 2019

2
Table of Contents
Opening Thoughts - Dividend Yields Around the Globe - ........................................................ 3
Sell Recommendation For Canadian National Railway (CNI) & Update On ProSiebenSat
(PBSFY) ......................................................................................................................................... 4
The International Top 10 – April 2019 ....................................................................................... 5
Analysis of Top 10 Securities ....................................................................................................... 6
Imperial Oil Ltd (IMO) ............................................................................................................... 6
Canadian Pacific Railway Ltd (CP) ............................................................................................ 8
Novartis AG (NVS) .................................................................................................................. 10
Fresenius Medical Care AG (FMS) .......................................................................................... 12
National Bank of Canada (NTIOF)........................................................................................... 14
SAP SE (SAP)........................................................................................................................... 16
Micro Focus Intl. plc (MFGP) .................................................................................................. 18
The Bank of Nova Scotia (BNS) .............................................................................................. 19
Canadian Imperial Bank of Commerce (CM) ........................................................................... 21
Total SA (TOT)......................................................................................................................... 23
Closing Thoughts - The Long-Term Performance of International Stocks - ........................ 25
Buying & Ranking Criteria........................................................................................................ 26
Past Recommendations & Sells.................................................................................................. 27
Sell Rules .................................................................................................................................. 27
Current Holds ............................................................................................................................ 27
Pending Sells ............................................................................................................................. 28
Sold Positions............................................................................................................................ 28
Tax Guide .................................................................................................................................... 29
How To Buy International Securities ........................................................................................ 31

3
Opening Thoughts - Dividend Yields Around the Globe -
As US-domiciled investors, it is easy for us to benchmark our perspective on the stock market to stocks
that trade in our native country. This tendency causes many US investors to overweight American
stocks in their portfolio relative to the global market portfolio – a tendency known as ‘home country
bias’.
Our familiarity with the US stock market also has other consequences. For example, it is easy for us to
assume that since the average dividend yield among US stocks has been around 2%, it is likely true that
global dividend yields have been around that level as well. But this is not the case.
As the following image shows, there is an interesting stratification trend that emerges when you look
into average dividend yields in countries around the globe:
Source: Siblis Research
This table reveals some interesting trends. France, Spain, Germany, Canada, China, the United
Kingdom, and Australia all have dividend yields that are significantly and persistently higher than their counterpart in the US. The only major global market with a dividend yield below the yield of the
United States is Japan, which is known to have a capital allocation culture focused on hoarding cash on
the balance sheet and growing enterprises rather than returning cash to shareholders via dividend
payments.
What causes this large disparity in dividend yields? In our view, it is a function of the valuation
differences among countries. At the end of 2018, the United States stock market was trading at a
cyclically-adjusted price-to-earnings (CAPE) ratio of 28.0.
For context, many of the other large markets have CAPE ratios that are significantly lower: Canada’s is
21.4, the United Kingdom’s is 14.3, Italy’s is 17.7, Spain’s is 13.0, China’s is 13.4, and Australia’s is
15.5. For dividend growth investors that are willing to invest in opportunities outside of the United States, this presents an opportunity to buy businesses at lower valuations and higher dividend yields
than by investing only in the U.S.
4
Sell Recommendation For Canadian National Railway (CNI) & Update On ProSiebenSat
(PBSFY) Canadian National Railway is a historical recommendation from before we switched to exclusively using Sure Analysis Research Database rankings for The Sure Dividend International Newsletter.
We continue to monitor our past recommendations from the ‘old’ Sure Dividend International strategy
(which was prior to October 2018) for sells as they occur.
Canadian National Railway was first recommended in the February 2018 edition of The Sure Dividend International Newsletter. Since that time1, the stock has generated total returns of 24.4% versus -1.9% for the Vanguard All World Ex-US ETF (VEU).
We continue to believe that Canadian National Railway is a high-quality business likely to pay rising dividends over time. We also believe the rail industry continues to be a slow-changing and sound place to invest for the long-run. The rail industry is tied to the general economy. Recessions impact railroad company performance as less freight is shipped. With that said, Canadian National Railway managed The Great Recession well, with only a 10.6% decline in earnings-per-share from earnings-per-share highs in 2007 to lows in 2008.
Unfortunately, the market has bid up its valuation and that has significantly reduced expected total returns ahead. The stock is currently trading for 22.8 times expected 2019 earnings-per-share of $4.13. This is a steep price for a company that we expect will compound its earnings-per-share at approximately 7% per year moving forward. We expect valuation multiple mean reversion to reduce Canadian National Railway’s total returns by 5.8% per year over the next 5 years.
With an overvalued stock price, we expect total returns of just 2.9% per year moving forward for Canadian National Railway. That’s why we recommend investors sell Canadian National Railway and reinvest into Canadian Pacific Railway (CP) or another high-quality dividend growth security.
Our Canadian National Railway investment has worked out favorably. The same cannot be said for our ProSiebenSat recommendation. We first recommended the security in March of 2018. Since that time, ProSiebenSat has declined by 48.1% versus a decline of 2.5% for VEU.
Worse yet, the company recently announced a dividend reduction. ProSiebenSat will go from paying out 80% to 90% of its adjusted net income as a dividend down to 50%. And adjusted earnings have declined. This means the company’s dividend will fall from €1.93 to €1.19. After careful analysis of the security, we do not feel comfortable recommending it as a sell at this time. We believe this to be a low point for ProSiebenSat. The company has better revenue growth prospects ahead, especially with its recent eHarmony acquisition. And, the company has committed to repurchasing up to ~7% of shares over the next 2 years. This is especially beneficial for shareholders as these repurchases are being done at low prices. We will continue to monitor the situation at ProSiebenSat and issue a sell or pending sell as appropriate.
1 Return data through mid-morning 4/18/19.
5
The International Top 10 – April 2019
Name and Ticker Country Dividend Risk Score
Exp. Value
Return
Dividend Yield1
Exp. Growth
ETR
Imperial Oil (IMO) Canada A 3.5% 1.9% 7.0% 12.4%
Can. Pac. Railway (CP) Canada A 1.4% 0.9% 8.5% 10.8%
Novartis (NVS) Switzerland B 5.3% 2.4% 4.0% 11.7%
Fresenius Medical (FMS) Germany B 3.9% 1.2% 6.0% 11.1%
Nat. Bk. of Can. (NTIOF) Canada B 0.6% 3.5% 6.0% 10.1%
SAP (SAP) Germany B -0.4% 1.0% 9.0% 9.6%
Micro Focus (MFGP) U.K. C 7.0% 4.5% 8.0% 19.5%
Scotiabank (BNS) Canada C 4.1% 4.1% 8.0% 16.2%
CIBC (CM) Canada C 3.3% 4.3% 5.5% 13.1%
Total (TOT) France C 1.7% 3.9% 7.0% 12.6%
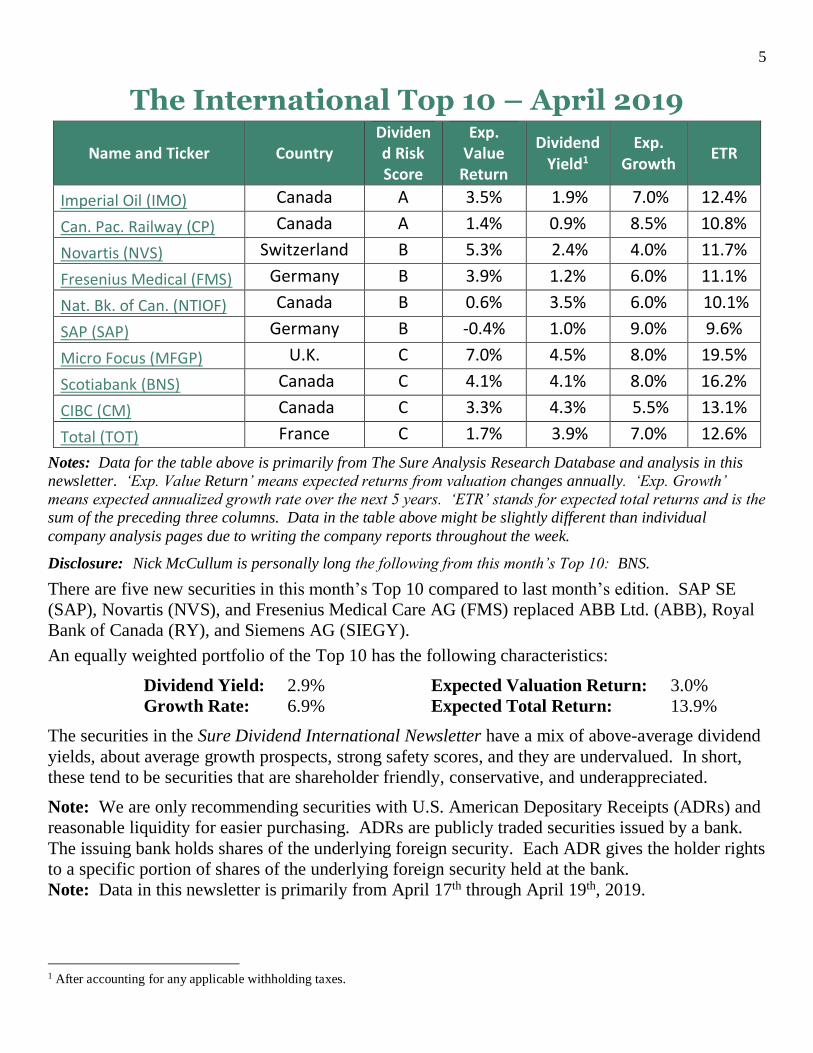
Notes: Data for the table above is primarily from The Sure Analysis Research Database and analysis in this
newsletter. ‘Exp. Value Return’ means expected returns from valuation changes annually. ‘Exp. Growth’
means expected annualized growth rate over the next 5 years. ‘ETR’ stands for expected total returns and is the
sum of the preceding three columns. Data in the table above might be slightly different than individual
company analysis pages due to writing the company reports throughout the week.
Disclosure: Nick McCullum is personally long the following from this month’s Top 10: BNS.
There are five new securities in this month’s Top 10 compared to last month’s edition. SAP SE
(SAP), Novartis (NVS), and Fresenius Medical Care AG (FMS) replaced ABB Ltd. (ABB), Royal
Bank of Canada (RY), and Siemens AG (SIEGY).
An equally weighted portfolio of the Top 10 has the following characteristics:
Dividend Yield: 2.9% Expected Valuation Return: 3.0%
Growth Rate: 6.9% Expected Total Return: 13.9%
The securities in the Sure Dividend International Newsletter have a mix of above-average dividend
yields, about average growth prospects, strong safety scores, and they are undervalued. In short,
these tend to be securities that are shareholder friendly, conservative, and underappreciated.
Note: We are only recommending securities with U.S. American Depositary Receipts (ADRs) and
reasonable liquidity for easier purchasing. ADRs are publicly traded securities issued by a bank.
The issuing bank holds shares of the underlying foreign security. Each ADR gives the holder rights
to a specific portion of shares of the underlying foreign security held at the bank.
Note: Data in this newsletter is primarily from April 17th through April 19th, 2019.
1 After accounting for any applicable withholding taxes.
6
Return to Top 10 List
Analysis of Top 10 Securities
Imperial Oil Ltd (IMO) Overview & Current Events
Imperial Oil is an integrated oil and gas conglomerate based in Canada. The company operates three
core segments: Upstream, Downstream, and Chemical. The Upstream segment includes the
exploration for and production of crude oil and natural gas. The Downstream segment consists of the
refining of crude oil into petroleum products. The Chemical segment manufactures and markets
hydrocarbon-based chemical products. Exxon Mobil owns approximately 70% of Imperial Oil.
In early February, Imperial Oil reported (2/1/19) its financial results for the fourth quarter of fiscal
2018. Downstream earnings grew to ~US$860 million for the quarter, from US$218 million in the
same quarter a year ago. Strong growth came from improved refining margins, which resulted from the large discount of Western Canadian Select (WCS) to West Texas Intermediate crude. For the full
year, Imperial Oil achieved record downstream earnings and the highest petroleum product sales in
nearly 30 years. Earnings-per-share grew to US$2.20 in 2018, from US$0.86 per share in 2017.
Growth, Competitive Advantages, and Total Returns
The primary growth catalyst for Imperial Oil is higher commodity prices, followed closely by higher margins in the refining segment. Now that oil prices have recovered from the 2014-2016 downturn,
Imperial Oil’s earnings have improved as well. Continued growth is possible for Imperial Oil.
According to the company, Canada has the third-highest level of oil reserves worldwide, behind only
Venezuela and Saudi Arabia. Imperial Oil expects to grow its production by 15% from 2018 to 2020.
Share repurchases will also help boost earnings growth. Imperial Oil reduced its share count by 5% in the last 12 months, and management intends to continue buying back stock going forward.
Imperial Oil’s high-quality reserves are a major competitive advantage, as is the company’s robust
financial position, which earns a credit rating of AA+ from S&P. A strong balance sheet and high
credit rating help the company raise capital at favorable terms with more cash flow left over for dividends. Imperial Oil has paid 100+ years of dividends and has increased its dividend for 24 years.
Based on projected 2019 earnings-per-share of US$2.50, Imperial Oil stock trades for a price-to-
earnings ratio of 11.8. This is slightly below our fair value estimate of 14.0, a reasonable valuation for
a large-cap oil stock with modest growth potential. Because of this, valuation changes are expected to boost shareholder returns by approximately 3.5% per year over the next five years. In addition to
valuation changes, earnings growth and dividends will also fuel positive shareholder returns. Earnings
are expected to grow by 7% per year over next five years, as the company capitalizes on the oil price
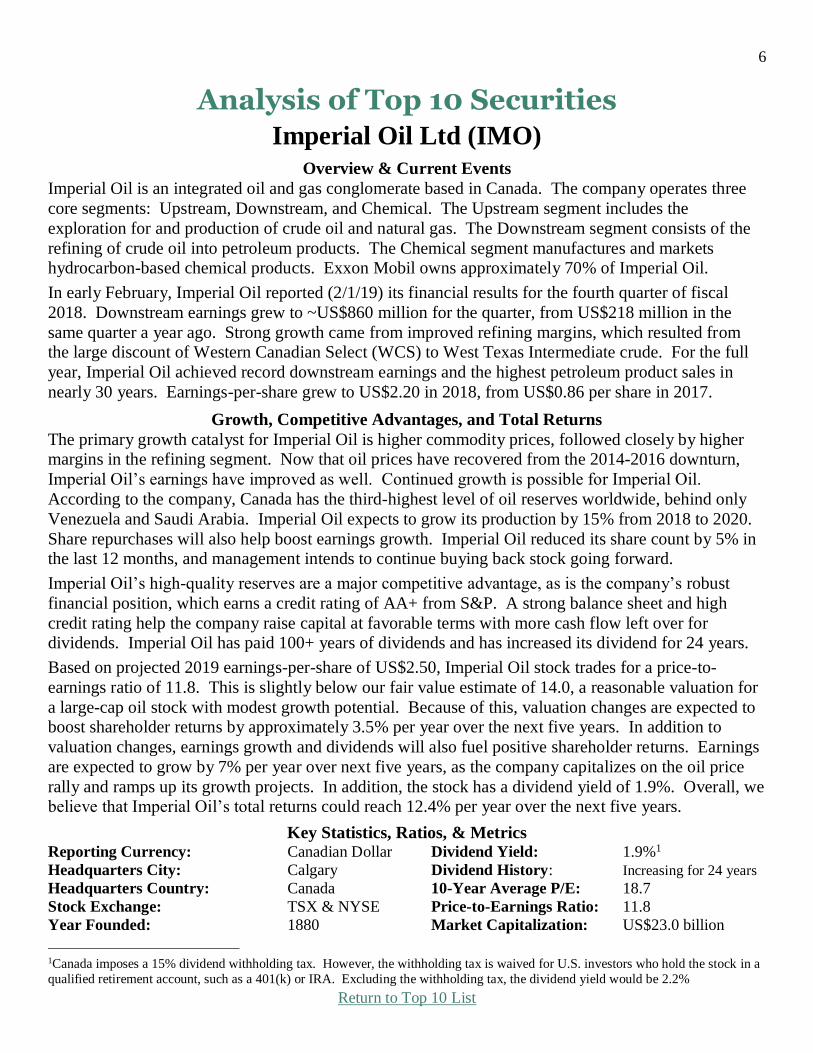
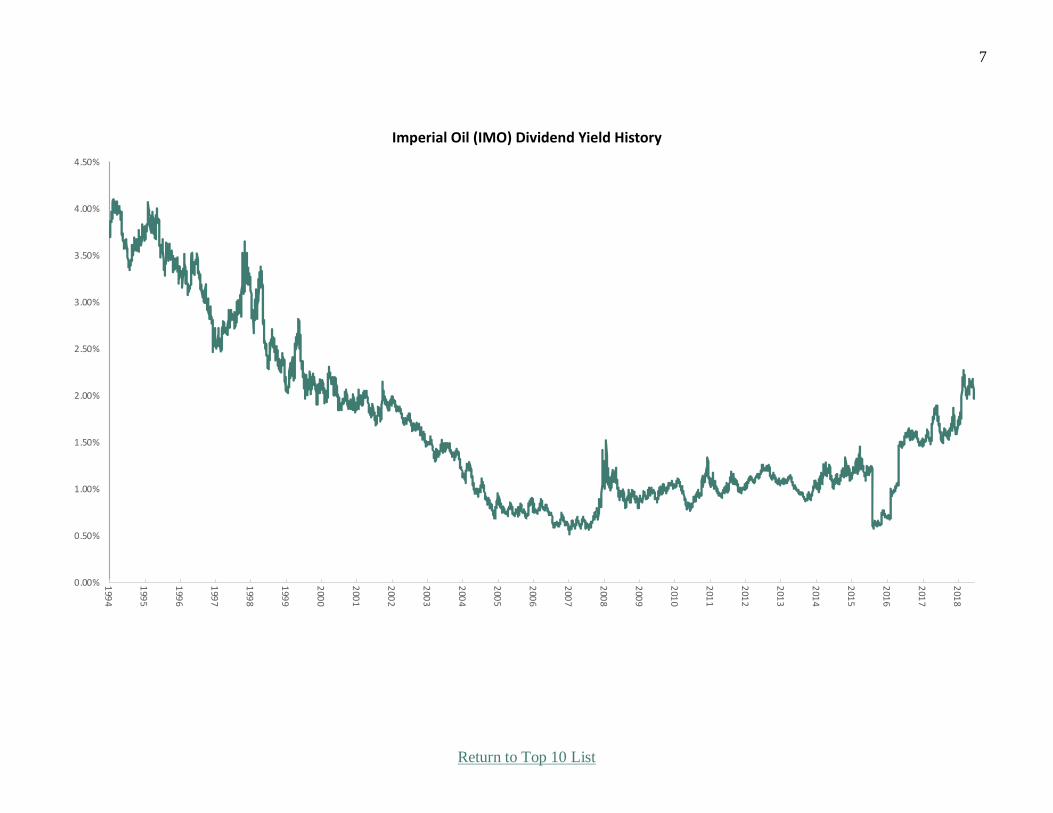
rally and ramps up its growth projects. In addition, the stock has a dividend yield of 1.9%. Overall, we
believe that Imperial Oil’s total returns could reach 12.4% per year over the next five years.
Key Statistics, Ratios, & Metrics Reporting Currency: Canadian Dollar Dividend Yield: 1.9%1
Headquarters City: Calgary Dividend History: Increasing for 24 years
Headquarters Country: Canada 10-Year Average P/E: 18.7
Stock Exchange: TSX & NYSE Price-to-Earnings Ratio: 11.8
Year Founded: 1880 Market Capitalization: US$23.0 billion
1Canada imposes a 15% dividend withholding tax. However, the withholding tax is waived for U.S. investors who hold the stock in a
qualified retirement account, such as a 401(k) or IRA. Excluding the withholding tax, the dividend yield would be 2.2%
7
Return to Top 10 List
0.00%
0.50%
1.00%
1.50%
2.00%
2.50%
3.00%
3.50%
4.00%
4.50%
1994
1995
1996
1997
1998
1999
2000
2001
2002
2003
2004
2005
2006
2007
2008
2009
2010
2011
2012
2013
2014
2015
2016
2017
2018
Imperial Oil (IMO) Dividend Yield History
8
Return to Top 10 List
Canadian Pacific Railway Ltd (CP)
Overview & Current Events
Canadian Pacific Railway is a railroad company that operates ~14,000 miles of railways in Canada and the U.S. It is one of two class 1 railroads in Canada (Canadian National Railway being the other). The
company was founded in 1881, is headquartered in Calgary, Alberta, Canada and currently trades at a
market capitalization of $29 billion.
Canadian Pacific reported its fourth quarter and full year earnings results on January 23rd. The company generated revenues of C$2.0 billion, which is equivalent to US$1.5 billion. Canadian
Pacific’s revenues rose by 17% year-over-year, on the back of a strong volume growth rate of 9%.
Other factors that positively impacted Canadian Pacific’s revenue growth include improved pricing,
which contributed 4% to Canadian Pacific’s top line, as well as beneficial forex movements and fuel
expenses that were passed on to customers. Canadian Pacific has not only grown its revenues substantially, the company was able to increase its margins on top of that. Canadian Pacific’s
operating ratio (expenses relative to revenues) was 56.5% during the fourth quarter, a 370-basis point
improvement versus the prior year’s quarter.
This combination of a strong revenue growth rate and a substantial margin increase allowed Canadian Pacific to grow its net earnings by 38% year-over-year. Earnings-per-share grew even faster due to the
impact of a declining share count. Earnings-per-share of C$4.55 were up 41% year-over-year.
Canadian Pacific announced guidance numbers for fiscal 2019 during the Q4 earnings call. The
company forecasts mid-single-digit volume growth and earnings-per-share growth in the double digits.
Growth, Competitive Advantages, and Total Returns
As one of only seven Class 1 railroads in North America – the others being Canadian National Railway (CNI), CSX Corporation (CSX), Norfolk Southern Corporation (NSC), Union Pacific Corporation
(UNP), BNSF Railway (owned by BRK.B), and Kansas City Southern (KSU) – Canadian Pacific
benefits from operating in an oligopoly with tremendous barriers to entry. Canadian Pacific has
compounded its earnings-per-share at ~17% per year over the last decade. With that said, the
company’s growth is highly dependent on continued economic expansion. We believe the company is capable of growing its earnings-per-share at around 8.5% per year moving forward.
We expect Canadian Pacific Railway to generate earnings-per-share of ~$12.19 in fiscal 2019. Using
this estimate, the company is trading at a forward price-to-earnings ratio of 17.7. Our fair value target
for the company is a price-to-earnings ratio of 19.0, which is in-line with its 10-year average price-to-earnings ratio. If the company’s valuation multiple can expand to 19 times earnings over the next five
years, this will boost its total returns by 1.4% per year during this time period. Combine this potential
for valuation expansion with the 0.9% dividend yield and its growth prospects (8.5%) and Canadian
Pacific seems capable of delivering total returns of 10.8% per year moving forward.
Key Statistics, Ratios, & Metrics Reporting Currency: Canadian Dollar Dividend Yield: 0.9%1
Headquarters City: Calgary Dividend History: Steady or rising since 2001
Headquarters Country: Canada 10 Year Average P/E: 19.0
Stock Exchange: TSX & NYSE Price-to-Earnings Ratio: 17.7
Year Founded: 1881 Market Capitalization: US$29.5 billion
1 Canada imposes a 15% dividend withholding tax. However, the withholding tax is waived for U.S. investors who hold the stock in a
qualified retirement account, such as a 401(k) or IRA. Excluding the withholding tax, the dividend yield would be 1.0%.

9
Return to Top 10 List
0.00%
0.50%
1.00%
1.50%
2.00%
2.50%
3.00%
3.50%
4.00%
4.50%
5.00%
1994
1995
1996
1997
1998
1999
2000
2001
2002
2003
2004
2005
2006
2007
2008
2009
2010
2011
2012
2013
2014
2015
2016
2017
2018
Canadian Pacific Railway (CP) Dividend Yield History

10
Return to Top 10 List
Novartis AG (NVS)
Overview & Current Events
Novartis is a global healthcare company based in Switzerland. Its core Innovative Medicines division focuses in the therapeutic areas of oncology, cardiovascular, dermatology, respiratory and several
others. Novartis’ Sandoz division markets generic drugs. Novartis has a current market cap of $194
billion.
In late January (1/30/19) Novartis reported fourth-quarter and full-year 2018 results. All figures are in U.S dollars. Fourth-quarter revenue increased 2.7% to $13.3 billion. The company earned $1.25 per
share in the fourth quarter, up 3.3% year-over-year. Revenue grew 5.7% to $51.9 billion for 2018,
while earnings-per-share increased 6% to $5.14 for the year. Revenue for plaque psoriasis medication
Cosentyx, the company’s top selling product, increased by 36% for the full year. Sales for Entresto,
which is used to treat chronic heart failure, more than doubled in 2018. Overall, the company’s top six-selling products all had at least double-digit revenue growth for the year. Sandoz, which holds the
company’s generic drug portfolio, experienced a 5.2% decline in quarterly revenue and a decline of 3%
for 2018. The majority of this decline came from the U.S. as competition caused pricing weakness.
More recently, on April 9th Novartis completed the spin-off of its eye-care unit Alcon, which will now trade independently under the ticker symbol ALC.
Growth, Competitive Advantages, and Total Returns
The key catalyst for Novartis is its product pipeline. Novartis expects to bring as many as 14 potential
blockbuster products to market by 2020, with the potential for 20 additional blockbusters over the long-
term. The company’s earnings-per-share growth will also be fueled by a US$5 billion share buyback,
announced after the Alcon spin-off. The buyback is expected to be completed in 2019. Novartis is
expected to earn $5.48 per ADR share in 2019 and produce $53.5 billion in revenue. Achieving these
estimates would represent 6.6% earnings-per-share growth and a 3.1% increase in revenue from 2018.
This growth is made possible by the company’s extensive research and development platform, which is
its major competitive advantage. Novartis spent over $9 billion on R&D in 2018, and as a result the
company has a well-stocked product pipeline.
Novartis stock trades for a price-to-earnings ratio of 13.9, which is significantly below our fair value
estimate of 18.0, equal to the 10-year average valuation of the stock. Expansion of the price-to-
earnings ratio to fair value would increase annual returns by 5.3% over the next five years. Novartis
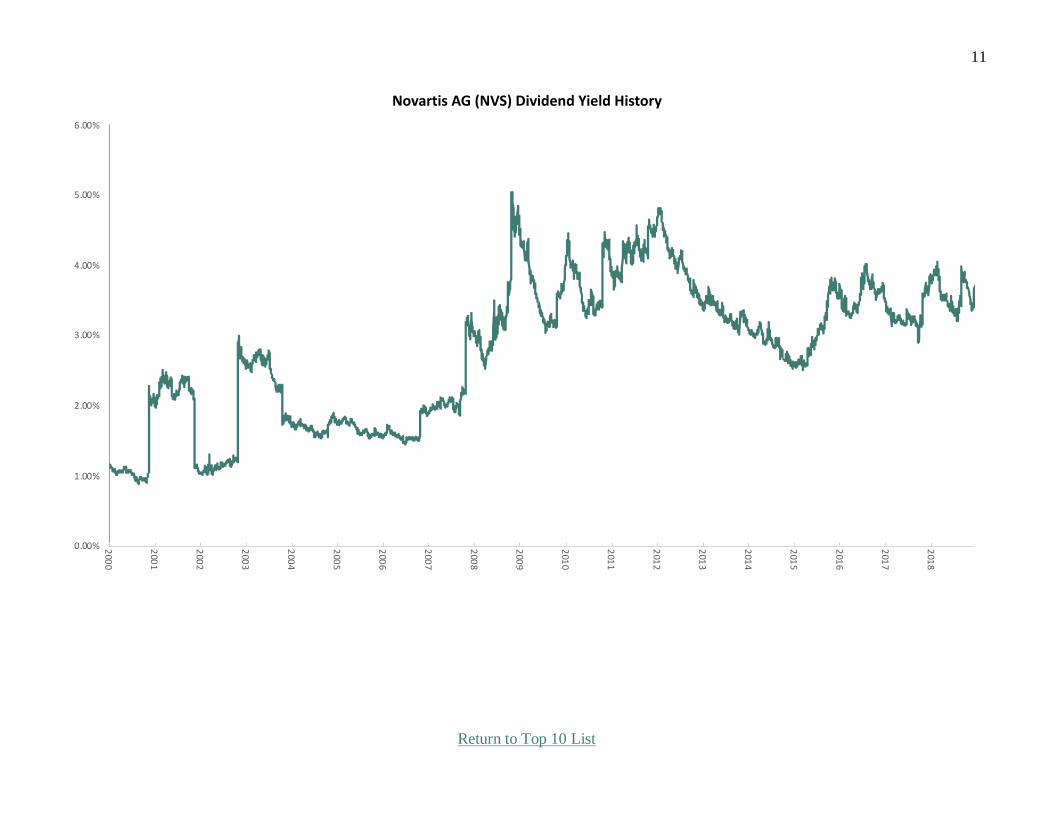
also pays an annual dividend to shareholders. After the Alcon spin-off, Novartis announced it will
maintain its current dividend rate of CHF2.85 per share. In U.S. dollars, Novartis has an annual dividend payout of US $2.81 per share, representing an after-tax dividend yield of 2.4%. The
combination of dividends, expected annual EPS growth (4%) and multiple expansion (5.3%) is likely
to result in total returns of 11.7% per year over the next five years.
Key Statistics, Ratios, & Metrics Reporting Currency: U.S. Dollar Dividend Yield: 2.4%1
Headquarters City: Basel Dividend History: 22 years of increases
Headquarters Country: Switzerland 10-Year Average P/E: 18.0
Stock Exchange: SIX & NYSE Price-to-Earnings Ratio: 13.9
Year Founded: 1895 Market Capitalization: US$194 billion
1Switzerland imposes a 35% dividend withholding tax. Excluding the withholding tax, the dividend yield would be 3.7%
11
Return to Top 10 List
0.00%
1.00%
2.00%
3.00%
4.00%
5.00%
6.00%
2000
2001
2002
2003
2004
2005
2006
2007
2008
2009
2010
2011
2012
2013
2014
2015
2016
2017
2018
Novartis AG (NVS) Dividend Yield History
12
Return to Top 10 List
Fresenius Medical Care AG (FMS)
Overview & Current Events
Fresenius Medical Care operates in the healthcare sector and is based in Germany. The company goes back to 1912, when Dr. Eduard Fresenius began the production of pharmaceuticals at the Hirsch
Pharmacy. Today, the company primarily focuses on kidney-related diseases. Its products include
dialysis machines, dialyzers and related disposables. Fresenius has a stock market capitalization of
approximately US$24.4 billion.
In late February (2/20/19) Fresenius Medical released fourth quarter and full year financial results.
Comparable revenue grew 7% on both reported and constant currency basis. Currency exchange was
not a meaningful factor for the fourth quarter. Operating income increased 42% while adjusted net
income increased 13% compared with the same quarter the previous year. In 2018, revenue declined
1% on a reported basis, but increased 4% excluding the impact of currency. Operating income and net income increased by 3% and 11%, respectively. Fresenius also announced a share buyback for 1
billion euros (approximately US$1.12 billion) over the next two years, which will help boost earnings-
per-share growth.
Growth, Competitive Advantages, and Total Returns
Fresenius should continue to generate growth over the long-term, because of its operational focus. According to the company, approximately 3.2 million people around the world undergo regular dialysis
treatment. This figure is only expected to rise in the years ahead. Fresenius estimates the number of
dialysis patients will grow to 4.9 million by 2025. This presents a fundamental tailwind for the
company. In addition, Fresenius is seeking growth in new channels, specifically at-home care. Fresenius recently completed its $2 billion acquisition of NxStage Medical, which specializes in at-
home dialysis equipment and related products. NxStage expects to generate revenue of approximately
US$270 million to US$292 million in 2019, and up to US$371 million in 2020. We believe annual
earnings growth of 6% is achievable for Fresenius, thanks to the company’s strong industry position.
Fresenius’ primary competitive advantage is the dominance it has established in its core niche of kidney-related illness. Fresenius has over 3,700 dialysis centers, and decades of experience in dialysis.
We expect Fresenius will generate earnings-per-ADR of US$2.66 for fiscal 2019. Based on this, the
stock has a price-to-earnings ratio of 14.9. Our fair value estimate is a price-to-earnings ratio of 18.0,
equal to a fair value share price of US$48. As a result, the stock appears to be significantly undervalued. An expanding stock valuation could boost annual shareholder returns by 3.9% per year,
as will the company’s earnings growth and dividends. We expect Fresenius to generate 6.0% annual
earnings growth, and the stock also has a 1.2% dividend yield. While this is not an extremely high
yield, the company is committed to paying a rising dividend. Fresenius has paid rising dividends in its
home currency for 22 consecutive years. The combination of valuation changes, earnings growth, and dividends results in expected returns of 11.1% per year for Fresenius stock over the next five years.
Key Statistics, Ratios, & Metrics Reporting Currency: Euro Dividend Yield: 1.2%1
Headquarters City: Bad Homburg Dividend History: Increasing for 22 years
Headquarters Country: Germany 10 Year Average P/E: 19.5
Stock Exchange: DAX & NYSE Price-to-Earnings Ratio: 14.9
Year Founded: 1912 Market Capitalization: US$24.4 billion
1 Germany imposes a 26% withholding tax. Excluding this withholding tax, the dividend yield would be 1.6%.

13
Return to Top 10 List
0.00%
0.50%
1.00%
1.50%
2.00%
2.50%
3.00%
3.50%
1999
2000
2001
2002
2003
2004
2005
2006
2007
2008
2009
2010
2011
2012
2013
2014
2015
2016
2017
2018
Fresenius Medical Care AG (FMS) Dividend Yield History
14
Return to Top 10 List
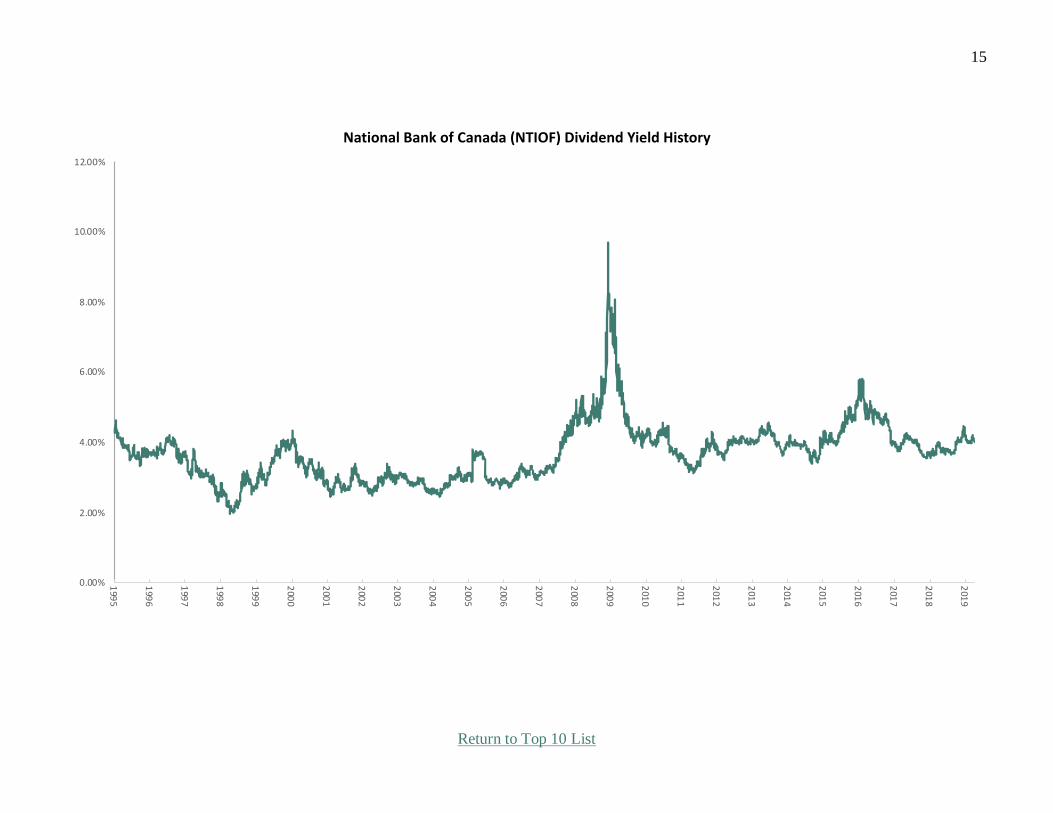
National Bank of Canada (NTIOF)
Overview & Current Events
National Bank of Canada is the sixth-largest bank in Canada, behind The Big 5 Canadian Banks. National Bank’s historical roots go as far back as 1859. The company is headquartered in Montreal,
Quebec, Canada and trades with a market capitalization of $15.8 billion.
National Bank reported its fiscal first-quarter results in late February (2/27/19). Earnings-per-share
rose 3% for the quarter (compared to the same period in fiscal 2018) and 10% in fiscal 2018. The bank reported stable overall results despite challenging markets. Specifically, year-over-year net income of
the Personal and Commercial segment rose 7% to CAD$246 million, Wealth Management rose 10% to
CAD$125 million, U.S. Specialty Finance and International rose 20% to CAD$60 million, but the
Financial Markets segment fell 17% to CAD$170 million. The Financial Markets segment was
impacted by lower investment banking revenues and lower gains on investments. National Bank’s efficiency ratio was 42.7% for Q1, 3.9% higher than in the first quarter of 2018. Return on equity was
17.2% for Q1 versus 18.5% for full fiscal 2018. The bank’s common equity tier 1 ratio was 11.5% at
the end of Q1, which aligns with 2018’s and is more than adequate. Net impaired loans came in at
0.3%, in line with the comparable year-ago figure. In summary, National Bank’s Q1 earnings indicate
stability. We maintain our estimate of CAD$6.30 in earnings-per-share for fiscal 2019.
Growth, Competitive Advantages, and Total Returns
National Bank of Canada’s growth prospects are not as robust as its larger peers within the Canadian
banking industry. The main reason for this is because of its lack of exposure to international markets. In the most recent fiscal year, National Bank generated just 9.2% of its net income from its “U.S.
Specialty Finance and International Segment.” For context, Canadian Imperial Bank of Commerce –
the other Canadian bank that arguably has the second-weakest international exposure – generated
14.2% of its net income from its U.S. Commercial Banking and Wealth Management segment in the
most recent quarter, while The Toronto-Dominion Bank generated 39% of its net income from the U.S. last quarter. We would be delighted to see National Bank pursue a more aggressive international
growth strategy moving forward, but today the bank’s prospects are weaker than its peers.
We believe that the National Bank of Canada is likely to generate earnings-per-share of around
CAD$6.30 in fiscal 2019, which is equivalent to US$4.72 at prevailing exchange rates. The company’s U.S.-listed shares currently trade at $47.26, for a price-to-earnings ratio of 10.0. For context, National
Bank’s 10-year average price-to-earnings ratio is 10.3, which is our fair value target for National Bank.
If National Bank’s valuation multiple expands to its 10-year average over the next five years, this will
boost its total returns by a modest 0.6% per year during this time period. Separately, the bank appears
capable of delivering earnings growth of around 6% per year, and it trades with a current yield of 3.5%.
National Bank seems capable of delivering returns of about 10.1% per year moving forward.
Key Statistics, Ratios, & Metrics Reporting Currency: Canadian Dollar Dividend Yield: 3.5%1
Headquarters City: Montreal Dividend History: Steady or rising since 1993
Headquarters Country: Canada 10-Year Average P/E: 10.3
Stock Exchange: TSX & NYSE Price-to-Earnings Ratio: 10.0
Year Founded: 1859 Market Capitalization: US$15.8 billion
1Canada imposes a 15% dividend withholding tax. However, the withholding tax is waived for U.S. investors who hold the stock in a
qualified retirement account, such as a 401(k) or IRA. Excluding the withholding tax, the dividend yield would be 4.1%.
15
Return to Top 10 List
0.00%
2.00%
4.00%
6.00%
8.00%
10.00%
12.00%
1995
1996
1997
1998
1999
2000
2001
2002
2003
2004
2005
2006
2007
2008
2009
2010
2011
2012
2013
2014
2015
2016
2017
2018
2019
National Bank of Canada (NTIOF) Dividend Yield History
16
Return to Top 10 List
SAP SE (SAP) Overview & Current Events
SAP SE was founded in 1972 and is headquartered in Walldorf, Germany. Today, it develops, sells, and maintains a variety of enterprise software products that are used by corporations, governments, and
educational agencies. SAP delivers enterprise applications with software and software-related services.
The company has more than 400,000 customers in over 180 countries. SAP generates annual revenue
of more than US$30 billion and the stock trades with a market capitalization of US$135 billion.
In late January, SAP reported (1/29/19) its fourth quarter and full year 2018 earnings results. Fourth
quarter revenue of US$8.4 billion increased 13% year-over-year on a constant currency basis.
Operating profit increased 22% during the fourth quarter. On a per-share basis, earnings of US$1.72 declined by 15% for the fourth quarter. Despite this, 2018 was a strong year overall for the
business. SAP reported 11% revenue growth in constant currency. Operating profit increased 10% for
the year, while earnings-per-share increased 2% for fiscal 2018. SAP forecasts that total cloud and
software revenues will rise by 8%-10% during 2019, while operating profits are forecasted to rise by
7%-12% for the upcoming fiscal year. In late February, the company divested its content-as-a-service business, selling it to Verisk for an undisclosed sum.
Growth, Competitive Advantage & Total Returns
In the past decade, SAP grew its adjusted earnings-per-share at 12.4% per year. Still, there is plenty of
opportunity for continued growth. Areas of strategic focus include data analytics, the Internet of
Things, machine learning, blockchain, and more. Demand for cloud services and solutions is only set
to increase going forward. Last year, SAP acquired experience management software company Qualtrics International for $8 billion. We expect 9% annual earnings growth through 2024.
SAP’s strongest competitive advantage is its recurring revenue business model. The company ended
2018 with roughly 65% of total revenue as recurring in nature. SAP expects this metric to rise to 70%-
75% by 2020. SAP plans to grow its subscription revenues by 33%-39% during fiscal 2019. Recurring
revenue allows the company to optimize retention rates and use the resulting cash flows to aggressively invest in compelling growth opportunities (such as its cloud business). SAP’s strong balance sheet is
another competitive advantage, earning high credit ratings of A from S&P and A2 from Moody’s.
Our fair value target for SAP is a price-to-earnings ratio of 20. The stock currently trades for a price-
to-earnings ratio of 20.4. This implies essentially no impact from the valuation on total returns in the
years to come. SAP also pays an annual dividend to shareholders. The company recently increased its
target dividend payout ratio to at least 40% of after-tax annual profit. This change in policy gave way
to a strong 12% dividend hike last year, to US$1.80 per share, which represents a current yield of 1.6%. Along with 9% expected annual earnings growth, the combination of valuation changes (-0.4%) and
dividends leads to total expected returns of 10.2% per year over the next five years.
Key Statistics, Ratios, & Metrics Reporting Currency: Euros Dividend Yield: 1.0%1
Headquarters City: Walldorf Dividend History: Paid since 1988
Headquarters Country: Germany 10-Year Avg. P/E Ratio: 21.8
Stock Exchange: DAX, NYSE Price-To-Earnings Ratio: 20.4
Year Founded: 1972 Market Capitalization: US$135 billion
1 Germany imposes a 26% withholding tax on dividends to international shareholders. Excluding this tax, its yield would be 1.6%.

17
Return to Top 10 List
0.00%
0.50%
1.00%
1.50%
2.00%
2.50%
3.00%
1998
1999
2000
2001
2002
2003
2004
2005
2006
2007
2008
2009
2010
2011
2012
2013
2014
2015
2016
2017
2018
SAP SE (SAP) Dividend Yield History
18
Return to Top 10 List
Micro Focus Intl. plc (MFGP)
Overview & Current Events Micro Focus International is a global enterprise software corporation. The company’s products include
IT infrastructure and enterprise applications. Micro Focus International’s operating segments include
Security, IT Operations Management, Application Delivery Management, Information Management &
Governance, and Application Modernization & Connectivity. Micro Focus is based in the U.K. The
ADRs have traded on the New York Stock Exchange since 2017.
In mid-February (2/14/19) Micro Focus International reported new financial results. For the previous
12 months, pro-forma revenue declined 5.3%, better than expected as the company’s guidance called for a 6%-9% decline. Adjusted EBITDA grew 9.2% to $1.5 billion, as EBITDA margin improved to
37.7% from 31.8% in the (7/11/18) mid-year report. The company also repurchased $400 million
worth of stock in 2018 and added another $110 million to its repurchase authorization. In fiscal 2018,
earnings-per-share increased 6.2% to US $1.87.
For 2019, Micro Focus International expects constant currency revenue to decline 4% to 6%.
Fortunately, Micro Focus expects the revenue decline to stabilize by 2020, while adjusted EBITDA
margins are expected to expand to the mid-40% range, more than offsetting revenue declines.
Growth, Competitive Advantages, and Total Returns
Micro Focus International has a positive long-term growth outlook. It has an established presence in
high demand technology platforms, including artificial intelligence, IT management, security, and data
analytics. Also, as Micro Focus noted in the most recent interim financial release, 70% of company revenue is now recurring, which provides it with the ability to invest recurring cash flows into growth
opportunities. Micro Focus International acquired HPE Software to accelerate its growth in new areas.
This made Micro Focus International one of the largest dedicated software companies in the world.
The company grew earnings-per-share by 19% per year over the past decade, and we expect 8% annual
earnings growth for Micro Focus International over the next five years.
Micro Focus International generated adjusted earnings-per-share of US$1.87 in fiscal 2018. We expect
the company to achieve fiscal 2019 earnings-per-share of about US$2.32. Using this estimate, the
company is trading at a price-to-earnings ratio of just 10.7; significantly below our fair value estimate
of 15. This indicates the stock is deeply undervalued. An expanding valuation multiple could add 7% to the annual shareholder returns moving forward. Separately, Micro Focus International has a 4.5%
dividend yield, which is not subject to any withholding tax. Lastly, expected earnings growth of
approximately 8% per year will add to shareholder returns. All said, Micro Focus International could
generate annual returns of 19.5% over the next five years.
Key Statistics, Ratios, & Metrics
Reporting Currency: U.S. Dollar Dividend Yield: 4.5%1
Headquarters City: Newbury Dividend History: Increasing since 2006
Headquarters Country: United Kingdom 10-Year Average P/E: 14.9 (since 2017)
Stock Exchange: LSE & NYSE Price-to-Earnings Ratio: 10.7 Year Founded: 1976 Market Capitalization: US $10.4 billion
Note: Due to Micro Focus’ short history as an ADR, we do not have a dividend yield history for this security. 1 There is no withholding tax on dividends received from companies headquartered in the U.K.
19
Return to Top 10 List
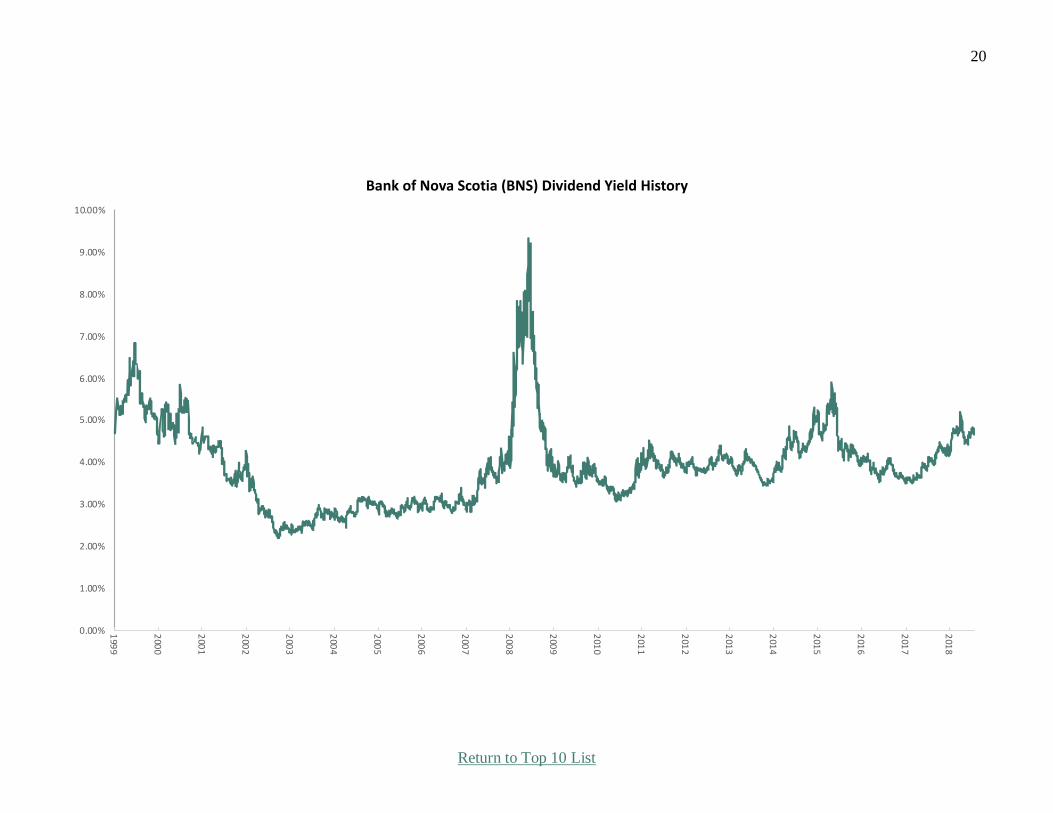
The Bank of Nova Scotia (BNS) Overview & Current Events
The Bank of Nova Scotia - often referred to as Scotiabank - is Canada’s third-largest financial institution behind the Royal Bank of Canada (RY) and The Toronto-Dominion Bank (TD). The
company operates in three business units: Canadian Banking (49% of 2018’s net income),
International Banking (31%), and Global Banking and Markets (20%). Scotiabank is cross-listed on
the Toronto and New York Stock Exchanges and trades with a US$67 billion market capitalization.
Scotiabank reported Q1 results on 2/26/19. The report was in-line with our expectations. Adjusted
earnings-per-share came in at CAD$1.75 against CAD$1.87 in the year-ago period, a decline of 6%.
However, last year’s number included a CAD$0.12 cent benefit thanks to a revaluation of the company’s benefit plan. On a comparable basis, earnings-per-share were about flat.
Operationally, Scotiabank’s results looked much better. Total revenue was up 7.3% thanks to an 8.6% gain in interest income and a 5.6% boost in noninterest income. The international business led the
way in terms of growth in Q1, but Scotiabank continues to perform well across the board. The bank’s
provisions for credit losses soared 26%, in Q1 but that was due to foreign currency translation as well
as from growth in the loan portfolio. This spike higher in provisions is to be expected given that Scotiabank is growing its loan book both organically and via acquisitions, but it does reduce earnings
in the period. Noninterest expense also crimped earnings during the quarter as that line item rose 19%
year-over-year. This was due to the integration expense of the bank’s recent mergers, including BBVA
Chile, MD Financial Management, and Jarislowsky Fraser Ltd.
Growth, Competitive Advantage & Total Returns
Scotiabank has two catalysts that should drive its growth for the foreseeable future. The first is
expansion into international markets. Scotiabank has been entering markets within Latin America,
where it can use its size and capital strength to acquire smaller players and consolidate the industry.
Early results have been very promising. In the most recent quarter, the International Banking segment generated revenue growth of 22% and adjusted net income growth of 16% while operating with a net
interest margin of 4.52% (compared to 2.45% for the Canadian Banking unit). While international
banking markets come with higher risks of losses, currency exposure, geopolitical risk, and a host of
other issues, the margins that these markets can provide are well in excess of established markets.
Scotiabank does not provide earnings-per-share guidance, but we believe it is likely to deliver 2019 earnings-per-share of about US$5.59, or CAD$7.45. Using this earnings estimate, Scotiabank’s
NYSE-listed shares are trading at a price-to-earnings ratio of 9.8 today. Our fair value estimate for the
company is a price-to-earnings ratio of 12. If Scotiabank’s price-to-earnings ratio expands to 12 over
the next five years, this will add 4.1% to its annualized returns. Between dividend payments
(4.1%), earnings growth (8%), and valuation expansion (4.1%), we believe that Scotiabank has the potential to deliver annualized returns of more than 16% moving forward.
Key Statistics, Ratios, & Metrics Reporting Currency: Canadian Dollar Dividend Yield: 4.1%1
Headquarters City: Toronto Dividend History: 35 increases in last 40 years
Headquarters Country: Canada 10-Year Avg. P/E Ratio: 11.5
Stock Exchange: TSX, NYSE Price-To-Earnings Ratio: 9.8
Year Founded: 1832 Market Capitalization: US$67 billion
1 Canada imposes a 15% withholding tax on dividends paid to international shareholders. Excluding this tax, BNS’ yield is 4.8%.
20
Return to Top 10 List
0.00%
1.00%
2.00%
3.00%
4.00%
5.00%
6.00%
7.00%
8.00%
9.00%
10.00%
1999
2000
2001
2002
2003
2004
2005
2006
2007
2008
2009
2010
2011
2012
2013
2014
2015
2016
2017
2018
Bank of Nova Scotia (BNS) Dividend Yield History

21
Return to Top 10 List
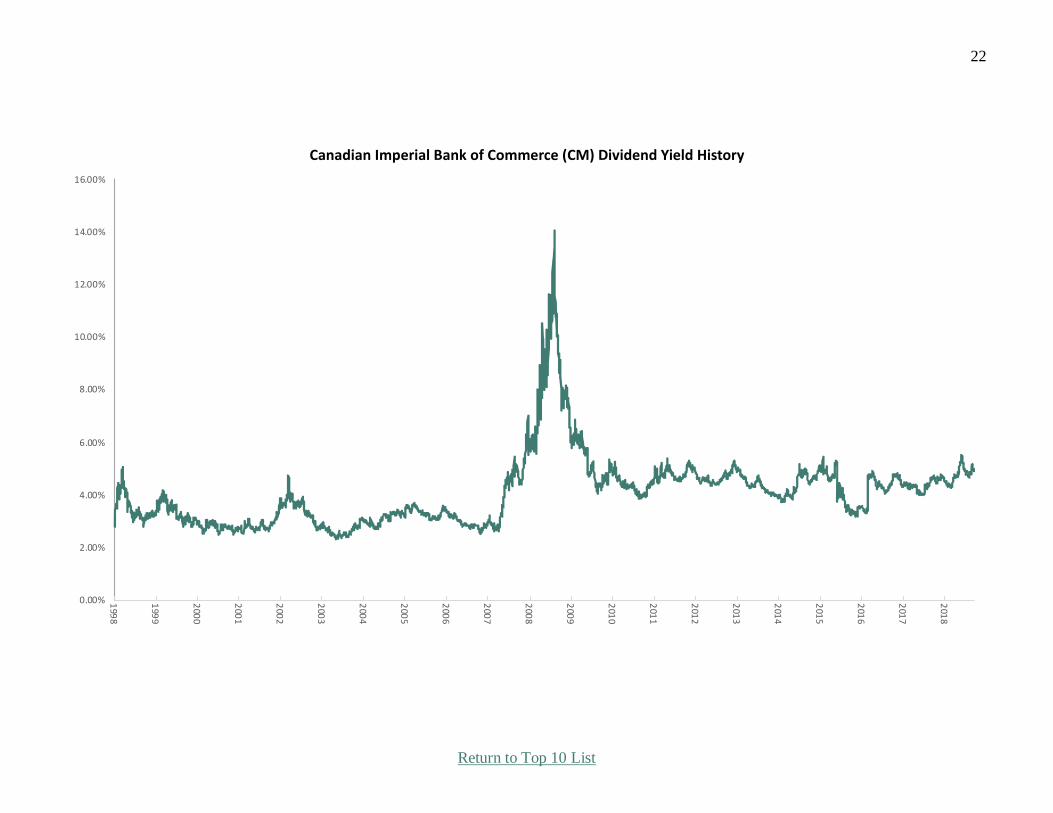
Canadian Imperial Bank of Commerce (CM) Overview & Current Events
The Canadian Imperial Bank of Commerce – hereafter CIBC – is the fifth-largest financial institution in Canada. The company trades on the New York Stock Exchange with a market capitalization of US
$37 billion, and is also listed in Toronto on the TSX with a market capitalization of CAD$49 billion.
CIBC expanded its presence into the United States with the June 2017 acquisition of publicly-traded
PrivateBancorp, which operated as The Private Bank. PrivateBancorp was bought for $5 billion.
CIBC reported its first quarter fiscal 2019 earnings results on February 28. The company announced
that it generated revenues of US$3.46 billion, which was 2.7% more than the revenues that the bank
generated during the previous year’s quarter. CIBC was able to grow its loan portfolio in its personal
and small business banking segment marginally, while deposits rose by 5% year-over-year. Net
interest margin expanded 7bps from 2.35% to 2.42%, which allowed for higher net interest income. CIBC’s commercial banking loan portfolio and its US loan portfolio grew at a faster pace, although
from a lower base compared to the personal/small business banking franchise. CIBC was also able to
lower its operating expenses versus the prior year’s quarter, which allowed for an 8% operating
earnings growth rate. Higher provisions for credit losses offset this growth, though, which is why
earnings-per-share were down to US$2.29 for the quarter. In addition to announcing first quarter financial results, CIBC increased its dividend by 2.9%, to US$1.06.
Growth Prospects & Expected Total Returns
CIBC’s future growth will be driven by its expansion into the United States banking market. While the financial institution was the slowest among the Canadian Big 5 to expand internationally, the
aforementioned US$5.0 billion acquisition of Chicago-based PrivateBancorp – which operates as The
PrivateBank – gives the company a foothold in the critically important U.S. economy. We expect
CIBC to continue its expansion into the United States via both organic growth and bolt-on acquisitions.
We see CIBC generating earnings-per-share of about US$9.48 in fiscal 2019. The bank’s NYSE-listed
shares (CM) currently trade at about $83, which implies a price-to-earnings ratio of 8.8 – lower than
most banks in either the United States or Canada. Our fair value target for CIBC is a price-to-earnings
ratio of 10.5. If the bank’s price-to-earnings ratio were to expand to 10.5 over the next five years, this
would bolster the stock’s annualized returns by just over 3% per year.
CIBC has compounded its adjusted earnings-per-share at 15.6% per year over the last decade, and
9.1% per year over the last 5 years. We see the bank as capable of delivering mid-to-high-single-digit
earnings-per-share growth moving forward. Rising loan balances should drive earnings expansion,
partially offset by a slowly rising share count over time. Combining this 5.5% growth estimate with CIBC’s current yield of 4.3% (after 15% foreign investor withholding tax, outside of a retirement
account) and factoring in the potential for valuation expansion (3.3%), we believe that CIBC is capable
of delivering annualized returns in excess of 13% per year moving forward.
Key Statistics, Ratios, & Metrics Reporting Currency: Canadian Dollar Dividend Yield: 4.3%1
Headquarters City: Toronto Dividend History: Steady or rising since 1868
Headquarters Country: Canada 10-Year Avg. P/E Ratio: 10.5
Stock Exchange: TSX, NYSE Price-To-Earnings Ratio: 8.8
Year Founded: 1867 Market Capitalization: US$36.8 billion
1 Canada imposes a 15% withholding tax on dividends paid to international shareholders. Excluding this tax, CIBC’s yield is 5.1%.
22
Return to Top 10 List
0.00%
2.00%
4.00%
6.00%
8.00%
10.00%
12.00%
14.00%
16.00%
1998
1999
2000
2001
2002
2003
2004
2005
2006
2007
2008
2009
2010
2011
2012
2013
2014
2015
2016
2017
2018
Canadian Imperial Bank of Commerce (CM) Dividend Yield History

23
Return to Top 10 List
Total SA (TOT)
Overview & Current Events Total is an integrated oil and gas company based in France. It was founded in 1924, and today has a
presence in over 130 countries around the world. The company generates annual profits in excess of
US$11 billion, and the stock trades with a market capitalization of US$153 billion. Total produces
more than 2.8 million barrels of oil equivalents per day. As an integrated major, Total is engaged in all
aspects of the oil and gas industry, including exploration and production, transportation and storage, refining, chemicals, and marketing.
In early February, Total reported (2/7/19) financial results for the fourth quarter of fiscal 2018. Total managed 6% earnings-per-share growth for the quarter, despite the fact that its average Brent crude oil
price was roughly flat. Instead, the biggest contributor to Total’s earnings growth was a 10% increase
in production. This impressive output growth resulted from start-ups and ramp-ups of new projects,
which more than offset the 4% natural decline of oil fields. Production for 2018 increased 8% from
2017 levels, reaching a record 2.8 million barrels per day. For the full year, Total grew earnings-per-share by 23%, to US$5.05. Project ramp-ups are expected to continue this year, leading to expectations
of 9% production growth for 2019.
Growth, Competitive Advantages, and Total Returns
As a major oil and gas producer, Total’s primary growth catalyst is higher commodity prices. A
supportive oil price is critical for Total’s bottom line. The worst years for Total have occurred when
oil and gas prices declined, such as 2014-2016 when Total’s earnings-per-share declined by 55% due to
falling commodity prices. Another catalyst for Total is its impressive production growth. Total’s 8% production growth last year and guidance for 9% production growth in 2019 are far ahead of its major
U.S. competitors, Exxon Mobil and Chevron. Recent project ramp-ups include the Egina field in
Nigeria, Ichthys LNG in Australia, and the third liquefaction train of Yamal LNG in Russia.
Total has numerous competitive advantages, primarily its size and global presence. Total is the fourth
largest integrated oil and gas company in the world. With its immense financial resources, Total spent
more than US$14 billion on organic investments last year to find and develop new projects that are
critical to the company’s growth. Total is a repeat recommendation in this newsletter because the stock remains undervalued.
Total is expected to generate earnings-per-share of US$5.20 in 2019. Based on this, the stock has a price-to-earnings ratio of 10.9, which is below our fair value estimate of 11.9. Expansion of the
valuation multiple could fuel 1.7% annual returns if mean reversion occurred over a five-year holding
period. In addition, Total has an expected annual dividend payout of US$3.10 per share for 2019,
resulting in an after-tax yield of 3.9%. The combination of valuation changes, dividends, and expected
earnings growth of 7% per year result in total expected returns of 12.6% per year through 2024.
Key Statistics, Ratios, & Metrics
Reporting Currency: Euro Dividend Yield: 3.9%1
Headquarters City: Courbevoie Dividend History: Steady or rising since 1982
Headquarters Country: France 10-Year Average P/E: 12.2
Stock Exchange: Euronext & NYSE Price-to-Earnings Ratio: 10.9
Year Founded: 1924 Market Capitalization: US $151 billion
1 France imposes a 30% withholding tax. Excluding this withholding tax, the dividend yield would be 5.4%.

24
Return to Top 10 List
0.00%
1.00%
2.00%
3.00%
4.00%
5.00%
6.00%
7.00%
8.00%
9.00%
10.00%
1993
1994
1995
1996
1997
1998
1999
2000
2001
2002
2003
2004
2005
2006
2007
2008
2009
2010
2011
2012
2013
2014
2015
2016
2017
2018
Total SA (TOT) Dividend Yield History
25
Closing Thoughts - The Long-Term Performance of
International Stocks -
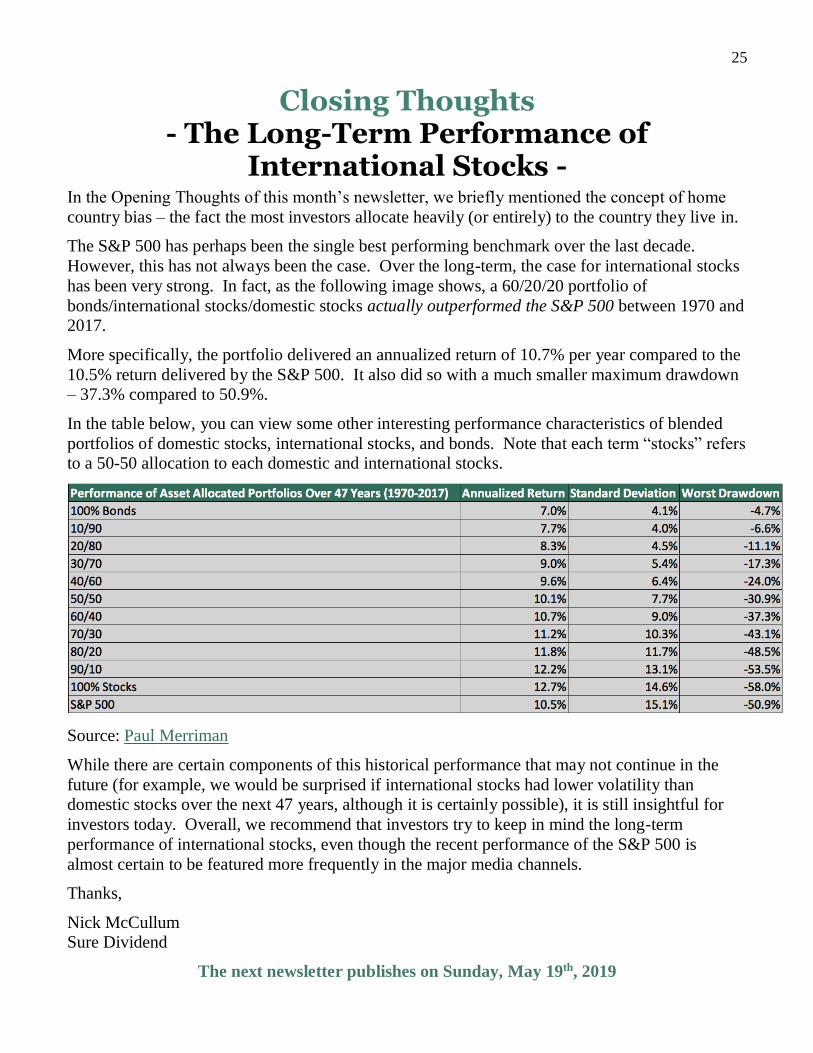
In the Opening Thoughts of this month’s newsletter, we briefly mentioned the concept of home
country bias – the fact the most investors allocate heavily (or entirely) to the country they live in.
The S&P 500 has perhaps been the single best performing benchmark over the last decade.
However, this has not always been the case. Over the long-term, the case for international stocks
has been very strong. In fact, as the following image shows, a 60/20/20 portfolio of
bonds/international stocks/domestic stocks actually outperformed the S&P 500 between 1970 and 2017.
More specifically, the portfolio delivered an annualized return of 10.7% per year compared to the
10.5% return delivered by the S&P 500. It also did so with a much smaller maximum drawdown – 37.3% compared to 50.9%.
In the table below, you can view some other interesting performance characteristics of blended
portfolios of domestic stocks, international stocks, and bonds. Note that each term “stocks” refers to a 50-50 allocation to each domestic and international stocks.
Source: Paul Merriman
While there are certain components of this historical performance that may not continue in the
future (for example, we would be surprised if international stocks had lower volatility than domestic stocks over the next 47 years, although it is certainly possible), it is still insightful for
investors today. Overall, we recommend that investors try to keep in mind the long-term
performance of international stocks, even though the recent performance of the S&P 500 is
almost certain to be featured more frequently in the major media channels.
Thanks,
Nick McCullum Sure Dividend
The next newsletter publishes on Sunday, May 19th, 2019
26
Buying & Ranking Criteria
The method we use to come up with the Top 10 buys for The Sure Dividend International
Newsletter is as follows:
Note: Ranking data is from Wednesday’s Sure Analysis data update.
1. Filter our Sure Analysis Research Database universe of securities for:
- 10%+ Expected total returns
- A & B Dividend Risk Scores
- International securities only (no U.S. securities)
2. Sort by expected total return (highest first). If there are not 10 securities matching
the above, include C Dividend Risk Score securities.
3. Veto any securities from Top 10 as necessary after qualitative analysis, including a
comparison of dividends to cash flows for non-financial securities.
4. The Top 10 is the 10 highest expected total return securities from steps 1 through 3.
5. “A” Dividend Risk Score securities rank ahead of “B” Dividend Risk Score
securities which in turn rank ahead of “C” securities within the Top 10.
To receive an “A” Dividend Risk Score, a security must be in the top 20% for dividend
safety. To receive a “B” Dividend Risk Score, a security must be in the top 40% for
dividend safety. The formula for the Dividend Risk Score is below:
Dividend Risk Score (Raw) = Payout Ratio x 100 – # Years of Steady or Rising Dividends + 50 if
deemed risky during a recession
We view securities with A and B Dividend Risk Scores as generally having secure
dividends that are very unlikely to be reduced in the near future. Securities with C
Dividend Risk Scores also appear generally safe, but don’t have quite as high of a margin
of safety as A or B ranked Dividend Risk Score securities.
Our formula for expected total return is calculated as the sum of 5-year expected returns
from growth on a per share basis, 5-year expected returns from valuation multiple changes,
and the current dividend yield.
The combination of expected total returns and low dividend risk creates a screen to find
high-quality dividend growth securities outside of the U.S. with strong return potential.
Note that our expected total returns are based on the idea that the global economy will
continue forward ‘as is’ for the foreseeable future, and not enter a recession.
Recessions do happen, of course, and we seek to recommend securities likely to pay steady
or rising dividends even during recessions. Recession safety does factor into our Dividend
Risk Scores, and in turn, our rankings for The Sure Dividend Newsletter.

27
Past Recommendations & Sells
The Sure Dividend International Newsletter runs entirely on data from The Sure Analysis Research
Database as of the October 2018 edition and onwards. Due to this change, we are tracking
recommendations from October 2018 and forward. For recommendations prior to this date, please see the
September 2018 Sure Dividend International Newsletter’s performance page. We will still track all
historical recommendations for sells as they occur.
Sell Rules Sell Rule #1, Dividend & Risk Sell Rules: International securities often don’t increase their dividend
payments in regular intervals. Especially in Europe, dividends are paid out more often as a percentage of
total profit. This makes selling due to a dividend reduction ill-advised. We will recommend selling when
a security materially changes its dividend policy for the worse (lower payout), or when we deem that there
is excessive risk in the security relating to future dividend payments.
Sell Rule #2, Total Return & Valuation Based Sell Rules: Any past recommendation with expected
total returns below the expected total returns of Ex-U.S. developed markets of 5.1% over the next 5 to 10
years should be sold1. Past recommendations at or below this sell threshold are bolded and in green
in the Exp. TR column in the table below. We will only recommend up to two valuation-based sells a
month so that the reinvestment of sale proceeds is not concentrated in a short time frame. Only securities
held for longer than 1 year are to be sold due to low expected total returns.
Additionally, we will review past recommendations prior to October 2018 for valuation, dividend risk,
and expected total returns and periodically make sell recommendations. Not all of our Sure Dividend
International Newsletter recommendations prior to October 2018 are in The Sure Analysis Research
Database, so some sell recommendations must be made at our discretion.
Performance is calculated using the closing price on the first trading day after the newsletter publishes.
Returns include dividends.
Current Holds
Name Ticker 1st Rec. Date DR
Score Exp. TR2 Total Return
Micro Focus International MFGP Oct-18 C 19.9% 45.5%
Enbridge ENB Oct-18 C 11.9% 19.2%
Brookfield Renewable Partners BEP Oct-18 F 12.8% 11.7%
Canadian Natural Resources CNQ Oct-18 D 10.4% 11.7%
Autoliv ALV Oct-18 D 7.3% 9.1%
Bank of Nova Scotia BNS Oct-18 C 16.8% 3.6%
Vodafone VOD Oct-18 D 15.9% -0.8%
British American Tobacco BTI Oct-18 D 14.2% -5.0%
WPP WPP Oct-18 F 12.6% -16.5% 1 Long-term total return estimate for Ex-U.S. developed markets is from AQR’s Capital Market Assumptions. 2 Expected total return over the next 5 years.

28
Canon CAJ Nov-18 F 7.0% 3.8%
Total TOT Nov-18 C 13.9% 2.8%
Lazard LAZ Nov-18 F 20.0% 2.0%
Sanofi SNY Nov-18 C 13.6% -8.1%
Brookfield Asset Management BAM Dec-18 A 4.9% 19.6%
Fresenius Medical Care FMS Dec-18 B 11.6% 17.1%
Imperial Oil IMO Dec-18 A 12.5% 13.0%
Siemens SIEGY Dec-18 C 11.0% 10.8%
ABB ABB Dec-18 C 12.6% 9.7%
Infosys INFY Dec-18 A 7.5% 8.8%
Fortis FTS Dec-18 B 10.0% 8.7%
Taiwan Semiconductor TSM Jan-19 C 3.8% 24.8%
Aon AON Jan-19 A 8.7% 14.3%
Chubb CB Jan-19 B 5.9% 6.3%
Vermilion Energy VET Jan-19 D 4.3% 3.3%
Novartis NVS Jan-19 B 13.0% 2.2%
SAP SAP Feb-19 B 10.2% 5.8%
Canadian Imperial Bank CM Feb-19 C 14.1% -1.9%
Canadian Pacific Railway CP Mar-19 A 10.7% 5.0%
Royal Bank of Canada RY Mar-19 C 12.0% 2.6%
National Bank of Canada NTIOF Mar-19 B 10.7% 1.8%
Average recommendation performance (including sells and pending sells): 7.9%
Comparable performance of the Vanguard All-World Ex-US ETF (VEU): 8.4%
Note: Performance should be measured over an absolute minimum period of 3 years. The 6 months of return data above is all but meaningless.
Pending Sells Daimler (DDAIF): We first recommended Daimler in the June 2018 Sure Dividend
International Newsletter. We recommended it in the October 2018 edition as well (after the
switch to Sure Analysis Research Database data and rankings). Since the June and October recommendations, Daimler has generated total returns of -6.8% and 14.9%, respectively. We
issued a pending sell recommendation on Daimler in the February 2019 newsletter because it
reduced its dividend. We recommend selling when it trades for a dividend yield of 5.0%
(currently at 6.7%) or below, which we believe is a reasonable estimate of fair value.
Sold Positions None at this time.

29
Tax Guide
Most foreign countries don’t require you to file a tax return if you hold/held securities from their country. Instead, dividends are withheld ‘at the source.’
You will receive a 1099 statement at year end from your broker. Box 6 will show how much
foreign tax was withheld. In most cases you can get a foreign tax credit.
A tax credit is different from a deduction. Deductions reduce your taxable income, while credits
are a dollar-for-dollar reduction in your taxes owed. You have the option of taking a credit or
deduction. Credits are generally preferable.
The maximum foreign tax credit is equal to the lower of:
1. The tax you would’ve owed if the security was in the U.S.
2. The total amount of foreign tax paid
Additionally, the tax credit cannot be more than:
(Income from foreign sources / Total taxable income) x Total U.S. taxes owed.
IRS form 1116 is used in these calculations, unless foreign dividend taxes are less than $300 (or
$600 filing jointly). In the $300 and below case, you can enter the taxes paid directly onto your
tax return as a tax credit.
If your foreign taxes due are higher than the amount of your would-be U.S. taxes, you can carry
over the extra tax credit for up to 10 years. Note that the credit is against taxes paid. If you aren’t
paying taxes, you can’t use a credit.
Retirement accounts do not accrue U.S. taxes, so you will not get a foreign tax credit if you use
your retirement account to invest in international securities. The exception here is that some
countries have tax treaties with the U.S. that waive foreign dividend taxes for U.S. retirement
accounts.
In addition to dividend taxes, foreign countries may impose capital gains taxes as well. Fewer
countries tax capital gains than dividends, but some do. Of course, the U.S. does tax capital
gains, so you will have to pay the U.S. government any normal capital gains taxes owed.

30
The list below details the tax rates for all parent countries of current and prior Sure Dividend
International recommendations.
Country Dividend Withholding Tax Rate
India 0%
Bermuda 0%
United Kingdom (U.K.) 0%
Singapore 0%
China (Mainland) 10%
Lebanon 10%
Russia 15%
Turkey 15%
Japan 15%
France 15%1 Canada 15%2
Netherlands 15%
Taiwan 21%
South Korea 22% Germany 26%3
Italy 26%
Finland 30%
Sweden 30%
Switzerland 35%
Taxation matters are subject to the individual. While we do our best to present the most accurate
and up-to-date tax information, we recommend that investors speak to a qualified tax expert to
maximize their tax reductions.
1 Additional forms must be filed to get this tax rate (see here for more). 2 0% if the proper paperwork is filed and the investment is in a U.S. retirement account. 3 26% rounded. The actual dividend withholding tax rate is 26.375%.
31
How To Buy International Securities
There are two primary ways to invest in international securities:
1. Through American Depository Receipts (ADRs).
2. Directly from a foreign stock exchange
We recommend ADRs because it can be time consuming and unwieldly to open brokerage
accounts in multiple countries. There is also a convenient available alternative: open a global
trading account with your current broker or a different one that offers this service. Among
brokers who offer international trading are Interactive Brokers, Fidelity, E*Trade, and Charles Schwab. A global trading account also allows purchasing international securities directly (not
with ADRs).
There are three levels of ADRs: Level I: Exempt from full SEC reporting, and they usually trade over-the-counter (OTC)
Level II: Report to the SEC, but can be listed on a major stock exchange
Level III: Same as level II, and the company can use public offerings to raise capital in the U.S.
Our recommendation for investing in international securities is simple. If a level II or III ADR
is available, that is the best way because it is safest. Level I ADRs are riskier because they tend to be relatively illiquid (lower trading volumes) and they don’t have to report fully to the SEC.
Investing in Level II and III ADRs is similar to investing in other publicly traded securities on
large exchanges. In general, you can tell the level of ADR by its ticker. A level II or III ADR will have a ‘normal’ 1 to 4 letter ticker. A level I ADR will have a longer ticker, usually 5 letters.
If only a level I ADR is available, we may still recommend it depending on its volume. Our rule
of thumb is if average daily volume is ~$1 million or more we may recommend the ADR. If the level I ADR is thinly traded, or if no ADR exists, an investor could still invest directly in the
security via that security’s home exchange. As a general rule, never trade more than 5% of a
security’s daily volume. Since other Sure Dividend readers may also be making similar
trades, we would prefer to use 1% of volume as a ‘safe’ level. Depending on your account size,
smaller volumes may also generally be safer.
If volume is not sufficient, we will not recommend buying OTC (Level I) shares. When
purchasing OTC shares, be sure to use limit orders as market orders could potentially be filled at
unsatisfactory prices.
Please email us at [email protected] with any questions you have on the actual process
required to purchase international securities. As a newsletter provider, we can’t provide specific personal investment advice, only general information.