april$20,2010 the$sanandreasfault$infine...
TRANSCRIPT

The San Andreas Fault in finedetail: seismology and rock physics
Eun-‐Sun Chong (ASU)John D. West (ASU)Arizona State UniversityEarthScope Seminar Class
Figures and informaGon referencedfrom various sources.
April 20, 2010
Discussion
1

1. MigraGng tremors illuminate complex deformaGonbeneath the seismogenic San Andreas FaultDavid R. Shelly Nature (2010) Vol. 463 (7281) pp. 648 -‐ 653
Shelly (2010)
Data: ConGnuous seismic datafrom mid-‐2001 to 2008.
Result: Evidence supportsdeep fault shear failure as thebasic mechanism of tremor.Physical condiGon thatcontrols the spaGaldistribuGon of such tremorsremain in quesGon. Fluidpressure in the fault zone atdepth is suggested.
2

Shelly (2010)3
*Lack of legend makes this figure difficult to comprehend.
This figure is said to represent tremormigraGon.a)Extended tremor migraGon episode,approximately 25km along fault strikefor over 90 minutes. 17 km representsaverage propagaGon rate in a givenepisode.b)Three HRSN borehole staGons,waveforms and event family matchesduring the same period.c)Zoomed view of the highest-‐amplitude and fastest-‐migraGngporGon of the sequence.
A lot seems to be said throughdisplay of this figure but veryuncertain on how suchinformaGon was derived.
Event Families?

4
QuesGons:
1. What does it mean when cumulaGve eventsare “normalized”?
2. What do the numbers on that parGcularaxis represent?
Shelly (2010)
3. What is the purpose of this figure?

5
Shelly (2010)
Figure 4. Recurrence paeerns for21 event families.
a) Mid 2001 to 2008. Black dashlines indicate San Simeon andParkfield earthquakes. Gray dashlines indicate when HRSNstaGons experienced operaGonalchanges.
b) Basically a zoomed in versionof (a) with different Gme scale.

Methods
6
1. SelecGon of waveform templates.a. SelecGon of relaGvely strong and isolated events
as templates.b. Used the template that appeared to have the
highest signal-‐to-‐noise raGo.
2. Template event locaGon.a) An absolute locaGon for each template event
based upon P and S wave arrival Gmes of a lowfrequency earthquake with a good signal-‐to-‐noise raGo at permanent and temporarystaGons.
b) A grid search for locaGon of hypocenters with aVp/Vs raGo of 1.78.
3. Event detecGon.a) 20 samples/second, bandpass filtered at 2-‐8 Hz.b) Cross-‐correlaGon at lag increments of one
sample. Measure similarity by correlaGon sumacross all channels and staGons of the network.
c) Fixed correlaGon sum threshold of 4.0 for the 25selected channels, with a maximum of one eventevery 4 seconds.
Cross-‐correlaGon in a mulG-‐channel matched filter.
4. StaGons and components used forconsistent detecGon.a) 10 sets of staGons and channels used to compare
tremor rates over Gme.
5. StaGons used for template event locaGons.a) AddiGonal staGons to constrain the data.b) Four temporary arrays of ten staGons each.c) Six individual three-‐component staGons from the
PBO and HRSN.d) Two addiGonal staGons from the Southern
California Seismic Network to help locatesouthernmost event family.

Key Points
7
oTremor has been idenGfied beneath the strike slip San Andreas fault near Parkfield, California.Tremor locaGons aligned with fault strike and triggering by Gdally induced right lateral shear stressstrongly suggest that San Andreas fault tremor is generated by tectonically driven slip on the deepfault.Similar to subducGon zone tremor.Dominant frequency content of 2-‐8 Hz.
oSeveral advantages over amplitude-‐based analysis of tremor.Ability to idenGfy short duraGon tremor and low amplitude tremor.Shape and Gming of waveforms. Analysis on much shorter spaGal and temporal scales, differenGaGngacGvity on many small patches of the deep fault.DifferenGates between tremor and other seismic signals (alershocks, cultural noise).No need to exclude the Gmes immediately following significant earthquakes.
oSuggesGon of fluid pressure in the fault zone.Possible sources of fluid:
1. A fossil slab2. Subducted sediments proposed to exist near the tremor zone by Trehu et al. (1987)3. SerpenGnite or fluid-‐saturated schist on basis of receiver funcGon study by Ozacar et al. (2009)

2. Tremor-‐Gde correlaGons and near-‐lithostaGc porepressure on the deep San Andreas FaultThomas et al. Nature (2009) vol. 462 (7276) pp. 1048-‐1051
8Thomas et al. (2009)
Data: Catalogue of 1,777 non-‐volcanic tremorsdetected over an eight year period. Regionalcatalogue of earthquakes within 0.5° ofCholame. Another catalogue ofcharacterisGcally repeaGng micro-‐earthquakeslocated along the creeping segment of the SanAndreas fault (NW of Cholame)
Results: Tremor occurs preferenGally whensubjected to Gdal shear stresses that promoteright lateral failure along San Andreas fault. Lowstress perturbaGons from solid-‐Earth Gdes areresponsible for significant tremor rate increasesand effecGve normal stress in the trmor sourceregion is required to explain apparent Gdaltriggering. Capable of producing seismicradiaGon. LithostaGc pore fluids are present inthe tremor source region.
Figure 1. Example one-‐day tremor Gme series withsuperimposed Gdal stresses.
9
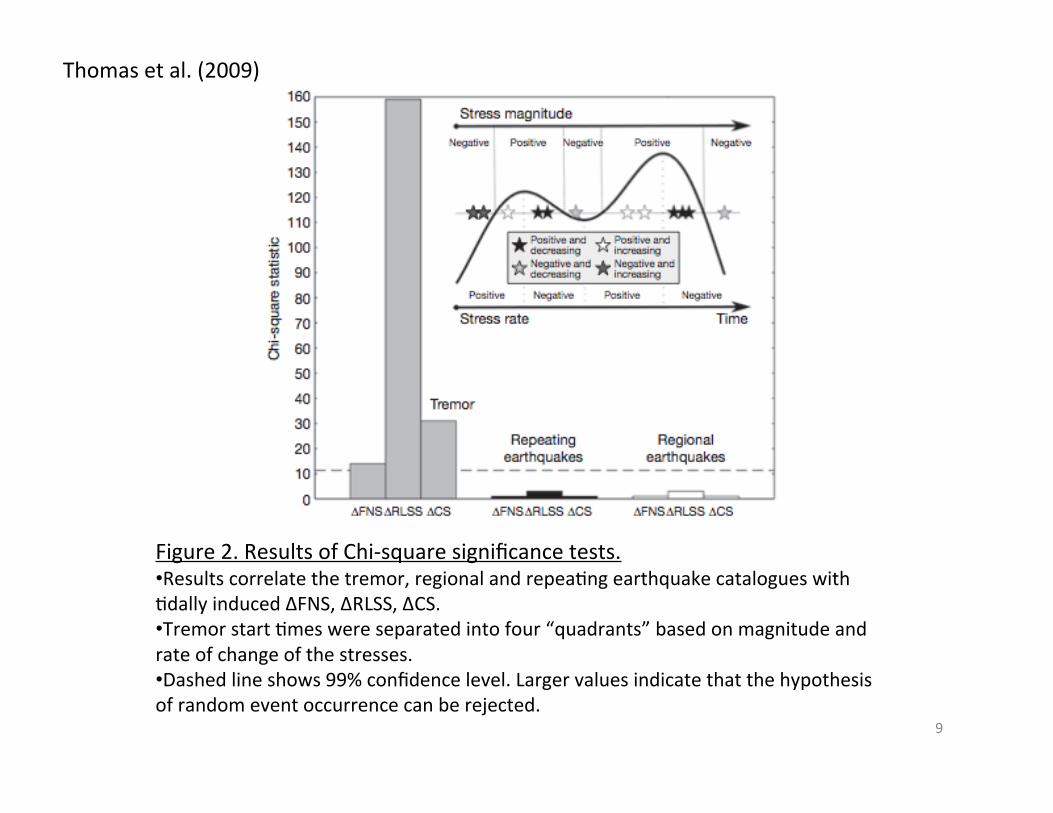
Thomas et al. (2009)
Figure 2. Results of Chi-‐square significance tests.•Results correlate the tremor, regional and repeaGng earthquake catalogues withGdally induced ΔFNS, ΔRLSS, ΔCS.•Tremor start Gmes were separated into four “quadrants” based on magnitude andrate of change of the stresses.•Dashed line shows 99% confidence level. Larger values indicate that the hypothesisof random event occurrence can be rejected.

10
Thomas et al. (2009)Most compelling correlaGon
Figure 3. Tidal stress magnitude and rate distribuGons.
Most compelling correlaGon because disGnct increases intremor acGvity that correspond to posiGve right lateralshear stresses parallel to the San Andreas fault andequally apparent decreases when values are negaGve.

11
Figure 4. Percentage of excess events versusfricGon coefficient.
Above long term average during Gmes of posiGve ΔCSversus effecGve coefficient of fricGon.
σ = EffecGve normal stress = 0.035 to 0.009 MPa
τ = Shear stress = 177 Pa for maximum Gdalinduced shear stress
a = rate consGtuGve parameter = 0.005 to0.02
Ra = (Rmax – Rmin)/Ravg
EffecGve normal stress is found to be0.035 to 0.009 Mpa. These values areorders of magnitude lower than thelithostaGc overburden pressure at givendepth, suggesGng that lithostaGc porefluids are present in the tremor sourceregion.

Methods
12
1. Event Catalogues• 1,777 events between July 2001 to May
2008 using detecGon methodology.• Tidal stress Gme series were computed for
Cholame only.• RepeaGng earthquake catalogue constains
2,594 events between 1984 and 1999 onthe creeping secGon of San Andreas fault.
• Regional earthquake catalogue consists ofall earthquakes from the Advanced NaGonalSeismic System catalogue between July2001 to May 2008.
2. Tidal Stress CalculaGon• Tidally induced stresses in the lithosphere
were computed using SPOTL code byAgnew.
• Green’s funcGons to compute azimuthal andverGcal strains that can be converted tostress.
• Tidal model predicGons were comparedwith strainmeter records in Pinon Flat usingperturbaGon matrix.
3. StaGsGcal Methods• Pearson’s Chi-‐square test is designed to
test the similarity between two frequencydistrubiGons knowns as chi-‐squaredstaGsGc.
4. Uncertainty esGmates from Fig 3.• Two-‐standard-‐deviaGon error esGmates
are determined using a bootstrapmethod.
• Randomly selects an individual tremorfrom the original tremor catalogue.Repeated 1,777 Gmes for random sample.
• Above process repeated 50 Gmes for 50random versions of the original catalogue.
• Tremor rate distribuGons as a funcGon ofthe Gdally induced stresses are thencalculated for each of the 50 randomlysampled catalogues
• MulGplied by 2.• Errors arise from variability in tremor
detecGon sensiGvity.

Key Points
13
1. The lack of correlaGon in the regional and repeaGng earthquake catalogues is not surprisinggiven the size of the catalogues and results from previous efforts to establish a significantGdal triggering of earthquakes.
2. Couloumb stresses exhibit less correlaGon than the shear stress alone.
3. Assuming a fricGonal Coulomb failure process is an appropriate model for non-‐volcanictremor, the opGmal fricGon coefficient is the value that maximizes the number of eventsthat occur during Gmes of encouraged failure stress.
4. Tremor appears to be associated with the presence of fluids at near-‐lithostaGc pressures,and given similar observaGons in variable tectonic environments, the same mechanism isprobably responsible for non-‐volcanic tremor elsewhere.

3. FricGonal behavior of materials inthe 3D SAFOD volume
Carpenter et al. Geophysical Research Leeers (2009) vol. 36 (5) pp. L05302
14
Data:
Outcrop samples of lithologies thought to comprise andabut the fault zone at depth on the basis of:1.Detailed geologic cross secGons for the SAFOD sites.2.Published geologic maps3.Cuwngs retrieved during SAFOD Phase I and II drilling.
Samples included:1.Natural serpenGnite from New Idria Mine2.Granodiorite from Phase I3.Arkosic metasandstone from Phase I4.Siltstone from Phase II
Results:
1.SerpenGnite exihibits low strength but is not weak enoughto completely saGsfy weak falut models.2.All other samples are consistent with a strong fault andcrust.3.If the fault is weak (μ<0.2) due to the presence ofserpenGnite or talk, these minerals would likely need toconsGtute over 50% by weight of the shear zone.
Purpose: To resolve following
1.Debate concerning the absolute strength of the San Andreas Fault.2.Controls on the stability of fricGonal sliding.

Methods
15
1. Rock and core samples were crushed in a roll crusher in a shaeer box to a grain size of<125μm.
2. Samples were sheared in layers 3 to 5 mm thick constructed by pouring and smoothing theexperimental gouge onto grooved, steel forcing blocks.
3. Conducted shearing experiments in double direct shear in a true triaxial pressure vessel.Stresses are same and nominal contact area remains constant at 0.025m2.
4. Constant normal stress is applied and maintained by a hydraulic servo-‐control system.5. Displacing the center block between the two staGonary side blocks causes shear.6. Forces are measured with strain gauge load cells to ±5 N, and verGcal and horizontal
displacements are measured by DCDTs to ±0.1μm.7. Recorded data conGnuously at 10kHz and averaged to values ranging from 1 Hz to 1kHz
depending on shearing velocity.8. Stable shear fabric in the layer was established to aeain steady-‐state fricGon. Used 5mm
shear displacement ‘run in’ in the beginning of all experiments.9. Coulomb failure envelope and fricGon consGtuGve properGes under a variety of stresses
using normal stress stepping procedure.