apru – 2013tuesday oct 29 multi-hazard loss estimations using socioeconomic data j.r....
TRANSCRIPT

Tuesday Oct 29APRU – 2013
Multi-Hazard Loss Estimations Using Socioeconomic Data
J.R. Holliday* J.B. Rundle
University of California, Davis
1 / 115

Tuesday Oct 29APRU – 2013
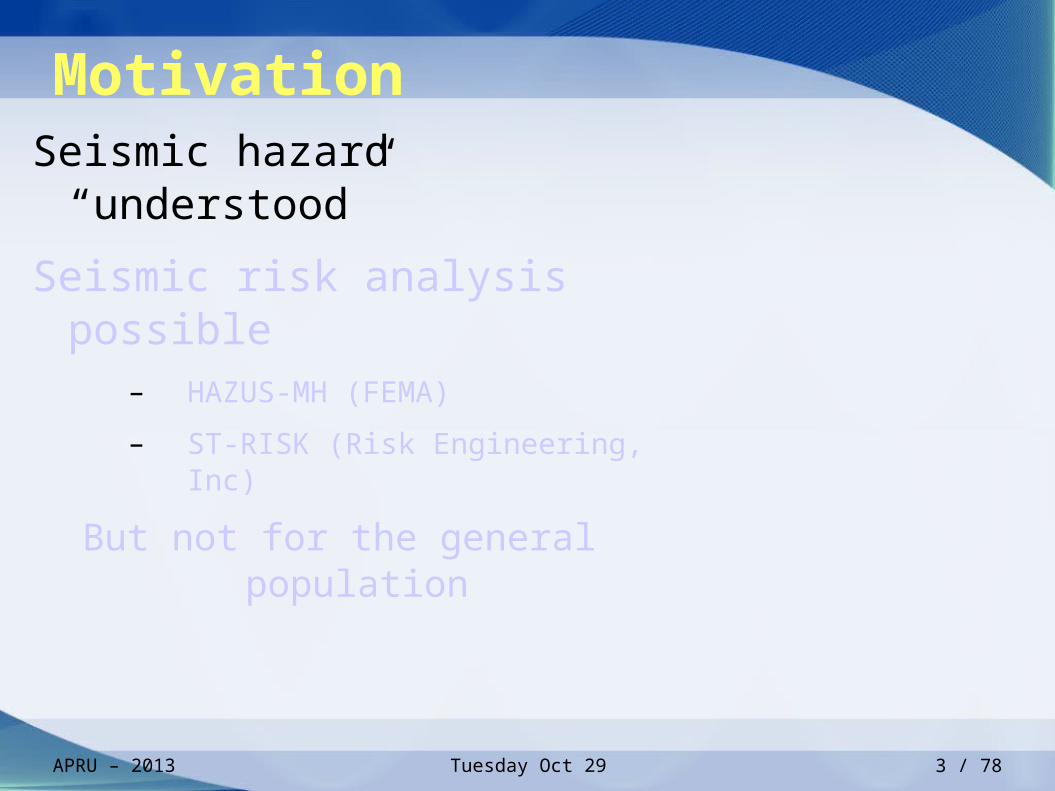
MotivationSeismic hazard “understood”
Seismic risk analysis possible– HAZUS-MH (FEMA)
– ST-RISK (Risk Engineering, Inc)
But not for the general population
2 / 78
Tuesday Oct 29APRU – 2013
MotivationSeismic hazard “understood”
Seismic risk analysis possible– HAZUS-MH (FEMA)
– ST-RISK (Risk Engineering, Inc)
But not for the general population
3 / 78

Tuesday Oct 29APRU – 2013
MotivationSeismic hazard “understood”
Seismic risk analysis possible– HAZUS-MH (FEMA)
– ST-RISK (Risk Engineering, Inc)
But not for the general population
4 / 78

Tuesday Oct 29APRU – 2013
MotivationSeismic hazard “understood”
Seismic risk analysis possible– HAZUS-MH (FEMA)
– ST-RISK (Risk Engineering, Inc)
But not for the general population
5 / 78

Tuesday Oct 29APRU – 2013
MotivationSeismic hazard “understood”
Seismic risk analysis possible– HAZUS-MH (FEMA)
– ST-RISK (Risk Engineering, Inc)
But not for the general population
6 / 78

Tuesday Oct 29APRU – 2013
MotivationSeismic hazard “understood”
Seismic risk analysis possible– HAZUS-MH (FEMA)
– ST-RISK (Risk Engineering, Inc)
But not for the general population
7 / 78
Tuesday Oct 29APRU – 2013
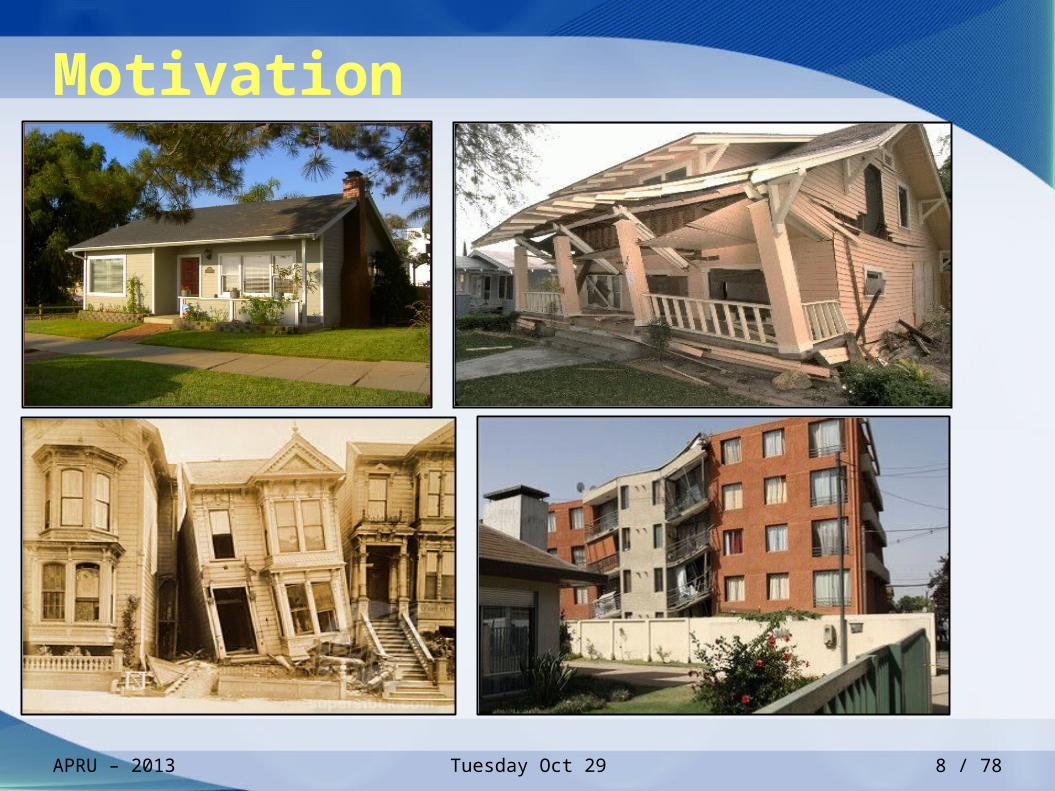
Motivation
8 / 78

Tuesday Oct 29APRU – 2013
Earthquake Forecasts
• USA: USGS
– Uniform California Earthquake Rupture Forecast (UCERF)
– “24-Hour Aftershock Forecast Map”
– 2009 Earthquake Probability Mapping
– http://www.openhazards.com/
• World: CSEP
– Regional Earthquake Likelihood Models (RELM)
– Beyond RELM
– http://www.openhazards.com/
9 / 78

Tuesday Oct 29APRU – 2013
Earthquake Forecasts
• USA: USGS
– Uniform California Earthquake Rupture Forecast (UCERF)
– “24-Hour Aftershock Forecast Map”
– 2009 Earthquake Probability Mapping
– http://www.openhazards.com/
• World: CSEP
– Regional Earthquake Likelihood Models (RELM)
– Beyond RELM
– http://www.openhazards.com/
10 / 78

Tuesday Oct 29APRU – 2013
Earthquake Forecasts
• USA: USGS
– Uniform California Earthquake Rupture Forecast (UCERF)
– “24-Hour Aftershock Forecast Map”
– 2009 Earthquake Probability Mapping
– http://www.openhazards.com/
• World: CSEP
– Regional Earthquake Likelihood Models (RELM)
– Beyond RELM
– http://www.openhazards.com/
11 / 78
Tuesday Oct 29APRU – 2013
Earthquake Forecasts
• USA: USGS
– Uniform California Earthquake Rupture Forecast (UCERF)
– “24-Hour Aftershock Forecast Map”
– 2009 Earthquake Probability Mapping
– http://www.openhazards.com/
• World: CSEP
– Regional Earthquake Likelihood Models (RELM)
– Beyond RELM
– http://www.openhazards.com/
12 / 78

Tuesday Oct 29APRU – 2013
Earthquake Forecasts
• USA: USGS
– Uniform California Earthquake Rupture Forecast (UCERF)
– “24-Hour Aftershock Forecast Map”
– 2009 Earthquake Probability Mapping
– http://www.openhazards.com/
• World: CSEP
– Regional Earthquake Likelihood Models (RELM)
– Beyond RELM
– http://www.openhazards.com/
13 / 78

Tuesday Oct 29APRU – 2013
Ground Shaking
• Full propagation methods
– OpenSHA
– CyberShake
• Simple propagation approximations
14 / 78

Tuesday Oct 29APRU – 2013
Ground Shaking
• Full propagation methods
– OpenSHA
– CyberShake
• Simple propagation approximations
15 / 78

Tuesday Oct 29APRU – 2013
Ground Shaking
• Full propagation methods
– OpenSHA
– CyberShake
• Simple propagation approximations
16 / 78

Tuesday Oct 29APRU – 2013
Ground Shaking
• Full propagation methods
– OpenSHA
– CyberShake
• Simple propagation approximations
17 / 78

Tuesday Oct 29APRU – 2013
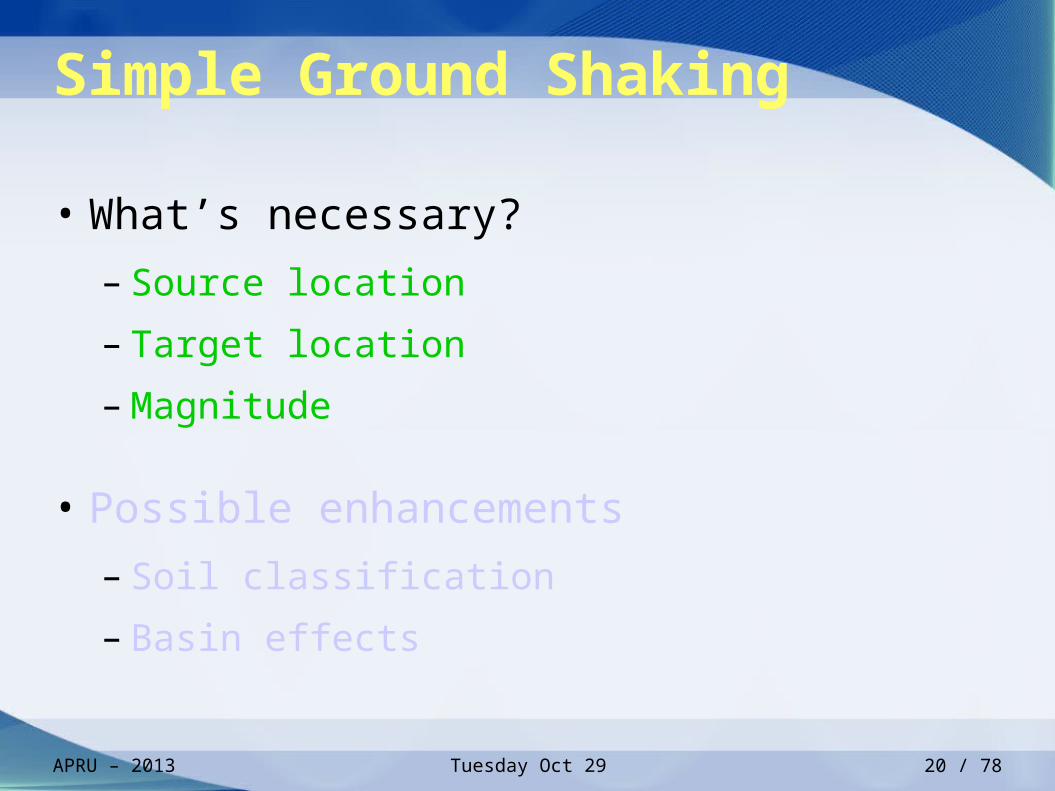
Simple Ground Shaking
• What’s necessary?
– Source location
– Target location
– Magnitude
• Possible enhancements
– Soil classification
– Basin effects
18 / 78
Tuesday Oct 29APRU – 2013
Simple Ground Shaking
• What’s necessary?
– Source location
– Target location
– Magnitude
• Possible enhancements
– Soil classification
– Basin effects
19 / 78
Tuesday Oct 29APRU – 2013
Simple Ground Shaking
• What’s necessary?
– Source location
– Target location
– Magnitude
• Possible enhancements
– Soil classification
– Basin effects
20 / 78

Tuesday Oct 29APRU – 2013
Simple Ground Shaking
• What’s necessary?
– Source location
– Target location
– Magnitude
• Possible enhancements
– Soil classification
– Basin effects
21 / 78

Tuesday Oct 29APRU – 2013
Simple Ground Shaking
• What’s necessary?
– Source location
– Target location
– Magnitude
• Possible enhancements
– Soil classification
– Basin effects
22 / 78

Tuesday Oct 29APRU – 2013
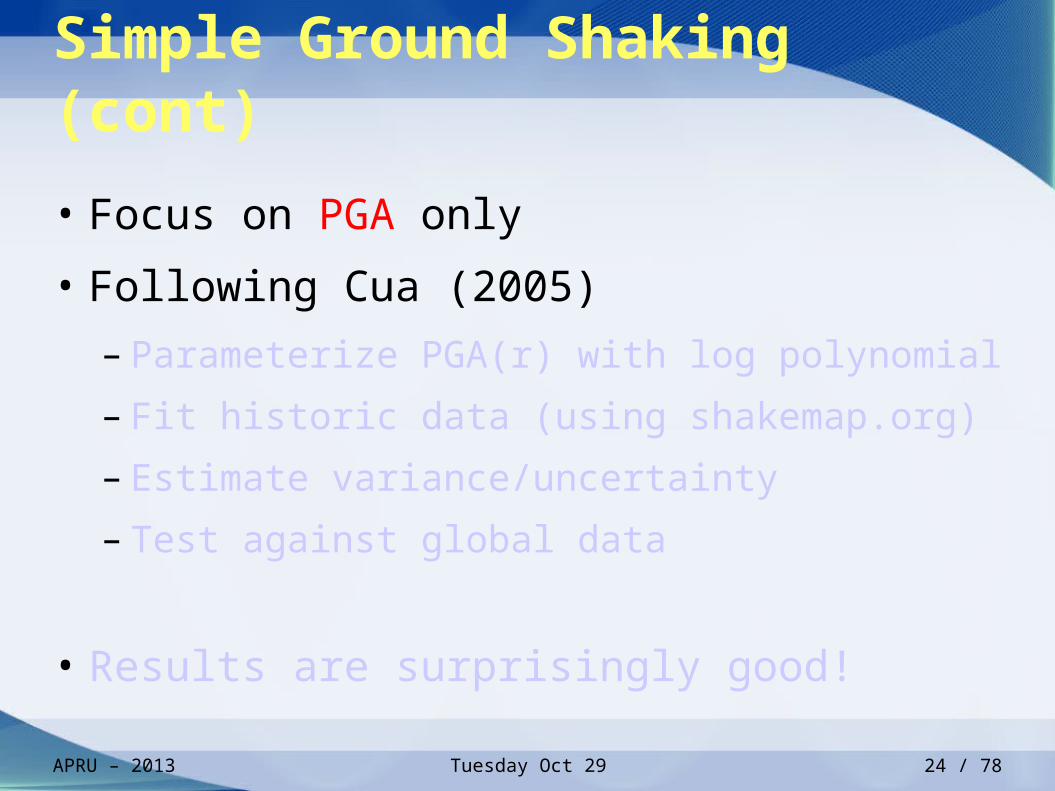
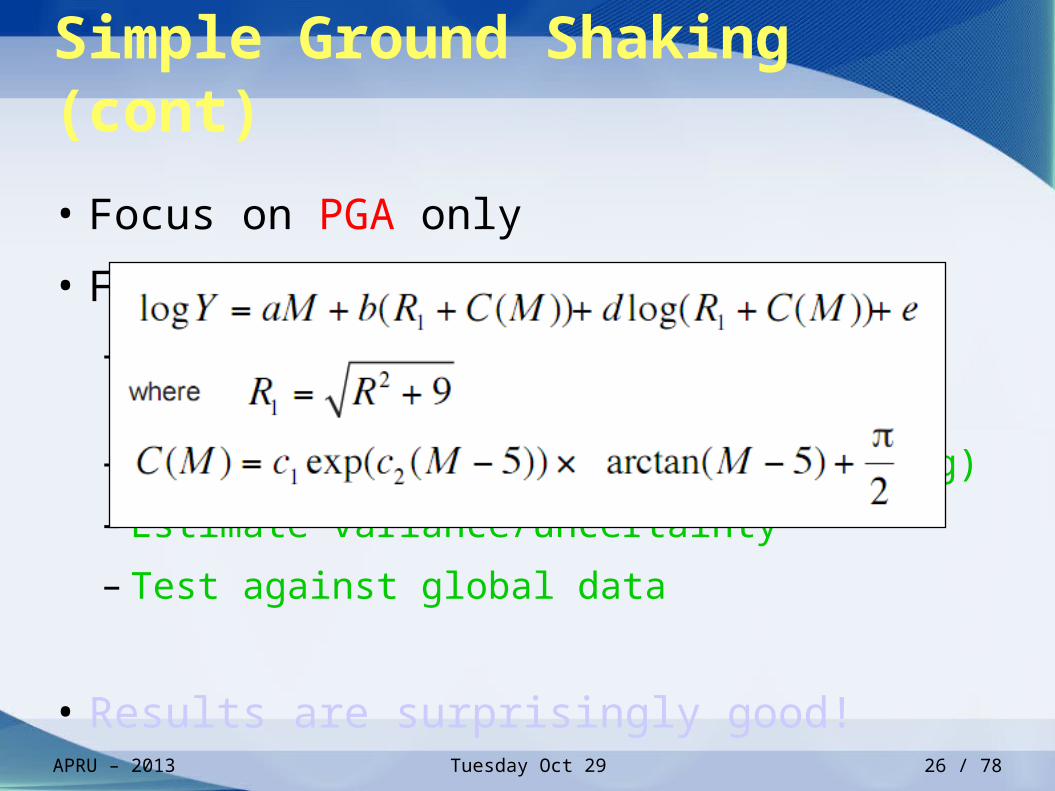
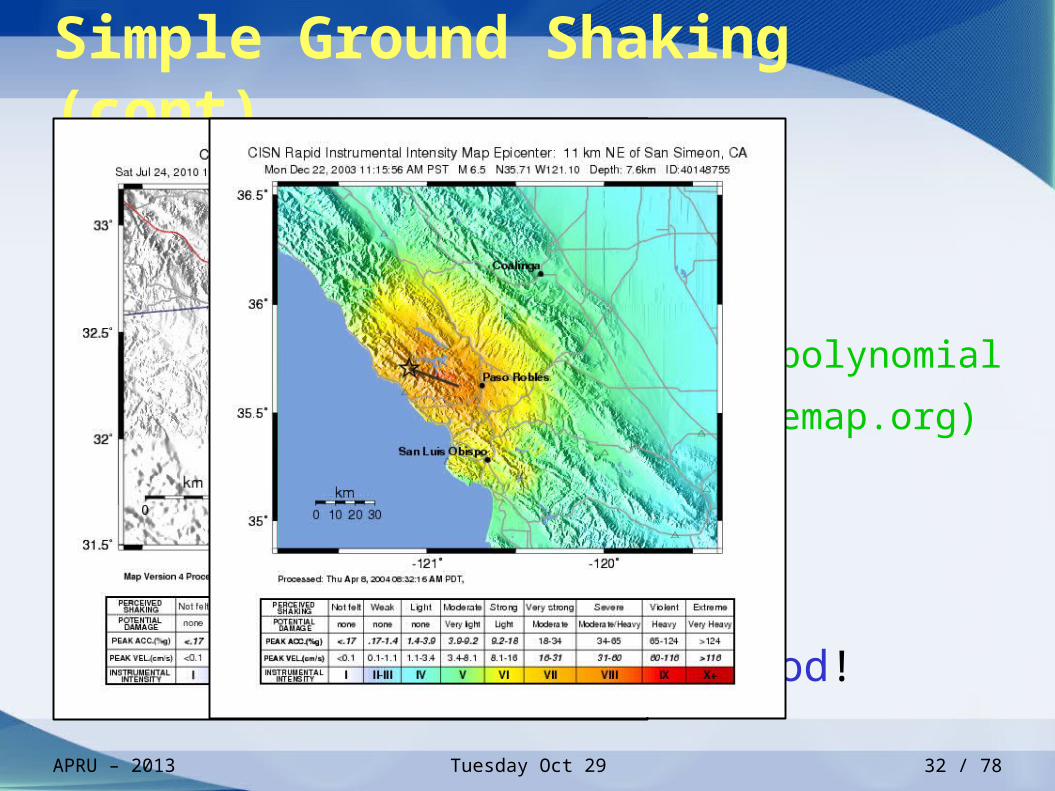
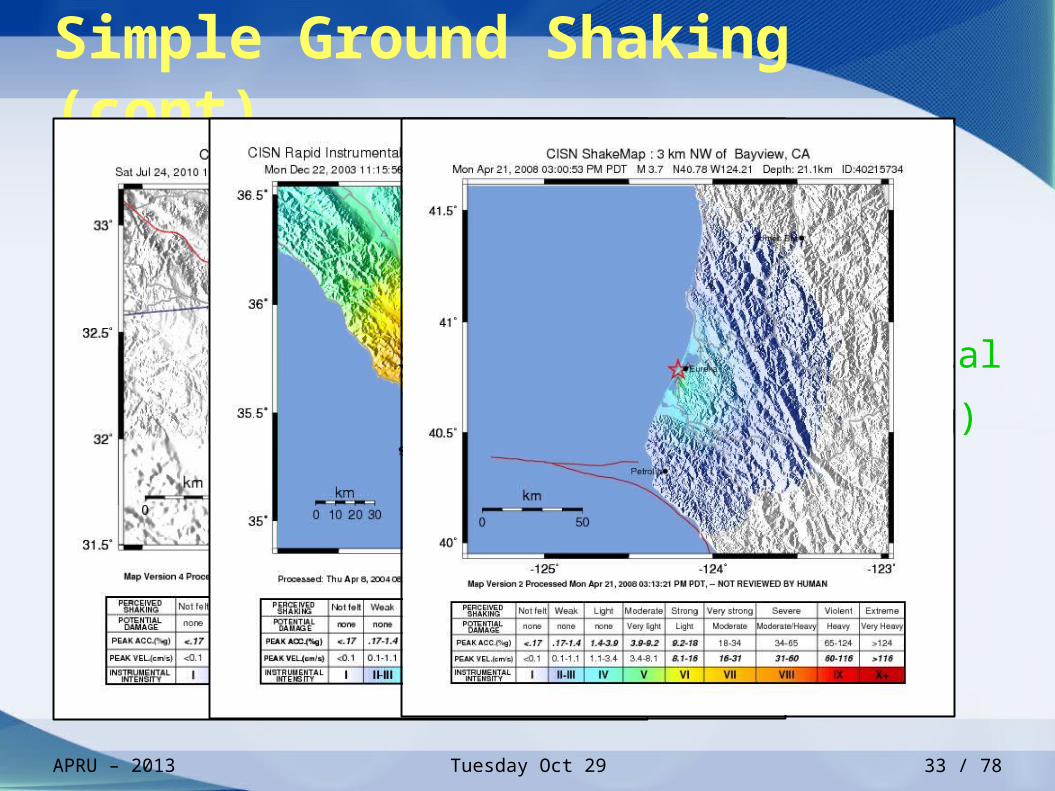
Simple Ground Shaking (cont)
• Focus on PGA only
• Following Cua (2005)
– Parameterize PGA(r) with log polynomial
– Fit historic data (using shakemap.org)
– Estimate variance/uncertainty
– Test against global data
• Results are surprisingly good!
23 / 78
Tuesday Oct 29APRU – 2013
Simple Ground Shaking (cont)
• Focus on PGA only
• Following Cua (2005)
– Parameterize PGA(r) with log polynomial
– Fit historic data (using shakemap.org)
– Estimate variance/uncertainty
– Test against global data
• Results are surprisingly good!
24 / 78

Tuesday Oct 29APRU – 2013
Simple Ground Shaking (cont)
• Focus on PGA only
• Following Cua (2005)
– Parameterize PGA(r) with log polynomial
– Fit historic data (using shakemap.org)
– Estimate variance/uncertainty
– Test against global data
• Results are surprisingly good!
25 / 78
Tuesday Oct 29APRU – 2013
Simple Ground Shaking (cont)
• Focus on PGA only
• Following Cua (2005)
– Parameterize PGA(r) with 4th order polynomial
– Fit historic data (using shakemap.org)
– Estimate variance/uncertainty
– Test against global data
• Results are surprisingly good!
26 / 78

Tuesday Oct 29APRU – 2013
Simple Ground Shaking (cont)
• Focus on PGA only
• Following Cua (2005)
– Parameterize PGA(r) with log polynomial
– Fit historic data (using shakemap.org)
– Estimate variance/uncertainty
– Test against global data
• Results are surprisingly good!
27 / 78

Tuesday Oct 29APRU – 2013
Simple Ground Shaking (cont)
• Focus on PGA only
• Following Cua (2005)
– Parameterize PGA(r) with 4th order polynomial
– Fit historic data (using shakemap.org)
– Estimate variance/uncertainty
– Test against global data
• Results are surprisingly good!
28 / 78
Tuesday Oct 29APRU – 2013
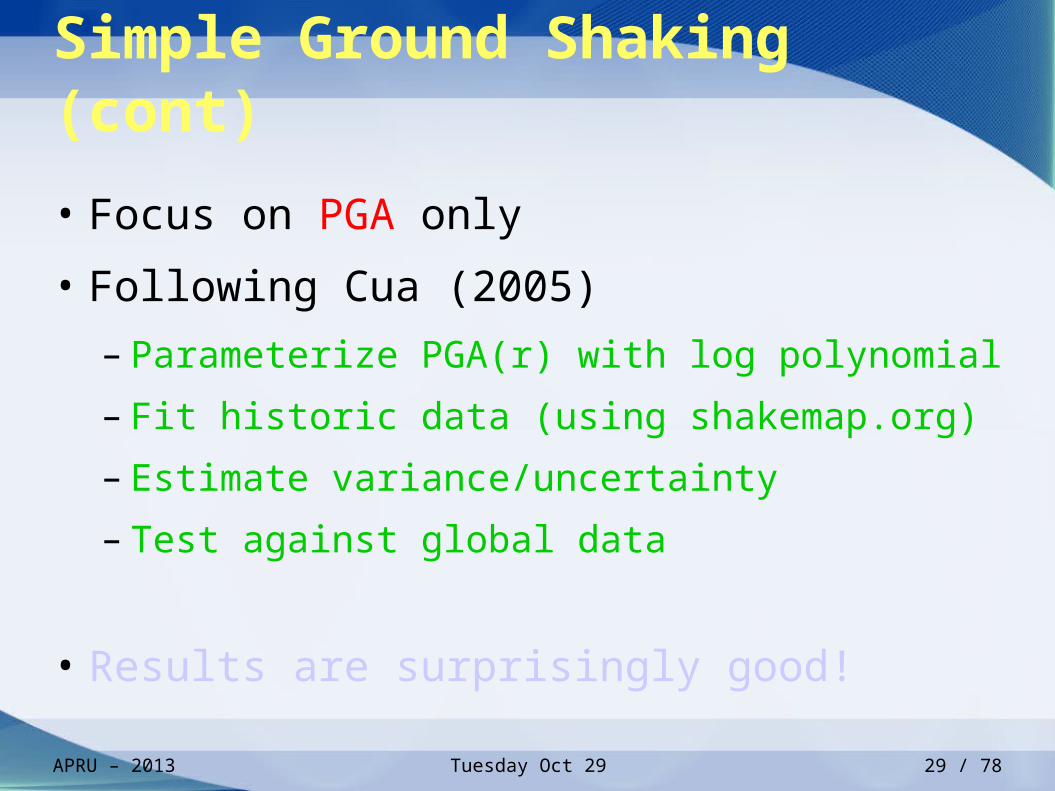
Simple Ground Shaking (cont)
• Focus on PGA only
• Following Cua (2005)
– Parameterize PGA(r) with log polynomial
– Fit historic data (using shakemap.org)
– Estimate variance/uncertainty
– Test against global data
• Results are surprisingly good!
29 / 78

Tuesday Oct 29APRU – 2013
Simple Ground Shaking (cont)
• Focus on PGA only
• Following Cua (2005)
– Parameterize PGA(r) with log polynomial
– Fit historic data (using shakemap.org)
– Estimate variance/uncertainty
– Test against global data
• Results are surprisingly good!
30 / 78

Tuesday Oct 29APRU – 2013
Simple Ground Shaking (cont)
• Focus on PGA only
• Following Cua (2005)
– Parameterize PGA(r) with log polynomial
– Fit historic data (using shakemap.org)
– Estimate variance/uncertainty
– Test against global data
• Results are surprisingly good!
31 / 78
Tuesday Oct 29APRU – 2013
Simple Ground Shaking (cont)
• Focus on PGA only
• Following Cua (2005)
– Parameterize PGA(r) with log polynomial
– Fit historic data (using shakemap.org)
– Estimate variance/uncertainty
– Test against global data
• Results are surprisingly good!
32 / 78
Tuesday Oct 29APRU – 2013
Simple Ground Shaking (cont)
• Focus on PGA only
• Following Cua (2005)
– Parameterize PGA(r) with log polynomial
– Fit historic data (using shakemap.org)
– Estimate variance/uncertainty
– Test against global data
• Results are surprisingly good!
33 / 78
Tuesday Oct 29APRU – 2013
Simple Ground Shaking (cont)
• Focus on PGA only
• Following Cua (2005)
– Parameterize PGA(r) with log polynomial
– Fit historic data (using shakemap.org)
– Estimate variance/uncertainty
– Test against global data
• Results are surprisingly good!
34 / 78

Tuesday Oct 29APRU – 2013
Building Response
• Given PGA, how much damage will occur?
• How do we describe the building?
Building frame Wall type
Floor plan Square footage
Number of levels Chimney
Attached garage Wall anchors
Foundation type Year of construction
• Which of these are necessary?
35 / 78

Tuesday Oct 29APRU – 2013
Building Response
• Given PGA, how much damage will occur?
• How do we describe the building?
Building frame Wall type
Floor plan Square footage
Number of levels Chimney
Attached garage Wall anchors
Foundation type Year of construction
• Which of these are necessary?
36 / 78

Tuesday Oct 29APRU – 2013
Building Response
• Given PGA, how much damage will occur?
• How do we describe the building?
Building frame Wall type
Floor plan Square footage
Number of levels Chimney
Attached garage Wall anchors
Foundation type Year of construction
• Which of these are necessary?
37 / 78

Tuesday Oct 29APRU – 2013
Building Response
• Given PGA, how much damage will occur?
• How do we describe the building?
Building frame Wall type
Floor plan Square footage
Number of levels Chimney
Attached garage Wall anchors
Foundation type Year of construction
• Which of these are necessary?
38 / 78

Tuesday Oct 29APRU – 2013
Building Response
• Given PGA, how much damage will occur?
• How do we describe the building?
Building frame Wall type
Floor plan Square footage
Number of levels Chimney
Attached garage Wall anchors
Foundation type Year of construction
• Which of these are necessary?
39 / 78

Tuesday Oct 29APRU – 2013
Building Response
• Given PGA, how much damage will occur?
• How do we describe the building?
Building frame Wall type
Floor plan Square footage
Number of levels Chimney
Attached garage Wall anchors
Foundation type Year of construction
• Which of these are necessary?
40 / 78

Tuesday Oct 29APRU – 2013
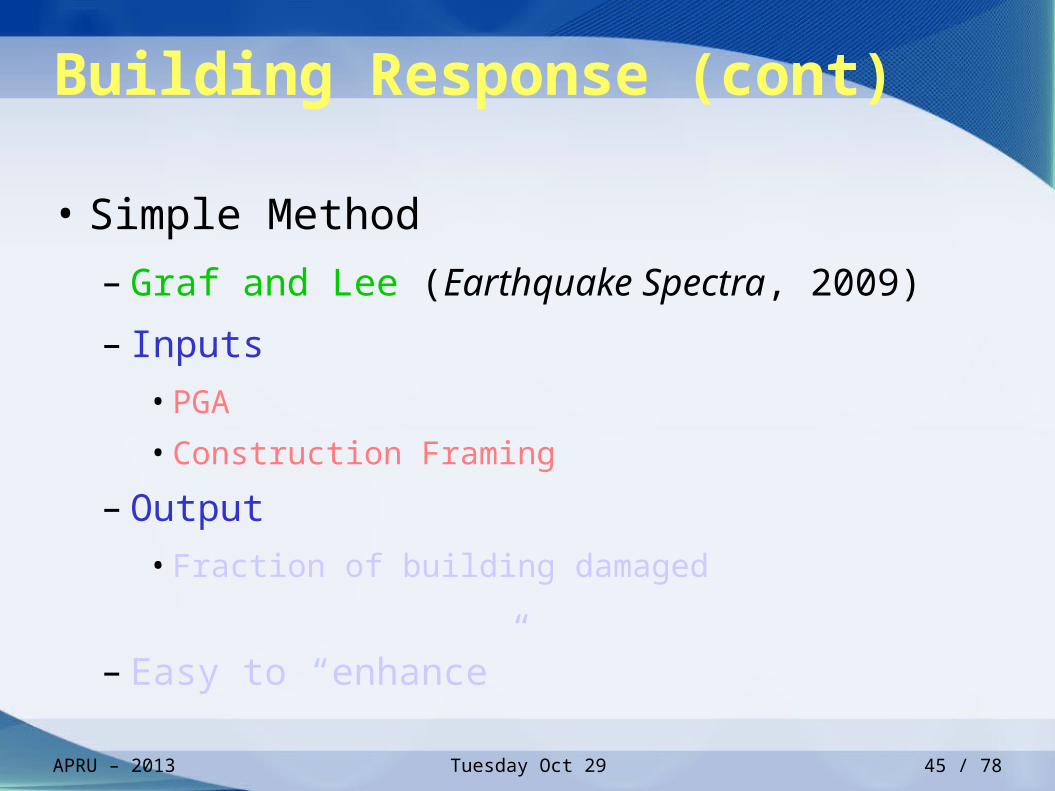
Building Response (cont)
• Simple Method
– Graf and Lee (Earthquake Spectra, 2009)
– Inputs
• PGA
• Construction Framing
– Output
• Fraction of building damaged
– Easy to “enhance”
41 / 78

Tuesday Oct 29APRU – 2013
Building Response (cont)
• Simple Method
– Graf and Lee (Earthquake Spectra, 2009)
– Inputs
• PGA
• Construction Framing
– Output
• Fraction of building damaged
– Easy to “enhance”
42 / 78
Tuesday Oct 29APRU – 2013
Building Response (cont)
• Simple Method
– Graf and Lee (Earthquake Spectra, 2009)
– Inputs
• PGA
• Construction Framing
– Output
• Fraction of building damaged
– Easy to “enhance”
43 / 78

Tuesday Oct 29APRU – 2013
Building Response (cont)
• Simple Method
– Graf and Lee (Earthquake Spectra, 2009)
– Inputs
• PGA
• Construction Framing
– Output
• Fraction of building damaged
– Easy to “enhance”
44 / 78
Tuesday Oct 29APRU – 2013
Building Response (cont)
• Simple Method
– Graf and Lee (Earthquake Spectra, 2009)
– Inputs
• PGA
• Construction Framing
– Output
• Fraction of building damaged
– Easy to “enhance”
45 / 78

Tuesday Oct 29APRU – 2013
Building Response (cont)
• Simple Method
– Graf and Lee (Earthquake Spectra, 2009)
– Inputs
• PGA
• Construction Framing
– Output
• Fraction of building damaged
– Easy to “enhance”
46 / 78

Tuesday Oct 29APRU – 2013
Building Response (cont)
• Simple Method
– Graf and Lee (Earthquake Spectra, 2009)
– Inputs
• PGA
• Construction Framing
– Output
• Fraction of building damaged
– Easy to “enhance”
47 / 78

Tuesday Oct 29APRU – 2013
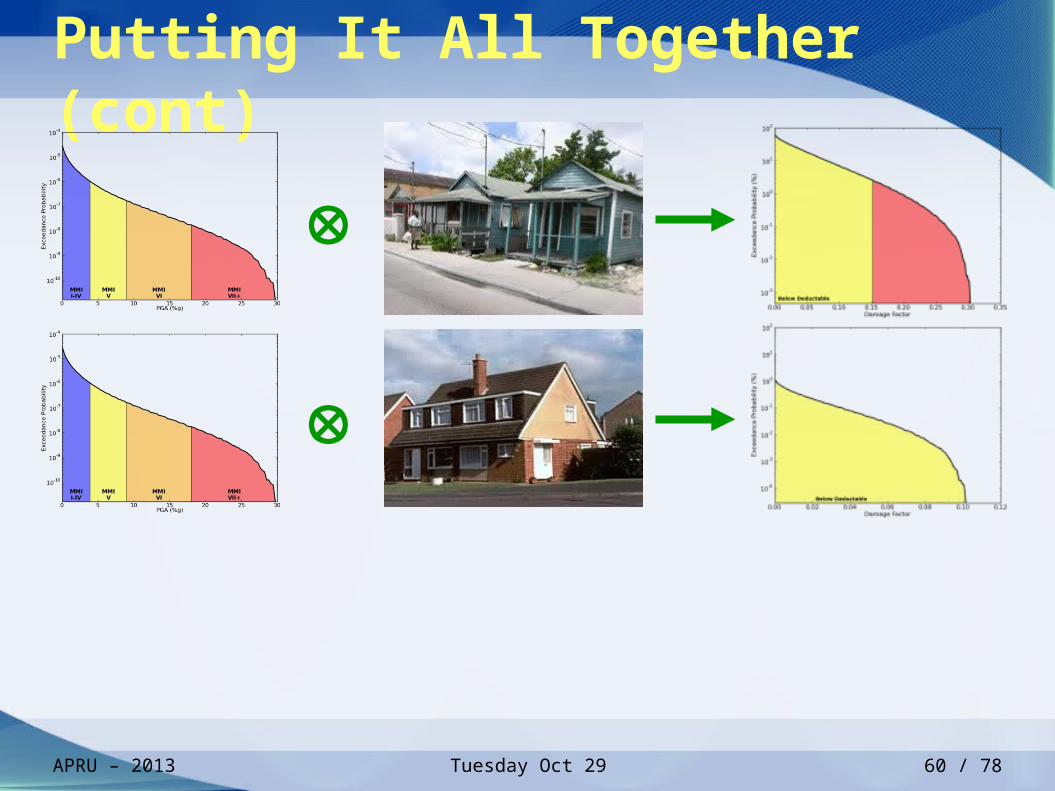
Putting It All Together
1. Create an earthquake forecast
2. Using the forecast as a density function, convolve a ground-shaking estimation with all possible earthquake sources
3. Create PGA Exceedance curves for all locations
4. Use the exceedance curves as inputs to damage calculations.
48 / 78

Tuesday Oct 29APRU – 2013
Putting It All Together
1. Create an earthquake forecast
2. Using the forecast as a density function, convolve a ground-shaking estimation with all possible earthquake sources
3. Create PGA Exceedance curves for all locations
4. Use the exceedance curves as inputs to damage calculations.
49 / 78

Tuesday Oct 29APRU – 2013
Putting It All Together
1. Create an earthquake forecast
2. Using the forecast as a density function, convolve a ground-shaking estimation with all possible earthquake sources
3. Create PGA Exceedance curves for all locations
4. Use the exceedance curves as inputs to damage calculations.
50 / 78

Tuesday Oct 29APRU – 2013
Putting It All Together
1. Create an earthquake forecast
2. Using the forecast as a density function, convolve a ground-shaking estimation with all possible earthquake sources
3. Create PGA Exceedance curves for all locations
4. Use the exceedance curves as inputs to damage calculations.
51 / 78

Tuesday Oct 29APRU – 2013
Putting It All Together
1. Create an earthquake forecast
2. Using the forecast as a density function, convolve a ground-shaking estimation with all possible earthquake sources
3. Create PGA Exceedance curves for all locations
4. Use the exceedance curves as inputs to damage calculations.
52 / 78

Tuesday Oct 29APRU – 2013
Putting It All Together (cont)
53 / 78

Tuesday Oct 29APRU – 2013
Putting It All Together (cont)
54 / 78

Tuesday Oct 29APRU – 2013
Putting It All Together (cont)
55 / 78

Tuesday Oct 29APRU – 2013
Putting It All Together (cont)
56 / 78

Tuesday Oct 29APRU – 2013
Putting It All Together (cont)
57 / 78

Tuesday Oct 29APRU – 2013
Putting It All Together (cont)
58 / 78

Tuesday Oct 29APRU – 2013
Putting It All Together (cont)
59 / 78
Tuesday Oct 29APRU – 2013
Putting It All Together (cont)
60 / 78

Tuesday Oct 29APRU – 2013
Putting It All Together (cont)
61 / 78

Tuesday Oct 29APRU – 2013
Quick Summary
• This procedure is fast
• Necessary data is available
• Science/theory exists for all steps
• Results are personalized and useful
62 / 78

Tuesday Oct 29APRU – 2013
Quick Summary
• This procedure is fast
• Necessary data is available
• Science/theory exists for all steps
• Results are personalized and useful
63 / 78

Tuesday Oct 29APRU – 2013
Quick Summary
• This procedure is fast
• Necessary data is available
• Science/theory exists for all steps
• Results are personalized and useful
64 / 78

Tuesday Oct 29APRU – 2013
Quick Summary
• This procedure is fast
• Necessary data is available
• Science/theory exists for all steps
• Results are personalized and useful
65 / 78

Tuesday Oct 29APRU – 2013
Quick Summary
• This procedure is fast
• Necessary data is available
• Science/theory exists for all steps
• Results are personalized and useful
66 / 78
Tuesday Oct 29APRU – 2013
Enhancing the Damage Model
• Model works well in United States
• How can we go global?
• Expand to include International Building Codes
• Generalize for sub-IBC construction
• Need access to building and damage data
• Use social data for modeling parameters
67 / 78

Tuesday Oct 29APRU – 2013
Enhancing the Damage Model
• Model works well in United States
• How can we go global?
• Expand to include International Building Codes
• Generalize for sub-IBC construction
• Need access to building and damage data
• Use social data for modeling parameters
68 / 78

Tuesday Oct 29APRU – 2013
Enhancing the Damage Model
• Model works well in United States
• How can we go global?
• Expand to include International Building Codes
• Generalize for sub-IBC construction
• Need access to building and damage data
• Use social data for modeling parameters
69 / 78

Tuesday Oct 29APRU – 2013
Enhancing the Damage Model
• Model works well in United States
• How can we go global?
• Expand to include International Building Codes
• Generalize for sub-IBC construction
• Need access to building and damage data
• Use social data for modeling parameters
70 / 78

Tuesday Oct 29APRU – 2013
Enhancing the Damage Model
• Model works well in United States
• How can we go global?
• Expand to include International Building Codes
• Generalize for sub-IBC construction
• Need access to building and damage data
• Use social data for modeling parameters
71 / 78
Tuesday Oct 29APRU – 2013
Enhancing the Damage Model
• Model works well in United States
• How can we go global?
• Expand to include International Building Codes
• Generalize for sub-IBC construction
• Need access to building and damage data
• Use social data for modeling parameters
72 / 78

Tuesday Oct 29APRU – 2013
Enhancing the Damage Model
• Model works well in United States
• How can we go global?
• Expand to include International Building Codes
• Generalize for sub-IBC construction
• Need access to building and damage data
• Use social data for modeling parameters
73 / 78

Tuesday Oct 29APRU – 2013
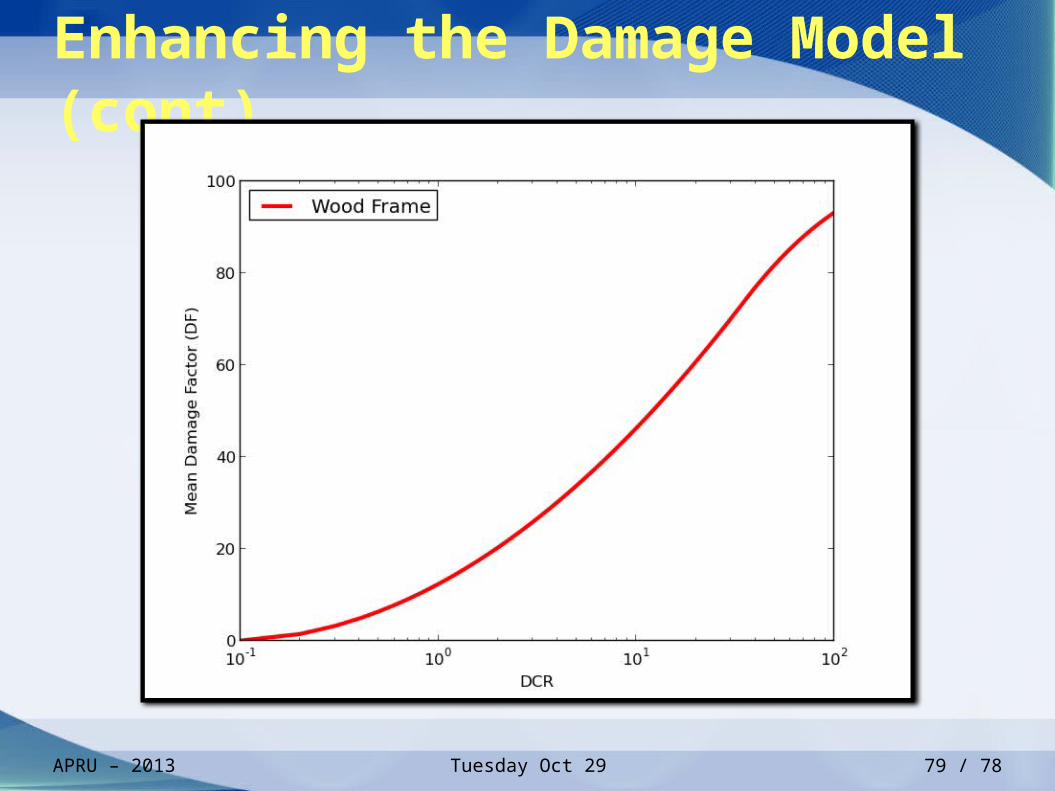
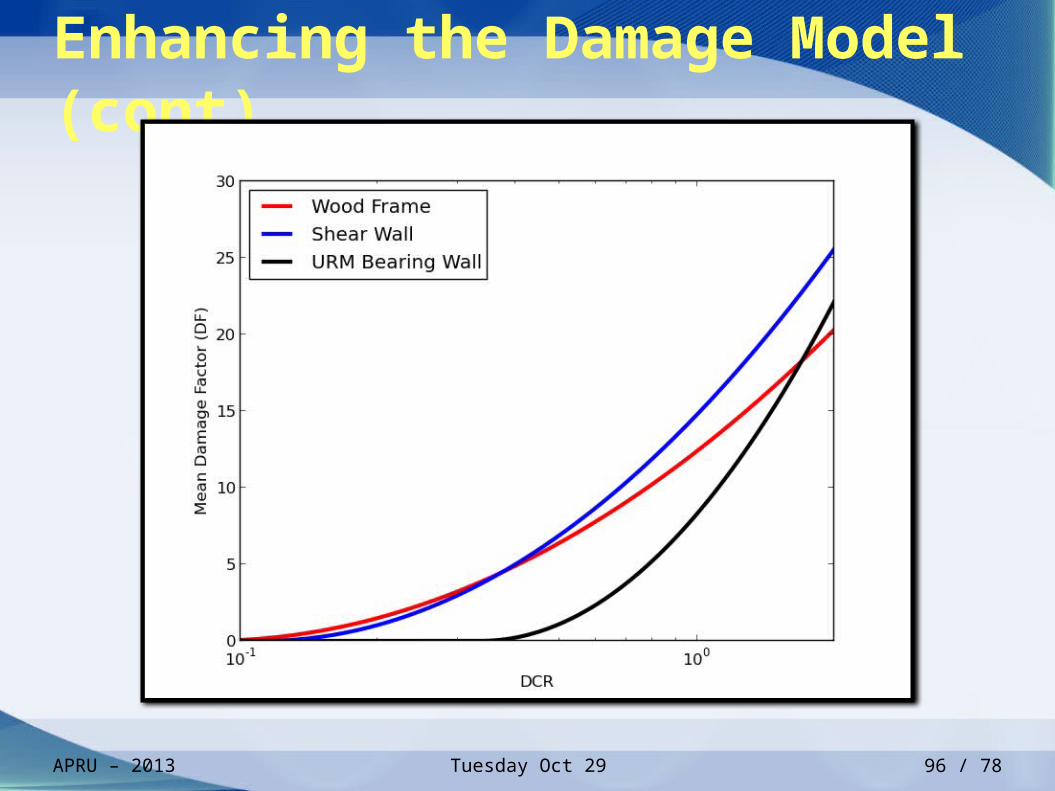
Enhancing the Damage Model (cont)
Damage Factor (DF)
• Function of Construction and Demand to Capacity Ratio (DCR)
74 / 78

Tuesday Oct 29APRU – 2013
Enhancing the Damage Model (cont)
Damage Factor (DF)
• Function of Construction and Demand to Capacity Ratio (DCR)
75 / 78

Tuesday Oct 29APRU – 2013
Enhancing the Damage Model (cont)
Damage Factor (DF)
• Function of Construction and Demand to Capacity Ratio (DCR)
76 / 78

Tuesday Oct 29APRU – 2013
Enhancing the Damage Model (cont)
Damage Factor (DF)
• Function of Construction and Demand to Capacity Ratio (DCR)
77 / 78

Tuesday Oct 29APRU – 2013
Enhancing the Damage Model (cont)
Damage Factor (DF)
• Function of Construction and Demand to Capacity Ratio (DCR)
78 / 78
Tuesday Oct 29APRU – 2013
Enhancing the Damage Model (cont)
79 / 78

Tuesday Oct 29APRU – 2013
Enhancing the Damage Model (cont)
80 / 78

Tuesday Oct 29APRU – 2013
Enhancing the Damage Model (cont)
81 / 78

Tuesday Oct 29APRU – 2013
Enhancing the Damage Model (cont)
82 / 78

Tuesday Oct 29APRU – 2013
Enhancing the Damage Model (cont)
• Values determined from fit against American properties
• Assume these values for all IBC structures
• Fit structure types country by country
• Absorb uncertainty and shift into DCR ratio (into R)
83 / 78

Tuesday Oct 29APRU – 2013
Enhancing the Damage Model (cont)
Framing System a b c
Wood-Frame -1.07093 2.47522 1.54108
Tilt-up -0.89917 2.14296 1.09176
Bearing Shear Wall -0.95119 2.24974 0.96355
URM Bearing Wall -0.47366 2.08034 0.58674
Moment-Resisting Space Frame -0.81928 2.32500 1.11061
Dual MRSF/Shear Wall -0.81325 2.22125 1.16141
Concentric Braced Frame -1.06169 2.78331 1.35868
• Values determined from fit against American properties
• Assume these values for all IBC structures
• Fit structure types country by country
• Absorb uncertainty and shift into DCR ratio (into R)
84 / 78

Tuesday Oct 29APRU – 2013
Enhancing the Damage Model (cont)
Framing System a b c
Wood-Frame -1.07093 2.47522 1.54108
Tilt-up -0.89917 2.14296 1.09176
Bearing Shear Wall -0.95119 2.24974 0.96355
URM Bearing Wall -0.47366 2.08034 0.58674
Moment-Resisting Space Frame -0.81928 2.32500 1.11061
Dual MRSF/Shear Wall -0.81325 2.22125 1.16141
Concentric Braced Frame -1.06169 2.78331 1.35868
• Values determined from fit against American properties
• Assume these values for all IBC structures
• Fit structure types country by country
• Absorb uncertainty and shift into DCR ratio (into R)
85 / 78

Tuesday Oct 29APRU – 2013
Enhancing the Damage Model (cont)
Framing System a b c
Wood-Frame -1.07093 2.47522 1.54108
Tilt-up -0.89917 2.14296 1.09176
Bearing Shear Wall -0.95119 2.24974 0.96355
URM Bearing Wall -0.47366 2.08034 0.58674
Moment-Resisting Space Frame -0.81928 2.32500 1.11061
Dual MRSF/Shear Wall -0.81325 2.22125 1.16141
Concentric Braced Frame -1.06169 2.78331 1.35868
• Values determined from fit against American properties
• Assume these values for all IBC structures
• Fit structure types country by country
• Absorb uncertainty and shift into DCR ratio (into R)
86 / 78

Tuesday Oct 29APRU – 2013
Enhancing the Damage Model (cont)
Framing System a b c
Wood-Frame -1.07093 2.47522 1.54108
Tilt-up -0.89917 2.14296 1.09176
Bearing Shear Wall -0.95119 2.24974 0.96355
URM Bearing Wall -0.47366 2.08034 0.58674
Moment-Resisting Space Frame -0.81928 2.32500 1.11061
Dual MRSF/Shear Wall -0.81325 2.22125 1.16141
Concentric Braced Frame -1.06169 2.78331 1.35868
• Values determined from fit against American properties
• Assume these values for all IBC structures
• Fit structure types country by country
• Absorb uncertainty and shift into DCR ratio (into R)
87 / 78

Tuesday Oct 29APRU – 2013
Enhancing the Damage Model (cont)
Framing System a b c
Wood-Frame -1.07093 2.47522 1.54108
Tilt-up -0.89917 2.14296 1.09176
Bearing Shear Wall -0.95119 2.24974 0.96355
URM Bearing Wall -0.47366 2.08034 0.58674
Moment-Resisting Space Frame -0.81928 2.32500 1.11061
Dual MRSF/Shear Wall -0.81325 2.22125 1.16141
Concentric Braced Frame -1.06169 2.78331 1.35868
• Values determined from fit against American properties
• Assume these values for all IBC structures
• Fit structure types country by country
• Absorb uncertainty and shift into DCR ratio (into R)
88 / 78

Tuesday Oct 29APRU – 2013
Enhancing the Damage Model (cont)
Framing System a b c
Wood-Frame -1.07093 2.47522 1.54108
Tilt-up -0.89917 2.14296 1.09176
Bearing Shear Wall -0.95119 2.24974 0.96355
URM Bearing Wall -0.47366 2.08034 0.58674
Moment-Resisting Space Frame -0.81928 2.32500 1.11061
Dual MRSF/Shear Wall -0.81325 2.22125 1.16141
Concentric Braced Frame -1.06169 2.78331 1.35868
• Values determined from fit against American properties
• Assume these values for all IBC structures
• Fit structure types country by country
• Absorb uncertainty and shift into DCR ratio (into R)
89 / 78

Tuesday Oct 29APRU – 2013
Enhancing the Damage Model (cont)
90 / 78

Tuesday Oct 29APRU – 2013
Enhancing the Damage Model (cont)
91 / 78

Tuesday Oct 29APRU – 2013
Enhancing the Damage Model (cont)
𝑫𝑪𝑹=𝑺𝒂
𝑹×𝑽 /𝑾
Demand to Capacity Ratio
92 / 78

Tuesday Oct 29APRU – 2013
Enhancing the Damage Model (cont)
𝑫𝑪𝑹=𝑺𝒂
𝑹×𝑽 /𝑾
Demand to Capacity Ratio
93 / 78

Tuesday Oct 29APRU – 2013
Enhancing the Damage Model (cont)
𝑫𝑪𝑹=𝑺𝒂
𝑹×𝑽 /𝑾
Demand to Capacity Ratio
94 / 78

Tuesday Oct 29APRU – 2013
Enhancing the Damage Model (cont)
Framing System R V/W T
Wood-Frame 2.5 – 6.5 0.05 – 0.4 0 – 1s
Tilt-up 2.5 – 5.5 0.05 – 0.5 0 – 1s
Bearing Shear Wall 2.5 – 5.5 0.03 – 0.5 0 – 2s
URM Bearing Wall 1.5 – 4.0 0.02 – 0.3 0 – 2s
Moment-Resisting Space Frame 2.0 – 8.5 0.03 – 0.5 0 – 2s
Dual MRSF/Shear Wall 3.0 – 8.5 0.03 – 0.5 0 – 2s
Concentric Braced Frame 3.0 – 8.0 0.03 – 0.5 0 – 2s
𝑫𝑪𝑹=𝑺𝒂
𝑹×𝑽 /𝑾
Demand to Capacity Ratio
95 / 78
Tuesday Oct 29APRU – 2013
Enhancing the Damage Model (cont)
96 / 78

Tuesday Oct 29APRU – 2013
Enhancing the Damage Model (cont)
97 / 78
Tuesday Oct 29APRU – 2013
Enhancing the Damage Model (cont)
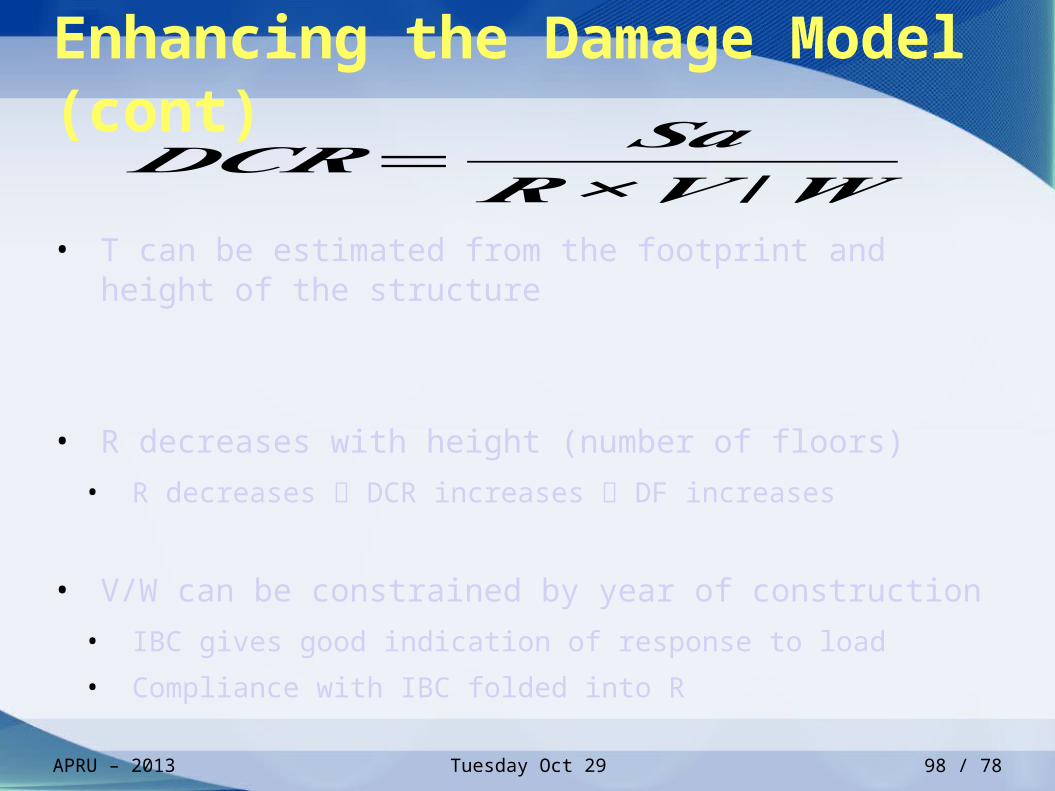
• T can be estimated from the footprint and height of the structure
• R decreases with height (number of floors)
• R decreases DCR increases DF increases
• V/W can be constrained by year of construction
• IBC gives good indication of response to load
• Compliance with IBC folded into R
𝑫𝑪𝑹=𝑺𝒂
𝑹×𝑽 /𝑾
98 / 78

Tuesday Oct 29APRU – 2013
Enhancing the Damage Model (cont)
• T can be estimated from the footprint and height of the structure
• R decreases with height (number of floors)
• R decreases DCR increases DF increases
• V/W can be constrained by year of construction
• IBC gives good indication of response to load
• Compliance with IBC folded into R
𝑫𝑪𝑹=𝑺𝒂
𝑹×𝑽 /𝑾
99 / 78

Tuesday Oct 29APRU – 2013
Enhancing the Damage Model (cont)
• T can be estimated from the footprint and height of the structure
• R decreases with height (number of floors)
• R decreases DCR increases DF increases
• V/W can be constrained by year of construction
• IBC gives good indication of response to load
• Compliance with IBC folded into R
𝑫𝑪𝑹=𝑺𝒂
𝑹×𝑽 /𝑾
100 / 78

Tuesday Oct 29APRU – 2013
Enhancing the Damage Model (cont)
• T can be estimated from the footprint and height of the structure
• R decreases with height (number of floors)
• R decreases DCR increases DF increases
• V/W can be constrained by year of construction
• IBC gives good indication of response to load
• Compliance with IBC folded into R
𝑫𝑪𝑹=𝑺𝒂
𝑹×𝑽 /𝑾
101 / 78

Tuesday Oct 29APRU – 2013
Enhancing the Damage Model (cont)
• T can be estimated from the footprint and height of the structure
• R decreases with height (number of floors)
• R decreases DCR increases DF increases
• V/W can be constrained by year of construction
• IBC gives good indication of response to load
• Compliance with IBC folded into R
𝑫𝑪𝑹=𝑺𝒂
𝑹×𝑽 /𝑾
102 / 78

Tuesday Oct 29APRU – 2013
Enhancing the Damage Model (cont)
• T can be estimated from the footprint and height of the structure
• R decreases with height (number of floors)
• R decreases DCR increases DF increases
• V/W can be constrained by year of construction
• IBC gives good indication of response to load
• Compliance with IBC folded into R
𝑫𝑪𝑹=𝑺𝒂
𝑹×𝑽 /𝑾
103 / 78

Tuesday Oct 29APRU – 2013
Enhancing the Damage Model (cont)
• T can be estimated from the footprint and height of the structure
• R decreases with height (number of floors)
• R decreases DCR increases DF increases
• V/W can be constrained by year of construction
• IBC gives good indication of response to load
• Compliance with IBC folded into R
𝑫𝑪𝑹=𝑺𝒂
𝑹×𝑽 /𝑾
104 / 78

Tuesday Oct 29APRU – 2013
Enhancing the Damage Model (cont)
• T can be estimated from the footprint and height of the structure
• R decreases with height (number of floors)
• R decreases DCR increases DF increases
• V/W can be constrained by year of construction
• IBC gives good indication of response to load
• Compliance with IBC folded into R
𝑫𝑪𝑹=𝑺𝒂
𝑹×𝑽 /𝑾
105 / 78

Tuesday Oct 29APRU – 2013
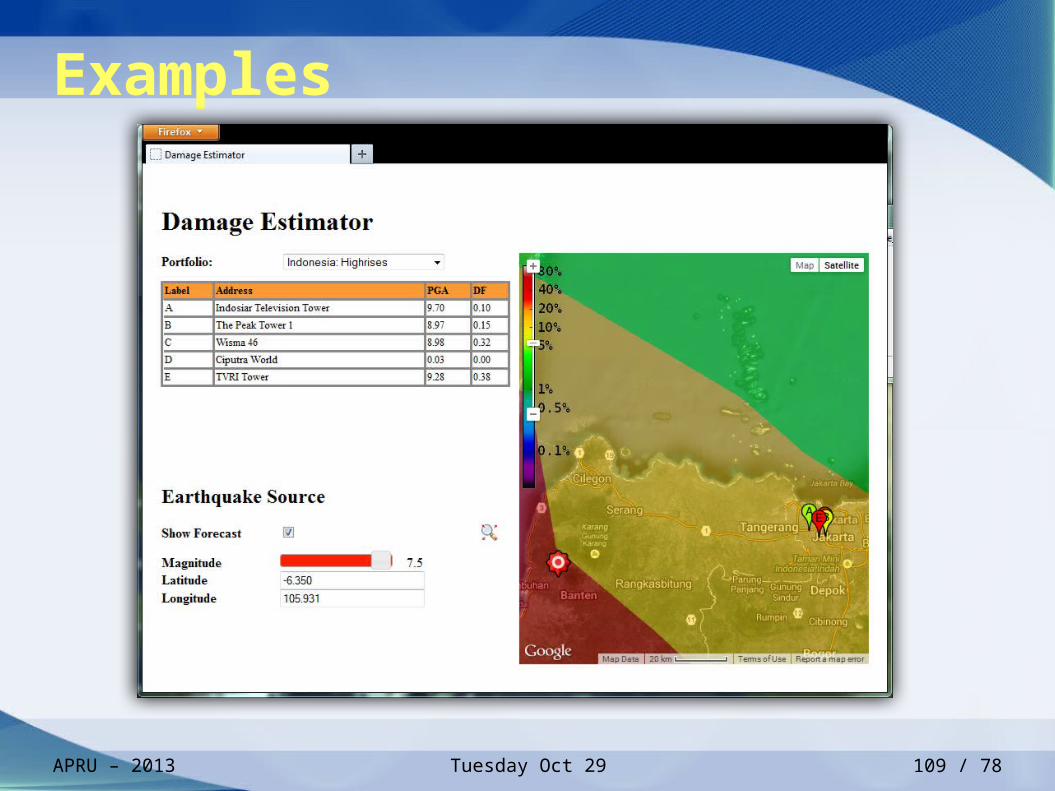
Examples
106 / 78

Tuesday Oct 29APRU – 2013
Examples
107 / 78

Tuesday Oct 29APRU – 2013
Examples
108 / 78
Tuesday Oct 29APRU – 2013
Examples
109 / 78
Tuesday Oct 29APRU – 2013
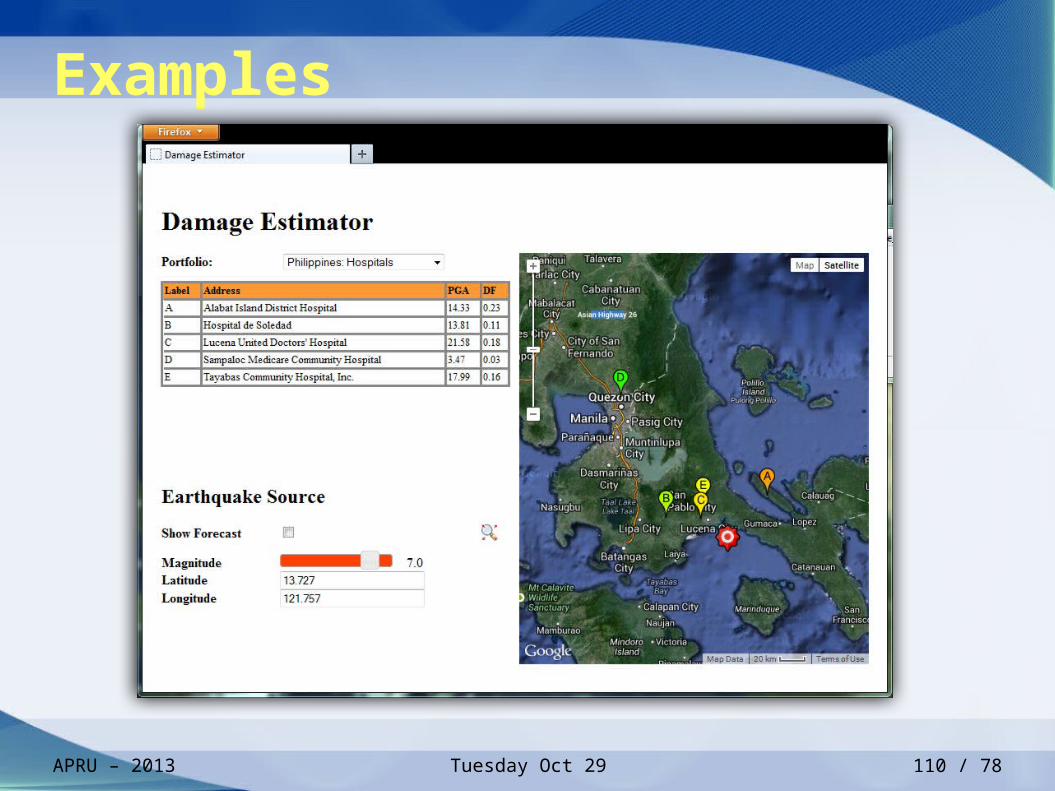
Examples
110 / 78

Tuesday Oct 29APRU – 2013
Conclusions
• This procedure is fast
• Necessary data is available
• Science/theory exists for all steps
• Results are personalized and useful
• But… we need data!
111 / 78

Tuesday Oct 29APRU – 2013
Conclusions
• This procedure is fast
• Necessary data is available
• Science/theory exists for all steps
• Results are personalized and useful
• But… we need data!
112 / 78

Tuesday Oct 29APRU – 2013
Conclusions
• This procedure is fast
• Necessary data is available
• Science/theory exists for all steps
• Results are personalized and useful
• But… we need data!
113 / 78

Tuesday Oct 29APRU – 2013
Conclusions
• This procedure is fast
• Necessary data is available
• Science/theory exists for all steps
• Results are personalized and useful
• But… we need data!
114 / 78

Tuesday Oct 29APRU – 2013
Conclusions
• This procedure is fast
• Necessary data is available
• Science/theory exists for all steps
• Results are personalized and useful
• But… we need data!
Thank You
115 / 78