aqa gcse maths 8300 teaching guidance-v2 · gcse mathematics 8300 teaching guidance version 2.0 9 3...
TRANSCRIPT

GCSE
MATHEMATICS
GCSE 8300
Teaching guidance
For teaching from September 2015 onwards
For GCSE exams in June 2017 onwards
Version 2.0, October 2015

Our specification is published on our website (www.aqa.org.uk). We will let centres know in writing
about any changes to the specification. We will also publish changes on our website. The definitive
version of our specification will always be the one on our website, this may differ from printed
versions.
You can get further copies of this Teaching guidance from:
The GCSE Mathematics Department
AQA
Devas Street
Manchester
M15 6EX
Or, you can download a copy from our All About Maths website (http://allaboutmaths.aqa.org.uk/)

Version 2.0 3
Contents
General information - disclaimer 5
Subject content 5
Number – Structure and calculation
1 6 1
Number – Fractions, decimals and percentages
2 26 1
Number – Measures and accuracy
3 31 1
Algebra – Notation, vocabulary and manipulation
4 39 1
Algebra – Graphs
5 53 1
Algebra – Solving equations and inequalities
6 72 1
Algebra – Sequences
7 85 1
Ratio, proportion and rates of change
8 90 1
Geometry and measures – Properties and constructions
9 115 1
Geometry and measures – Mensuration and calculation
10 140 1
Geometry and measures – Vectors
11 161 1
Probability
12 165 1
Statistics
13 182 1
Appendices: Mathematical formulae
14 192 1
Assessment objectives
B 196 1

4 Version 2.0

GCSE MATHEMATICS 8300 TEACHING GUIDANCE
Version 2.0 5
General Information - Disclaimer
This teaching guidance will help you plan by providing examples of the content of the specification.
It is not, in any way, intended to restrict what can be assessed in the question papers based on the specification.
Questions will be set in a variety of formats including both familiar and unfamiliar contexts.
Examples given in this teaching guidance illustrate the type of questions which would be asked on a question paper. However, the wording and format used in this guidance do not always represent how questions would appear in a question paper. Questions in this guidance have not been through the same rigorous checking process used in our question papers.
All knowledge from the Key Stage 3 and Key Stage 4 programmes of study is subsumed into the content of the GCSE specification.
Subject content
Students can be said to have confidence and competence with mathematical content when they can apply it flexibly to solve problems.
The expectation is that:
All students will develop confidence and competence with the content identified by standard type
All students will be assessed on the content identified by the standard and the underlined type; more highly attaining students will develop confidence and competence with all of this content
Only the more highly attaining students will be assessed on the content identified by bold type. The highest attaining students will develop confidence and competence with the bold content.
The distinction between standard, underlined and bold type applies to the content statements only, not to the assessment objectives or to the mathematical formulae in the appendix.

6 Version 2.0
1
Number – Structure and calculation
N1 Order positive and negative integers, decimals and
fractions; use the symbols =, ≠, <, >, ⩽, ⩾
Teaching Guidance
Students should be able to:
know and use the word integer and the equality and inequality symbols
recognise integers as positive or negative whole numbers, including zero
order positive and/or negative numbers given as integers, decimals and fractions, including improper fractions.
Notes
Including use of a number line.
Students should know the conventions of an open circle on a number line for a strict inequality and a closed circle for an included boundary.
See A22
Examples
1 Put these numbers in order starting with the smallest.
12
1 1.12 1
2
1 1.12 1
3
2 1
8
1
2 Write 4.2, 4.02, 4.203 and 4.23 in ascending order.
3 Write these fractions in order of size, starting with the smallest.
6
5
3
2
9
7
4 Which of the improper fractions 5
18,
6
17 or 10
31 is the greater?
5 Which of these is closest to3
1?
0.35 10
3 0.29
2
1

GCSE MATHEMATICS 8300 TEACHING GUIDANCE
Version 2.0 7
6 Write down the integer values of x where 3 < x ⩽ 8
7 Put these numbers in ascending order.
4
3 0.83
5
4
20
13
8 Version 2.0
N2 Apply the four operations, including formal written
methods, to integers, decimals and simple fractions
(proper and improper), and mixed numbers - all both
positive and negative; understand and use place value
(eg when working with very large or very small
numbers, and when calculating with decimals)
Teaching Guidance
Students should be able to:
add, subtract, multiply and divide integers using both mental and written methods
add, subtract, multiply and divide decimals using both mental and written methods
add, subtract, multiply and divide positive and negative numbers
interpret a remainder from a division problem
recall all positive number complements to 100
recall all multiplication facts to 12 12 and use them to derive the corresponding division facts
perform money and other calculations, writing answers using the correct notation
apply the four rules to fractions with and without a calculator
multiply and divide a fraction by an integer, by a unit fraction and by a general fraction
divide an integer by a fraction.
Notes
Students may use any algorithm for addition, subtraction, multiplication and division. Students are expected to know multiplication facts up to 12 12 and squares up to 15 15
Questions will be set in a variety of contexts, both familiar and unfamiliar. For example, in household finance questions, students will be expected to know and understand the meaning of profit, loss, cost price, selling price, debit, credit, balance, income tax, VAT and interest rate.
See N8, R9
Examples
1 Write down the place value of 8 in the answer to 2850 10
2 The population of Cambridge is 108 863
The population of Oxford is 153 904
How many more people live in Oxford than in Cambridge?

GCSE MATHEMATICS 8300 TEACHING GUIDANCE
Version 2.0 9
3 There are 75 students travelling in 16-seater mini-coaches.
If as many of the mini-coaches as possible are full, how many students travel in the mini-coach that is only partly full?
4 Four cards are numbered 3, 5, 7 and 8
Use each card once to make this calculation work.
……. ……. + ……. ……. = 158
5 The temperature falls 4 °C from 3.5 °C.
Work out the new temperature.
6 Here is a bank statement.
(a) Write down what you understand by the word ‘balance’.
(b) Complete the statement.
Date Description Credit Debit Balance
Starting balance £63.50
12/12/2013 Cash £120.00 …………..
16/12/2013 Gas bill £102.50 …………..
17/12/2013 Electricity bill £220.00 …………..
7 A builder employs seven bricklayers.
Each bricklayer earns £12.60 per hour worked.
They each work 372
1 hours per week.
The builder says he needs £33 075 each week to pay his bricklayers.
Use a calculator to check if he is correct.

10 Version 2.0
8 A builder employs some bricklayers.
Each bricklayer works 372
1 hours per week.
He needs the bricklayers to work a total of 500 hours per week.
How many bricklayers should he employ?
9 Work out 14
3 4
10 Work out 15
2 +
4
3
11 Work out 36
5 2
2
1
12 Work out 22
1 3
13 Work out 4 8
7
14 Work out 11
6 ÷ 3
15 Work out 4
3
9
8
16 Write down the answer to 15
4 ÷
15
4
17 Work out 8 ÷ 3
2
18 Work out 0.3 0.2
19 Work out
5.0
5.3
20 Helen earns £8000 per year
She pays 20% income tax on this amount.
How much income tax does she pay each month?
21 Electricity is 21p per unit.
A household uses 450 units.
VAT is added at 5%
Work out the total cost of the electricity
GCSE MATHEMATICS 8300 TEACHING GUIDANCE
Version 2.0 11
N3 Recognise and use relationships between operations,
including inverse operations (eg cancellation to simplify
calculations and expressions); use conventional notation
for priority of operations, including brackets, powers,
roots and reciprocals
Teaching Guidance
Students should be able to:
add, subtract, multiply and divide using commutative, associative and distributive laws
understand and use inverse operations
use brackets and the hierarchy of operations
solve problems set in words.
Notes
Questions requiring these number skills could be set, for example, as a numerical part of a question testing time, fractions, decimals, percentages, ratio or proportion, interpreting graphs, using a formula in words or substituting into an algebraic expression, interpreting a statistical diagram or interrogating a data set.
Examples
1 Use all of the numbers 2, 5, 9 and 10, brackets and any operations to write a numerical expression equal to 3
2 A cup of coffee costs £1.30
A cup of tea costs £1.10
I buy three cups of coffee and two cups of tea.
How much change should I get from a £10 note?
3 A cup of coffee costs £1.30
A cup of tea costs £1.10
I want to buy three cups of coffee and two cups of tea.
I have a voucher for one free cup of coffee with every two cups of coffee bought.
How much should I pay?
4 Work out the value of (24 1)2

12 Version 2.0
5 The data below shows the number of people in the seats in each row of a theatre.
19 17 14 15 18 17 12 8 4 3
The theatre holds 200 people.
How many empty seats are there?
6 The mean weight of 9 people is 79 kg
A 10th person is such that the mean weight increases by 1 kg
How heavy is the 10th person?
7 Luke says that 3 + 4 5 = 35
Is he correct?
Give a reason for your answer.
8 The time in London is 13.00 when the time in New York is 08.00 and the time in San Francisco is 06.00
Work out the time in London when the time in San Francisco is 11.00 pm
9 A coach firm charges £300 to hire a coach, plus a rate per mile.
A group hires a coach and is charged a total of £700 for a 200 mile journey.
What is the rate per mile?
10 The mean of this frequency distribution is 16
Data Frequency
10
15 43
20 21
25 11
Work out the missing data value.
11 Write
121
1 as a decimal.
Give your answer to 2 decimal places.

GCSE MATHEMATICS 8300 TEACHING GUIDANCE
Version 2.0 13
N4 Use the concepts and vocabulary of prime numbers,
factors (divisors), multiples, common factors, common
multiples, highest common factor, lowest common
multiple, prime factorisation, including using product
notation and the unique factorisation theorem
Teaching Guidance
Students should be able to:
identify multiples, factors and prime numbers from lists of numbers
write out lists of multiples and factors to identify common multiples or common factors of two or more integers
write a number as the product of its prime factors and use formal (eg using Venn diagrams) and informal methods (eg trial and error) for identifying highest common factors (HCF) and lowest common multiples (LCM)
work out a root of a number from a product of prime factors.
Notes
The unique factorisation theorem states that every integer greater than 1 is prime or can be written as the product of prime numbers.
Writing a number as the product of its prime factors including writing in index form.
Abbreviations will not be used in examination papers.
Examples
1 Which of the numbers 1, 6, 11, 12, 18, and 24 are factors of 24?
2 Write 60 as the product of its prime factors.
Give your answer in index form.
3 Envelopes are sold in packs of 18
Address labels are sold in packs of 30
Terry needs the same number of envelopes and address labels.
What is the smallest number of each pack he can buy?
4 a and b are prime numbers.
Work out a pair of values for a and b so that 4a b is prime.
5 (a) Write 1764 as a product of prime factors.
(b) Use your answer to part (a) to work out 1764

14 Version 2.0
N5 Apply systematic listing strategies
Teaching Guidance
Students should be able to:
identify all permutations and combinations and represent them in a variety of formats.
Notes
Including using lists, tables and diagrams.
Examples
1 A drinks machine sells Tea (T), Coffee (C) and Soup (S).
Gareth buys 2 drinks at random.
(a) List all the possible pairs of drinks he could buy.
(b) Use your list to find the probability that both drinks are the same.
2 Jane has two of the same coin.
Work out the probability that she has at least £1 in total.
3 How many numbers between 100 and 200 have at least one digit that is 7?
GCSE MATHEMATICS 8300 TEACHING GUIDANCE
Version 2.0 15
N5h
Apply systematic listing strategies including use of the
product rule for counting
Teaching Guidance
Students should be able to:
know and understand why if there are x ways to do task 1 and y ways to do task 2, then there are xy ways to do both tasks in sequence.
Examples
1 In a café there are a choice of five drinks and six sandwiches.
How many different combinations of a drink and a sandwich are there?
2 Daniel has 10 shirts, 8 pairs of trousers and 5 pairs of socks.
(a) How many different combinations of shirt, trousers and socks does he have?
(b) He chooses a shirt.
How many combinations are there now?
3 How many three-digit numbers are even, given that the first digit is non-zero?
4 How many odd numbers greater than 60 000 can be made using these five cards?
3 2 4 5 6

16 Version 2.0
N6 Use positive integer powers and associated real roots
(square, cube and higher), recognise powers of 2, 3, 4, 5
Teaching Guidance
Students should be able to:
recall squares of numbers up to 15 15 and the cubes of 1, 2, 3, 4, 5 and 10, also knowing the corresponding roots
calculate and recognise powers of 2, 3, 4, 5
calculate and recognise powers of 10
understand the notation and be able to work out the value of squares, cubes and powers of 10
recognise the notation 25
solve equations such as x 2 = 25, giving both the positive and negative roots.
Notes
Students should know that 1000 = 10 3 and 1 million = 10 6
Students should know that a square root can be negative.
Examples
1 Write down the values of 49 , 3 125 , 33 22
2 Three numbers add up to 60
The first number is a square number.
The second number is a cube number.
The third number is less than 10
What could the numbers be?
3 Write down the value of 82, 43, 105
4 Write 64 as
(a) a square of an integer.
(b) the cube of an integer.
5 Solve 2x = 64

GCSE MATHEMATICS 8300 TEACHING GUIDANCE
Version 2.0 17
N6h
Use positive integer powers and associated real roots
(square, cube and higher), recognise powers of 2, 3, 4, 5
estimate powers and roots of any given positive
number
Teaching Guidance
Students should be able to:
estimate the value of a power of a given positive number
estimate the value of the root of any given positive number
identify between which two integers the square root of a positive number lies
identify between which two integers the cube root of a positive number lies.
Examples
1 Estimate the square root of 43
2 Between which two integers does the square root of 150 lie?
3 Between which two integers does the cube root of 100 lie?
4 Estimate the value of 6.3 4
5 Estimate the value of 4 93912
6 Estimate the value of 2x = 40

18 Version 2.0
N7 Calculate with roots and with integer indices
Teaching Guidance
Students should be able to:
use index laws for multiplication and division of integer powers
calculate with positive integer indices.
Notes
Students will be expected to apply index laws to simplify numerical and algebraic expressions.
See A4
Examples
1 Write
(a) 7 5 7 3 as a single power of 7
(b) 9 12 ÷ 9 5 as a single power of 9
(c) 352 )( as a single power of 2
2 Work out the value of 2 10 ÷ 2 6, giving your answer as a whole number.
3 Amy writes that 6 10 ÷ 6 2 = 6 5
Explain what Amy has done wrong.
4 Work out
5
63
2
104
5 Work out the value of 26 × 32
6 Tim says that 22 1213 is greater than 3 22 211
Is he correct?
You must show your working.
7 Show that it is possible to write 50 as the sum of two square numbers in two different ways.
GCSE MATHEMATICS 8300 TEACHING GUIDANCE
Version 2.0 19
8 Work out the value of
88
887
29
9 Write
3
89
27
22
22
as a single power of 2
10 Work out the value of 2232
11 Simplify 2 3 + 3 3
12 Expand and simplify 5 5 + 4 + 1

20 Version 2.0
N7h
Calculate with roots and with integer and fractional
indices
Teaching Guidance
Students should be able to:
calculate values using fractional indices
calculate with positive and negative integer indices
use index laws for multiplication and division of positive, negative and fractional indices.
Notes
Students will be expected to apply index laws to simplify algebraic expressions.
See A4
Examples
1 Work out the value of 3
1
8
2 Work out the value of 2
1
9
3 Simplify 2
3
2
7
xx
4 Work out the value of 4
3
16
5 Work out x if 27 x = 4
1
81
6 Work out the value of 2 3
7 Work out the value of 8 3
2
9 2
1
as a mixed number.
8
Work out the value of 8 3
1
32 5
2
GCSE MATHEMATICS 8300 TEACHING GUIDANCE
Version 2.0 21
N8 Calculate exactly with fractions, and multiples of π
Teaching Guidance
Students should be able to:
identify equivalent fractions
write a fraction in its simplest form
simplify a fraction by cancelling all common factors, using a calculator where appropriate, for example, simplifying fractions that represent probabilities
convert between mixed numbers and improper fractions
compare fractions
compare fractions in statistics and geometry questions.
add and subtract fractions by writing them with a common denominator
convert mixed numbers to improper fractions and add and subtract mixed numbers
give answers in terms of π and use values given in terms of π in calculations.
Notes
See N2, G17, G18
Examples
1 Which of these fractions 4
3,
6
5,
12
7 are greater than
3
2?
2 Which of these fractions 5
2,
20
9 or
10
7 is closest to
2
1?
3 Peter scores 64 out of 80 in a test.
Write this score as a fraction in its simplest form.
4 Write down a fraction between 7
5 and
7
6
5 Write down an improper fraction with a value between 3 and 4
6 From inspection of a bar chart:
What fraction of the boys preferred pizza?
Give your answer in its simplest form.
22 Version 2.0
7 From inspection of a pie chart:
What fraction of the vehicles were cars?
Give your answer in its simplest form.
8 Trading Standards staff inspect 80 bags of apples to check that they weigh 1 kg as stated.
The diagram shows the weight of the bags under 1 kg
What fraction of the bags were under 1 kg?
Give your answer in its simplest form.
9 Work out
(a) 5
2 +
4
3
(b) 33
2 1
2
1
10 In an experiment to test reaction times, Alex took 8
1 of a second to react and Ben took
20
3 of a
second to react.
Who reacted quickest and by how much?
11 Sally is cycling home, a distance of 63
1 miles.
After 44
3 miles she has a puncture and has to push her bike the rest of the way home.
How far does she push her bike?
12 The formula for the volume of a cone is 3
1 πr 2h
Work out the volume of a cone with base radius 6 cm and perpendicular height 11 cm
Give your answer in terms of π.
13 The circumference of a circle is 18 cm
Work out the area of the circle.
Give your answer in terms of

GCSE MATHEMATICS 8300 TEACHING GUIDANCE
Version 2.0 23
N8h Calculate exactly with fractions, surds, and multiples of
π; simplify surd expressions involving squares
(eg 12 = 34 = 34 = 32 ) and rationalise
denominators
Teaching Guidance
Students should be able to:
simplify surds
rationalise a denominator of the form a or ab
simplify expressions using the rules of surds
expand brackets where the terms may be written in surd form
solve equations which may be written in surd form.
Examples
1 Write 28 + 63 in the form p 7 where p is an integer.
2 Simplify
(a) ( 11) 2
(b) 192 ÷ 12
3 (a) Simplify fully 27 × 3
(b) Rationalise the denominator and simplify 7
35
4 Show that 20 = 52
5 Write ( 2 + 10 ) 2 in the form a + b 5
6 Show that ( 72 + 3)( 6 2 ) can be simplified to a 2 when a is an integer.

24 Version 2.0
7 Work out the value of x given that
5
50x = 4 5
8 Show that
23
5
4
23 simplifies to
12
2
9 Expand and simplify 73434323

GCSE MATHEMATICS 8300 TEACHING GUIDANCE
Version 2.0 25
N9 Calculate with and interpret standard form A 10
n,
where 1 ⩽ A < 10 and n is an integer
Teaching Guidance
Students should be able to:
know, use and understand the term standard from
write an ordinary number in standard form
write a number written in standard form as an ordinary number
order and calculate with numbers written in standard form
solve simple equations where the numbers are written in standard form
interpret calculator displays
use a calculator effectively for standard form calculations
solve standard form problems with and without a calculator.
Examples
1 Write in standard form
(a) 379.4
(b) 0.0712
2 Write as ordinary numbers
(a) 2.65 10 5
(b) 7.08 10 3
3 Write one quarter of a million in standard form.
4 Write these numbers in ascending order
14 485 1.45 10 4 1.45 10 3
5 Work out the value of the following.
Give your answer in standard form.
(2.8 10 9) ÷ (4 10 5)
6 Solve (2.4 10 7)x = 1.44 10 9 (Higher tier only)
Give your answer in standard form.

26 Version 2.0
2
Number - Fractions, decimals and
percentages
N10 Work interchangeably with terminating decimals and
their corresponding fractions (such as 3.5 and 2
7
or
0.375 and 8
3
)
Teaching Guidance
Students should be able to:
convert between fractions and decimals using place value
compare the value of fractions and decimals.
Notes
Including ordering.
Examples
1 Write the fraction 8
7 as a decimal.
2 Write 0.28 as a fraction in its lowest terms.
3 Write 4
11 as a decimal.

GCSE MATHEMATICS 8300 TEACHING GUIDANCE
Version 2.0 27
N10h
Work interchangeably with terminating decimals and
their corresponding fractions (such as 3.5 and 2
7
or
0.375 and 8
3
); change recurring decimals into their
corresponding fractions and vice versa
Teaching Guidance
Students should be able to:
convert recurring decimals into fractions
convert fractions into recurring decimals
use formal algebraic methods to convert recurring decimals into fractions.
Examples
1 Write 0.
72 as a fraction in its lowest terms.
2 Write
90
7 as a recurring decimal.
3 Put these numbers in ascending order 11
4 , 0.4, 10
3 , 0.
39
4 Write 0.4
36 as a fraction in its lowest terms.

28 Version 2.0
N11 Identify and work with fractions in ratio problems
Teaching Guidance
Students should be able to:
understand the meaning of ratio notation
interpret a ratio as a fraction
use fractions and ratios in the context of geometrical problems, for example similar shapes, scale drawings and problem solving involving scales and measures
understand that a line divided in the ratio 1 : 3 means that the smaller part is one-quarter of the whole.
Notes
Ratio may be linked to probability, for example, students should know that if red balls and blue balls in
a bag are in the ratio 3 : 4 then the probability of randomly obtaining a red ball is 7
3
See R8
Examples
1 The ratio of left-handed to right-handed people in a class is 2 : 19
What fraction of people are right-handed?
2 A bag contains white, black and green counters.
5
2 of the counters are white.
The ratio of black counters to green counters in a bag is 1 : 5
There are 100 counters in total.
How many counters are green?
3 The ratio of red balls to blue balls in a bag is 3 : 4
What fraction of the balls are red?
4 The number of coins in two piles are in the ratio 5 : 3
The coins in the first pile are all 50p coins.
The coins in the second pile are all £1 coins.
Which pile has the most money?
You must show your working.

GCSE MATHEMATICS 8300 TEACHING GUIDANCE
Version 2.0 29
N12 Interpret fractions and percentages as operators
Teaching Guidance
Students should be able to:
calculate a fraction of a quantity
calculate a percentage of a quantity
use fractions, decimals or percentages to find quantities
use fractions, decimals or percentages to calculate proportions of shapes that are shaded
use fractions, decimals or percentages to calculate lengths, areas or volumes
understand and use unit fractions as multiplicative inverses
multiply and divide a fraction by an integer, by a unit fraction and by a general fraction
interpret a fraction, decimal or percentage as a multiplier when solving problems
use fractions, decimals or percentages to interpret or compare statistical diagrams or data sets
convert between fractions, decimals and percentages to find the most appropriate method of calculation in a question; for example, 62% of £80 is 0.62 £80 and 25% of £80 is £80 ÷ 4
Notes
Students should understand that, for example, multiplication by 5
1 is the same as division by 5
Including interpreting percentage problems using a multiplier.
See R9
Examples
1 A rectangle measures 3.2 cm by 6.8 cm
It is cut into four equal sized smaller rectangles.
Work out the area of a small rectangle.
2 Small cubes of edge length 1 cm are put into a box.
The box is a cuboid of length 5 cm, width 4 cm and height 2 cm
How many cubes are in the box if it is half full?
3 In a school there are 600 students and 50 teachers.
15% of the students are left-handed.
12% of the teachers are left-handed.
How many left-handed students and teachers are there altogether?
30 Version 2.0
4 Work out 8
3 of 56
5 Circle the calculations that would find 45% of 400
A 0.45 400
B 45
1 400
C 100
45 400
D 4
400 5
E 45 4
6 Work out 62% of £ 70
7 In school A, 56% of the 750 students are girls.
In school B, 9
4 of the 972 students are girls.
Which school has the greater number of girls and by how many?

GCSE MATHEMATICS 8300 TEACHING GUIDANCE
Version 2.0 31
3
Number - Measures and accuracy
N13 Use standard units of mass, length, time, money and
other measures (including standard compound
measures) using decimal quantities where appropriate
Teaching Guidance
Students should be able to:
know and use standard metric and imperial measures
know and use compound measures such as area, volume and speed
choose appropriate units for estimating measurements, for example a television mast would be measured in metres.
Notes
Know and use metric conversion factors for length, area, volume and capacity.
Imperial / metric conversions will be given in the question.
Correct money notation is expected in all answers.
Examples
1 Decide suitable metric units for measuring each of the following
(a) a dose of medicine on a spoon
(b) the length of a bus
(c) the distance between two towns.
2 Circle the units of speed.
metres metres per second hours kilometres

32 Version 2.0
N14 Estimate answers; check calculations using
approximation and estimation, including answers
obtained using technology
Teaching Guidance
Students should be able to:
make sensible estimates of a range of measures in everyday settings
make sensible estimates of a range of measures in real-life situations, for example estimate the height of a man
evaluate results obtained
use approximation to estimate the value of a calculation
work out the value of a calculation and check the answer using approximations.
Notes
Students should know that when using approximations for estimating answers, numbers should be rounded to one significant figure before the estimating is done.
See N15
Examples
1 Estimate the height of a building and use this to estimate the number of pieces of 2 m drainpipe needed (diagram given).
2 (a) Work out the exact value of 9.8 109
(b) Use approximations to decide whether your answer to part (a) is sensible.

GCSE MATHEMATICS 8300 TEACHING GUIDANCE
Version 2.0 33
N15 Round numbers and measures to an appropriate degree
of accuracy (eg to a specified number of decimal places
or significant figures); use inequality notation to specify
simple error intervals due to truncation or rounding
Teaching Guidance
Students should be able to:
perform money calculations, writing answers using the correct notation
round numbers to the nearest whole number, 10, 100 or 1000
round numbers to a specified number of decimal places
round numbers to a specified number of significant figures
use inequality notation to specify error intervals due to truncation or rounding.
Notes
Including appropriate rounding for questions set in context.
Students should know not to round values during intermediate steps of a calculation.
Students should know that some answers need to be rounded up and some need to be rounded down.
Students should know that some answers are inappropriate without some form of rounding, for example 4.2 buses.
See N14
Examples
1 How many 40-seater coaches are needed to carry 130 students?
2 120 people take their driving test in a week.
71 pass.
Work out the percentage of those who pass.
Give your answer to one decimal place.
3 1127 people pass their driving test in 39 weeks.
Calculate the mean number of students who pass in one week.
Give your answer to one significant figure.
4 A rectangle has a length of 3.4 cm
The length is given to 1 decimal place.
Use inequalities to write down the error interval due to rounding.

34 Version 2.0
5 A parcel has a mass of 28.6 g
This mass has been truncated to 1 decimal place.
Use inequalities to write down the error interval due to truncation.
6 Jack says he is 12 years old.
Use inequalities to write down the error interval of his age.

GCSE MATHEMATICS 8300 TEACHING GUIDANCE
Version 2.0 35
N16 Apply and interpret limits of accuracy
Teaching Guidance
Students should be able to:
recognise that measurements given to the nearest whole unit may be inaccurate by up to one half in either direction.
Examples
1 At a concert there are 350 people to the nearest 10
(a) Write down the minimum number of people at the concert.
(b) Write down the maximum number of people at the concert.
2 Two football matches each have a crowd of 10 200 to the nearest 100
What is the maximum difference between the size of the crowds?
3 Sam measured the length of a pencil as 12 cm to the nearest cm
Show that the actual length is within 5% of 12 cm

36 Version 2.0
N16h Apply and interpret limits of accuracy including upper
and lower bounds
Teaching Guidance
Students should be able to:
write down the maximum or minimum figure for a value rounded to a given accuracy
combine upper or lower bounds appropriately to achieve an overall maximum or minimum for a situation
work with practical problems involving bounds including in statistics. For example, finding the midpoint of a class interval, such as 10 t ⩽ 20, in order to estimate a mean.
Notes
For example, the maximum value of a b is obtained from use of the maximum value for a and the minimum value for b.
Upper bounds do not necessarily require use of recurring decimals. For example, if the answer to the
nearest integer is 7, the maximum could be given as 7.5, 7.49 ... or 947.
If this value of 7 represented £7, £7.49 would be expected for the maximum.
For continuous variables, students may be asked for the lower and upper limits rather than the minimum and maximum values.
Examples
1 The current men's 100 metre sprint world record is 9.58 seconds.
(a) How do you know that this is not an exact time?
(b) What is the shortest time this could have been?
2 The mean height of Nick's children is 1.15 m
Each child’s height is measured to the nearest cm
What is the greatest possible sum of the four children's heights?
3 In 2008 Nita bought a car for £10 000 to the nearest £100
In 2009 the car went down in value by 15% to the nearest 1%
In 2010 the car went down in value by a further 13% to the nearest 1%
What was the highest possible value of the car, by the end of 2010?
GCSE MATHEMATICS 8300 TEACHING GUIDANCE
Version 2.0 37
4 Ben is planning a car journey.
He estimates the distance to be 90 miles to the nearest 5 miles.
He hopes to travel at an average speed of 60mph to the nearest 10mph.
Work out his minimum expected journey time in hours and minutes.
5 A rectangle has a length of 3.4 cm and a width of 5.7 cm
The length and width are given to 1 decimal place.
Work out the minimum area.
6 x = 240 to 2 significant figures.
y = 80 to 1 significant figure.
(a) Work out the maximum value of xy.
(b) Work out the minimum value of
y
x.
7 Books each weigh 1.3 kg to 1 decimal place.
A shelf can hold no more than 20 kg
What is the greatest number of these books than can safely be put on the shelf?
38 Version 2.0
4
Algebra - Notation, vocabulary and
manipulation
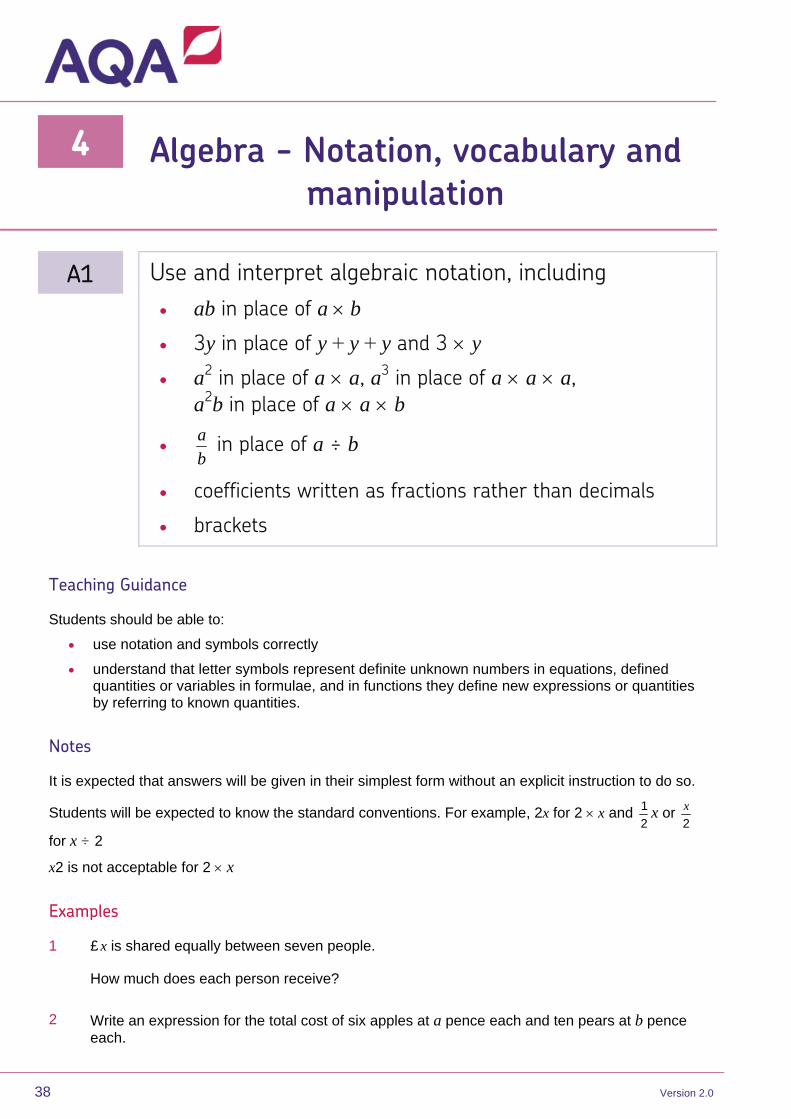
A1 Use and interpret algebraic notation, including
ab in place of a b
3y in place of y + y + y and 3 y
a2
in place of a a, a3
in place of a a a,
a2b in place of a a b
b
a in place of a ÷ b
coefficients written as fractions rather than decimals
brackets
Teaching Guidance
Students should be able to:
use notation and symbols correctly
understand that letter symbols represent definite unknown numbers in equations, defined quantities or variables in formulae, and in functions they define new expressions or quantities by referring to known quantities.
Notes
It is expected that answers will be given in their simplest form without an explicit instruction to do so.
Students will be expected to know the standard conventions. For example, 2x for 2 x and 2
1 x or 2
x
for x ÷ 2
x2 is not acceptable for 2 x
Examples
1 £ x is shared equally between seven people.
How much does each person receive?
2 Write an expression for the total cost of six apples at a pence each and ten pears at b pence each.

GCSE MATHEMATICS 8300 TEACHING GUIDANCE
Version 2.0 39
A2 Substitute numerical values into formulae and
expressions, including scientific formulae
Teaching Guidance
Students should be able to:
use formulae from mathematics and other subjects expressed initially in words and then using letters and symbols. For example, formula for area of a triangle, area of a parallelogram, area of a circle, volume of a prism, conversions between measures, wage earned = hours worked hourly rate + bonus
substitute numbers into a formula.
Notes
Questions will include geometrical formulae and questions involving measures.
Questions will include formulae for generating sequences and formulae in words using a real-life context (for example formula for cooking a turkey) and formulae out of context (for example substitute
positive and negative numbers into expressions such as 3x 2 + 4, 2x 3 and 2
35 )( yx )
Unfamiliar formulae will be given in the question.
See A5
Examples
1 To change a distance given in miles, m, to a distance in kilometres, k, we use this rule.
First multiply by 8 then divide by 5
Write this rule as a formula and use it to change 300 miles into kilometres.
2 Write down the first three terms of a sequence where the nth term is given by n2 + 4
3 Use the formula ‘wage earned = hours worked hourly rate + bonus’ to calculate the wage earned when Sarah works for 30 hours at £ 8.50 an hour and receives a bonus of £ 46
4 Convert 25 °C to °F using the formula F = 5
9 C + 32
5 When a = 5, b = 7 and c = 8, work out the value of c
ba )( 3

40 Version 2.0
A3 Understand and use the concepts and vocabulary of
expressions, equations, formulae, identities, inequalities,
terms and factors
Teaching Guidance
Students should be able to:
understand phrases such as ‘form an equation’, ‘use a formula’, ‘write down a term’, ‘write an expression’ and ‘prove an identity’ when answering a question
recognise that, for example, 5x + 1 = 16 is an equation
recognise that, for example, V = IR is a formula
recognise that x + 3 is an expression
recognise that (x + 2)2 x2 + 4x + 4 is an identity
recognise that 2x + 5 < 16 is an inequality
write an expression
know the meaning of the word ‘factor’ for both numerical work and algebraic work.
Notes
This will be implicitly and explicitly assessed.
Examples
1 Write an expression for the number that is 6 less than n.
2 Neil buys y packets of sweets costing 45p per packet.
He pays T pence altogether.
Write a formula for the total cost of the sweets.
3 Write down an equation for two bananas at h pence each and three grapefruit at k pence each when the total cost is £1.36
4 Given an equation, a formula and an expression, match each of them to the correct word.
GCSE MATHEMATICS 8300 TEACHING GUIDANCE
Version 2.0 41
5 Chloe is x years old.
Her sister is three years older.
Her brother is twice her age.
The sum of their ages is 67 years.
(a) Write an expression, in terms of x, for her sister’s age.
(b) Form an equation in x to work out Chloe’s age.
6 Two angles have a difference of 30°
Together they form a straight line.
The smaller angle is x°
(a) Write down an expression for the larger angle, in terms of x.
(b) Work out the value of x.

42 Version 2.0
A4 Simplify and manipulate algebraic expressions (including
those involving surds) by:
collecting like terms
multiplying a single term over a bracket
taking out common factors
expanding products of two binomials
factorising quadratic expressions of the form x2
+ bx + c,
including the difference of two squares
simplifying expressions involving sums, products and
powers, including the laws of indices.
Teaching Guidance
Students should be able to:
understand that algebra can be used to generalise the laws of arithmetic
manipulate an expression by collecting like terms
write expressions to solve problems
write expressions using squares and cubes
factorise algebraic expressions by taking out common factors
multiply two linear expressions, such as (x a)(x b) and (cx a)(dx b), for example (2x + 3)(3x 4)
multiply a single term over a bracket, for example, a(b + c) = ab + ac
know the meaning of and be able to simplify, for example 3x 2 + 4(x + 5)
know the meaning of and be able to factorise, for example 3x 2y 9y or 4x 2 + 6xy
factorise quadratic expressions using the sum and product method, or by inspection (FOIL)
factorise quadratics of the form x 2 + bx + c
factorise expressions written as the difference of two squares of the form x 2 – a2
use the index laws for multiplication and division of integer powers.
simplify algebraic expressions, for example by cancelling common factors in fractions or using index laws.

GCSE MATHEMATICS 8300 TEACHING GUIDANCE
Version 2.0 43
Examples
1 Expand and simplify 3(a 4) + 2(2a + 5)
2 Factorise 6w 8y
3 Expand and simplify (3a 2b)(2a + b)
4 This rectangle has dimensions as shown.
The perimeter of the rectangle is 68 centimetres.
Use this information to form and solve an equation to work out the dimensions of the rectangle.
5 The base of a triangle is three times its height.
The area of the triangle is 75 cm 2
Work out the length of the base of the triangle.
6 (a) Simplify x 2 x 4
(b) Simplify x 16 ÷ x 4
7 A rectangle has base (2x + 1) cm and width (3x – 2) cm
(a) Explain why the value of x cannot be 3
2
(b) Work out the area of the rectangle when x = 7
8 Factorise
(a) y 2 9
(b) k 2 m 2
9 Simplify 3x + 5 x 4
3x 1cm
2x cm
Not drawn accurately

44 Version 2.0
10 Expand and simplify 2(3x 5) + 3(5x + 7)
11 Factorise 12x 2 + 8x
12 Factorise 15xy 2 2x 2y
13 Simplify 3a 2b + 5a + 9b
14 Simplify
3
18x
15 Simplify fully
4
75
x
xx
16 The expression 7(x + 4) 3(x 2) simplifies to a(2x + b)
Work out the values of a and b.
17 Factorise x 2 7x + 10
18 Expand 22ba
19 Expand xx 3
20 Simplify
(a) 2a2 3a3
(b) 12x5 4x2
(c) 325y

GCSE MATHEMATICS 8300 TEACHING GUIDANCE
Version 2.0 45
A4h
Simplify and manipulate algebraic expressions (including
those involving surds and algebraic fractions) by:
collecting like terms
multiplying a single term over a bracket
taking out common factors
expanding products of two or more binomials
factorising quadratic expressions of the form
x2
+ bx + c, including the difference of two squares;
factorising quadratic expressions of the form
ax2
+ bx + c
simplifying expressions involving sums, products and
powers, including the laws of indices.
Teaching Guidance
Students should be able to:
multiply two or more binomial expressions
factorise quadratic expressions of the form ax 2 + bx + c
simplify by factorising and cancelling expressions of the form fexdx
cbxax
2
2
Notes
Students should know that
cx
bx
has no value when x = c
x 2 + a has values ⩾ a for all x
Examples
1 Expand and simplify (2x + 3)(3x 4)(5x + 6)
2 Expand (x2 + 6)(4x – 5y)
3 Factorise 6h 2 23h 18

46 Version 2.0
4 (a) Factorise 2n 2 + 5n + 3
(b) Hence, or otherwise, write 253 as the product of two prime factors.
5 Write as a single fraction
x x
x x
6 4
3 1 2 3
6 By factorising fully, simplify
x x -
x -
2
2
3 14 5
2 50
7 Factorise 4x 2 9
8 Expand and simplify yxyx
9 Simplify
(a) 345xy
(b) 18a2 6a1

GCSE MATHEMATICS 8300 TEACHING GUIDANCE
Version 2.0 47
A5 Understand and use standard mathematical formulae;
rearrange formulae to change the subject
Teaching Guidance
Students should be able to:
understand and use formulae from maths and other subjects expressed initially in words and then using letters and symbols. For example formula for area of a triangle, area of a parallelogram, area of a circle, volume of a prism, conversions between measures, wage earned = hours worked hourly rate + bonus
change the subject of a formula.
Notes
Including use of formulae from other subjects in words and using symbols.
Questions will include geometrical formulae and questions involving measures.
Questions will include formulae for generating sequences and formulae in words using a functional context (for example formula for cooking a turkey) and formulae out of context. For example substitute
positive and negative numbers into expressions such as 3x 2 + 4, 2x 3 and 2
35 )( yx
At Higher tier, when changing the subject of a formula, the subject may appear more than once.
See A2
Examples
1 Work out the perimeter of a semicircle of diameter 8 cm
2 Rearrange y = 2x + 3 to make x the subject.
3 Rearrange C = 2πr to make r the subject.
4 Rearrange A = r2 to make r the subject.
5 Rearrange y =
2
43
x
x to make x the subject (Higher tier only)

48 Version 2.0
A6 Know the difference between an equation and an
identity; argue mathematically to show algebraic
expressions are equivalent, and use algebra to support
and construct arguments
Teaching Guidance
Students should be able to:
recognise that, for example, 5x + 5 = 16 is an equation, but 5x + 5 5(x + 1) is an identity
show that two expressions are equivalent
use identities including equating coefficients
use algebraic expressions to support an argument or verify a statement.
Notes
Arguments may use knowledge of odd and even, for example odd even = even
Students should understand that, for example, if n is an integer then 2n is even and 2n + 1 is odd.
Examples
1 Work out the values of a and b in the identity 2(ax 5) + 3(5x + b) 21x + 2
2 Show that 3(a 4) + 2(2a + 5) + 9 and 7(a + 1) are equivalent.
3 w is an even number.
Explain why (w 1)(w + 1) will always be odd.
4 Sam says that when m 1, m 3 + 2 is never a multiple of 3
Give an example to show that she is wrong.

GCSE MATHEMATICS 8300 TEACHING GUIDANCE
Version 2.0 49
A6h Know the difference between an equation and an
identity; argue mathematically to show algebraic
expressions are equivalent, and use algebra to support
and construct arguments and proofs
Teaching Guidance
Students should be able to:
construct rigorous proofs to validate a given result.
Notes
Students should be familiar with the term ‘consecutive’.
Examples
1 Alice says that the sum of three consecutive numbers will always be even.
Explain why she is wrong.
2 Prove that the product of three consecutive positive integers must always be a multiple of 6
3 n is a positive integer.
Explain why n(n + 1) must be an even number.
4 Prove that the square of any odd number is always one more than a multiple of 8
5 (a) Show that 3
52 x +
2
13 x simplifies to
6
713 x
(b) Hence solve 3
52 x +
2
13 x = 8
6 Prove that (2x + 3) 2 3x(x + 4) is always positive.

50 Version 2.0
A7 Where appropriate, interpret simple expressions as
functions with inputs and outputs
Teaching Guidance
Students should be able to:
understand and use number machines
interpret an expression diagrammatically using a number machine
interpret the operations in a number machine as an expression or function.
Examples
1
Write down the output y as an expression in terms of x.
2 Complete the number machine so that y = 3x + 7
3
(a) Work out the output when the input is 1
(b) Work out the input when the output is 5
4 Work out the value of x.
5 8 x y
Input Output
x y
Input Output
4 ÷ 2 x y
Input Output
6 5 x y
Input Output

GCSE MATHEMATICS 8300 TEACHING GUIDANCE
Version 2.0 51
A7h
Where appropriate, interpret simple expressions as
functions with inputs and outputs; interpret the reverse
process as the ‘inverse function’; interpret the
succession of two functions as a ‘composite function’
Teaching Guidance
Students should be able to:
understand that a function is a relationship between two sets of values
understand and use function notation, for example f(x)
substitute values into a function, knowing that, for example f(2) is the value of the function when x = 2
solve equations that use function notation
understand, interpret and use composite function fg(x)
understand, interpret and use inverse function f 1 (x)
Examples
1 Given that f(x) = 4x 5 work out
(a) f(6)
(b) f(0.5)
2 f(x) = 3x + 2
Solve f(x) = 0
3 f(x) = x 2 + 3x 6
(a) Write down an expression for f(2x)
(b) Solve f(2x) = 0
Give your answer to 2 decimal places.
4 f(x) =
x
3 + 5, g(x) = x2
(a) Work out the value of fg(4)
(b) Work out an expression for f 1 (x)

52 Version 2.0
5 f(x) = 5x + 1, g(x) = x2
(a) Write down fg(x)
(b) Work out the values of x for which fg(x) = gf(x)
6 f(x) = x2 1
Show that f(x + 2) can be written in the form (x + a)(x + b) where a and b are integers.
GCSE MATHEMATICS 8300 TEACHING GUIDANCE
Version 2.0 53
5
Algebra – Graphs
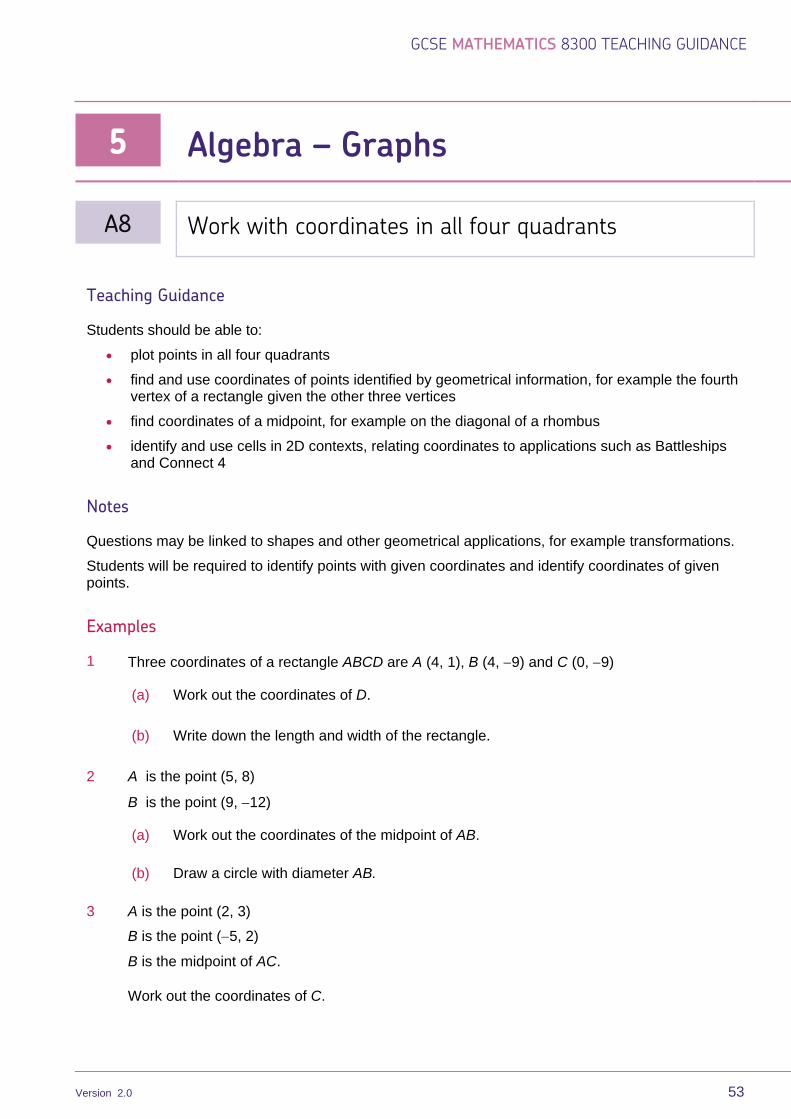
A8 Work with coordinates in all four quadrants
Teaching Guidance
Students should be able to:
plot points in all four quadrants
find and use coordinates of points identified by geometrical information, for example the fourth vertex of a rectangle given the other three vertices
find coordinates of a midpoint, for example on the diagonal of a rhombus
identify and use cells in 2D contexts, relating coordinates to applications such as Battleships and Connect 4
Notes
Questions may be linked to shapes and other geometrical applications, for example transformations.
Students will be required to identify points with given coordinates and identify coordinates of given points.
Examples
1 Three coordinates of a rectangle ABCD are A (4, 1), B (4, 9) and C (0, 9)
(a) Work out the coordinates of D.
(b) Write down the length and width of the rectangle.
2 A is the point (5, 8)
B is the point (9, 12)
(a) Work out the coordinates of the midpoint of AB.
(b) Draw a circle with diameter AB.
3 A is the point (2, 3)
B is the point (5, 2)
B is the midpoint of AC.
Work out the coordinates of C.

54 Version 2.0
A9 Plot graphs of equations that correspond to straight-line
graphs in the coordinate plane; use the form y = mx + c to identify parallel lines; find the equation of the line
through two given points, or through one point with a
given gradient
Teaching Guidance
Students should be able to:
recognise that equations of the form y = mx + c correspond to straight-line graphs in the coordinate plane
draw graphs of functions in which y is given explicitly or implicitly in terms of x
complete tables of values for straight-line graphs
calculate the gradient of a given straight-line given two points or from an equation
manipulate the equations of straight lines so that it is possible to tell whether lines are parallel or not
work out the equation of a line, given two points on the line or given one point and the gradient.
Notes
Tables of values may or may not be given.
See A10
Examples
1 Draw the graph of y = 3x 1 (both with and without a table of values).
2 Draw the graph of x + 2y = 10
3 Show clearly that the lines 2x + y = 5 and 4x = 3 2y are parallel.
4 A has coordinates (3, 5). B has coordinates (6, 7)
Work out the equation of the straight line AB.
GCSE MATHEMATICS 8300 TEACHING GUIDANCE
Version 2.0 55
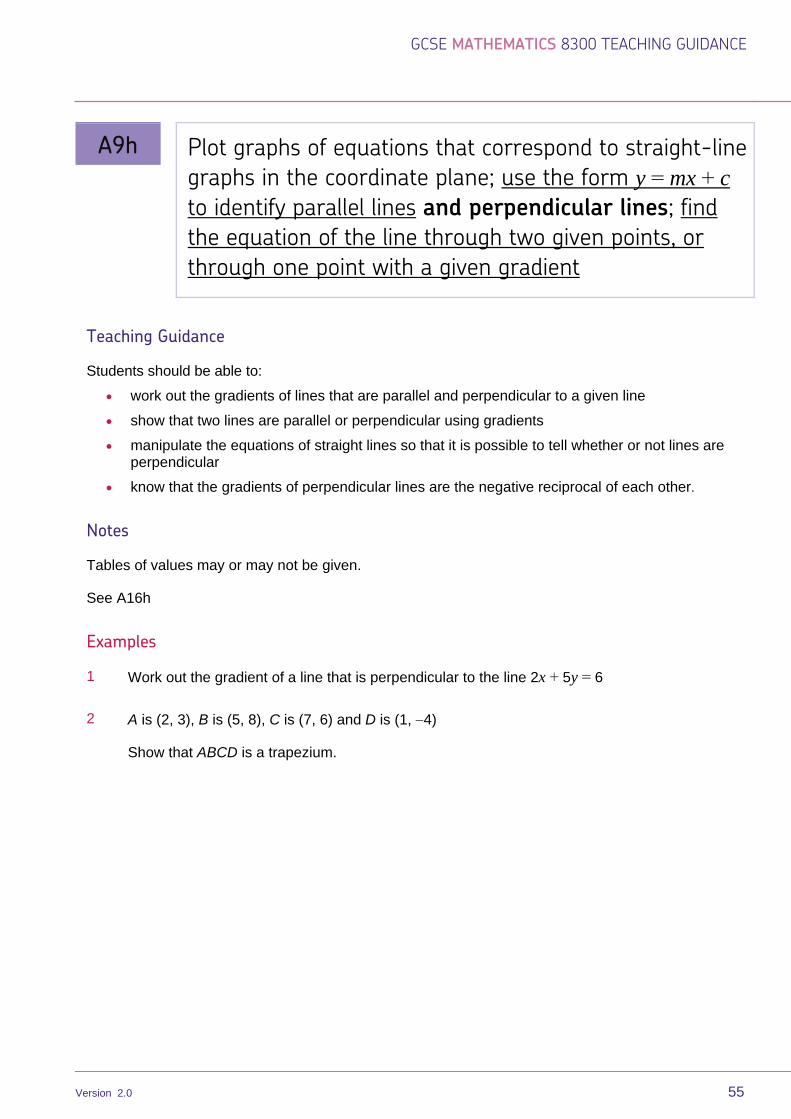
A9h Plot graphs of equations that correspond to straight-line
graphs in the coordinate plane; use the form y = mx + c to identify parallel lines and perpendicular lines; find
the equation of the line through two given points, or
through one point with a given gradient
Teaching Guidance
Students should be able to:
work out the gradients of lines that are parallel and perpendicular to a given line
show that two lines are parallel or perpendicular using gradients
manipulate the equations of straight lines so that it is possible to tell whether or not lines are perpendicular
know that the gradients of perpendicular lines are the negative reciprocal of each other.
Notes
Tables of values may or may not be given.
See A16h
Examples
1 Work out the gradient of a line that is perpendicular to the line 2x + 5y = 6
2 A is (2, 3), B is (5, 8), C is (7, 6) and D is (1, 4)
Show that ABCD is a trapezium.

56 Version 2.0
A10 Identify and interpret gradients and intercepts of linear
functions graphically and algebraically
Teaching Guidance
Students should be able to:
recognise that equations of the form y = mx + c correspond to straight-line graphs in the coordinate plane with gradient m and y-intercept at (0, c).
work out the gradient and the intersection with the axes.
Notes
See A9
Examples
1 y + 6x = 2
Write down the gradient and the coordinates of the y-intercept.
2 For a given straight-line graph (such as y = 3x 1 or x + 2y = 10), work out the gradient of the line.
GCSE MATHEMATICS 8300 TEACHING GUIDANCE
Version 2.0 57
A11 Identify and interpret roots, intercepts, and turning
points of quadratic functions graphically; deduce roots
algebraically
Teaching Guidance
Students should be able to:
interpret quadratic graphs by finding roots, intercepts and turning points.
Notes
Including the symmetrical property of a quadratic.
Students will be expected to know that the roots of an equation f(x) = 0 can be found where the graph of the function intersects the x-axis.
See A18
Examples
1 The graph of y = x 2 + 2x – 8 is drawn.
(a) Use the graph to write down the solutions to x 2 + 2x – 8 = 0
(b) Write down the coordinates of the turning point.
2 (a) Draw the graph of y = x 2 + 2x – 1 for values of x from 3 to 3
(b) Write down the equation of the line of symmetry of the graph.
(c) Write down the coordinates of the turning point.
(d) Using your graph, write down the roots of x 2 + 2x 1 = 0
58 Version 2.0
A11h Identify and interpret roots, intercepts, turning points of
quadratic functions graphically; deduce roots
algebraically and turning points by completing the
square
Teaching Guidance
Students should be able to:
complete the square
deduce turning points by completing the square.
Examples
1 (a) Write x 2 + 2x 8 in the form (x + a) 2 + b
(b) Write down the coordinates of the turning point of the curve y = x 2 + 2x 8
2 (a) Write 2x 2 – 12x + 23 in the form a(x – b) 2 + c
(b) Write down the coordinates of the turning point on the curve y = 2x 2 12x + 23
GCSE MATHEMATICS 8300 TEACHING GUIDANCE
Version 2.0 59
A12 Recognise, sketch and interpret graphs of linear
functions, quadratic functions, simple cubic functions
and the reciprocal function, y = x
1
with x ≠ 0
Teaching Guidance
Students should be able to:
draw, sketch, recognise and interpret linear functions
calculate values for a quadratic and draw the graph
draw, sketch, recognise and interpret quadratic graphs
draw, sketch, recognise and interpret graphs of the form y = x 3 + k where k is an integer
draw, sketch, recognise and interpret the graph y = x
1 with x 0
find an approximate value of y for a given value of x, or the approximate values of x for a given value of y.
Notes
Linear graphs should be drawn with a ruler.
Other graphs should be drawn as smooth curves. As a minimum requirement students should plot coordinates for integer values of x.
Including using the symmetry of graphs.
See A14, G21
Examples
1 Link each function with its sketch.
(Four functions and four sketches given)
2 Sketch the function y = x
1 for 2 ⩽ x ⩽ 2, x ≠ 0
3 (a) Draw the graph of y = x2 for values of x between 3 and 3
(b) Use the graph to find the approximate values of x when y = 3
4 Draw the graph of y = x2 – 4x + 3 for 3 ⩽ x ⩽ 3

60 Version 2.0
A12h
Recognise, sketch and interpret graphs of linear
functions, quadratic functions, simple cubic functions,
the reciprocal function, y = x
1
with x ≠ 0, exponential
functions y = k x for positive values of k, and the
trigonometrical functions (with arguments in
degrees) y = sin x, y = cos x and y = tan x for angles
of any size
Teaching Guidance
Students should be able to:
draw, sketch, recognise and interpret graphs of the form y = k x for positive values of k
know the shapes of the graphs of functions y = sin x , y = cos x and y = tan x
Notes
Students would be expected to sketch a graph of y = sin x, y = cos x and y = tan x between 0° and 360°, and know that the maximum and minimum values for sin and cos are 1 and –1
They would also be expected to know that the graphs of sin, cos and tan are periodic.
Graphs should be drawn as smooth curves.
Examples
1 Link each function with its sketch.
(Four functions and four sketches given)
2 Draw the graph of y = 3x2 x 2 for 2 ⩽ x ⩽ 2
3 (a) Draw a graph of y = cos x for values of x from 0° to 180°, having completed a table at 30° intervals.
(b) Identify the solutions of cos x = –0.5 between 0° and 360° using symmetry.
4 Apply trigonometric graphs in appropriate context, eg tide heights.
5 Draw the graph of y = 2x for 0 ⩽ x ⩽ 4
6 Draw the graph of y =
2
1 x for 0 ⩽ x ⩽ 3

GCSE MATHEMATICS 8300 TEACHING GUIDANCE
Version 2.0 61
A13h
Sketch translations and reflections of a given
function
Teaching Guidance
Students should be able to:
transform the graph of any function f(x) including: f(x) + a, f(x + b), f(x) and f(x) where a and b are integers
recognise transformations of functions and be able to write down the function of a transformation given the original function.
Notes
For example, transformations of the graphs of linear and quadratic functions and of trigonometric functions based on y = sin x and y = cos x for 0 ⩽ x ⩽ 360 may be assessed.
Examples
1 On the axes, sketch the graph of y = x 2 + 2
(Graph of y = x 2 given as a dotted line)
2 Write down the equations of these graphs.
(Four sketches given, all of which are transformations of y = f(x))
3 The graph y = sin x is drawn.
On the same axes, sketch the graphs of y = 2 + sin x , y = sin (x 90), y = sin x and y = sin(x)

62 Version 2.0
A14 Plot and interpret graphs (including reciprocal graphs)
and graphs of non-standard functions in real contexts,
to find approximate solutions to problems such as
simple kinematic problems involving distance, speed and
acceleration
Teaching Guidance
Students should be able to:
plot a graph representing a real-life problem from information given in words, in a table or as a formula
identify the correct equation of a real-life graph from a drawing of the graph
read from graphs representing real-life situations; for example, work out the cost of a bill for so many units of gas or the number of units for a given cost, and also understand that the intercept of such a graph represents the fixed charge
interpret linear graphs representing real-life situations; for example, graphs representing financial situations (eg gas, electricity, water, mobile phone bills, council tax) with or without fixed charges, and also understand that the intercept represents the fixed charge or deposit
plot and interpret distance-time graphs
interpret line graphs from real-life situations, for example conversion graphs
interpret graphs showing real-life situations in geometry, such as the depth of water in containers as they are filled at a steady rate
interpret non-linear graphs showing real-life situations, such as the height of a ball plotted against time.
Notes
Including problems requiring a graphical solution.
See A12
Examples
1 The cost of hiring a bike is given by the formula C = 8d + 10, where d is the number of days for which the bike is hired and C (£) is the total cost of hire.
Draw the graph C = 8d + 10
2 For the above graph, what was the deposit required for hiring the bike?

GCSE MATHEMATICS 8300 TEACHING GUIDANCE
Version 2.0 63
3 Another shop hires out bikes where the cost of hire is given by the formula C = 5d + 24
Josh says that the first shop is always cheaper if you want to hire a bike.
Is he correct?
Give reasons for your answer.
4 The cost of hiring a floor-sanding machine is worked out as follows:
Fixed charge = £28
Cost per day = £12
Draw a graph to work out the cost of hiring the machine for six days.
5 Another firm hires out a floor-sanding machine for £22 fixed charge, plus the cost of the first two days at £20 per day, then £8 for each additional day.
Draw a graph on the same axes as the one above to show the cost of hiring the machine for six days.
Which firm would you use to hire the floor-sanding machine for five or more days?
Give reasons for your answer.
6 Draw and interpret a distance-time graph for a car journey.
For how long was the car stopped?
7 Water is being poured at a steady rate into a cylindrical tank.
On given axes, sketch a graph showing depth of water against time taken.
8 5 miles = 8 kilometres.
Draw a suitable graph on the grid provided and use it to convert 43 miles to kilometres.
9 Here is a conversion graph for °C and °F (graph given).
What temperature has the same numerical value in both °C and °F?
10 For this container (image of a container provided), sketch on the grid below the graph of height, h, against time, t, as the water is poured into the container at a constant rate.
11 Four images of different-shaped containers and four different sketches of curves are provided.
Match each container to the correct curve, showing the height of water as the containers are filled at a constant rate.
12 Sketch the graph of volume, V, against time, t, as water flows out of a container at a constant rate (with diagram given).

64 Version 2.0
A14h
Plot and interpret graphs (including reciprocal graphs
and exponential graphs) and graphs of non-standard
functions in real contexts, to find approximate solutions
to problems such as simple kinematic problems involving
distance, speed and acceleration
Teaching Guidance
Students should be able to:
draw an exponential graph
understand the main features of an exponential graph.
Examples
1 Draw the graph of y = 2x for values of x from 3 to 3
2 Draw the graph of y = 100 2x for values of x from 0 to 6
3 The height, h metres, of a particle at time, t seconds, is given by the function
h = 3 0 ⩽ t 1
h = t2 + 2 1⩽ t ⩽ 3
(a) Draw a graph to show the height of the particle in the first 3 seconds.
(b) Work out the time when the height is 8 metres.
GCSE MATHEMATICS 8300 TEACHING GUIDANCE
Version 2.0 65
A15h
Calculate or estimate gradients of graphs and areas
under graphs (including quadratic and other
non-linear graphs), and interpret results in cases
such as distance-time graphs, velocity-time graphs
and graphs in financial contexts
Teaching Guidance
Students should be able to:
calculate the area under a graph consisting of straight lines
estimate the gradient at a point on a curve by drawing a tangent at that point and working out its gradient
interpret the meaning (and give the units) of the gradient at a point on a curve
use the areas of trapezia, triangles and rectangles to estimate the area under a curve
interpret the meaning of the area calculated as the product of the units of the variable on the vertical axis and the units of the variable on the horizontal axis.
Notes
The trapezium rule need not be known but it is recommended as the most efficient means of calculating the area under a curve.
Students should know that the area under a speed-time graph represents distance.
Students should know that if the vertical axis represents distance on a distance-time graph, then the gradient will represent speed.
Students should know that if the vertical axis represents velocity on a velocity-time graph, then the gradient will represent acceleration.
Students should understand the difference between positive and negative gradients as increasing speed and decreasing speed on a distance-time graph.
Students should know that the rate of change at a particular instant in time is represented by the gradient of the tangent to the curve at that point.
See A14, R14, R15h

66 Version 2.0
Examples
1 The graph shows the speed of a car between two sets of traffic lights.
It achieves a maximum speed of v metres per second.
It travels for 50 seconds.
The distance between the traffic lights is 625 metres.
Calculate the value of v.
2 The graph shows the speed of a train between two stations.
Calculate the distance between the stations.
Not drawn accurately
Speed (m/s)
0 20 40 50 0
Time (s)
Speed (m/s)
0 20 40 50
50
0
Time (s)
Not drawn accurately
v

GCSE MATHEMATICS 8300 TEACHING GUIDANCE
Version 2.0 67
3 The graph shows the speed-time graph of a car.
(Drawn on graph paper with axes and values clearly marked)
Use the graph to work out
(a) The maximum speed of the car.
(b) The total distance travelled.
(c) The average speed for the journey.
(d) The deceleration of the car after 8 seconds.
Time
Speed

68 Version 2.0
4 The graph shows the speed of a car between two sets of traffic lights.
It achieves a maximum speed of v metres per second.
It travels for 50 seconds.
(a) Calculate the acceleration of the car during the first 4 seconds.
(b) Describe how the motion of the car changes at the end of the tenth second.
(c) The car decelerates for the last t seconds of the motion.
The distance travelled whilst decelerating is 75 metres.
Show that tv = 150
(d) The distance travelled at constant speed is 450 metres.
Show that 40v tv = 450
(e) Hence, or otherwise, find the total distance between the two sets of traffic lights.
Time (s)
Speed (m/s)
0 4 10 50
( )
v
10
0
t

GCSE MATHEMATICS 8300 TEACHING GUIDANCE
Version 2.0 69
5 The graph shows the height of a firework rocket above the ground plotted against time after
take-off.
(a) Use the graph to find the greatest height reached by the rocket.
(b) How long is the rocket moving upwards?
(c) When is the rocket rising at its fastest speed?
Height (metres)
Time (seconds)
70 Version 2.0
A16h
Recognise and use the equation of a circle with
centre at the origin; find the equation of a tangent
to a circle at a given point
Teaching Guidance
Students should be able to:
recognise the equation of a circle, centre (0, 0), radius r
write down the equation of a circle, centre (0, 0) and radius r
work out coordinates of points of intersection of a given circle and a given straight line
use the fact that the angle between the tangent and radius is 90° to work out the gradient of a tangent and hence the equation of a tangent at a given point.
Notes
Students are expected to know the definitions of common words associated with circles.
Students may need to apply circle geometry facts.
See A9h
Examples
1 The equation of a circle is x 2 + y 2 = 2
(a) Write down the coordinates of the centre of the circle.
(b) Write down the exact value of the radius of the circle.
2 Write down the equation of a circle, centre (0, 0) and radius 5

GCSE MATHEMATICS 8300 TEACHING GUIDANCE
Version 2.0 71
3 The circle x 2 + y 2 = 10 and the line y = x 2 intersect at points A and B as shown.
Work out the length of the chord AB.
4 P is the point (1, 2) on the circle x2 + y2 = 5
Work out the equation of the tangent to the circle at P.
x
y
A
B
x
y
P (1, 2)
Not drawn accurately
Not drawn accurately
O
O

72 Version 2.0
6
Algebra – Solving equations and
inequalities
A17 Solve linear equations in one unknown algebraically
(including those with the unknown on both sides of the
equation); find approximate solutions using a graph
Teaching Guidance
Students should be able to:
solve simple linear equations by using inverse operations or by transforming both sides in the same way
solve simple linear equations with integer coefficients where the unknown appears on one or both sides of the equation or where the equation involves brackets.
Notes
Including use of brackets.
Questions may have solutions that are negative or involve a fraction.
Questions may be set with or without a context.
Examples
1 Solve 4x 11 = 3
2 Solve 4x 1 = x + 4
3 Solve 5x 4 = 2(x + 1)
4 The graph of y = 8x 5 is shown.
Use the graph to write down the solution of 8x 5 = 0
Give your answer to 1 decimal place.

GCSE MATHEMATICS 8300 TEACHING GUIDANCE
Version 2.0 73
A18 Solve quadratic equations algebraically by factorising;
find approximate solutions using a graph
Teaching Guidance
Students should be able to:
solve quadratic equations by factorising
read approximate solutions to a quadratic equation from a graph.
Notes
Students should know that trial and improvement is not an acceptable method for solving quadratic equations.
Students should be able to choose or interpret answers to a geometrical problem, for example rejecting a negative solution as a length.
Students should know that the roots of an equation f(x) = 0 can be found where the graph of the function intersects the x-axis.
See A11
Examples
1 Solve x 2 7x + 10 = 0
2 The graph of y = x 2 + x – 3 is shown.
Write down the approximate solutions of x 2 + x – 3 = 0
74 Version 2.0
A18h
Solve quadratic equations (including those that require
rearrangement) algebraically by factorising, by
completing the square and by using the quadratic
formula; find approximate solutions using a graph
Teaching Guidance
Students should be able to:
solve quadratic equations by factorising, completing the square or using the quadratic formula
solve geometry problems that lead to a quadratic equation that can be solved by using the quadratic formula
read approximate solutions from a graph.
Notes
Students should know that trial and improvement is not an acceptable method for solving quadratic equations.
Solutions to quadratic equations, using the quadratic formula or by completing the square, may be left in surd form where appropriate.
Students should know that the roots of an equation f(x) = a can be found where y = a intersects with y = f(x)
Examples
1 Expressions for the side lengths of a rectangle are 2x 2 cm and 9x cm
The perimeter is 10 cm
Work out the area of the rectangle.
Give your answer to a suitable degree of accuracy.
2 Solve x 2 2x 1 = 0
Give your solutions to 2 decimal places.
3 Write x 2 + 4x – 9 in the form (x + a) 2 – b
Hence, or otherwise, solve the equation x 2 + 4x – 9 = 0, giving answers to 2 decimal places.
4 Solve the equation 12
4
x
1
1
x = 1
5 Solve 5x 2 + 13x 6 = 0
GCSE MATHEMATICS 8300 TEACHING GUIDANCE
Version 2.0 75
6 Solve (x + 4) (x – 6) = 3x
7 (a) Find the values of a and b such that x 2 + 6x 3 (x + a) 2 + b
(b) Hence, or otherwise, solve the equation x 2 + 6x 3 = 0
Give your answers in surd form.
8 Solve x
1 + 1
1
x = 1
9 The graph of y = 2x2 – 5x + 3 is shown.
By drawing an appropriate line on the grid write down the approximate solutions of 2x2 – 5x + 1 = 0

76 Version 2.0
A19 Solve two simultaneous equations in two variables
(linear / linear) algebraically; find approximate solutions
using a graph
Teaching Guidance
Students should be able to:
solve simultaneous linear equations by elimination or substitution or any other valid method
find approximate solutions using the point of intersection of two straight lines.
Examples
1 Solve the simultaneous equations
2x + 3y = 7
x + 3y = 2
You must show your working.
Do not use trial and improvement.
2 x + y = 25
x – y = 4
Work out the values of x and y.
3 The graph of y = 3x – 6 is shown.
(a) Draw the graph of y = x – 1 on the same grid.
(b) Use the graph to write down approximate solutions of the simultaneous equations y = 3x – 6 and x = y + 1
GCSE MATHEMATICS 8300 TEACHING GUIDANCE
Version 2.0 77
A19h Solve two simultaneous equations in two variables
(linear / linear or linear / quadratic) algebraically; find
approximate solutions using a graph
Teaching Guidance
Students should be able to:
solve simultaneous equations when one is linear and the other quadratic
appreciate that the solution of f(x) = ax + b is found where y = ax + b intersects with y = f(x)
eg the points of intersection of the graphs of y = x 2 + 3x – 10 and y = 2x + 1 are the solutions
to the equation x 2 + 3x 10 = 2x + 1 or x2 + x – 11 = 0
Notes
Questions may include geometrical problems, problems set in context and questions requiring a graphical solution.
These may lead to a quadratic equation that can be solved by factorising, but may also lead to a quadratic equation that can be solved graphically to find approximate solutions, or by using the quadratic formula.
Examples
1 Solve the simultaneous equations y = 11x 2
y = 5x 2
Do not use trial and improvement.
You must show your working.
2 A straight line has the equation y = 2x 3
A curve has the equation y 2 = 8x 16
Solve these simultaneous equations to find any points of intersection of the line and the curve.
Do not use trial and improvement.
You must show all your working.
3 The graph of y = x 2 + 2x – 8 is drawn.
On the same grid draw the graph of y = 2x – 3
(a) Use the graph to write down the solutions to x 2 + 2x – 8 = 2x – 3
(b) Show that the solutions are x = ± 5
You must show your working.

78 Version 2.0
4 The graph of y = x 2 + 5 is drawn.
Use the graph to find solutions to x 2 + 5 = x + 8

GCSE MATHEMATICS 8300 TEACHING GUIDANCE
Version 2.0 79
A20h Find approximate solutions to equations numerically
using iteration
Teaching Guidance
Students should be able to:
use a systematic method to find approximate solutions of equations where there is no simple analytical method
use suffix notation in recursive formulae
find approximate solutions using recursive formulae.
Notes
Students will be expected to test the mid-value of the one decimal place interval to establish which one decimal place value is nearest to the solution.
Examples
1 A solid has volume V = x3 + 2x2
The volume of the solid is 90 cm 3
Work out the value of x to 1 decimal place.
You must show your working.
2 xn + 1 = 3
nx
1
Use a starting value of x1 = 1 to find a solution to x = 3 x
1 to 1 decimal place.
3 Find an approximate solution to x2 4x + 1 = 0 using the iteration xn + 1 =
4
1
nx
Start with x1 = 1
Give your answer to 4 significant figures.

80 Version 2.0
A21 Translate simple situations or procedures into algebraic
expressions or formulae; derive an equation (or two
simultaneous equations), solve the equation(s) and
interpret the solution
Teaching Guidance
Students should be able to:
set up simple linear equations
rearrange simple linear equations
set up simple linear equations to solve problems
set up a pair of simultaneous linear equations to solve problems
interpret solutions of equations in context.
Notes
Including the solution of geometrical problems and problems set in context.
Questions may include geometrical problems, problems set with or without a context, and questions requiring a graphical solution.
Examples
1 The angles of a triangle (diagram provided) are 2x, x + 30 and x + 70
Work out the value of x.
2 The cost of three adult tickets and two child tickets is £73
The cost of two adult tickets and five child tickets is £89
Work out the cost of an adult ticket and the cost of a child ticket.
3 The sum of two numbers is 25
The difference between the numbers is 4
Work out the two numbers.
4 Jo is three years older than twice Sam's age.
The sum of their ages is 33
Find Jo's age.

GCSE MATHEMATICS 8300 TEACHING GUIDANCE
Version 2.0 81
5 Two of the angles in a parallelogram are x and (x – 32°)
Work out the size of the larger angle.
6 The diagram shows a parallelogram and a trapezium.
Work out the values of x and y.
Not drawn accurately
4x
12y 5x°
6y°

82 Version 2.0
A22 Solve linear inequalities in one variable; represent the
solution set on a number line
Teaching Guidance
Students should be able to:
know the difference between , ⩽, ⩾, and
solve simple linear inequalities in one variable
represent the solution set of an inequality on a number line, knowing the correct conventions of an open circle for a strict inequality eg x 3 and a closed circle for an inclusive inequality eg x ⩽ 3
Notes
See N1
Examples
1 Show the inequality 4 x ⩽ 2 on a number line.
2 Solve the inequality 2x 7 ⩽ 3 and represent the solution set on a number line.
3 Write down all the integers that satisfy the inequality 12 ⩽ 3n 6

GCSE MATHEMATICS 8300 TEACHING GUIDANCE
Version 2.0 83
A22h Solve linear inequalities in one or two variables and
quadratic inequalities in one variable; represent the
solution set on a number line, using set notation and
on a graph
Teaching Guidance
Students should be able to:
represent these inequalities on a given coordinate grid
shade out the side of the boundary line that does not satisfy the inequality
solve quadratic inequalities
understand and use a solution set of discrete values written in the form { 2, 1, 0, 1, 2 }
understand and use a solution set of continuous values written in the form 3 x 3
Notes
Questions will define the necessary conditions, which will lead to inequalities such as x > 1, 2x + 3y ⩽ 12 etc …
When drawing boundary lines students are expected to use
dashed lines for strict inequalities
solid lines for inclusive inequalities.
It is recommended to shade out the side of a boundary line that does not satisfy the inequality, thus leaving the feasible region blank.
Questions may require factorisation of quadratics. Questions may require solution by completing the square, using the quadratic formula or using a graphical method.
Questions may require integer values that satisfy the inequalities.
Questions may ask for the smallest or largest integer value that satisfies the inequality.

84 Version 2.0
Examples
1 Solve 8(x – 7) < 3(x + 2)
2 Work out the solution set of integer values for x of the inequality 4 3x + 2 17
3 Solve 5x 2 + 13x 6 ⩾ 0
4 Write down the solution set of integer values for x2 x 6 0
5 Work out the integer values that satisfy the inequality 4x 2 + 7x 15 < 0
6 Identify the region represented by x ⩽ 7, y ⩾ 4 and y ⩽ x + 3

GCSE MATHEMATICS 8300 TEACHING GUIDANCE
Version 2.0 85
7
Algebra – Sequences
A23 Generate terms of a sequence from either a term-to-
term or a position-to-term rule
Teaching Guidance
Students should be able to:
generate linear sequences
work out the value of the nth term of a linear sequence for any given value of n
generate sequences with a given term-to-term rule
generate a sequence where the nth term is given
work out the value of the nth term of any sequence for any given value of n
generate simple sequences derived from diagrams and complete a table of results that describes the pattern shown by the diagrams
describe how a sequence continues.
Notes
Including from patterns and diagrams.
Examples
1 Write down the first three terms of a sequence where the nth term is given by n 2 + 4
2 The nth term of a sequence is given by 2n + 5
(a) Write down the first three terms.
(b) Work out the 100th term.
(c) Which term has a value of 95?
3 The nth term of a sequence is 17 – 3n
(a) Which term in the sequence is the first one with a negative value?
(b) Work out the value of this term.

86 Version 2.0
A24 Recognise and use sequences of triangular, square and
cube numbers, simple arithmetic progressions,
Fibonacci-type sequences, quadratic sequences and
simple geometrical progressions (r n where n is an
integer and r is a rational number > 0)
Teaching Guidance
Students should be able to:
solve simple problems involving arithmetic progressions
work with Fibonacci-type sequences (rule will be given)
know how to continue the terms of a quadratic sequence
work out the value of a term in a geometrical progression of the form rn where n is an integer > 0
Notes
Other recursive sequences will be defined in the question.
Examples
1 Write down the next two terms in the following quadratic sequence.
7 10 15 22 …..
2 An arithmetic progression starts 3 + 2a, 3 + 4a, 3 + 6a …..
If the fifth term is 73, work out the value of a.
3 A Fibonacci - type sequence is made by adding the first term to double the second term.
The first four terms are 1 2 5 12
Work out the 7th term.
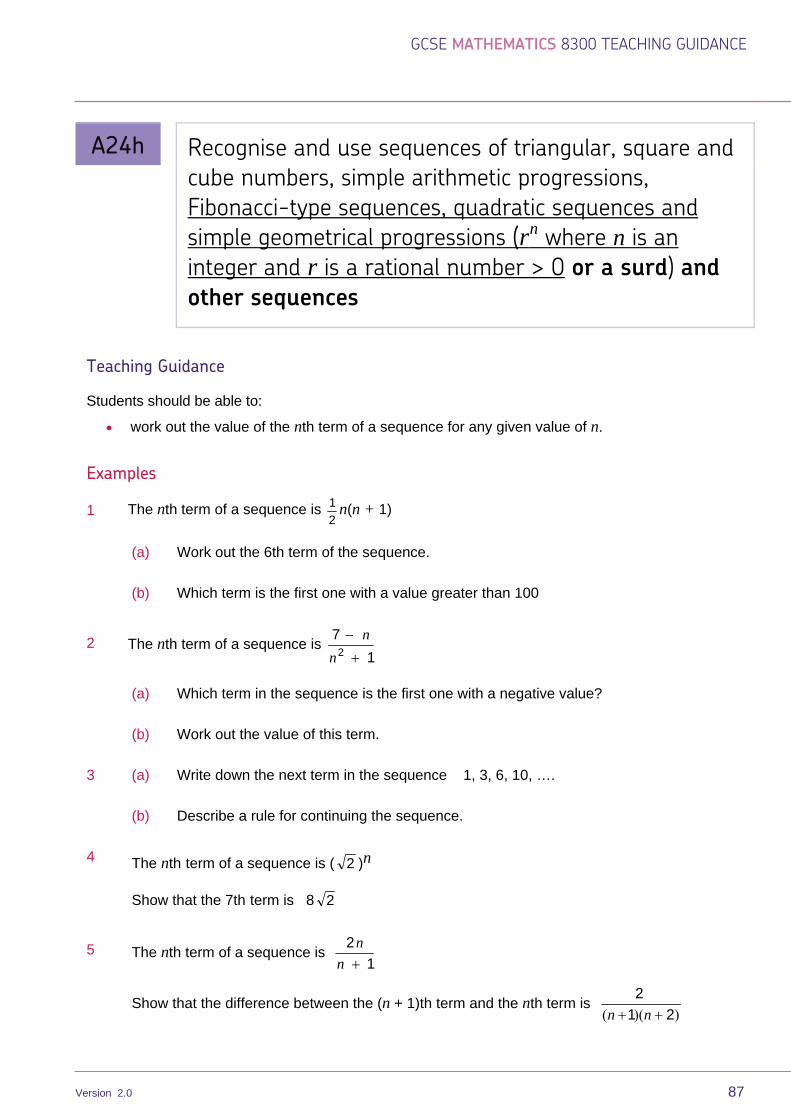
GCSE MATHEMATICS 8300 TEACHING GUIDANCE
Version 2.0 87
A24h Recognise and use sequences of triangular, square and
cube numbers, simple arithmetic progressions,
Fibonacci-type sequences, quadratic sequences and
simple geometrical progressions (r n where n is an
integer and r is a rational number > 0 or a surd) and
other sequences
Teaching Guidance
Students should be able to:
work out the value of the nth term of a sequence for any given value of n.
Examples
1 The nth term of a sequence is 2
1 n(n + 1)
(a) Work out the 6th term of the sequence.
(b) Which term is the first one with a value greater than 100
2 The nth term of a sequence is
1
72
n
n
(a) Which term in the sequence is the first one with a negative value?
(b) Work out the value of this term.
3 (a) Write down the next term in the sequence 1, 3, 6, 10, ….
(b) Describe a rule for continuing the sequence.
4 The nth term of a sequence is ( 2 ) n
Show that the 7th term is 8 2
5 The nth term of a sequence is 1
2
n
n
Show that the difference between the (n + 1)th term and the nth term is ))(( 21
2
nn

88 Version 2.0
A25 Deduce expressions to calculate the nth term of linear
sequences
Teaching Guidance
Students should be able to:
work out a formula for the nth term of a linear sequence
work out an expression in terms of n for the nth term of a linear sequence by knowing that the common difference can be used to generate a formula for the nth term.
Examples
1 Write down an expression for the n th term of the following sequence.
3 7 11 15 …..…
2 (a) Write down an expression for the n th term of following the sequence.
5 8 11 14 …..…
(b) Explain why 61 cannot be a term in this sequence.

GCSE MATHEMATICS 8300 TEACHING GUIDANCE
Version 2.0 89
A25h Deduce expressions to calculate the nth term of linear
and quadratic sequences
Teaching Guidance
Students should be able to:
work out a formula for the nth term of a sequence, which may contain linear or quadratic parts.
Examples
1 Work out the formula for the nth term of the quadratic sequence 5 11 19 29 …..
2 A quadratic sequence starts 3 8 15 24 …..
(a) Show that the nth term is n2 + 2n
(b) Hence find the term that has value 440
3 A linear sequence starts
a + b a + 4b a + 7b a + 10b
The 4th and 7th terms have values 44 and 62
(a) Work out the values of a and b.
(b) Work out the nth term.

90 Version 2.0
8
Ratio, proportion and rates of change
R1 Change freely between related standard units (eg time,
length, area, volume / capacity, mass) and compound
units (eg speed, rates of pay, prices, density, pressure) in
numerical and algebraic contexts
Teaching Guidance
Students should be able to:
convert between metric measures
recall and use conversions for metric measures for length, area, volume and capacity
use conversions between imperial units and metric units using common approximations, for
example 5 miles 8 kilometres, 1 gallon 4.5 litres,
2.2 pounds 1 kilogram, 1 inch 2.5 centimetres
Notes
Any conversions between imperial units and metric units will be stated in the question.
Conversions between capacity and volume will be given in the question.
Examples
1 Use 5 mph = 8 km/h to convert 45 mph into km/h
2 Use 5 miles = 8 kilometres
Emma is on holiday in France and agrees to meet her friend half way along the road between their hotels.
Emma’s car measures distances in miles.
The distance between the hotels is 32 km
How many miles is it to the meeting point?
3 Use 1 pound = 16 ounces and 2.2 pounds = 1 kilogram
A recipe needs 200 grams of flour.
How many ounces of flour are needed?

GCSE MATHEMATICS 8300 TEACHING GUIDANCE
Version 2.0 91
R2 Use scale factors, scale diagrams and maps
Teaching Guidance
Students should be able to:
use and interpret maps and scale drawings
use a scale on a map to work out an actual length
use a scale with an actual length to work out a length on a map
construct scale drawings
use scale to estimate a length, for example use the height of a man to estimate the height of a building where both are shown in a scale drawing
work out a scale from a scale drawing given additional information.
Notes
Including geometrical problems.
Scale could be given as a ratio (for example 1 : 500 000) or as a key (for example 1 cm represents 5 km).
Examples
1 Given the road distance between two ports, use a scale drawing to compare the time taken to travel by car or by boat.
2 Use a scale of 1 : 500 000 to decide how many kilometres are represented by 3 cm on the map.
3 Use accurate measurements to locate a point on a map or scale drawing.

92 Version 2.0
R3 Express one quantity as a fraction of another, where the
fraction is less than 1 or greater than 1
Teaching Guidance
Students should be able to:
work out one quantity as a fraction or decimal of another quantity
use a fraction of a quantity to compare proportions.
Notes
Questions may use a mixture of units.
Answers will be expected in their simplest form.
Examples
1 In a class of 32 students, 15 are boys.
What fraction of the class are girls?
2 The average mark scored in an exam was 54
(a) Jack scored a mark of 42
Write Jack’s mark as a fraction of the average mark.
(b) Bel’s mark as a fraction of the average mark was 2
3
What does this tell you about Bel’s mark?
3 In an examination the average mark was 54
Bel’s mark as a fraction of the average mark was 2
3
Work out Bel’s mark.

GCSE MATHEMATICS 8300 TEACHING GUIDANCE
Version 2.0 93
R4 Use ratio notation, including reduction to simplest form
Teaching Guidance
Students should be able to:
understand the meaning of ratio notation
simplify ratios to their simplest form a : b where a and b are integers
write a ratio in the form 1 : n or n : 1
Examples
1 There are 6 girls and 27 boys in an after-school computer club.
Write the ratio of girls : boys in its simplest form.
2 Write the ratio 15 : 8 in the form n : 1

94 Version 2.0
R5 Divide a given quantity into two parts in a given
part : part or part : whole ratio; express the division of
a quantity into two parts as a ratio; apply ratio to real
contexts and problems (such as those involving
conversion, comparison, scaling, mixing, concentrations)
Teaching Guidance
Students should be able to:
use ratios in the context of geometrical problems, for example similar shapes, scale drawings and problem solving involving scales and measures
interpret a ratio in a way that enables the correct proportion of an amount to be calculated.
use ratio to solve, for example geometrical, algebraic, statistical, and numerical problems
use ratio to solve word problems using informal strategies or using the unitary method of solution
solve best-buy problems using informal strategies or using the unitary method of solution.
Notes
Including better value or best-buy problems.
Examples
1 A recipe for fruit cake uses sultanas and raisins in the ratio 5 : 3
How many grams of sultanas should be used with 150 grams of raisins?
2 Ann, Bob and Carl share £480 in the ratio 1 : 4 : 3
How much should each of them receive?
3 Bill and Phil buy a lottery ticket.
Bill pays 80 p and Phil pays £1.20
They win £6000 and divide the money in the ratio of the amounts they paid.
How much should each of them receive?
4 The ratio of boys to girls in a school is 5 : 6
There are 468 girls in the school.
How many students are there altogether?

GCSE MATHEMATICS 8300 TEACHING GUIDANCE
Version 2.0 95
5 The numbers of coins in two piles are in the ratio 5 : 3
The coins in the first pile are all 2 p coins.
The coins in the second pile are all 5 p coins.
There is 45 p in the second pile.
How much money is in the first pile?
6 Jen and Kim pay for a present for their mum in the ratio 7 : 9
Jen pays £21
How much did the present cost?
7 From a bar chart showing the results for girls (small amount of discrete data):
The ratio of the means for the girls and the boys is 1 : 2
Draw a possible bar chart for the boys.
8 Cola is sold in two packs.
A pack of 20 cans costs £4.99 and a pack of 12 cans costs £2.75
Which pack is better value for money?
You must show your working.

96 Version 2.0
R6 Express a multiplicative relationship between two
quantities as a ratio or a fraction
Teaching Guidance
Students should be able to:
make comparisons between two quantities and represent them as a ratio
compare the cost of items using the unit cost of one item as a fraction of the unit cost of another item.
Examples
1 (Diagram provided)
How many times bigger is the area of shape A than the area of shape B?
2 (Diagram provided)
(a) Work out the ratio area of shape A : area of shape B
(b) What fraction of the area of shape A is the area of shape B?
3 A shopkeeper sells tins of the same dog food in packs of four or packs of six.
Packs of four tins cost £1
Packs of six tins cost £1.20
(a) Express the cost per tin for a pack of four to the cost per tin for a pack of six as a ratio.
Give your answer in its simplest form.
(b) State which pack is better value.
Give a reason for your answer.
4 Two men can mow a meadow in two hours.
(a) Assuming that they mow at the same rate, how long would they take to mow a meadow that is twice as big?
(b) Comment on how the assumption could affect the accuracy of your answer.

GCSE MATHEMATICS 8300 TEACHING GUIDANCE
Version 2.0 97
R7 Understand and use proportion as equality of ratios
Teaching Guidance
Students should be able to:
use equality of ratios to solve problems.
Examples
1 A car travelled 96 miles on two gallons of petrol.
(a) Work out how far it would travel on nine gallons of petrol.
(b) State any assumptions you made.
2 12 pencils cost £1.80
How much would 30 pencils cost?
3 On a model of a building, 4 cm represents a height of 6 m
What height would 14 cm on the model represent?
4 Amy and Ben share sweets in the ratio 3 : 5
Amy has 24 fewer sweets than Ben.
How many sweets are there altogether?
5 I have five more coins than my friend.
The ratio of the number of coins we each have is 4 : 3
How many coins have we got altogether?

98 Version 2.0
R8 Relate ratios to fractions and to linear functions
Teaching Guidance
Students should be able to:
understand the meaning of ratio as a fraction
understand that a line divided in the ratio 1 : 3 means that the smaller part is one-quarter of the whole
represent the ratio of two quantities in direct proportion as a linear relationship and represent the relationship graphically
relate ratios to fractions and use linear equations to solve problems.
Notes
See N11, R14
Examples
1 Grey paint is made by mixing white paint with black paint in the ratio 4 : 1
(a) Represent this information by drawing a straight line graph on the grid (blank grid provided).
(b) Use your graph to estimate the amount of black paint required when using 15 litres of white paint.
2 The ratio of left-handed people to right-handed people in a class is 2 : 19
What fraction of the class are right-handed?
3 The ratio of red balls to blue balls in a bag is 3 : 4
What fraction of the balls are red?
4 A coin is biased.
The ratio of the probability of a head to the probability of a tail is 3 : 5
Work out the probability of a tail.
5 x : y = 1 : 2
(a) Draw the graph of y as a function of x.
(b) Write down the equation of your graph.

GCSE MATHEMATICS 8300 TEACHING GUIDANCE
Version 2.0 99
R9 Define percentage as ‘number of parts per 100’;
interpret percentages and percentage changes as a
fraction or a decimal, and interpret these
multiplicatively; express one quantity as a percentage of
another; compare two quantities using percentages;
work with percentages greater than 100%; solve
problems involving percentage change, including
percentage increase / decrease and original value
problems, and simple interest including in financial
mathematics
Teaching Guidance
Students should be able to:
convert values between percentages, fractions and decimals in order to compare them, for example with probabilities
use percentages in real-life situations
interpret percentage as the operator ‘so many hundredths of’
work out the percentage of a shape that is shaded
shade a given percentage of a shape
calculate a percentage increase or decrease
solve percentage increase and decrease problems, for example, use 1.12 Q to calculate a 12% increase in the value of Q and 0.88 Q to calculate a 12% decrease in the value of Q
work out one quantity as a percentage of another quantity
use percentages, decimals or fractions to calculate proportions
calculate reverse percentages
solve simple interest problems.
Notes
See N2, N12

100 Version 2.0
Examples
1 Write 35% as
(a) a decimal
(b) a fraction in its simplest form.
2 Chris earns £285 per week.
He gets a 6% pay rise.
How much per week does he earn now?
3 Put these probabilities in order, starting with the least likely.
A 65%
B 0.7
C 3
2
4 Paving slabs cost £ 3.20 each.
A supplier offers ‘20% off when you spend more than £300’
How much will it cost to buy 100 paving slabs?
5 The cash price of a leather sofa is £700
Credit terms are a 20% deposit plus 24 monthly payments of £25
Calculate the difference between the cash price and the credit price.
6 Before a storm, a pond held 36 000 litres of water.
After the storm, the volume of the pond increased by 12%
How many litres of water does the pond hold after the storm?
7 The mean price of four train tickets is £25
All prices are increased by 10%
What is the total cost of the four tickets after the price increase?
8 A car increases its speed from 50 mph to 70 mph
Work out the percentage increase.
GCSE MATHEMATICS 8300 TEACHING GUIDANCE
Version 2.0 101
9 Attendance at a football match is 48 400
This is a 10% increase on the attendance at the last game.
What was the attendance at the last game?
10 The value of my car has decreased by 15% of the price I paid one year ago.
It is now valued at £17 340
How much did I pay for the car one year ago?

102 Version 2.0
R10 Solve problems involving direct and inverse proportion,
including graphical and algebraic representations
Teaching Guidance
Students should be able to:
use proportion to solve problems using informal strategies or the unitary method of solution
use direct proportion to solve geometrical problems
calculate an unknown quantity from quantities that vary in direct proportion or inverse proportion
set up and use equations to solve word and other problems involving direct proportion or inverse proportion
relate algebraic solutions to graphical representation of the equations
sketch an appropriately shaped graph (partly or entirely non-linear) to represent a real-life situation
choose the graph that is sketched correctly from a selection of alternatives
recognise the graphs that represent direct and inverse proportion.
Notes
Graphs may be given as sketches or as accurate drawings.
Examples
1 Cola is sold in two sizes: 330ml cans or 1.5 litre bottles.
A pack of 24 cans costs £4.99; a pack of 12 bottles costs £14.29
Which pack is better value for money?
2 You can buy x pencils for 80p
How much will it cost to buy y pencils?
3 Two men can mow a meadow in two hours.
How long would it take three men to mow the meadow, assuming they work at the same rate?
4 x is directly proportional to y.
When x = 3, y = b
Work out the value of y when x = 8

GCSE MATHEMATICS 8300 TEACHING GUIDANCE
Version 2.0 103
5 Tom visits friends in his car.
If he averages 60 miles per hour, the journey takes 22
1 hours.
How long will his journey take if he averages 40 miles per hour?
6 An aircraft leaves Berlin when Helga’s watch reads 07.00 and lands in New York when her watch reads 14.00
Helga does not change the time on her watch.
The distance from Berlin to New York is 5747 kilometres.
Assuming that the aircraft flies at a constant speed, how far does the aircraft fly between the hours of 09.00 and 11.00?
7 Match this statement to a graph.
The distance travelled at a steady speed is directly proportional to the time taken.
Graph C
Time
Distance
Graph A
Time
Distance
Graph B
Time
Distance

104 Version 2.0
R11 Use compound units such as speed, rates of pay, unit
pricing, density and pressure
Teaching Guidance
Students should be able to:
understand and use compound measures and compound units including area, volume, speed, rates of pay, density and pressure
understand speed and know the relationship between speed, distance and time
understand units in common usage such as miles per hour or metres per second. The values used in the question will make the required unit clear.
Notes
Units of speed will be given as miles per hour (mph), kilometres per hour (km / h), or metres per second (m / s or m s 1). Students who express speed in alternative units such as metres per minute will not be penalised as long as the units are clearly stated.
Units of density will be given as g/cm 3 or kg / m 3. Students who express density in alternative units such as grams per cubic metre will not be penalised as long as the units are clearly stated.
Compound measures may be expressed in the form metres per second, m / s or m s 1.
Other compound measures that are non-standard would be defined in the question, for example population density is population / km 2
Including making comparisons.
Examples
1 A car travels 90 miles in 2 hours 30 minutes.
Work out the average speed.
2 A car travels at an average speed of 30 mph for 1 hour and then 60 mph for 30 minutes.
Work out the average speed over the whole journey.
3 A block of metal weighs 500 grams.
The volume of the block is 20 cm3
The density of gold is 19 g/cm3
Could this block of metal be gold?
Give a reason for your answer.
4 You are given that pressure =
area
force
Work out the pressure when the force = 3 Newtons (N) and the area is 0.5 m2
Give the units of your answer.

GCSE MATHEMATICS 8300 TEACHING GUIDANCE
Version 2.0 105
R12 Compare lengths, areas and volumes using ratio
notation; make links to similarity (including trigonometric
ratios) and scale factors
Teaching Guidance
Students should be able to:
compare lengths, areas or volumes of similar shapes
understand, recall and use trigonometry ratios in right-angled triangles.
Notes
Questions may be set which ask, for example, what is the ratio of the area of shape A to the area of shape B?
See G19, G20
Examples
1
(a) Write the ratio perimeter A : perimeter B in its simplest form.
(b) Write the ratio area A : area B in its simplest form.
2 These boxes are similar
What is the ratio of the volume of box A to box B?
3 Find unknown sides in two right-angled triangles with a common angle.
(Diagram given)
4 cm
1 cm
6 cm
B A
2 cm
3 cm 8 cm
7 cm
2 cm
4 cm
4 cm A
B

106 Version 2.0
4 tan x = 0.8
Work out the value of y.
5 These two triangles are similar.
Work out the value of x.
Not drawn accurately
y cm
5 cm
x
9 cm x cm
10 cm 15 cm
Not drawn accurately
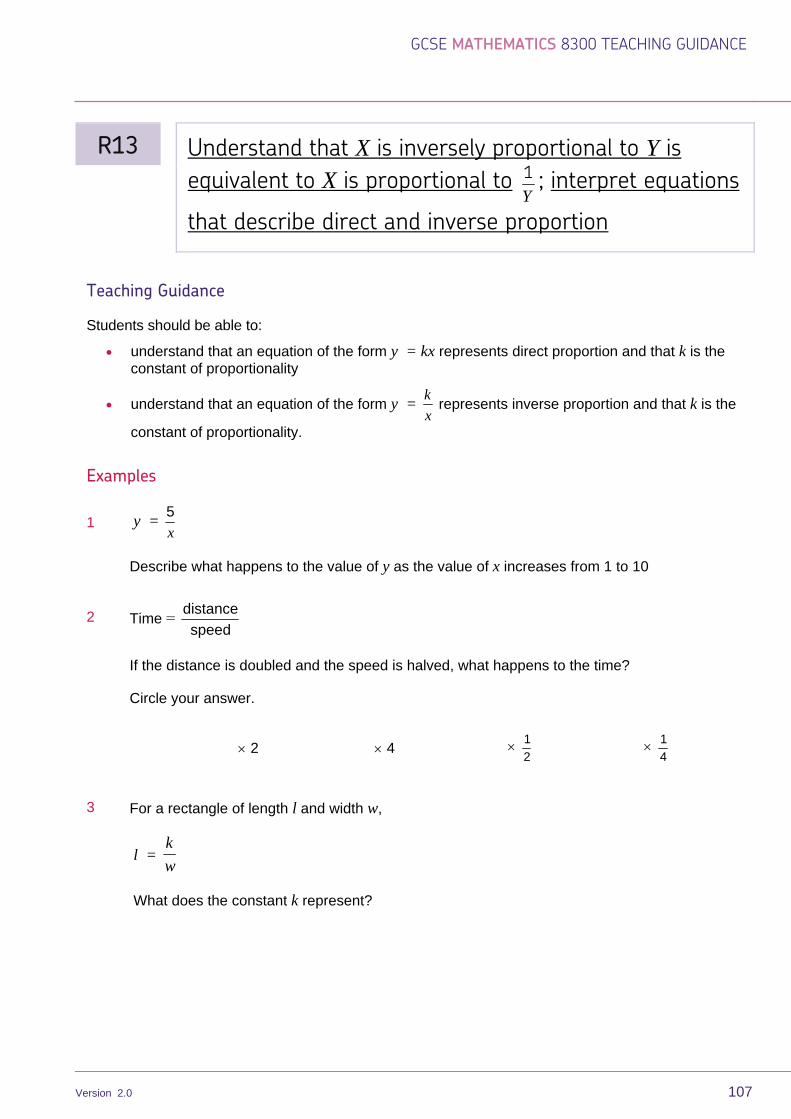
GCSE MATHEMATICS 8300 TEACHING GUIDANCE
Version 2.0 107
R13 Understand that X is inversely proportional to Y is
equivalent to X is proportional to Y
1; interpret equations
that describe direct and inverse proportion
Teaching Guidance
Students should be able to:
understand that an equation of the form y = kx represents direct proportion and that k is the constant of proportionality
understand that an equation of the form y = k
x represents inverse proportion and that k is the
constant of proportionality.
Examples
1 y =
x
5
Describe what happens to the value of y as the value of x increases from 1 to 10
2 Time =
speed
distance
If the distance is doubled and the speed is halved, what happens to the time?
Circle your answer.
2 4 2
1 4
1
3 For a rectangle of length l and width w,
l = w
k
What does the constant k represent?

108 Version 2.0
R13h Understand that X is inversely proportional to Y is
equivalent to X is proportional to Y
1
; construct and
interpret equations that describe direct and inverse
proportion
Teaching Guidance
Students should be able to:
understand that an equation of the form y = kx represents direct proportion and that k is the constant of proportionality
understand that an equation of the form y = k
x represents inverse proportion and that k is the
constant of proportionality.
Notes
Understand that if l and w are inversely proportional, then lw = A, where A is a constant.
Examples
1 The mass, m, of a sphere is proportional to the cube of its radius, r.
When r = 5 cm, m = 500 g
Work out the mass of a sphere with r = 10 cm
2 d is directly proportional h
d = 7.5 when h = 25
(a) Work out d when h = 40
(b) Work out h when d = 10
3 The number of beats per minute, b, a pendulum makes is inversely proportional to the square root of its length l.
A pendulum of length 0.16 m makes 150 beats per minute.
Work out an equation connecting b and l.
4 y is inversely proportional to x 2
When x = 8, y = 2
Work out the value of y when x = 5

GCSE MATHEMATICS 8300 TEACHING GUIDANCE
Version 2.0 109
R14 Interpret the gradient of a straight line graph as a rate
of change; recognise and interpret graphs that illustrate
direct and inverse proportion
Teaching Guidance
Students should be able to:
interpret the meaning of the gradient as the rate of change of the variable on the vertical axis compared to the horizontal axis
match direct and inverse proportion graphs to their equations and vice versa
draw graphs to represent direct and inverse proportion.
Notes
For a straight-line distance-time graph, know that the gradient represents speed.
See A15, R8
Examples
1 Distance-time graph given.
Work out the speed between A and B.
2 Graph of cost against distance in miles travelled given.
What does the gradient represent?
3 Graph showing relationship between length (l) and width (w) of a rectangle of fixed area.
Work out w given l.

110 Version 2.0
R15h Interpret the gradient at a point on a curve as the
instantaneous rate of change; apply the concepts of
average and instantaneous rate of change (gradients
of chords and tangents) in numerical, algebraic and
graphical contexts
Teaching Guidance
Students should be able to:
draw a tangent at a point on a curve and measure the gradient
interpret the meaning of the gradient as the rate of change of the variable on the vertical axis compared to the horizontal axis
understand that if the vertical axis represents speed / velocity and the horizontal axis represents time then the gradient will represent acceleration
understand that if the vertical axis represents distance and the horizontal axis represents time then the gradient will represent speed / velocity
understand the difference between positive and negative gradients as rates of change
understand that the rate of change at a particular instant in time is represented by the gradient of the tangent to the curve at that point
understand that the average rate of change is represented by a chord.
Notes
Velocity will be given as, for example, m/s and acceleration will be given as, for example, m/s2
See A15h

GCSE MATHEMATICS 8300 TEACHING GUIDANCE
Version 2.0 111
Examples
1 The graph shows the height of a firework rocket above the ground plotted against time after take-off.
(a) Use the graph to find the greatest height reached by the rocket.
(b) How long is the rocket moving upwards?
(c) By drawing a suitable straight-line graph, estimate the speed of the rocket two seconds after take-off.
(d) When is the rocket rising at its fastest speed?
Height (metres)
Time (seconds)

112 Version 2.0
(e) On the axes below, sketch the velocity-time graph for the rise of the rocket.
(Graph will be drawn full size)
time (s) O 5 10
velocity (m/s)

GCSE MATHEMATICS 8300 TEACHING GUIDANCE
Version 2.0 113
R16 Set up, solve and interpret the answers in growth and
decay problems, including compound interest
Teaching Guidance
Students should be able to:
solve problems involving repeated proportional change
use calculators to explore exponential growth and decay using a multiplier and the power
solve compound interest problems.
Examples
1 £5000 is invested at 9.65% compound interest.
(a) Work out the value of the investment after six years.
(b) Write down a formula to calculate the value of the investment after n years.
2 The population of fish in a pond increases by 4% each year.
How many years will it take for the population to double?
3 A ball is dropped from a height of 100 cm
After each bounce, the ball bounces to 5
3 of its previous height.
How high does it reach on the fourth bounce?

114 Version 2.0
R16h Set up, solve and interpret the answers in growth and
decay problems, including compound interest and work
with general iterative processes
Teaching Guidance
Students should be able to:
model growth and decay problems mathematically
solve growth and decay problems, for example using multipliers or iterative processes
understand that some iterations may have a limiting value.
Notes
Understand that, for example, the number of fish in a small pond cannot continue to grow in population indefinitely and that certain assumptions will be made or used when modelling, for example a 10% increase in population per year.
See A20h
Examples
1 Write down a calculation to work out the value of a 10 year investment of £2000 at 3% compound interest per annum.

GCSE MATHEMATICS 8300 TEACHING GUIDANCE
Version 2.0 115
9
Geometry and measures -
Properties and constructions
G1 Use conventional terms and notations: points, lines,
vertices, edges, planes, parallel lines, perpendicular lines,
right angles, polygons, regular polygons and polygons
with reflection and / or rotation symmetries; use the
standard conventions for labelling and referring to the
sides and angles of triangles; draw diagrams from
written description
Teaching Guidance
Students should be able to:
understand the standard conventions for equal sides and equal sides and parallel lines and diagrams
distinguish between acute, obtuse, reflex and right angles
name angles
use one lower-case letter or three upper-case letters to represent an angle, for example x or ABC
understand and draw lines that are parallel
understand that two lines that are perpendicular are at 90o to each other
identify lines that are perpendicular
draw a perpendicular line in a diagram
use geometrical language
use letters to identify points and lines
recognise that, for example, in a rectangle ABCD the points A, B, C and D go around in order
recognise reflection symmetry of 2D shapes
understand line symmetry
identify lines of symmetry on a shape or diagram
draw lines of symmetry on a shape or diagram
draw or complete a diagram with a given number of lines of symmetry
recognise rotational symmetry of 2D shapes
identify the order of rotational symmetry on a shape or diagram
draw or complete a diagram with rotational symmetry

116 Version 2.0
identify and draw lines of symmetry on a Cartesian grid
identify the order of rotational symmetry of shapes on a Cartesian grid
draw or complete a diagram with rotational symmetry on a Cartesian grid.
Examples
1 A shape has three lines of symmetry.
All sides are the same length.
Write down the name of the shape.
2 Draw a shape with two lines of symmetry and rotational symmetry of order 2
3 Describe all the symmetries of a shape.
(Diagram given)
4 Shade in squares on a grid so that 75% of the squares are shaded and the shaded shape has line symmetry.
5 In parallelogram ABCD,
(a) Draw a line through B perpendicular to DC.
(b) Draw a line through the midpoint of AB parallel to CB.
A B
D C

GCSE MATHEMATICS 8300 TEACHING GUIDANCE
Version 2.0 117
G2 Use the standard ruler and compass constructions
(perpendicular bisector of a line segment, constructing a
perpendicular to a given line from / at a given point,
bisecting a given angle); use these to construct given
figures and solve loci problems; know that the
perpendicular distance from a point to a line is the
shortest distance to the line
Teaching Guidance
Students should be able to:
measure and draw lines to the nearest mm
measure and draw angles to the nearest degree
make accurate drawings of triangles and other 2D shapes using a ruler and a protractor
make an accurate scale drawing from a sketch, diagram or description
use a straight edge and a pair of compasses to do standard constructions
construct a triangle
construct an equilateral triangle with a given side or given side length
construct a perpendicular bisector of a given line
construct a perpendicular at a given point on a given line
construct a perpendicular from a given point to a given line
construct an angle bisector
construct an angle of 60°
draw parallel lines
draw circles or part circles given the radius or diameter
construct diagrams of 2D shapes
construct a region, for example, bounded by a circle and an intersecting line
construct loci, for example, given a fixed distance from a point and a fixed distance from a given line
construct loci, for example, given equal distances from two points
construct loci, for example, given equal distances from two line segments
construct a region that is defined as, for example, less than a given distance or greater than a given distance from a point or line segment
describe regions satisfying several conditions.

118 Version 2.0
Notes
Students will be expected to show clear evidence that a straight edge and compasses have been used to do constructions.
Loci problems may be set in practical contexts such as finding the position of a radio transmitter.
Examples
1 Construct the perpendicular bisector of a line and use this to draw an isosceles triangle.
2 Find the overlapping area of two transmitters, with ranges of 30 km and 40 km respectively.
3 In the diagram P, Q and R represent three trees. Shade the region of points that are less than 30 metres from P, less than 40 metres from Q and that are nearer to Q than R.
4 Given a scale drawing of a garden, draw on the diagram the position of a circular pond of radius 0.8 metres which has to be 2 metres from any boundary wall.
5 Draw a line parallel to a given line at a distance 3 cm apart.
6 Draw a semicircle of radius 5 cm
7 Construct a triangle with sides of 6 cm, 7 cm and 8 cm
8 Construct a rectangle with sides of 6 cm and 4 cm
9 Using ruler and compasses only, construct a triangle ABC such that AB = 8 cm, angle A = 60° and angle B = 45°

GCSE MATHEMATICS 8300 TEACHING GUIDANCE
Version 2.0 119
G3 Apply the properties of angles at a point, angles at a
point on a straight line, vertically opposite angles;
understand and use alternate and corresponding angles
on parallel lines; derive and use the sum of angles in a
triangle (eg to deduce and use the angle sum in any
polygon, and to derive properties of regular polygons)
Teaching Guidance
Students should be able to:
work out the size of missing angles at a point
work out the size of missing angles at a point on a straight line
know that vertically opposite angles are equal
justify an answer with explanations such as ‘angles on a straight line’, etc.
understand and use the angle properties of parallel lines
recall and use the terms alternate angles and corresponding angles
work out missing angles using properties of alternate angles, corresponding angles and interior angles
understand the consequent properties of parallelograms
derive and use the proof that the angle sum of a triangle is 180o
derive and use the proof that the exterior angle of a triangle is equal to the sum of the interior angles at the other two vertices
use angle properties of equilateral, isosceles and right-angled triangles
use the fact that the angle sum of a quadrilateral is 360o
calculate and use the sums of interior angles of polygons
recognise and name regular polygons: pentagons, hexagons, octagons and decagons
use the angle sum of irregular polygons
calculate and use the angles of regular polygons
use the fact that the sum of the interior angles of an n-sided polygon is 180(n 2)
use the fact that the sum of the exterior angles of any polygon is 360o
use the relationship interior angle + exterior angle = 180o
use the sum of the interior angles of a triangle to deduce the sum of the interior angles of any polygon.

120 Version 2.0
Notes
Colloquial terms such as Z angles are not acceptable and should not be used.
See G6
Examples
1 Three angles form a straight line.
Two of the angles are equal.
One of the angles is 30° more than another angle.
Work out two possible sets of values for the three angles.
2 There are three angles at a point.
One is acute, one is obtuse and one is reflex.
Write down one possible set of three angles.
3 Given two intersecting lines with angles x and 4x at the vertex, work out the larger angle.
4
Work out the size of angle x.
You must explain any properties that you have used to obtain your answer.
5 One of the angles in an isosceles triangle is 64°
Work out the size of the smallest possible angle in the triangle.
Not drawn accurately 70
x

GCSE MATHEMATICS 8300 TEACHING GUIDANCE
Version 2.0 121
6 The pentagon PQRST has sides of equal length.
The line QS is drawn.
Work out the size of angle PQS.
7 Work out the size of each interior angle of a regular hexagon.
8 Explain why angles of 99° and 91° do not fit together to make a straight line.
9 The exterior angle of a regular polygon has size 30°
How many sides does the polygon have?
Not drawn accurately R
S Q
P T
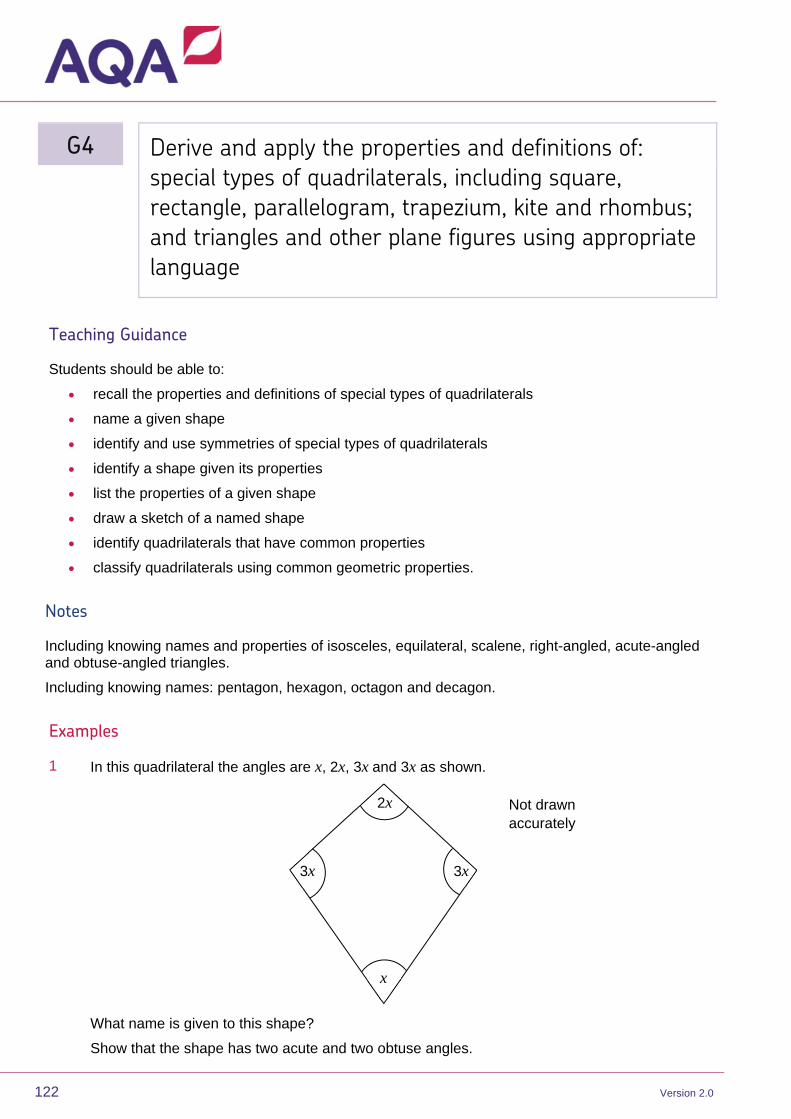
122 Version 2.0
G4 Derive and apply the properties and definitions of:
special types of quadrilaterals, including square,
rectangle, parallelogram, trapezium, kite and rhombus;
and triangles and other plane figures using appropriate
language
Teaching Guidance
Students should be able to:
recall the properties and definitions of special types of quadrilaterals
name a given shape
identify and use symmetries of special types of quadrilaterals
identify a shape given its properties
list the properties of a given shape
draw a sketch of a named shape
identify quadrilaterals that have common properties
classify quadrilaterals using common geometric properties.
Notes
Including knowing names and properties of isosceles, equilateral, scalene, right-angled, acute-angled and obtuse-angled triangles.
Including knowing names: pentagon, hexagon, octagon and decagon.
Examples
1 In this quadrilateral the angles are x, 2x, 3x and 3x as shown.
What name is given to this shape?
Show that the shape has two acute and two obtuse angles.
Not drawn accurately
3x 3x
2x
x

GCSE MATHEMATICS 8300 TEACHING GUIDANCE
Version 2.0 123
2 The diagram shows an isosceles triangle.
(a) If x = 30°, work out the value of p.
(b) If q = 100°, work out the value of x.
(c) Write down the value of q in terms of x and p.
3 Write down two similarities and two differences between a rectangle and a trapezium.
4 Ben is describing a shape.
It has four sides
The sides are all the same length
It is not a square.
(a) What shape is Ben describing?
(b) Write down another fact about this shape.
p
Not drawn accurately
x
q

124 Version 2.0
G5 Use the basic congruence criteria for triangles
(SSS, SAS, ASA, RHS)
Teaching Guidance
Students should be able to:
understand congruence
identify shapes that are congruent
understand and use conditions for congruent triangles: SSS, SAS, ASA and RHS
recognise congruent shapes when rotated, reflected or in different orientations
understand and use SSS, SAS, ASA and RHS conditions to prove the congruence of triangles using formal arguments, and to verify standard ruler and compass constructions.
Examples
1 This diagram is made up of triangles and squares as shown.
(a) Write down a letter for a triangle that is congruent to triangle C.
(b) Use some of the letters to write down a triangle that is similar to the triangle made up of B, C and E.
2 Given several shapes, identify pairs of congruent shapes.
3 Given several shapes, identify the odd ones out, giving reasons.
C
B
A D F
E

GCSE MATHEMATICS 8300 TEACHING GUIDANCE
Version 2.0 125
4 Circle the reason why each pair of triangles are congruent.
SSS ASA
SAS RHS
SSS ASA
SAS RHS
SSS ASA
SAS RHS
5 cm 6 cm 40°
5 cm 6 cm 40°
5 cm 6 cm
7 cm
5 cm 6 cm
7 cm
10 cm
6 cm
10 cm
6 cm

126 Version 2.0
G6 Apply angle facts, triangle congruence, similarity and
properties of quadrilaterals to conjecture and derive
results about angles and sides, including Pythagoras’
theorem and the fact that the base angles of an
isosceles triangle are equal, and use known results to
obtain simple proofs
Teaching Guidance
Students should be able to:
understand similarity
understand similarity of triangles and of other plane figures, and use this to make geometric inferences
identify shapes that are similar, including all squares, all circles or all regular polygons with equal number of sides
recognise similar shapes when rotated, reflected or in different orientations
apply mathematical reasoning, explaining and justifying inferences and deductions
show step-by-step deduction in solving a geometrical problem
state constraints and give starting points when making deductions.
Notes
See G3
Examples
1 Use Pythagoras’ theorem to find the height of a triangle and then use the result to find the perimeter or area of the triangle.
2 ABC is a straight line.
Work out x.
A B C
Not drawn accurately
40°
x

GCSE MATHEMATICS 8300 TEACHING GUIDANCE
Version 2.0 127
3 Given that one angle in an isosceles triangle is 70°, show that there are two possible solutions for the other angles.
4 Given that one angle in an isosceles triangle is 90°, show that there can only be one solution for the other angles.

128 Version 2.0
G7 Identify, describe and construct congruent and similar
shapes, including on coordinate axes, by considering
rotation, reflection, translation and enlargement
(including fractional scale factors)
Teaching Guidance
Students should be able to:
describe and transform 2D shapes using single rotations
understand that rotations are specified by a centre and an angle
find a centre of rotation
rotate a shape about the origin or any other point
measure the angle of rotation using right angles
measure the angle of rotation using simple fractions of a turn or degrees
describe and transform 2D shapes using single reflections
understand that reflections are specified by a mirror line
find the equation of a line of reflection
describe and transform 2D shapes using translations
understand that translations are specified by a distance and direction (using a vector)
translate a given shape by a vector
describe and transform 2D shapes using enlargements by a positive scale factor
understand that an enlargement is specified by a centre and a scale factor
draw an enlargement
find the centre of enlargement
enlarge a shape on a grid (centre not specified)
recognise that enlargements preserve angle but not length
identify the scale factor of an enlargement of a shape as the ratio of the lengths of two corresponding sides
identify the scale factor of an enlargement as the ratio of the lengths of any two corresponding line segments
distinguish properties that are preserved under particular transformations
understand that lengths and angles are preserved under rotations, reflections and translations, so that any figure is congruent under any of these transformations
use congruence to show that translations, rotations and reflections preserve length and angle, so that any figure is congruent to its image under any of these transformations.
GCSE MATHEMATICS 8300 TEACHING GUIDANCE
Version 2.0 129
Notes
The direction of rotation will be given, unless 180°
Column vector notation should be understood.
Enlargements may be drawn on a grid, or on a Cartesian grid, where the centre of enlargement will always be at the intersection of two grid lines.
When describing transformations, the minimum requirement is:
rotations described by centre, direction (unless half a turn) and an amount of turn (as a fraction of a whole or in degrees)
reflections described by a mirror line
translations described by a vector or a clear description such as three squares to the right, five squares down
enlargements described by centre of enlargement and scale factor.
Examples
1 Enlarge a shape given on a grid by scale factor 2 and identify the centre of enlargement used.
2 Enlarge a shape given on a grid by scale factor 2
1 and identify the centre of enlargement used.
3 Given a transformation from shape A to shape B, describe the reverse transformation.
4 Given two shapes (eg squares) where different transformations are possible, describe the different possible transformations.

130 Version 2.0
G7h Identify, describe and construct congruent and similar
shapes, including on coordinate axes, by considering
rotation, reflection, translation and enlargement
(including fractional and negative scale factors)
Teaching Guidance
Students should be able to:
identify the scale factor of an enlargement
construct enlargements with fractional and negative scale factors.
Notes
Enlargements may be drawn on a grid, or on a Cartesian grid.
Examples
1 Enlarge a shape given on a grid by scale factor 2 and identify the centre of enlargement used.
2 Enlarge a shape given on a grid by scale factor 3
1 from a given centre of enlargement.

GCSE MATHEMATICS 8300 TEACHING GUIDANCE
Version 2.0 131
G8h Describe the changes and invariance achieved by
combinations of rotations, reflections and
translations
Teaching Guidance
Students should be able to:
describe and transform 2D shapes using combined rotations, reflections, translations, or enlargements
describe a combination of transformations as a single transformation
understand and use the term ‘invariance’ for points, lines and shapes achieved by single or combined transformations
map a point on a shape under a combination of transformations
use column vector notation for translations.
Notes
See G24
Examples
1
Work out the coordinates of B after
(a) ABCD is reflected in the line y = x, and then in the x axis.
-4 -3 -2 -1 O 1 2 3 4
-4
-3
-2
-1
1
2
3
4A
x
y
B
C
D

132 Version 2.0
(b) ABCD is rotated through 90° anticlockwise about the point (3, 0) and then translated by the
vector
12
2
(a) Reflect A in the line y = x
Label your shape B.
(b) Reflect B in the line x = 5
Label your shape C.
(c) Describe fully the single transformation that maps A onto C.
3 Write down the coordinates of a point that is invariant when it is reflected in the line y = x
0 1 2 3 4 5 6 7 80
1
2
3
4
5A
x
y

GCSE MATHEMATICS 8300 TEACHING GUIDANCE
Version 2.0 133
G9 Identify and apply circle definitions and properties,
including: centre, radius, chord, diameter, circumference,
tangent, arc, sector and segment
Teaching Guidance
Students should be able to:
recall the definition of a circle
identify and name the parts of a circle
draw the parts of a circle
understand related terms of a circle
draw a circle given the radius or diameter.
Examples
1 Draw a chord on a given circle.
2 Chords of a circle are joined together inside the circle to make a regular shape.
The length of each chord is equal to the radius of the circle.
How many chords are joined together?
3 Draw a chord perpendicular to a given diameter.
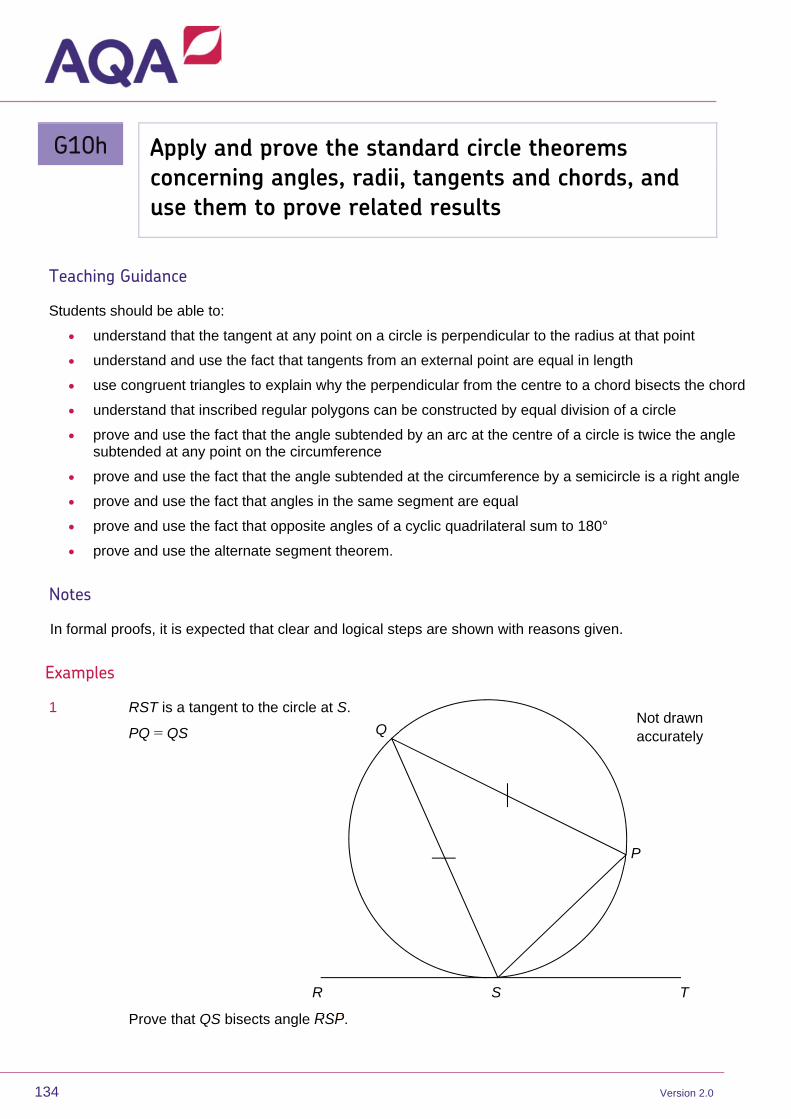
134 Version 2.0
G10h Apply and prove the standard circle theorems
concerning angles, radii, tangents and chords, and
use them to prove related results
Teaching Guidance
Students should be able to:
understand that the tangent at any point on a circle is perpendicular to the radius at that point
understand and use the fact that tangents from an external point are equal in length
use congruent triangles to explain why the perpendicular from the centre to a chord bisects the chord
understand that inscribed regular polygons can be constructed by equal division of a circle
prove and use the fact that the angle subtended by an arc at the centre of a circle is twice the angle subtended at any point on the circumference
prove and use the fact that the angle subtended at the circumference by a semicircle is a right angle
prove and use the fact that angles in the same segment are equal
prove and use the fact that opposite angles of a cyclic quadrilateral sum to 180°
prove and use the alternate segment theorem.
Notes
In formal proofs, it is expected that clear and logical steps are shown with reasons given.
Examples
1 RST is a tangent to the circle at S.
PQ = QS
Prove that QS bisects angle RSP.
Not drawn accurately Q
P
R S T

GCSE MATHEMATICS 8300 TEACHING GUIDANCE
Version 2.0 135
2 ABC is a tangent to the circle at B.
AC is parallel to DE.
Prove that triangle BDE is isoceles.
3 O is the centre of the circle.
Work out the sizes of angles a and b.
Not drawn accurately
TX
a O
b
70
B
E
C
A
D
Not drawn accurately

136 Version 2.0
4 O is the centre of the circle.
Work out the sizes of angles a and b.
a57
b
O
Not drawn accurately

GCSE MATHEMATICS 8300 TEACHING GUIDANCE
Version 2.0 137
G11 Solve geometrical problems on coordinate axes
Teaching Guidance
Students should be able to:
show step-by-step deduction in solving a geometrical problem.
Examples
1 ABCD is a parallelogram.
(a) Work out the coordinates of D.
(b) Work out the coordinates of the centre of the parallelogram.
2 AO : OB = 1 : 2
Work out the coordinates of B.
C (1, 2)
A (1, 6) B (4, 6)
O x
y
A (3, 2)
B
O x
y
Not drawn accurately
Not drawn accurately

138 Version 2.0
G12 Identify properties of the faces, surfaces, edges and
vertices of: cubes, cuboids, prisms, cylinders, pyramids,
cones and spheres
Teaching Guidance
Students should be able to:
know the terms face, edge and vertex (vertices)
identify and name common solids, for example cube, cuboid, prism, cylinder, pyramid, cone and sphere
understand that cubes, cuboids, prisms and cylinders have uniform areas of cross-section.
Examples
1 Work out the total number of faces on a triangular prism, a cuboid and a square-based pyramid.

GCSE MATHEMATICS 8300 TEACHING GUIDANCE
Version 2.0 139
G13 Construct and interpret plans and elevations of 3D
shapes
Teaching Guidance
Students should be able to:
use 2D representations of 3D shapes
draw nets and show how they fold to make a 3D solid
analyse 3D shapes through 2D projections and cross sections, including plans and elevations
understand and draw front and side elevations and plans of shapes made from simple solids, for example a solid made from small cubes
understand and use isometric drawings.
Examples
1 Identify possible nets for a cube from several drawings.
2 Use plan, front and side elevation drawings to work out the volume of a simple shape.
3 From a drawing of a cuboid work out the surface area.

140 Version 2.0
10
Geometry and measures –
Mensuration and calculation
G14 Use standard units of measure and related concepts
(length, area, volume / capacity, mass, time, money etc)
Teaching Guidance
Students should be able to:
interpret scales on a range of measuring instruments, including those for time, temperature and mass, reading from the scale or marking a point on a scale to show a stated value
know that measurements using real numbers depend on the choice of unit
recognise that measurements given to the nearest whole unit may be inaccurate by up to one half in either direction
make sensible estimates of a range of measures in real-life situations, for example estimate the height of a man
choose appropriate units for estimating measurements, for example the height of a television mast would be measured in metres.
Examples
1 Read a temperature scale.
2 Mark a given value on a weighing scale.
3 Given a scale with a maximum measurement of 2 kg, explain how 5 kg could be weighed out using the scale.
4 Decide suitable metric units for measuring each of the following.
(a) A dose of medicine on a spoon.
(b) The length of a bus.
(c) The distance between two towns.
5 Estimate the height of a building and use this to estimate the number of pieces of drainpipe of a given length needed to be placed from the top to the bottom of the building.

GCSE MATHEMATICS 8300 TEACHING GUIDANCE
Version 2.0 141
G15 Measure line segments and angles in geometric figures,
including interpreting maps and scale drawings and use
of bearings
Teaching Guidance
Students should be able to:
use and interpret maps and scale drawings
use a scale on a map to work out an actual length
use a scale with an actual length to work out a length on a map
construct scale drawings
use scale to estimate a length, for example use the height of a man to estimate the height of a building where both are shown in a scale drawing
work out a scale from a scale drawing given additional information
recall and use the eight points of the compass (N, NE, E, SE, S, SW, W, NW) and their equivalent three-figure bearings
use compass point and three-figure bearings to specify direction
mark points on a diagram given the bearing from another point
draw a bearing between points on a map or scale drawing
measure the bearing of a point from another given point
work out the bearing of a point from another given point
work out the bearing to return to a point, given the bearing to leave that point.
Notes
Scale could be given as a ratio (for example 1 : 500 000) or as a key (for example 1 cm represents 5 km).
See R1
Examples
1 Given the road distance between two ports, use a scale drawing to compare the time taken to travel by car or by boat.
2 Use a scale of 1 : 500 000 to decide how many kilometres are represented by 3 cm on the map.
3 Use accurate constructions to locate a point on a map or scale drawing.
4 Write down the three-figure bearing for NW.

142 Version 2.0
5 Work out the angle between North East and South.
6 Given the bearing to B from A, work out the bearing to A from B.
7 Use the height of a man to estimate the height of a bridge

GCSE MATHEMATICS 8300 TEACHING GUIDANCE
Version 2.0 143
G16 Know and apply formulae to calculate: area of triangles,
parallelograms, trapezia; volumes of cuboids and other
right prisms (including cylinders)
Teaching Guidance
Students should be able to:
recall and use the formulae for the area of a rectangle, triangle, parallelogram and trapezium
work out the area of a rectangle
work out the area of a triangle
work out the area of a parallelogram
work out the area of a trapezium
calculate the area of compound shapes made from triangles and rectangles
calculate the area of compound shapes made from two or more rectangles, for example an L shape or T shape
calculate the area of shapes drawn on a grid
calculate the area of simple shapes
work out the surface area of nets made up of rectangles and triangles
recall and use the formula for the volume of a cube or cuboid
recall and use the formula for the volume of a cylinder
recall and use the formula for the volume of a prism
work out the volume of a cube or cuboid
work out the volume of a cylinder
work out the volume of a prism, for example a triangular prism.
Notes
Students may be required to measure lengths in order to work out areas.
Examples
1 The area of a triangle = 24 cm 2
The base of the triangle is 8 cm
Work out the height of the triangle.
2 The perimeter of a rectangle is 30 cm
The length of the rectangle is double the width.
Work out the area of the rectangle.

144 Version 2.0
3 The area of the base of a cylinder is 20 cm 2
The height of the cylinder is 7 cm
Work out the volume of the cylinder.
State the units of your answer.
4 A cuboid has the same volume as a cube with edges of length 8 cm
(a) Work out one set of possible values for the length, width and height of the cuboid if all three values are different.
(b) Work out one set of possible values for the length, width and height of the cuboid if two of the values are the same.
5 The volume of a cuboid is 36 cm 3
The area of one of the faces is 9 cm 2
All edges are a whole number of centimetres long.
The length, width and height are all different.
Work out the length, width and height of the cuboid.
6 The area of the rectangle is equal to the area of the triangle.
Work out the value of x.
x cm
4 cm3 cm
2(x 5) cm
Not drawn accurately

GCSE MATHEMATICS 8300 TEACHING GUIDANCE
Version 2.0 145
G17 Know the formulae: circumference of a circle
= 2πr = πd, area of a circle = πr2
; calculate: perimeters
of 2D shapes, including circles; areas of circles and
composite shapes; surface area and volume of spheres,
pyramids, cones and composite solids
Teaching Guidance
Students should be able to:
work out the perimeter of a rectangle
work out the perimeter of a triangle
calculate the perimeter of shapes made from triangles and rectangles
calculate the perimeter of compound shapes made from two or more rectangles
calculate the perimeter of shapes drawn on a grid
calculate the perimeter of simple shapes
recall and use the formula for the circumference of a circle
work out the circumference of a circle, given the radius or diameter
work out the radius or diameter of a circle, given the circumference
use π = 3.14 or the π button on a calculator
recall and use the formula for the area of a circle
work out the area of a circle, given the radius or diameter
work out the radius or diameter of a circle, given the area
work out the surface area of spheres, pyramids and cones
work out the surface area of compound solids constructed from cubes, cuboids, cones, pyramids, cylinders, spheres and hemispheres
work out the volume of spheres, pyramids and cones
work out the volume of compound solids constructed from cubes, cuboids, cones, pyramids, cylinders, spheres and hemispheres
solve real-life problems using known solid shapes.

146 Version 2.0
Notes
Students may be required to measure lengths in order to work out perimeters.
For problems involving circles, the answer may be asked for as a multiple of .
Including frustums.
The formulae for volume and surface area of a sphere, cone and pyramid will be given in the relevant question.
See N8, G18
Examples
1 The circumference of a circle of radius 4 cm is equal to the perimeter of a square.
Work out the length of one side of the square.
2 A shape is made by joining an equilateral triangle to a rectangle.
The perimeter of the shape is 90 cm
Work out the value of x.
3 A rectangle has two semicircles drawn inside it as shown.
Show that the shaded area is 9(5 ) cm 2
Not drawn accurately
Not drawn accurately 7.5 cm
6 cm
(x + 3) cm
2x cm

GCSE MATHEMATICS 8300 TEACHING GUIDANCE
Version 2.0 147
G18 Calculate arc lengths, angles and areas of sectors of
circles
Teaching Guidance
Students should be able to:
work out the perimeter of semicircles, quarter circles or other fractions of a circle
work out the area of semicircles, quarter circles or other fractions of a circle
calculate the length of arcs of circles
calculate the area of sectors of circles
given the lengths or areas of arcs, calculate the angle subtended at the centre.
Notes
See N8, G17
Examples
1 The following diagram shows two semicircles of radius 5 cm and 10 cm
Work out the shaded area.
2 Which is greater, the area of a quarter-circle of radius 10 cm or the area of a semicircle of radius 5 cm?
Show how you decide.
Not drawn accurately

148 Version 2.0
3 The diagram shows a sector of a circle.
The arc length is 24 cm
Work out the radius.
4 A quadrant of a circle is shown.
Work out the shaded area.
5 The diagram shows a sector of a circle.
Work out the area.
Not drawn accurately
145
Not drawn accurately
125
8 cm
Not drawn accurately
6 cm
6 cm
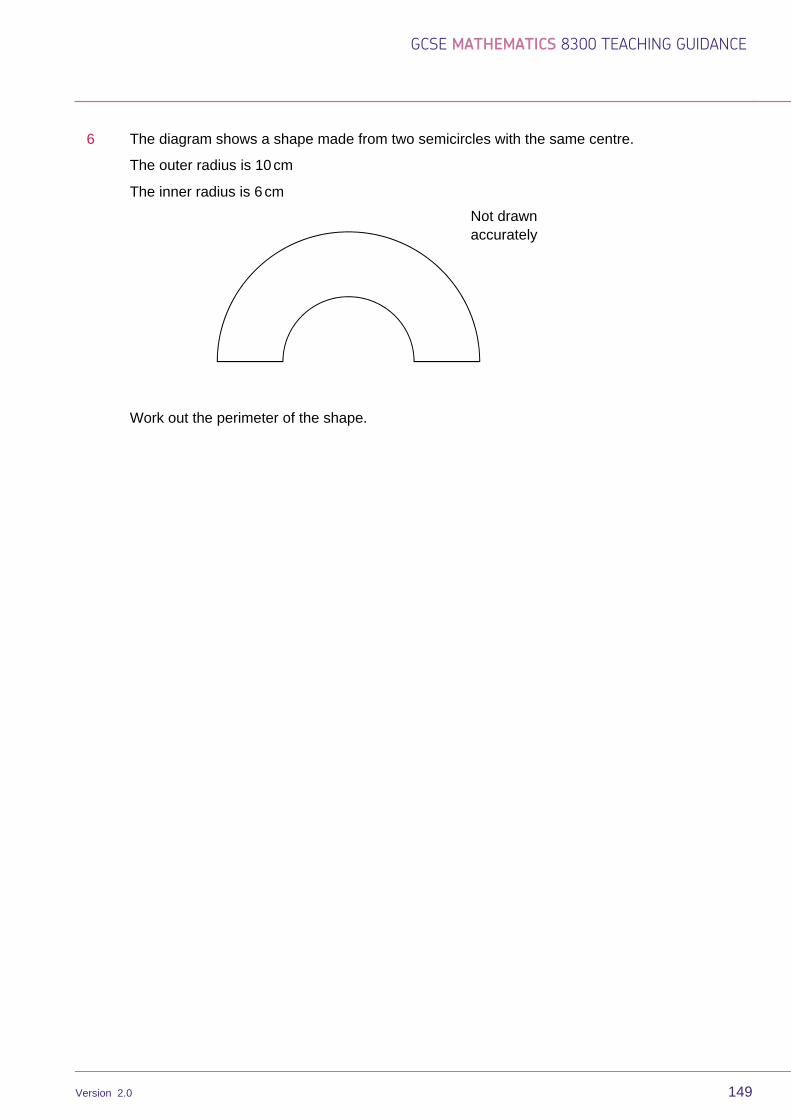
GCSE MATHEMATICS 8300 TEACHING GUIDANCE
Version 2.0 149
6 The diagram shows a shape made from two semicircles with the same centre.
The outer radius is 10 cm
The inner radius is 6 cm
Work out the perimeter of the shape.
Not drawn accurately

150 Version 2.0
G19 Apply the concepts of congruence and similarity,
including the relationships between lengths in similar
figures
Teaching Guidance
Students should be able to:
understand the effect of enlargement on perimeter
work out the side of one shape that is similar to another shape given the ratio or scale factor of lengths.
Notes
See R12
Examples
1 A and B are similar triangles.
Work out x.
Not drawn accurately
6 cm
5 cm
x
8 cm
A B

GCSE MATHEMATICS 8300 TEACHING GUIDANCE
Version 2.0 151
G19h Apply the concepts of congruence and similarity,
including the relationships between lengths, areas and
volumes in similar figures
Teaching Guidance
Students should be able to:
understand the effect of enlargement on areas of shapes
understand the effect of enlargement on surface areas and volumes of solids
compare the areas or volumes of similar shapes or solids, knowing that if a : b is the ratio of lengths, then a 2 : b 2 is the ratio of areas and a 3 : b 3 is the ratio of volumes
work out the area or volume of one shape/solid given the area or volume of a similar shape/solid and the ratio or scale factor of lengths of the shape/solid.
Notes
Questions may be set which ask, for example, how many times bigger is the area of shape A than shape B?
Students will be expected to know the connection between the linear, area and volume scale factors of similar shapes and solids.
Questions may be asked which involve the relationship between weight and volume, area and cost of paint, etc.
Scales will be given as, for example, 1 cm represents 1 km, or 1 : 100
See R12
Examples
1 These boxes are similar.
What is the ratio of the volume of box A to the volume of box B?
2cm
B A
6cm

152 Version 2.0
2 Two statues are similar in shape.
The scale factor of the enlargement is 1.5
The smaller statue has mass of 0.8 tonnes.
Work out the mass of the larger statue.
3 What is the ratio of the surface areas of two similar cones with base radii 3 cm and 12 cm respectively?
4 Two solids are similar.
The ratio of their lengths is 1 : 2
Write down the volume of the small solid as a fraction of the volume of the large solid.
GCSE MATHEMATICS 8300 TEACHING GUIDANCE
Version 2.0 153
G20 Know the formulae for: Pythagoras’ theorem, a2
+ b2
=
c2
, and the trigonometric ratios,
sin = hypotenuse
opposite
, cos = hypotenuse
adjacent
and tan = adjacent
opposite
;
apply them to find angles and lengths in right-angled
triangles in two dimensional figures
Teaching Guidance
Students should be able to:
understand, recall and use Pythagoras' theorem in 2D problems
understand, recall and use trigonometric ratios in right-angled triangles
use the trigonometric ratios in right-angled triangles to solve problems, including those involving bearings.
Notes
Questions may be set in context, for example, a ladder against a wall.
See R12
Examples
1 Use Pythagoras’ theorem to find the height of a triangle and then use the result to find the perimeter or area of the triangle.
2 Work out the amount of fencing needed to cut off a given triangular area from the corner of a field.
3 Find unknown sides or angles in a right-angled triangle.
(Diagram given)

154 Version 2.0
G20h
Know the formulae for: Pythagoras’ theorem, a2
+ b2
=
c2
, and the trigonometric ratios,
sin = hypotenuse
opposite
, cos = hypotenuse
adjacent
and tan = adjacent
opposite
;
apply them to find angles and lengths in right-angled
triangles and, where possible, general triangles in
two and three dimensional figures
Teaching Guidance
Students should be able to:
understand, recall and use Pythagoras' theorem in 3D problems
understand, recall and use trigonometric ratios in 3D problems
use these ratios in 3D contexts, including finding the angles between a line and a plane.
Examples
1 The diagram shows an isosceles trapezium.
Work out the area of the trapezium.
2 Work out the length of the diagonal AB in a cuboid with dimensions 9 cm, 40 cm and 41 cm
Not drawn accurately
4cm
8cm
35 35
9 cm
40 cm A
B
41 cm

GCSE MATHEMATICS 8300 TEACHING GUIDANCE
Version 2.0 155
3 This diagram shows two right-angled triangles.
(a) Work out the length marked h on the diagram.
(b) Work out the area of the whole shape.
4
Work out the area of triangle ABC.
12cm
Not drawn accurately
17cm h
6cm
D
C
B A
6cm
3.6cm
8cm
Not drawn accurately

156 Version 2.0
5 VA = VB = VC = VD = 12 cm
ABCD is a rectangle 9 cm by 7 cm
(a) Work out the length VX.
(b) Work out the size of the angle between VB and the base ABCD.
X
9 cm D
C
7 cm
12 cm
B
A
V

GCSE MATHEMATICS 8300 TEACHING GUIDANCE
Version 2.0 157
G21 Know the exact values of sin and cos for = 0°, 30°,
45°, 60° and 90°; know the exact value of tan for
= 0°, 30°, 45° and 60°
Teaching Guidance
Students should be able to:
recall exact values of sine, cosine and tangent for 0°, 30°, 45° and 60°
recall that sin 90° = 1 and cos 90° = 0
solve right-angled triangles with angles of 30°, 45° or 60° without using a calculator.
Notes
See A12
Examples
1 (a) Work out the length of AB.
(b) Work out the length of PR.
45°
B C
A
2.5 cm
45°
R Q
P
2.5 cm
60°
Not drawn accurately
Not drawn accurately

158 Version 2.0
2 Show that x = 6 (Non calculator, Higher tier only)
Not drawn accurately x
6 cm
30°
45°

GCSE MATHEMATICS 8300 TEACHING GUIDANCE
Version 2.0 159
G22h Know and apply the sine rule,
Asin
a =
B sin
b =
Csin
c and
cosine rule, a2
= b2
+ c2
2bc cos A, to find unknown
lengths and angles
Teaching Guidance
Students should be able to:
use the sine and cosine rules to solve 2D and 3D problems.
Examples
1 Find the largest angle of a scalene triangle with sides of 6 cm, 10 cm and 14 cm
2
Work out x.
80°
70°
x 7 cm
Not drawn accurately
Not drawn accurately
6 cm
10 cm
14 cm
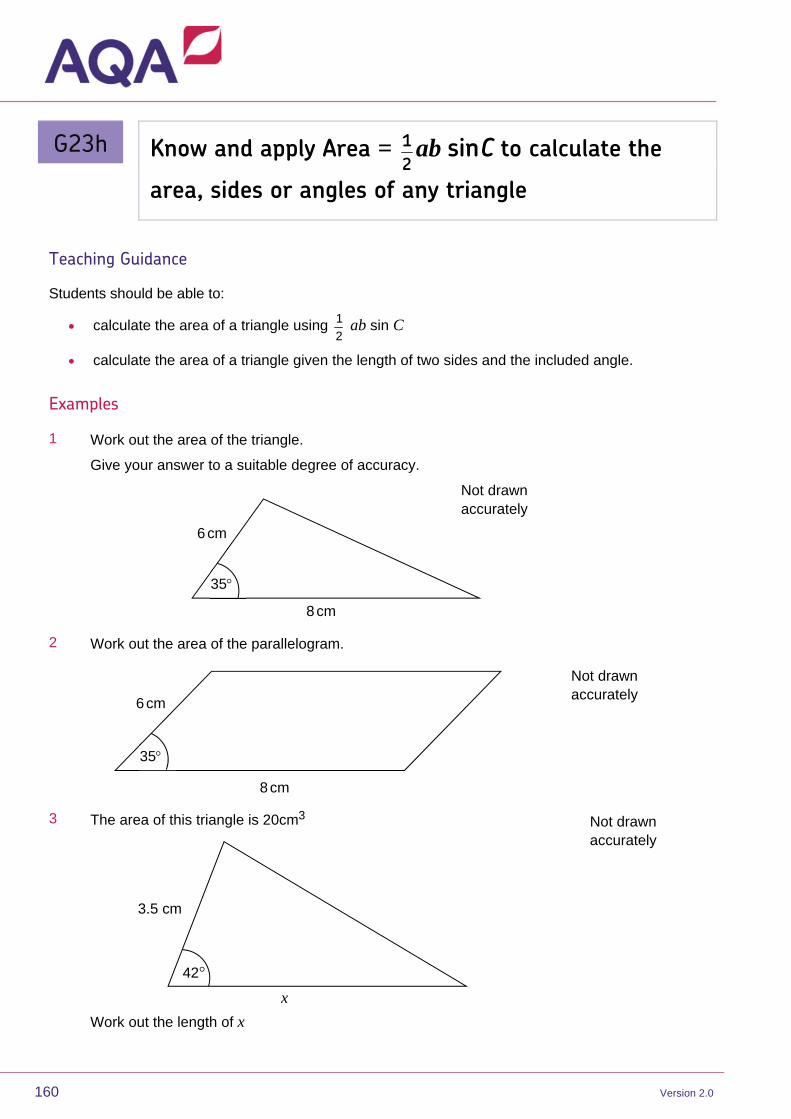
160 Version 2.0
G23h Know and apply Area =
2
1 ab sin C to calculate the
area, sides or angles of any triangle
Teaching Guidance
Students should be able to:
calculate the area of a triangle using 2
1 ab sin C
calculate the area of a triangle given the length of two sides and the included angle.
Examples
1 Work out the area of the triangle.
Give your answer to a suitable degree of accuracy.
2 Work out the area of the parallelogram.
3 The area of this triangle is 20cm3
Work out the length of x
Not drawn accurately
6cm
8cm
35
Not drawn accurately
6cm
8cm
35
Not drawn accurately
3.5 cm
42°
x

GCSE MATHEMATICS 8300 TEACHING GUIDANCE
Version 2.0 161
11
Geometry and measures – Vectors
G24 Describe translations as 2D vectors
Teaching Guidance
Students should be able to:
understand and use vector notation for translations
use column vector notation to describe a translation in 2D.
Notes
Students could be asked to translate a shape by, for example
2
5
See G8
Examples
1 Grid with diagram showing shape A given.
The vector to translate shape A to shape B is
1
5
Draw shape B.
2 The vector to translate shape A to shape B is
1
5
Write down the vector for translating shape B to shape A.
3 Draw a right-angled triangle on the grid and then translate the triangle by vector
1
5
Label your original triangle A and your new triangle B.
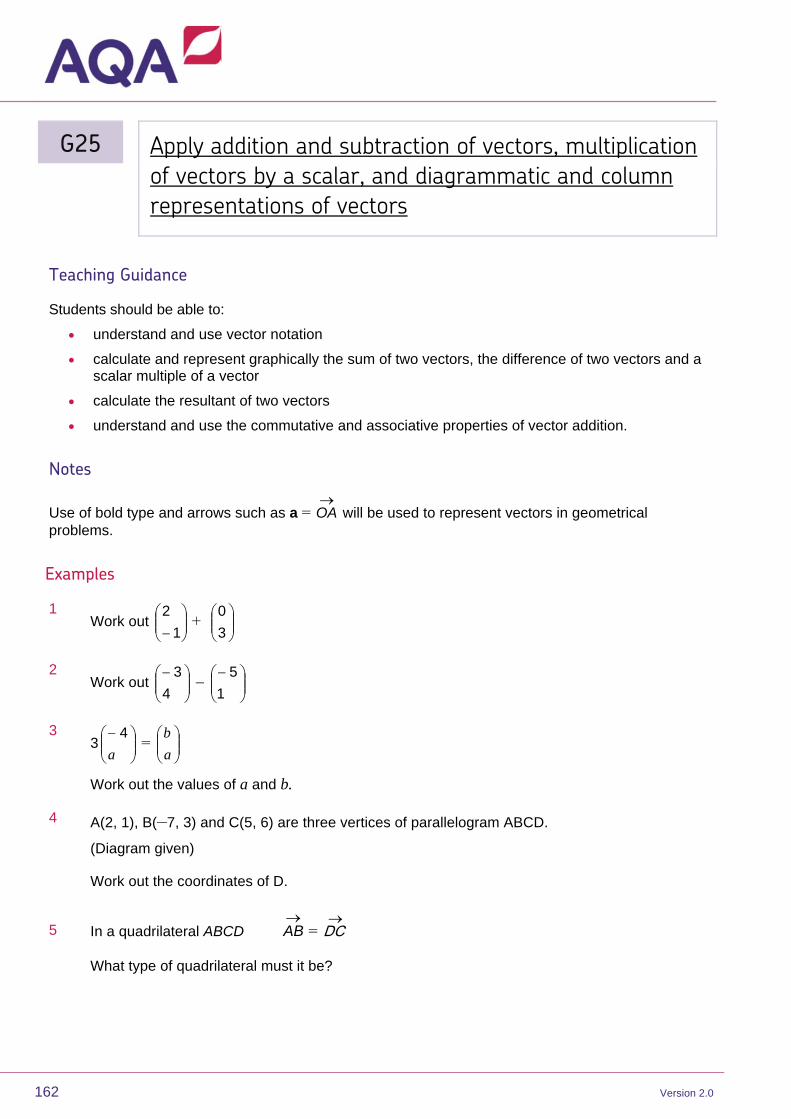
162 Version 2.0
G25 Apply addition and subtraction of vectors, multiplication
of vectors by a scalar, and diagrammatic and column
representations of vectors
Teaching Guidance
Students should be able to:
understand and use vector notation
calculate and represent graphically the sum of two vectors, the difference of two vectors and a scalar multiple of a vector
calculate the resultant of two vectors
understand and use the commutative and associative properties of vector addition.
Notes
Use of bold type and arrows such as a = OA will be used to represent vectors in geometrical
problems.
Examples
1 Work out
1
2 +
3
0
2 Work out
4
3
1
5
3 3
a
4 =
a
b
Work out the values of a and b.
4 A(2, 1), B(–7, 3) and C(5, 6) are three vertices of parallelogram ABCD.
(Diagram given)
Work out the coordinates of D.
5 In a quadrilateral ABCD AB =
DC
What type of quadrilateral must it be?

GCSE MATHEMATICS 8300 TEACHING GUIDANCE
Version 2.0 163
6 In a quadrilateral ABCD AB = 3
DC
What is the special name of the quadrilateral?
7
(a) Write SQ in terms of a and b
(b) Write RS in terms of a and b
4a
P Q R
Not drawn accurately
3b 2b
S

164 Version 2.0
G25h Apply addition and subtraction of vectors, multiplication
of vectors by a scalar, and diagrammatic and column
representations of vectors; use vectors to construct
geometric arguments and proofs
Teaching Guidance
Students should be able to:
solve simple geometrical problems in 2D using vector methods
apply vector methods for simple geometric proofs
recognise when lines are parallel using vectors
recognise when three or more points are colinear using vectors
use vectors to show three or more points are collinear.
Notes
Bold type and arrows such as a = OA will be used to represent vectors in geometrical problems.
Examples
1 PQRS is a parallelogram.
M is the midpoint of SR
N is the midpoint of QR
(a) Write SQ in terms of a and b
(b) Prove that
MN is parallel to
SQ
Not drawn accurately
2b
R
Q P
M
N
S
3a

GCSE MATHEMATICS 8300 TEACHING GUIDANCE
Version 2.0 165
12
Probability
P1 Record, describe and analyse the frequency of outcomes
of probability experiments using tables and frequency
trees
Teaching Guidance
Students should be able to:
design and use two-way tables
complete a two-way table from given information
complete a frequency table for the outcomes of an experiment
understand and use the term relative frequency
consider differences, where they exist, between the theoretical probability of an outcome and its relative frequency in a practical situation
complete a frequency tree from given information
use a frequency tree to compare frequencies of outcomes.
Notes
Probabilities should be written as fractions, decimals or percentages.
Examples
1 A dice is rolled 40 times.
The results are shown.
1 2 3 4 5 6
Frequency 7 8 9 4 10 2
Work out the relative frequency of rolling an even number.
2 In an experiment, a rat turns either left or right in a maze to find food.
After 200 experiments, the relative frequency of the rat turning left was 0.45
How many times did the rat turn right in the 200 experiments?
3 Construct or use a two-way table showing, for example, left and right handed girls and boys.

166 Version 2.0
4 A gym manager keeps a record of which of the 400 customers use the pool.
There are 20 more male customers than female customers.
60% of the female customers use the pool.
3
1of the male customers use the pool.
Complete the frequency tree.
Use
Don’t use
Use
Don’t use
Female
Male
400
Gender Pool

GCSE MATHEMATICS 8300 TEACHING GUIDANCE
Version 2.0 167
P2 Apply ideas of randomness, fairness and equally likely
events to calculate expected outcomes of multiple future
experiments
Teaching Guidance
Students should be able to:
use lists or tables to find probabilities
understand that experiments rarely give the same results when there is a random process involved
appreciate the ‘lack of memory’ in a random situation, for example a fair coin is still equally likely to give heads or tails even after five heads in a row.
Examples
1 A fair dice is rolled several times.
Here are some of the results.
4 6 2 4 3 1 1 1 1 1
On the next roll, what is the probability of a 1?
2 A fair dice is rolled 60 times.
How many times would you expect to roll a six?

168 Version 2.0
P3 Relate relative expected frequencies to theoretical
probability, using appropriate language and the 0 - 1
probability scale
Teaching Guidance
Students should be able to:
understand and use the term relative frequency
consider differences where they exist between the theoretical probability of an outcome and its relative frequency in a practical situation
recall that an ordinary fair dice is an unbiased dice numbered 1, 2, 3, 4, 5 and 6 with equally likely outcomes
estimate probabilities by considering relative frequency.
Examples
1 Which of these values could not represent a probability?
0.6 1.2 0.05 3
4 5
4
2 Look at these outcomes for an ordinary fair dice.
A roll the number 1
B roll a 7
C roll a number less than 7
Draw a probability scale.
Indicate the positions of the probabilities for outomes A, B and C.
3 A bag contains blue, red and green counters.
The probability of picking a blue counter = the probability of picking a red counter
The probability of picking a green counter = 0.3
Complete this table.
Colour Number of counters
Blue 14
Red
Green

GCSE MATHEMATICS 8300 TEACHING GUIDANCE
Version 2.0 169
4 United have won 12 of the last 20 games they played.
(a) What is the relative frequency of wins?
(b) Use your answer to part (a) to estimate the probability that United will win their next game.
(c) Why may this not be a good method to use for estimating this probability?

170 Version 2.0
P4 Apply the property that the probabilities of an exhaustive
set of outcomes sum to 1; apply the property that the
probabilities of an exhaustive set of mutually exclusive
events sum to 1
Teaching Guidance
Students should be able to:
understand when outcomes can or cannot happen at the same time
use this understanding to calculate probabilities
appreciate that the sum of the probabilities of all possible mutually exclusive outcomes has to be 1
find the probability of a single outcome from knowing the probability of all other outcomes.
Examples
1 A spinner can land on 1, 2, 3 or 4
Some of the probabilities are shown in the table.
Probability
1 0.274
2
3 0.216
4 0.307
Work out the missing probability.
2 Here are some outcomes for rolling a dice.
A rolling a 6
B rolling an odd number
C rolling a number greater than 5
D rolling a 4
E rolling an even number
F rolling a 1
(a) Sort these outcomes into pairs that can happen at the same time.
(b) Write down the sum of the probabilities of outcome B and outcome E.

GCSE MATHEMATICS 8300 TEACHING GUIDANCE
Version 2.0 171
3 The probability that Andy passes his driving test is 0.67
Work out the probability that Andy does not pass his driving test.
4 In a fairground game, you either lose, win a small prize or win a large prize.
The probability of losing is 4
3
The probability of winning a small prize is 16
3
Work out the probability of winning a large prize.

172 Version 2.0
P5 Understand that empirical unbiased samples tend
towards theoretical probability distributions, with
increasing sample size
Teaching Guidance
Students should be able to:
understand that the greater the number of trials in an experiment, the more reliable the results are likely to be
understand how a relative frequency diagram may show a settling down as sample size increases, enabling an estimate of a probability to be reliably made; and that if an estimate of a probability is required, the relative frequency of the largest number of trials available should be used.
Examples
1 From a relative frequency diagram:
Use the diagram to make the best estimate of the probability of picking a red disc.
2 Aisha catches 10 frogs at random from a pond and measures their weight.
She then uses the data to estimate the mean weight of a frog in the pond.
How could she obtain a more reliable estimate for this mean?
3 The table shows the number of heads obtained in every 10 flips of a coin.
Trials 1st 10 2nd 10 3rd 10 4th 10 5th 10
Number of heads 3 2 2 1 2
Draw a relative frequency graph for this data (graph paper available).
Use your graph or otherwise to estimate the probability of a head for this coin.

GCSE MATHEMATICS 8300 TEACHING GUIDANCE
Version 2.0 173
P6 Enumerate sets and combinations of sets systematically,
using tables, grids, Venn diagrams and tree diagrams
Teaching Guidance
Students should be able to:
complete tables and /or grids to show outcomes and probabilities
complete a tree diagram to show outcomes and probabilities
understand that P(A) means the probability of event A
understand that P(A/) means the probability of event not A
understand that P(A B) means the probability of event A or B or both
understand that P(A B) means the probability of event A and B
understand a Venn diagram consisting of a universal set and at most two sets, which may or may not intersect
shade areas on a Venn diagram involving at most two sets, which may or may not intersect
solve problems given a Venn diagram
solve problems where a Venn diagram approach is a suitable strategy to use but a diagram is not given in the question.

174 Version 2.0
Notes
Students should know the following notations and the associated shaded area on a Venn diagram.
A B
A B to mean the intersection of A and B
A B
A B to mean the union of A and B
A B
A/ to mean everything not in A
A B
A/ B to mean everything not in A that is in B
A B
A/ B to mean the union of A/ and B
A B
(A B) / = A/ B/ to mean everything not in the intersection
A B
(A B)/ = A/ B/ to mean everything not in the union

GCSE MATHEMATICS 8300 TEACHING GUIDANCE
Version 2.0 175
Examples
1 You are given that P(A) = 0.7
Work out P(A/)
2 In the Venn diagram
= students in a year group
A = left-handed students
B = vegetarians
(a) Write down P(A B)
(b) How many students are in the year group altogether?
(c) A student from the year group is chosen at random.
What is the probability that the student is a right-handed vegetarian?
3 On the Venn diagram, shade the area that represents P/ Q
4 A garage has 50 cars for sale.
16 of the cars have air conditioning and ABS brakes.
32 of the cars have air conditioning.
18 of the cars have ABS brakes.
Work out how many of the cars do not have air conditioning or ABS brakes.
A B
25 15 45
115
P Q
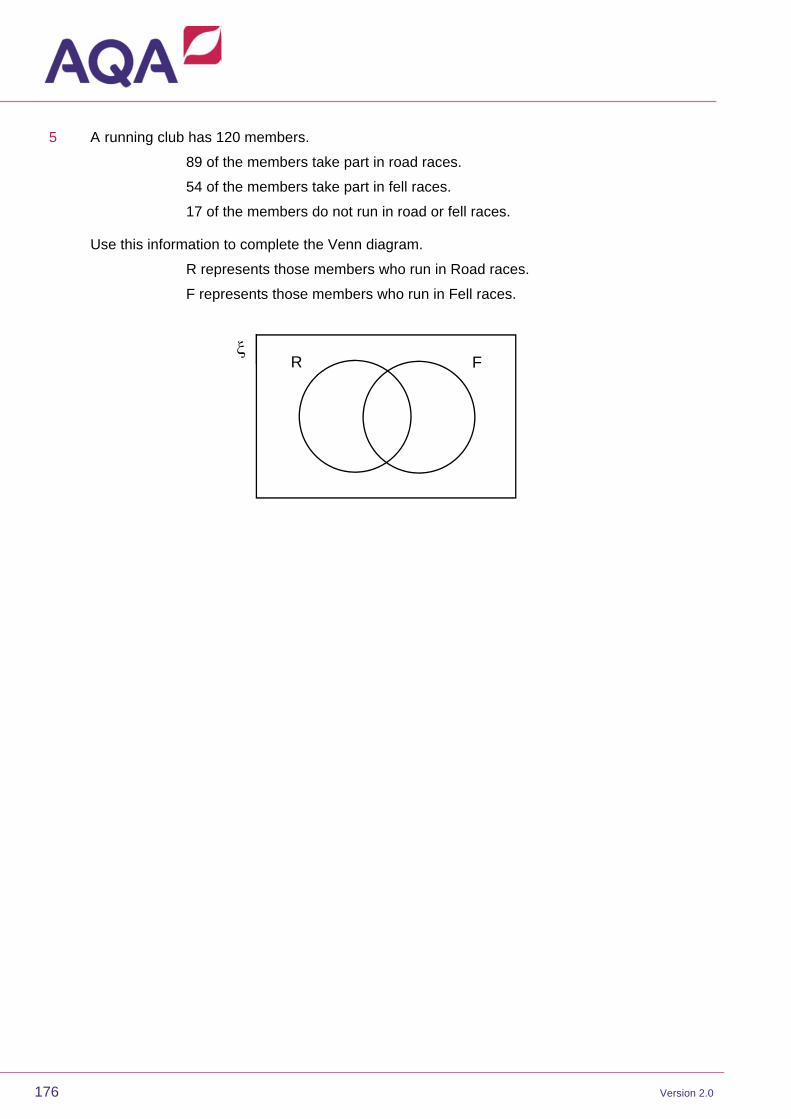
176 Version 2.0
5 A running club has 120 members.
89 of the members take part in road races.
54 of the members take part in fell races.
17 of the members do not run in road or fell races.
Use this information to complete the Venn diagram.
R represents those members who run in Road races.
F represents those members who run in Fell races.
R F

GCSE MATHEMATICS 8300 TEACHING GUIDANCE
Version 2.0 177
P7 Construct theoretical possibility spaces for single and
combined experiments with equally likely outcomes and
use these to calculate theoretical probabilities
Teaching Guidance
Students should be able to:
list all the outcomes for a single event in a systematic way
list all the outcomes for two events in a systematic way
design and use two-way tables
complete a two-way table from given information
design and use frequency trees
work out probabilities by counting or listing equally likely outcomes.
Examples
1 A fair dice is rolled twice.
Show all the possible total scores in a two-way table.
(Outline usually given)
Use the table to find the probability that the total is 10
2 A drinks machine sells Tea (T), Coffee (C) and Soup (S).
Gareth buys 2 drinks at random.
List all the possible pairs of drinks he could buy.
Use your list to find the probability that both drinks are the same.
3 Jane has two of the same type of coin.
Work out the probability that she has at least £1 in total.

178 Version 2.0
P8 Calculate the probability of independent and dependent
combined events, including using tree diagrams and
other representations, and know the underlying
assumptions
Teaching Guidance
Students should be able to:
know when it is appropriate to add probabilities
know when it is appropriate to multiply probabilities
understand the meaning of independence for events
calculate probabilities when events are dependent
understand the implications of with or without replacement problems for the probabilities obtained
complete a tree diagram to show outcomes and probabilities
use a tree diagram as a method for calculating probabilities for independent or dependent events.
Examples
1 Dan wants a ‘Ben 10’ watch for this birthday.
The probability that his gran will buy him one is 0.4
The probability that his brother will buy him one is 0.6
(a) What is the probability that both his brother and his gran buy Dan the watch?
(b) What is the assumption you made to answer part (a)?
(c) Is this a fair assumption to make in this context?
2 A car showroom has 20 cars for sale.
Eight of these cars are silver.
A blue car is sold.
What is the probability that the next car sold is silver? Assume each car has an equally likely chance of being sold.

GCSE MATHEMATICS 8300 TEACHING GUIDANCE
Version 2.0 179
3 Two people from a club are chosen at random to show the local MP around the facilities.
(Tree diagram partially completed given.)
Complete the tree diagram to show the probabilities of the first and second person chosen being male or female.
4 4% of items produced by a machine are faulty.
Two items are chosen at random from the production of this machine.
Draw a tree diagram to show the probabilities of choosing faulty or not faulty items.
(No structure given.)
5 A fair coin is thrown three times.
Work out the probability of throwing exactly two heads.
6 Amy and Becky want to be chosen for the hockey and netball teams.
Their estimates for the probabilities of being chosen (assumed independent) are shown in the table below.
Hockey Netball
Amy 0.8 0.7
Becky 0.6 0.25
Calculate the probability that
(a) Becky will be chosen for both teams
(b) both girls are chosen for only the netball team.

180 Version 2.0
P9h
Calculate and interpret conditional probabilities
through representation using expected frequencies
with two-way tables, tree diagrams and Venn
diagrams
Teaching Guidance
Students should be able to:
understand conditional probability
understand the implications of with or without replacement problems for the probabilities obtained
complete a tree diagram to show outcomes and probabilities
use a tree diagram as a method for calculating conditional probabilities
use a Venn diagram as a method for calculating conditional probabilities.
Examples
1 A car showroom has 20 cars for sale.
Eight of these cars are silver.
Calculate the probability that the next two cars sold are not silver?
Assume each car has an equally likely chance of being sold.
2 There are 5 red and 7 blue counters in a bag.
I take two counters out at random.
Work out the probability that both are red counters.
(A tree diagram problem to help work combined probabilities)

GCSE MATHEMATICS 8300 TEACHING GUIDANCE
Version 2.0 181
3 80 people in a sports club were surveyed.
14 played tennis and squash
56 played tennis
30 played squash.
(a) Complete the Venn diagram.
(b) One person is chosen at random.
Work out the probability that
(i) the person chosen did not play tennis
(ii) the person chosen played tennis or squash or both.
(c) What is the probability that a person chosen at random who plays squash also plays tennis?
T S
14

182 Version 2.0
13
Statistics
S1 Infer properties of populations or distributions from a
sample, whilst knowing the limitations of sampling
Teaching Guidance
Students should be able to:
find patterns in data that may lead to a conclusion being drawn
look for unusual data values such as a value that does not fit an otherwise good correlation
understand that samples may or may not be representative of a population
understand that the size and construction of a sample will affect how representative it is.
Examples
1 Jerry has a hypothesis that most days at his house are dry.
In June there were 20 dry days at his house.
Give a reason why this may not support Jerry’s hypothesis.
2 The data shows the number of passengers on bus services during one morning.
29 45 43 38 29 21 14 12 11 7 12
Buses are every 30 minutes starting from 7 am.
(a) What time was the bus with the fewest passengers?
(b) Estimate the time of the morning ‘rush hour’.
(c) Give a reason for your answer to part (b).
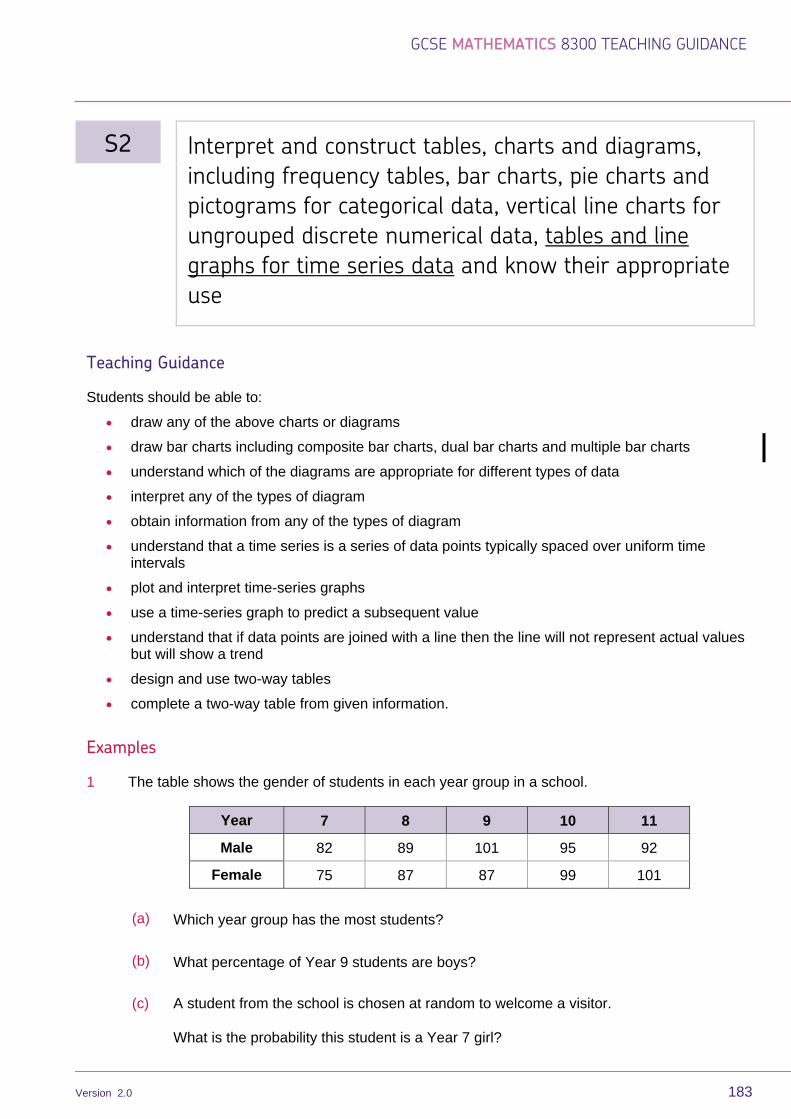
GCSE MATHEMATICS 8300 TEACHING GUIDANCE
Version 2.0 183
S2 Interpret and construct tables, charts and diagrams,
including frequency tables, bar charts, pie charts and
pictograms for categorical data, vertical line charts for
ungrouped discrete numerical data, tables and line
graphs for time series data and know their appropriate
use
Teaching Guidance
Students should be able to:
draw any of the above charts or diagrams
draw bar charts including composite bar charts, dual bar charts and multiple bar charts
understand which of the diagrams are appropriate for different types of data
interpret any of the types of diagram
obtain information from any of the types of diagram
understand that a time series is a series of data points typically spaced over uniform time intervals
plot and interpret time-series graphs
use a time-series graph to predict a subsequent value
understand that if data points are joined with a line then the line will not represent actual values but will show a trend
design and use two-way tables
complete a two-way table from given information.
Examples
1 The table shows the gender of students in each year group in a school.
Year 7 8 9 10 11
Male 82 89 101 95 92
Female 75 87 87 99 101
(a) Which year group has the most students?
(b) What percentage of Year 9 students are boys?
(c) A student from the school is chosen at random to welcome a visitor.
What is the probability this student is a Year 7 girl?

184 Version 2.0
2 5% of a flock of sheep are black and the rest are white.
4
1 of the black sheep and 2
1 of the white sheep have been sheared.
Complete the two-way table.
Sheared sheep Unsheared sheep
Black sheep 4
White sheep
3 The table shows the number of shoppers the weekend before a sale and the weekend of the sale.
Saturday Sunday
Weekend before sale 675 389
Weekend of sale 741 419
Does the data provide evidence to support a claim of a 10% increase in shoppers during the sale?
4 The table shows the gender of students in each year group in a school.
Year 7 8 9 10 11
Male 82 89 101 95 92
Female 75 87 87 99 101
Show this data on a suitable diagram.
(Graph paper provided with no axes or labels)
5 The table shows information about a large flock of sheep.
Sheared sheep Unsheared sheep
Black sheep 24 16
White sheep 176 264
Draw a pie chart to illustrate the data.

GCSE MATHEMATICS 8300 TEACHING GUIDANCE
Version 2.0 185
S3h
Construct and interpret diagrams for grouped
discrete and continuous data, ie histograms with
equal and unequal class intervals and cumulative
frequency graphs, and know their appropriate use
Teaching Guidance
Students should be able to:
understand which diagrams are appropriate for different types of data
construct suitable diagrams for grouped discrete and continuous data
interpret diagrams for grouped discrete and continuous data.
Examples
1 The table shows the time taken for 100 runners to finish a fun run.
Time, t (minutes) Frequency
10 t ⩽ 20 8
20 t ⩽ 30 26
30 t ⩽ 40 51
40 t ⩽ 50 15
Draw a cumulative frequency diagram for the data.
2 The table shows the length of 100 bolts.
Length, l (mm) Frequency
10 l ⩽ 11 12
11 l ⩽ 11.5 25
11.5 l ⩽ 12 30
12 l ⩽ 13 19
13 l ⩽15 14
Show this information in an appropriate diagram.
3 Histogram given for ages of people.
Use the histogram to work out the number of people under 60 years old.

186 Version 2.0
S4 Interpret, analyse and compare the distributions of data
sets from univariate empirical distributions through:
appropriate graphical representation involving discrete,
continuous and grouped data
appropriate measures of central tendency (median, mean,
mode and modal class) and spread (range, including
consideration of outliers)
Teaching Guidance
Students should be able to:
decide whether data is discrete or continuous and use this decision to make sound judgements in choosing suitable diagrams for the data
understand the difference between grouped and ungrouped data
understand the advantages and disadvantages of grouping data
distinguish between primary and secondary data
use lists, tables or diagrams to find values for the above measures
find the mean for a discrete frequency distribution
find the median for a discrete frequency distribution
find the mode or modal class for frequency distributions
calculate an estimate of the mean for a grouped frequency distribution, knowing why it is an estimate
find the interval containing the median for a grouped frequency distribution
choose an appropriate measure to be the ‘average’, according to the nature of the data
identify outliers
find patterns in data that may lead to a conclusion being drawn

GCSE MATHEMATICS 8300 TEACHING GUIDANCE
Version 2.0 187
Examples
1 125 people raise money for charity.
They raise £5212.50 altogether.
Work out the mean amount raised per person.
2 Bags of crisps are labelled as containing 25 g
20 bags are sampled and their weights, measured to the nearest gram, are shown below.
26 25 26 27 24 26 25 26 25 22
26 26 25 24 27 26 25 25 25 25
(a) Work out the mode.
(b) Work out the median.
(c) Work out the mean.
(d) Comment on the label of 25 g based on the data and your results from parts (a), (b) and (c).
3 The table shows the heights of 100 five-year-old boys.
Height, h (cm) Frequency
80 ⩽ h 90 8
90 ⩽ h 100 31
100 ⩽ h 110 58
110 ⩽ h 120 3
(a) Calculate an estimate of the mean height of these boys.
(b) Give a reason why your answer to part (a) is an estimate.

188 Version 2.0
4 The table shows the gender of students in each year group in a school.
Year 7 8 9 10 11
Male 82 89 101 95 92
Female 75 87 87 99 101
Compare the data for the boys with the data for girls.
5 19 athletes complete a marathon.
The times (in minutes) of the 10 professional athletes are:
133 134 136 139 141 143 144 145 151 158
The times (in minutes) of the 9 amateur athletes are:
139 147 151 152 159 161 167 178 182
Compare the times of the two groups of athletes.
6 The table shows the number of diners at each table in a hotel at 8 pm on Monday night and 8 pm on Friday night.
8 pm Monday night 8 pm Friday night
Number Frequency Number Frequency
0 18 0 0
1 2 1 0
2 3 2 16
3 1 3 2
4 1 4 5
6 0 6 2
Compare the numbers of diners at each table on these nights.
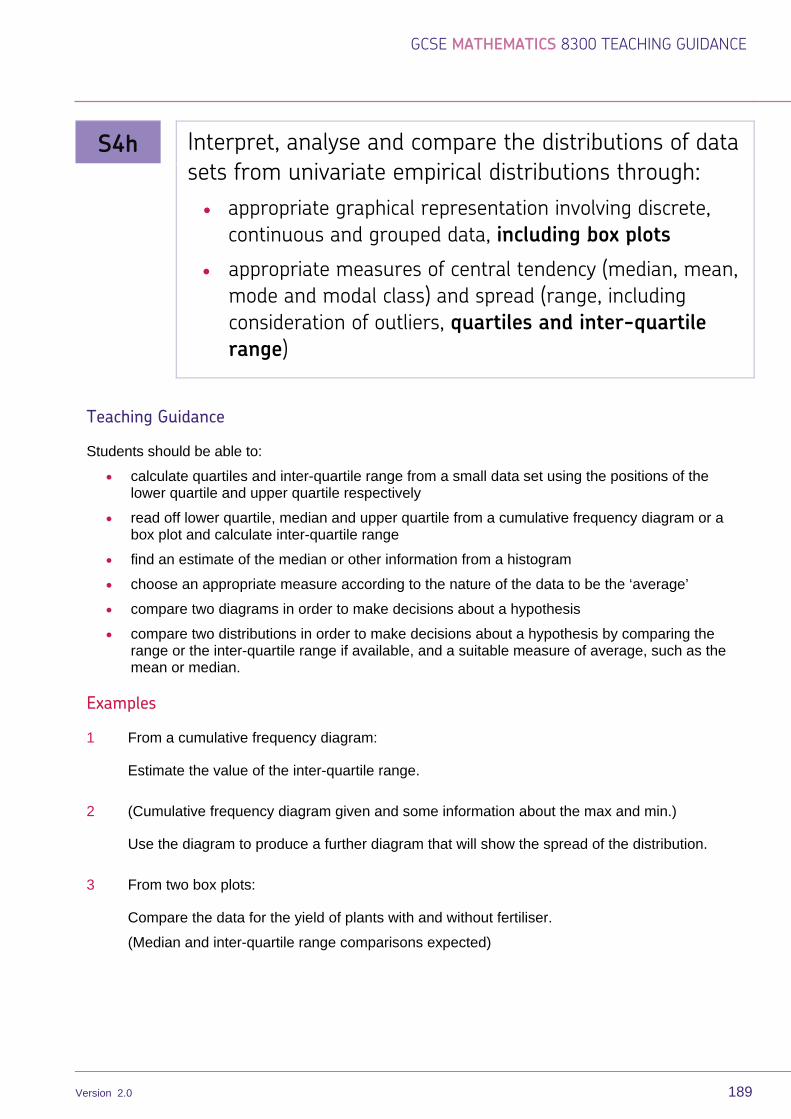
GCSE MATHEMATICS 8300 TEACHING GUIDANCE
Version 2.0 189
S4h
Interpret, analyse and compare the distributions of data
sets from univariate empirical distributions through:
appropriate graphical representation involving discrete,
continuous and grouped data, including box plots
appropriate measures of central tendency (median, mean,
mode and modal class) and spread (range, including
consideration of outliers, quartiles and inter-quartile
range)
Teaching Guidance
Students should be able to:
calculate quartiles and inter-quartile range from a small data set using the positions of the lower quartile and upper quartile respectively
read off lower quartile, median and upper quartile from a cumulative frequency diagram or a box plot and calculate inter-quartile range
find an estimate of the median or other information from a histogram
choose an appropriate measure according to the nature of the data to be the ‘average’
compare two diagrams in order to make decisions about a hypothesis
compare two distributions in order to make decisions about a hypothesis by comparing the range or the inter-quartile range if available, and a suitable measure of average, such as the mean or median.
Examples
1 From a cumulative frequency diagram:
Estimate the value of the inter-quartile range.
2 (Cumulative frequency diagram given and some information about the max and min.)
Use the diagram to produce a further diagram that will show the spread of the distribution.
3 From two box plots:
Compare the data for the yield of plants with and without fertiliser.
(Median and inter-quartile range comparisons expected)

190 Version 2.0
S5 Apply statistics to describe a population
Teaching Guidance
Students should be able to:
use measures of central tendency and measures of dispersion to describe a population
use statistical diagrams to describe a population.
Examples
1 The following data was obtained from a large sample survey of the people attending a Premiership football match.
% Mean age (years) Interquartile range
of ages (years)
Male 77 48.8 20.1
Female 23 45.3 9.2
Describe the population attending the football match.

GCSE MATHEMATICS 8300 TEACHING GUIDANCE
Version 2.0 191
S6 Use and interpret scatter graphs of bivariate data;
recognise correlation and know that it does not indicate
causation; draw estimated lines of best fit; make
predictions; interpolate and extrapolate apparent trends
whilst knowing the dangers of so doing
Teaching Guidance
Students should be able to:
recognise and name positive, negative or no correlation as types of correlation
recognise and name strong, moderate or weak correlation as strengths of correlation
understand that just because a correlation exists, it does not necessarily mean that causality is present
draw a line of best fit by eye for data with strong enough correlation, or know that a line of best fit is not justified due to the lack of correlation
understand outliers and make decisions whether or not to include them when drawing a line of best fit
use a line of best fit to estimate unknown values when appropriate.
look for unusual data values such as a value that does not fit an otherwise good correlation.
Examples
1 From a scatter diagram:
(a) Write the down the strength and type of correlation shown by the diagram.
(b) Interpret your answer to part (a) in the context of the question.
2 Draw a line of best fit on a scatter diagram, make predictions, interpolate and comment on the dangers of extrapolation.

192 Version 2.0
14
Appendices
Mathematical formulae
1 Students are expected to know the following formulae
included in the subject content; they will not be given
in the exam.
The quadratic formula
The solutions of 02 cbxax , where 0a
xa
acbb
2
42 )_(_
Circumference and area of a circle
Where r is the radius and d is the diameter:
Circumference of a circle dr ππ 2
Area of a circle 2rπ
Pythagoras’s theorem
In any right-angled triangle where a, b and c are lengths of the sides and c is the hypotenuse:
222 cba
c
b
a
A

GCSE MATHEMATICS 8300 TEACHING GUIDANCE
Version 2.0 193
Trigonometry formulae
In any right-angled triangle ABC where a, b and c are lengths of the sides and c is the hypotenuse:
sin A = c
a , cos A =
c
b , tan A =
b
a
In any triangle ABC where a, b and c are lengths of sides:
sine rule A
a
sin =
B
b
sin =
C
c
sin
cosine rule a 2 = b 2 + c 2 2bc cos A
Area = 2
1 ab sin C
b a
c A B
C
c
b
a
A

194 Version 2.0
2 Students are expected to know the following formulae
or be able to derive them; they will not be given in the
exam.
Perimeter, area, surface area and volume formulae
Where a and b are the lengths of the parallel sides and h is their perpendicular separation:
Area of a trapezium = 2
1 (a + b)h
Volume of a prism = area of cross section length
Compound interest
Where P is the principal amount, r is the interest rate over a given period and n is number of times that the interest is compounded:
Total accrued = Pn
r
1001
Probability
Where P(A) is the probability of outcome A and P(B) is the probability of outcome B:
BAPBPAPBAP andor
BPB APBAP givenand

GCSE MATHEMATICS 8300 TEACHING GUIDANCE
Version 2.0 195
3 Students are not expected to memorise the following
formulae; they will be given in the exam, either in the
relevant question, or in a list from which students select
and apply as appropriate.
Perimeter, area, surface area and volume formulae
Where r is the radius of the sphere or cone, l is the slant height of a cone and h is the perpendicular height of a cone:
Curved surface area of a cone = rlπ
Surface area of a sphere = 24 rπ
Volume of a sphere = 3
4 3rπ
Volume of a cone = 3
1 hr 2π
Kinematics formulae
Where a is a constant acceleration, u is initial velocity, v is final velocity, s is displacement from the position when 0t and t is time taken:
atuv
s = ut + 2
1 at 2
asuv 222
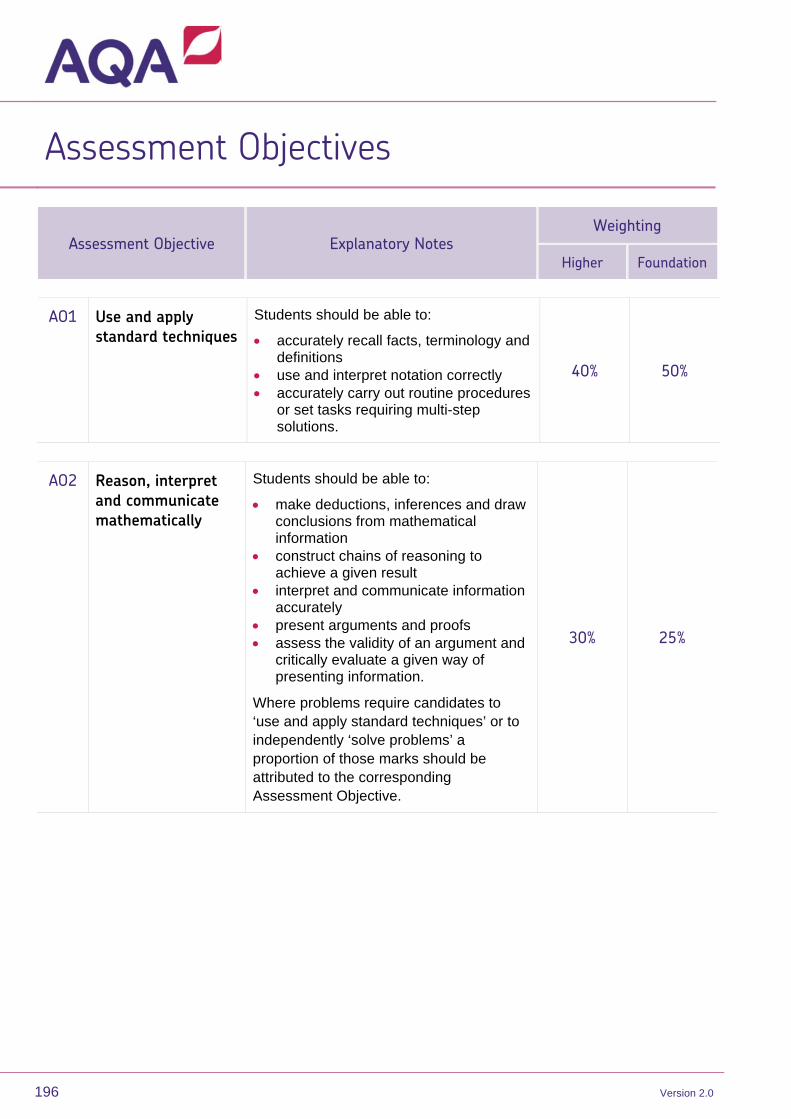
196 Version 2.0
Assessment Objectives
Assessment Objective Explanatory Notes
Weighting
Higher Foundation
AO1 Use and apply
standard techniques
Students should be able to:
accurately recall facts, terminology and definitions
use and interpret notation correctly accurately carry out routine procedures
or set tasks requiring multi-step solutions.
40% 50%
AO2 Reason, interpret
and communicate
mathematically
Students should be able to:
make deductions, inferences and draw conclusions from mathematical information
construct chains of reasoning to achieve a given result
interpret and communicate information accurately
present arguments and proofs assess the validity of an argument and
critically evaluate a given way of presenting information.
Where problems require candidates to ‘use and apply standard techniques’ or to independently ‘solve problems’ a proportion of those marks should be attributed to the corresponding Assessment Objective.
30% 25%

GCSE MATHEMATICS 8300 TEACHING GUIDANCE
Version 2.0 197
Assessment Objective Explanatory Notes
Weighting
Higher Foundation
AO3 Solve problems
within mathematics
and in other
contexts
Students should be able to:
translate problems in mathematical or non-mathematical contexts into a process or a series of mathematical processes
make and use connections between different parts of mathematics
interpret results in the context of the given problem
evaluate methods used and results obtained
evaluate solutions to identify how they may have been affected by assumptions made
Where problems require candidates to ‘use and apply standard techniques’ or to ‘reason, interpret and communicate mathematically’ a proportion of those marks should be attributed to the corresponding Assessment Objective.
30% 25%

Get help and support
Visit our website for information, guidance, support and resources at aqa.org.uk/8300
You can talk directly to the Mathematical Studies subject team
T: 0161 957 3852
aqa.org.uk
Copyright © 2014 AQA and its licensors. All rights reserved.
AQA retains the copyright on all its publications, including specifications. However, schools and colleges registered with AQA are permitted to copy material from this Teaching guidance for their own internal use.
AQA Education (AQA) is a registered charity ( number 1073334) and a company limited by guarantee registered in England and Wales (company number 3644723). Our registered address is AQA, Devas Street, Manchester M15 6EX.
SP/08/14