aqr managed futures strategy fund - portfolio …psimms.com/wp-content/uploads/2012/09/aqr2.pdfaqr...
TRANSCRIPT
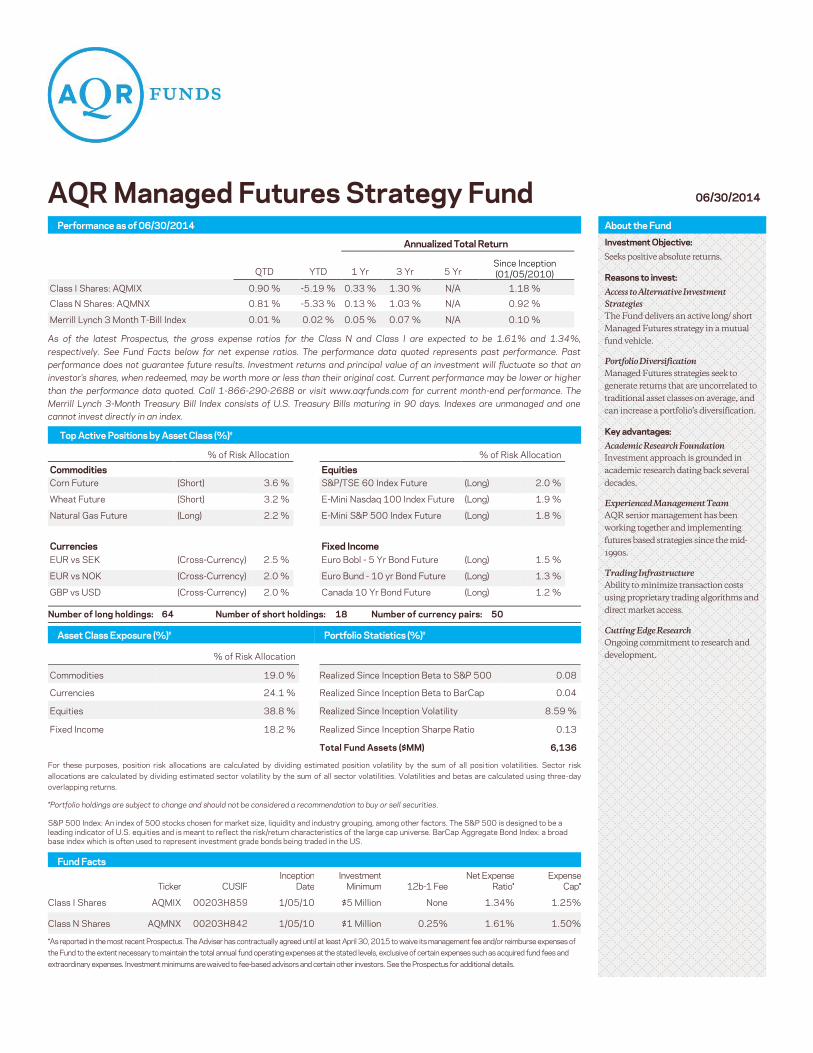
AQR Managed Futures Strategy Fund Performance as of 06/30/2014 About the Fund
Annualized Total Return
QTD YTD 1 Yr 3 Yr 5 Yr Since Inception
(01/05/2010)
Class I Shares: AQMIX 0.90 % -5.19 % 0.33 % 1.30 % N/A 1.18 %
Class N Shares: AQMNX 0.81 % -5.33 % 0.13 % 1.03 % N/A 0.92 %
Merrill Lynch 3 Month T-Bill Index 0.01 % 0.02 % 0.05 % 0.07 % N/A 0.10 %
Investment Objective:
Seeks positive absolute returns.
Reasons to invest:
Access to Alternative Investment
Strategies
The Fund delivers an active long/ short
Managed Futures strategy in a mutual
fund vehicle.
Portfolio Diversification
Managed Futures strategies seek to
generate returns that are uncorrelated to
traditional asset classes on average, and
can increase a portfolio’s diversification.
Key advantages:
Academic Research Foundation
Investment approach is grounded in
academic research dating back several
decades.
Experienced Management Team
AQR senior management has been
working together and implementing
futures based strategies since the mid-
1990s.
Trading Infrastructure
Ability to minimize transaction costs
using proprietary trading algorithms and
direct market access.
Cutting Edge Research
Ongoing commitment to research and
development.
As of the latest Prospectus, the gross expense ratios for the Class N and Class I are expected to be 1.61% and 1.34%,
respectively. See Fund Facts below for net expense ratios. The performance data quoted represents past performance. Past
performance does not guarantee future results. Investment returns and principal value of an investment will fluctuate so that an
investor’s shares, when redeemed, may be worth more or less than their original cost. Current performance may be lower or higher
than the performance data quoted. Call 1-866-290-2688 or visit www.aqrfunds.com for current month-end performance. The
Merrill Lynch 3-Month Treasury Bill Index consists of U.S. Treasury Bills maturing in 90 days. Indexes are unmanaged and one
cannot invest directly in an index.
Top Active Positions by Asset Class (%)†
% of Risk Allocation
Commodities
Corn Future (Short) 3.6 %
Wheat Future (Short) 3.2 %
Natural Gas Future (Long) 2.2 %
Currencies
EUR vs SEK (Cross-Currency) 2.5 %
EUR vs NOK (Cross-Currency) 2.0 %
GBP vs USD (Cross-Currency) 2.0 %
% of Risk Allocation
Equities
S&P/TSE 60 Index Future
(Long) 2.0 %
E-Mini Nasdaq 100 Index Future
(Long) 1.9 %
E-Mini S&P 500 Index Future
(Long) 1.8 %
Fixed Income
Euro Bobl - 5 Yr Bond Future (Long) 1.5 %
Euro Bund - 10 yr Bond Future (Long) 1.3 %
Canada 10 Yr Bond Future (Long) 1.2 %
Number of long holdings: 64 Number of short holdings: 18 Number of currency pairs: 50
Asset Class Exposure (%)† Portfolio Statistics (%)†
% of Risk Allocation
Commodities 19.0 %
Currencies 24.1 %
Equities 38.8 %
Fixed Income 18.2 %
Realized Since Inception Beta to S&P 500 0.08
Realized Since Inception Beta to BarCap
Agg
0.04
Realized Since Inception Volatility 8.59 %
Realized Since Inception Sharpe Ratio 0.13
Total Fund Assets ($MM)
6,136
For these purposes, position risk allocations are calculated by dividing estimated position volatility by the sum of all position volatilities. Sector risk
allocations are calculated by dividing estimated sector volatility by the sum of all sector volatilities. Volatilities and betas are calculated using three-day
overlapping returns.
*Portfolio holdings are subject to change and should not be considered a recommendation to buy or sell securities. S&P 500 Index: An index of 500 stocks chosen for market size, liquidity and industry grouping, among other factors. The S&P 500 is designed to be a
leading indicator of U.S. equities and is meant to reflect the risk/return characteristics of the large cap universe. BarCap Aggregate Bond Index: a broad base index which is often used to represent investment grade bonds being traded in the US.
Fund Facts
Ticker CUSIP
Inception
Date
Investment
Minimum 12b-1 Fee
Net Expense
Ratio*
Expense
Cap*
Class I Shares AQMIX 00203H859 1/05/10 $5 Million None 1.34% 1.25%
Class N Shares AQMNX 00203H842 1/05/10 $1 Million 0.25% 1.61% 1.50%
*As reported in the most recent Prospectus. The Adviser has contractually agreed until at least April 30, 2015 to waive its management fee and/or reimburse expenses of
the Fund to the extent necessary to maintain the total annual fund operating expenses at the stated levels, exclusive of certain expenses such as acquired fund fees and
extraordinary expenses. Investment minimums are waived to fee-based advisors and certain other investors. See the Prospectus for additional details.
06/30/2014

www.aqrfunds.com
Investment Approach Fund Managers
The Fund invests in a portfolio of futures contracts and futures-related instruments [1]
, utilizing more than 100 contracts across four major asset classes: commodities, currencies, fixed income and equities. The fund can take long or short
positions in any of these instruments, and thus seeks to benefit both if the price of the underlying instrument rises or
falls.
Clifford S. Asness, Ph.D. Managing & Founding Principal,
AQR Ph.D., M.B.A., University of
Chicago
B.S., B.S., University of Pennsylvania
John M. Liew, Ph.D. Founding Principal, AQR Ph.D., M.B.A., University of
Chicago
B.A., University of Chicago
Brian Hurst Principal, AQR
B.S., University of Pennsylvania
Yao Hua Ooi Principal, AQR B.S., B.S., University of
Pennsylvania
Ari Levine Vice President, AQR
M.S., B.S., B.S., University of
Pennsylvania
AQR Capital Management, LLC
Individual Investor:
p: +1.866.290.2688
Advisor Support:
p: +1.203.742.3800
Trading Strategies The Adviser seeks to establish long or short positions based on a combination of several trading strategies described below.
Short-Term Trend Strategy This strategy aims to profit from a number of behavioral biases
and market frictions that cause prices to under-react to either good or bad news. These biases present opportunities for the
fund to invest before prices move fully to reflect the change in fundamental value. The key reasons for this under-reaction are:
Anchoring Bias: Investors tend to anchor their views of fair price to the prior price level and adjust their views
insufficiently to news. This phenomenon was first described in Kahneman and Tversky’s Nobel-Prize winning research.[2]
Disposition Effect: Investors tend to sell winners too quickly, while holding onto losers too long.
Price Insensitive Market Participants: Certain market participants, like central banks, may operate to dampen market
volatility.
Long-Term Trend Strategy This strategy aims to profit from a number of behavioral biases that cause market participants to over-react.
The key reasons for this over-reaction are:
Herding: After prices have trended for a while, some investors
jump on the bandwagon, and this herding effect can prolong price trends.
Confirmation Bias: People tend to look for information that confirms what they already believe and look at recent price
moves as representative of the future. This can lead investors to move money to investments that have recently made money,
and conversely out of investments that have declined, causing trends to continue.
Risk Management: Some risk-management schemes will sell in down markets and buy in up markets, causing trends to persist.
Over-Extended Trend Strategy This strategy aims to recognize when a trend is over-extended,
which can increase the probability that the trend will reverse:
Trend Velocity: Trends that occur very quickly have a higher
tendency to reverse.
Length and Magnitude of Trend: Trends that have persisted
for long periods and that have moved prices substantially have a higher tendency to reverse.
Trading and Risk Control
The Adviser employs a number of techniques to effectively trade its investments and to monitor risk:
Trading Cost Management The Fund employs proprietary portfolio optimization techniques to
reduce the costs of trading. Trading is performed by a 24 hour global trading team with extensive expertise in trading many asset
classes. The fund employs proprietary electronic order placement algorithms to minimize the market impact of trades.
Drawdown Control The Fund’s portfolio managers utilize a proprietary drawdown
control system engineered to reduce the size of drawdowns and maximize gains from favorable market conditions.
[1] Futures-related instruments include equity index futures,
currency forwards, commodity futures, swaps on commodity futures, fixed income futures and bond futures, as well as
exchange-traded funds or exchange traded notes that are linked to these contracts.
[2] See Tversky and Kahnemann (1974).
PRINCIPAL RISKS:
The use of derivatives, forward and futures contracts, and commodities exposes the Fund to additional risks including
increased volatility, lack of liquidity, and possible losses greater than the Fund’s initial investment as well as increased
transaction costs. Concentration generally will lead to greater price volatility. This fund enters into a short sale by selling a
security it has borrowed. If the market price of a security increases after the Fund borrows the security, the Fund will suffer a potentially unlimited loss when it replaces the borrowed security at the higher price. Short sales also involve transaction and
other costs that will reduce potential Fund gains and increase potential Fund losses. Risk allocation and attribution are based
on estimated data, and may be subject to change. Diversification does not eliminate risk.
An investor considering the Funds should be able to tolerate potentially wide price fluctuations. The funds are subject to high
portfolio turnover risk as a result of frequent trading, and thus, will incur a higher level of brokerage fees and commissions, and
cause a higher level of tax liability to shareholders in the funds. The Funds may attempt to increase its income or total return through the use of securities lending, and they may be subject to the possibility of additional loss as a result of this investment
technique. Definitions:
Realized Beta of Fund to Index: A measure of the amount the fund has tended to move given a move in the specified Index, using three-day overlapping returns. A beta of 1 indicates that if the index has moved 10% over a three-day period, the fund has tended to move, on
average, 10% over the same period. A beta of more than 1 indicates the fund has tended to move, on average, more than 10% in that case, and a beta of less than one indicates the fund has tended to move less than 10% in that case.
Realized Sharpe Ratio: a ratio which measures risk-adjusted performance. Realized Volatility: the standard deviation of the compounded returns of a financial instrument within a specific time horizon.
Cliff Asness, Brian Hurst, Ari Levine and Yao Hua Ooi are registered representatives of ALPS Distributors, Inc.
Investors should carefully consider the investment objectives, risks, charges and expenses of the Fund before investing. To obtain a
prospectus containing this and other important information, please call 1-866-290-2688. Read the prospectus carefully before you
invest. There are risks involved with investing including the possible loss of principal. Past performance does not guarantee future
results. AQR Funds are distributed by ALPS Distributors, Inc. AQR003522 Exp: 6/30/2015