aquatic conservation biology in arid ecosystems …oak.ucc.nau.edu/jcm22/eric dinger's...
TRANSCRIPT

AQUATIC CONSERVATION BIOLOGY IN ARID ECOSYSTEMS
By Eric C. Dinger
A Dissertation
Submitted in Partial Fulfillment
of the Requirements for the Degree of
Doctor of Philosophy
in Biology
Northern Arizona University
December 2006
Approved:
________________________ Jane Marks, Ph.D., Chair ________________________ Philip Service, Ph.D. ________________________ Tad Theimer, Ph.D. ________________________ Roderic Parnell, Ph.D.

ABSTRACT
AQUATIC CONSERVATION BIOLOGY IN ARID ECOSYSTEMS
Eric C. Dinger
Aquatic conservation in arid ecosystems is a pressing concern for the public and
land managers in the Southwest. This study focuses on aquatic conservation issues in 2
sites – 1 international site, Cuatro Ciéneags, México and 1 Arizona site, Fossil Creek
which was the focus of a collaborative, multi-faceted stream restoration project.
In Cuatro Ciénegas, we conducted an experiment manipulating fish access to
stromatolites. We manipulated 2 fish species that occur with stromatolites, the
polymorphic Herichthys minckleyi, and the pupfish Cyprinidon bifasciatus. We used a
trophic cascade index as an indicator of cascade strength, and only molariform morphs
were responsible for a trophic cascade, reducing snail densities so that stromatolite algal
biomass was positive. The papilliform morph treatments, in contrast, allowed snail
densities to increase, resulting in stromatolite algae declines indicating loss of
stromatolite formation. Our results show that modern stromatolite formation requires the
presence of a specific keystone morph of an endemic threatened cichlid. Our results are
also consistent with the hypothesis that metazoan grazing could have been responsible for
ancient stromatolite declines, and modern stromatolites should be studied in the context
of the entire ecosystem.
Restoring native fish to freshwater habitats often requires removal of exotic fish
using chemicals such as Antimycin A. We studied the immediate and lingering effects of
Antimycin A on macroinvertebrates during a fish renovation project in Fossil Creek,
ii

Arizona. We employed before-after-control-impact designs to measure the effects of
Antimycin A (at 54 µg/L and 100 µg/L) on macroinvertebrate drift, densities and species
composition. At the highest dose (100 µg/L) Antimycin A increased drift five fold and
immediately decreased invertebrate standing stocks in pools and riffles. Although
Antimycin A effects were mostly short-term, several species were extirpated.
We studied the short-term effects of restoration of flows to Fossil Creek after
100+ years of flow diversion. Invertebrate density and diversity was unaffected, but
there was a rapid response in species composition to flow restoration at restored sites.
Downstream sites shifted as a response to flow, but long-term effects will likely be the
result of changing geomorphology associated with changing travertine deposition.
iii

Acknowledgements
Dissertation projects do not occur by themselves or through the work of one
individual. I received a large amount of help from a wide variety of people – so many I
cannot hope to list them all here.
First and foremost, thanks to my family (especially my parents) who instilled my
love of the natural world at an early age. Thanks also to my high school biology teachers
who started me down this path.
I am also indebted to the entire graduate community at Northern Arizona
University, especially Bill and Anne Stanely, Rusty and Bianca Perla, Matt and Heidi
O’Neill, Brook and Lisa Swanson – these people were my role models for my entire
graduate career. I can only hope to live to be as good as they are.
Thanks to all the people who provided various assistance throughout: Joe
Shannon, Bruce Hungate, Alice Gibb, Mike Kearsely, Eric North, Kevin Wilson and
Allen Haden. They all provided me with advice or field assistance during my Ph.D.
studies, as well as my Masters degree.
Special thanks to Dr. Rick Doucett – who help me in so many ways, it’s
impossible to remember them all. He single-handedly helped me remember my joy in
climbing, running, and beer drinking. And then became a willing partner in all of these
pursuits.
As a person who disdains paperwork, thanks to the entire Biology office staff who
were very accommodating as I dealt with filing various papers! And to Dr. Ron Markle
who (usually) was very patient with my questions.
My committee was also incredibly patient with me – from my late start in even
having a committee to the final rush to finish my degree. Phil Service, Tad Theimer and
Rod Parnell were the ideal committee to see me through this.
Dr. Jane Marks was my collaborator through all of this – She helped me learn
how to be a good scientist, educator, professional and human being. It has been a joy
working with Jane from the start of both of our careers – she was the prefect advisor to
me.
iv

Despite this help, I don’t think it would have finished without the help of one last
person – my loving wife Nikki. In so many ways, this is not my dissertation, it is our
dissertation! Her guidance, support and encouragement provided me the light in the
many dark tunnels during my education.
v

Table of Contents PAGE
Dissertation Abstract ii
Acknowledgements iv
List of Tables viii
List of Figures x
Dedication xii
Preface xiii
Chapter 1. Predatory fish maintain modern stromatolites
Abstract 1
Text 2
References and Notes 4
Materials and Methods 6
Chapter 2. Modern Stromatolites in their ecosystem: Is modern stromatolite growth
maintained by higher trophic levels?
Abstract 9
Introduction 10
Methods 12
Results 17
Discussion 19
Literature Cited 24
Chapter 3. Antimycin A affects macroinvertebrates: mortality and recovery
Abstract 38
Introduction 40
Study Site 42
Methods 44
Results 50
Discussion 53
vi

Table of Contents, continued
Literature Cited 58
PAGE
Chapter 4. Evidence of rapid responses by macroinvertebrate communities to restored
flow in a previously regulated river.
Abstract 74
Introduction 75
Methods 78
Results 82
Discussion 83
Literature Cited 88
vii

List of Tables TABLE NO. TITLE PAGE Chapter 2. Table 1. Cascade strength results as measured as log ratios. 28 Table 2. Summary of invertebrate means and ANOVA results of
dominant orders in Herichthys minckleyi experiment. 28 Table 3. Summary of invertebrate means and ANOVA results of
dominant orders in Cyprinodon bifaciatus experiment. 28 Appendix 1. Invertebrates collected from experimental stromatolites
during harvest time. 36 Chapter 3. Table 1. Physical and chemical characteristics values for study sites. 61 Table 2. Treatment and sampling schedule for Antimycin A
treatment of Fossil Creek 62 Table 3. Results of ANOVA tests at Treatment Site 1 on changes
in total invertebrate densities and changes in HBI from Antimycin A treatment. 63
Table 4. Results of ANOVA tests at Treatment Site 2 on changes
in total invertebrate densities and changes in HBI from Antimycin A treatment 64
Table 5. Results of indicator species analysis for control and
treatment sites showing extirpation of invertebrates following Antimycin A treatment. 65
Chapter 4. Table 1. Sample site characteristics and hypothesized changes for
invertebrate assemblages in Fossil Creek, Arizona. 92 Table 2. BACI ANOVA results for density and species richness. 92 Table 3. ANOSIM, SIMPER and BVSTEP results for pre to
post-flow restoration changes. 93
viii

List of Tables, continued TABLE NO. TITLE PAGE Appendix 1. Taxa list and numbers collected in all 6 sites over the
course of the study. 102
ix

List of Figures
FIGURE NO. TITLE PAGE Chapter 1. Figure 1. Trophic cascade promotes stromatolite growth. 5 Chapter 2. Figure 1. Average invertebrate response to H. minckleyi morph
manipulation. 29 Figure 2. Average invertebrate response to H. minckleyi morph
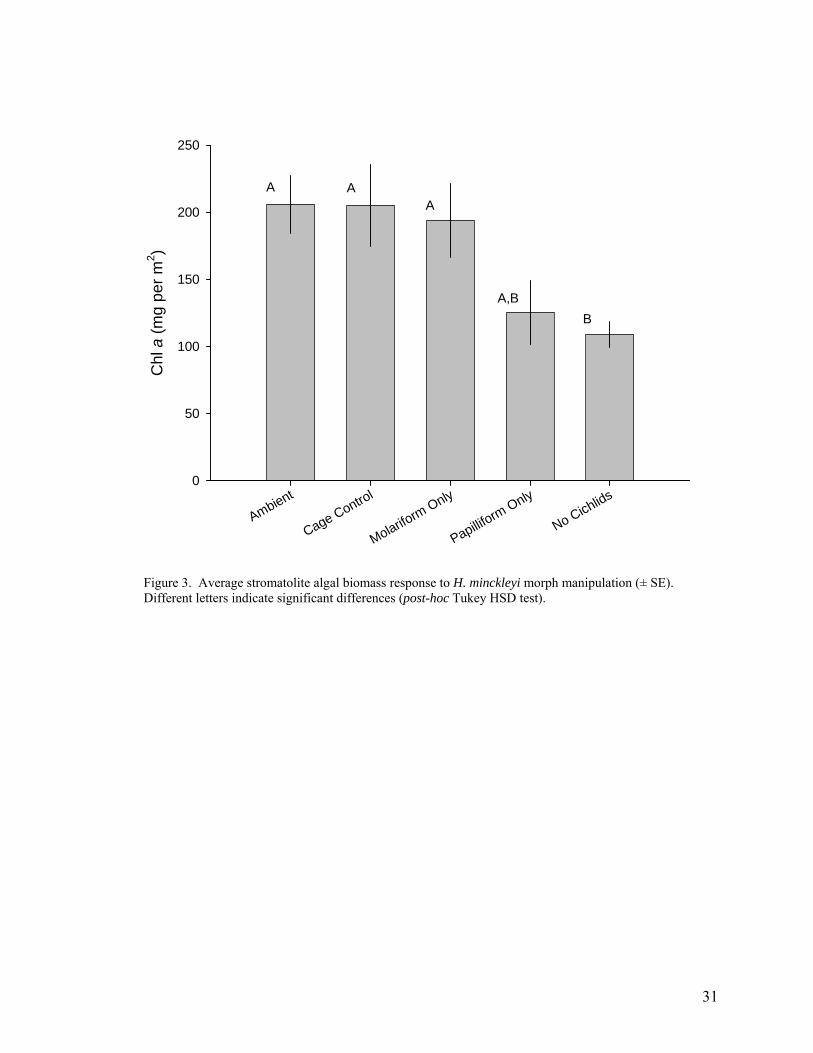
manipulation. 30 Figure 3. Average stromatolite algal biomass response to H.
minckleyi morph manipulation. 31 Figure 4. Average invertebrate response to C. bifasciatus
manipulation. 32 Figure 5. Average invertebrate response to C. bifasciatus
manipulation. 33 Figure 6. Average stromatolite algal biomass response to
C. bifasciatus manipulation. 34 Figure 7. Stromatolite biomass (as Chl a) for all treatments from
both experiments in relation to snail density (Gastropoda). 35 Chapter 3. Figure 1. Map of Fossil Creek, Arizona showing study sites. 66 Figure 2. Mean drift, benthos densities and HBI in Treatment Site 1. 67 Figure 3. Non-Metric Multidimensional Scaling ordination of
invertebrate riffle assemblages in Treatment Site 1. 68 Figure 4. Mean drift, benthos densities and HBI in Treatment Site 2. 69 Figure 5. Non-metric Multidimensional Scaling ordination of
Treatment Site 2 drift. 70
x

List of Figures, continued
FIGURE NO. TITLE PAGE Figure 6. Non-Metric Multidimensional Scaling ordination of
invertebrate riffle assemblages in Treatment Site 2. 71 Figure 7. Mean drift, benthos densities and HBI in Control Site. 72 Chapter 4. Figure 1. Map showing physical and cultural aspects of the Fossil
Creek watershed. 94 Figure 2. Travertine dams forming dam/pool series in the Restored
Site 1. 95 Figure 3. NMS ordination of pre-restoration data showing influence
of travertine on invertebrate assemblages. 96 Figure 4. Average aquatic invertebrate densities and Species Richness
for Control sites and Restored Sites. 97 Figure 5. MDS ordinations of Control Site 1 and Control Site 2
invertebrate assemblages. 98 Figure 6. MDS ordinations of Restored Site 1 and Restored Site 2
invertebrate assemblages. 99 Figure 7. MDS ordinations of Restored Site 3 and Restored Site 4
invertebrate assemblages. 100 Figure 8. NMS ordination of composited samples for each sampling
date. 101
xi

To my wife, Nikki
xii

Preface
This dissertation is written in journal format, with 4 total chapters. Each chapter
has been written as a stand alone submission for publication in selected scientific
journals. Because studies like this rarely occur without help or guidance, all of these
chapters received help of co-authors. In this, I have retained the original writing style for
publication – using “we” instead of “I”. Furthermore, I have included the names of my
co-authors at the start of each chapter.
Chapter 1 is a short paper format, and offers a brief explanation and examination
of my studies on stromatolites in Cuatro Ciénegas, Coahuila, México. It was accepted for
review but declined for publication as a Science Brevia manuscript. In the future, it may
be submitted as a brief in another journal.
Chapter 2 is a more formal, extended analysis of my work on stromatolites. The
study site and questions are similar to those presented in chapter 1, but is a more
thorough examination. It is intended for publication in the journal Ecology.
Chapter 3 and 4 focus on my studies on the conservation biology surrounding the
restoration of Fossil Creek. Chapter 3 studies the effects of using a high dosage of a fish
piscicide, antimycin A on the aquatic invertebrate assemblages. It has been accepted for
publication in the North American Journal of Fisheries Management, pending revisions.
Chapter 4 is about the response of the aquatic macroinvertebrates to flow
restoration after 100+ years of flow diversion. The time span of my education and the
realities of dam decommissioning timelines have given me the opportunity for a large,
pre-restoration dataset, with the side-effect of limiting my observations to short-term
xiii

responses (~15 months). It will be submitted to a freshwater ecology journal, such as the
Journal of the North American Benthological Society.
xiv

Predatory fish sustain modern stromatolites
Eric Dinger1,2, Brook Swanson1,3, Jane Marks1
1Department of Biology, Northern Arizona University, Flagstaff, AZ 86011, USA.
2Current Address: National Aquatic Monitoring Center, Department of Watershed
Science, 5210 Old Main Hill, Logan, UT 84322, USA
3Current Address: Biology Department, Pacific University, 2043 College Way, Forest
Grove, OR 97116, USA
Abstract:
Stromatolites, a dominant life form in the Precambrian Era, declined in diversity and
abundance in the fossil record during the Cambrian transition – although rare, modern
living examples are scattered across the globe. We show that trophic cascades, where
predators control herbivores, releasing primary producers from grazing pressure, are
instrumental in the persistence of stromatolites in Cuatro Ciénegas, Mexico. Our results
indicate that a single morphotype of a threatened, endemic fish is critical for maintaining
this rare life form. The observation that high densities of invertebrates halt stromatolite
growth is consistent with the hypothesis that grazing invertebrates contributed to their
demise.
1

Text:
Stromatolites, a dominant life form in the Precambrian Era, declined in diversity and
abundance in the fossil record during the Cambrian transition – although rare, modern
living examples are scattered across the globe. Because algal photosynthesis facilitates
the precipitation of calcium carbonate that causes stromatolite growth, the radiation of
metazoan grazers could explain the precipitous decline of stromatolites ~570 mya, as
grazers consumed the essential algal biofilm (1). The concurrence of metazoan radiation
and stromatolite decline in the fossil record, along with the observations of modern
stromatolites in locations where extreme environmental conditions limit grazers support
this hypothesis (2). Further evidence comes from observations that increasing grazing
pressure reduces calcium carbonate precipitation (3). The occurrence of metazoan grazers
with modern stromatolites in more benign habitats argues against strong grazer control,
yet, to our knowledge, the influence of higher trophic levels on stromatolites has never
been investigated. Here, we show that trophic cascades, where predators control
herbivores, releasing primary producers from grazing pressure, are instrumental in the
persistence of stromatolites in Cuatro Ciénegas, Mexico, one of the few sites in the world
with abundant freshwater stromatolites. Specifically our results indicate that a single
morphotype of a threatened, endemic fish is critical for maintaining this rare life form.
We examined the influence of trophic interactions on stromatolites in the Río Mesquites
of Cuatro Ciénegas, Mexico, which houses numerous endemic fish and snails and is
recognized globally as a biodiversity hotspot. Our year-long field experiment occurred in
2

an area of the river with fields of stromatolites typical of the basin. We placed
stromatolites in mesh cages in combination with various species of fish, focusing on the
polymorphic cichlid, Herichthys minckleyi (4). This species is widespread in the basin
and occurs in two main morphotypes – papilliform morphs that eat soft-bodied
invertebrates and algae, and molariform morphs with robust pharyngeal dentition capable
of crushing snails (5), including the two endemic snails that are dominant grazers on
stromatolites, Mexithauma quadripallium and Nymphophilus minckleyi. We compared
treatments with the molariform present and absent in combination with the papilliform
morph and other common fish. When molariforms were present, regardless of the
composition of other fish, snail densities matched ambient stromatolites. In contrast
treatments excluding molariforms had approximately 300% as many snails (student’s t =
4.91, P < 0.0001, Fig. 1A). Concurrent with the increase in snails, the algal biomass was
reduced by over 40% (student’s t = 4.17, P = 0.0002, Fig. 1A). Thus, molariform fish
controlled snail densities, releasing stromatolites from grazing pressure. When
molariforms were removed algal growth diminished such that the stromatolites appeared
as non-living rocks. SEM micrographs demonstrate that stromatolites with increased
snail densities (Fig. 1B) are noticeably lacking the algal biofilms typical of ambient
stromatolites (Fig. 1C). Because calcium carbonate accretion rates of natural Río
Mesquites stromatolites barely exceed erosive forces (3), any decrease in the
photosynthesis driven calcium carbonate deposition will halt stromatolite growth.
These results show that trophic interactions can be a key component for maintaining
stromatolite growth. In Cuatro Ciénegas, preservation of this ancient life form requires
3

the persistence of a specific morphotype of an endemic fish that is threatened by exotic
species and water extraction (6). The observation that high densities of invertebrates halt
stromatolite growth is consistent with the hypothesis that grazing invertebrates
contributed to their demise. In Cuatro Ciénegas, stromatolites rely on the presence of
predators which do not appear in the fossil record until the Silurian Period ~ 438 mya.
The absence of predators during early radiation of grazing metazoans could explain why
stromatolites were so susceptible to grazing pressure during their decline.
References and Notes
1. P. Garrett, Science 169, 171 (1970). 2. M. Walters, G. Heys, Precambrian Res. 29, 149 (1985). 3. F. Garcia-Pichel, F. Al Horani, J. Farmer, R. Ludwig, B. Wade, Geobiology 2, 49
(2004). 4. Materials and methods are available as supporting material on Science Online. 5. C. Hulsey, D. Hendrickson, F. Garcia de Leon, Evol. Ecol. Res. 7, 303 (2005). 6. S. Contreras-Balderas, P. Almada-Villela, M. Lozano-Vilano, M. García-
Ramírez, Rev. Fish Biol. Fish. 12, 241 (2003).
4

5

Materials and Methods
We conducted the experiment in the outflow of Mojarral Este which forms the
Río Mesquites (26° 55’ N, 102° 07’ W) in the Area Protegida de Flora y Fauna, Cuatro
Ciénegas, Coahuila, México. High densities of oncoid stromatolites (5.8 ± 0.76 per m2)
occur in the stream channel.
The experiment was started in April 2003 in 40 1 meter squared caged
exclosures/enclosures constructed of plastic aquaculture mesh (6.35 mm pore size) and
PVC frames. Cages were stocked with 5 oncoid stromatolites (mean diameter 15 cm).
Ten of the 40 cages were open on 1 side to serve as cage controls, exposing the
stromatolites to the natural community. Ten cages were randomly stocked with
Herichthys minckleyi papilliform morphs, 10 were stocked with H. minckleyi molariform
morphs, and the last 10 excluded both morphs of H. minckleyi. Morphotypes were
identified prior to stocking using an otoscope.
In May 2004, we collected 1 random stromatolite from each cage. On each
stromatolite, we took a 17.8 mm2 core sample for Chlorophyll a analysis. Cores were
placed in aluminum foil and frozen for transport. Chlorophyll a was measured following
standard protocols (S1) on a Perkin-Elmer Coleman 124 Spectrophotometer, and
calculated to Chlorophyll a amount. In addition to caged stromatolites, we also sampled
10 ambient stromatolites.
To collect invertebrates, we created an anaerobic environment to cause
invertebrates to leave the stromatolite (S2). Stromatolites were placed in water filled 5-
gallon plastic buckets and CO2 was bubbled into the water to drive out oxygen. We
monitored the progress using a Hydrolab minisonde water probe. Once the dissolved
6

oxygen content was less than 0.50 mg/l, stromatolites were left for 10 minutes while
invertebrates emigrated from the stromatolite. The stromatolite was removed and
scanned for additional invertebrates clinging to the exterior. The water with invertebrates
was strained through 1mm aquarium mesh nets. Invertebrates were identified and
counted using Leica dissecting scopes. Invertebrate densities were standardized to
individuals per m2 using digital photograph measurements to calculate stromatolite size.
Due to fish escape, vandalism and other acts of nature, 10 replicates were lost
during the experiment. Nine cage controls, 4 molariform, 8 papilliform, and 9 H.
minckleyi exclusions survived.
For assessing effects of the molariform morph, we grouped each treatment into
either 1) Molariform present or 2) Molariform absent. The “ Molariform present” group
included molariform enclosures, cage controls, and ambient stromatolites. , The
“Molariforms absent” group included the papilliform enclosures, and the H. minckleyi
exclosures. Data were analyzed using student’s t test using JMP IN 4 software package
(S3).
References for methods and materials
S1. Clesceri, L., A. Greenberg, A. Eaton. Standard Methods for the Examination of Water and Wastewater. (American Public Health Association, Washington, DC, ed. 20, 1998).
S2. Thanks to the late W.L. Minckley for suggesting this collection technique.
S3. JMPin version 4.0.2 SAS Institute Inc. (2000).
S4. We thank the Cuatro Ciénegas Park staff (especially Arturo Contreras-Balderas); B. Winsborough, D. Hendrickson, M. Sellers and many volunteers. Supported by TNC, NSF, EPA, NAU, and the PSA.
7

Modern Stromatolites in their ecosystem: Is modern stromatolite growth
maintained by higher trophic levels?
Eric C. Dinger1,2 and J.C. Marks1
1Merriam-Powell Center for Ecological Research, Department of Biology, Northern
Arizona University, Box 5640, Flagstaff, AZ 86011, USA
2Current Address: National Aquatic Monitoring Center, Department of Aquatic,
Watershed, and Earth Resources, 5210 Old Main Hill, Logan, UT 84322, USA
8

Abstract
We conducted a year long experiment manipulating fish access to stromatolites, a
rare algal life-form dominant in the Precambrian. Modern stromatolites now only occur
in isolated ecosystems, and it was hypothesized that metazoan grazing caused
stromatolite decline in the Cambrian Transition. However, occurrence of diverse and
abundant invertebrate grazers with modern stromatolites in Cuatro Ciénegas, México
suggested that evolution of grazers was unrelated to ancient stromatolite declines. We
tested the hypothesis that a third trophic level, vertebrate predation, controlled the
metazoan grazer densities, minimizing grazer effects so that stromatolites could persist.
We manipulated 2 fish species that occur with stromatolites, the polymorphic Herichthys
minckleyi, and the pupfish Cyprinidon bifasciatus. We hypothesized that only 1 morph
of H. minckleyi, with molariform dentition capable of consuming the dominant grazer,
native Hydrobiidae snails, would control snails, allowing stromatolite growth. We used a
trophic cascade index as an indicator of cascade strength, and only molariform morphs
were responsible for a trophic cascade, reducing snail densities so that stromatolite algal
biomass was positive. The papilliform morph treatments, in contrast, allowed snail
densities to increase, resulting in stromatolite algae declines indicating loss of
stromatolite formation. Pupfish, however, caused declines in both snail and algal
biomass presumably due to direct competition with snails, coupled with pupfish
herbivory on the stromatolites. Our results show that modern stromatolite formation
requires the presence of a specific keystone morph, of an endemic threatened cichlid.
Our results are also consistent with the hypothesis that metazoan grazing could have been
9

responsible for ancient stromatolite declines, and modern stromatolites should be studied
in the context of the entire ecosystem.
Introduction
Stromatolites, an ancient, once dominant algal life form that causes mineral
deposits to form a rock like structure, declined in diversity and abundance in the
Precambrian (~ 570 mya) concurrent with the rise of metazoans (Awramik 1971). This
led to the hypothesis that metazoans, through grazing and bioturbation, caused the demise
of stromatolites (as summarized by Gebelein 1976, but also see Garrett 1970, Awramik
1971, Walter and Heys 1985). This hypothesis is indirectly supported by the occurrence
of most extant stromatolites in "extreme" environments, which have low densities of
grazers (e.g. Monty and Hardie 1976, Playford and Cockbain 1976). The relationship
between invertebrates and stromatolites, however, is not fully understood (Farmer 1992)
with recent studies pointing to the co-occurrence of stromatolite-like microbial mats and
grazers in some habitats (e.g. Laguna Guerrero Negro, Baja California Sur, México,
Cuatro Ciénegas, Coahuila, México) suggesting that the decline of stromatolites was
unrelated to metazoan appearance. Alternative hypotheses for stromatolite declines
postulate that stromatolites were out competed for space by other algal forms (Pratt 1982)
or that changes in seawater chemistry created unfavorable conditions for stromatolites
(Grotzinger 1990).
Studies on the effects of grazers on stromatolites have yielded mixed results.
Some studies have rejected the grazer hypothesis by noting the inability of grazers to
completely limit or structure microbial mats and stromatolites (Farmer 1992, Elser et al.
2005). In contrast, other studies have suggested strong grazer control of stromatolite
10

algal assemblages and growth rates (Winsborough 1990, Dinger 2001, Garcia-Pichel et
al. 2004, Dinger et al. 2006). Most of these studies are either based on short-term
observations, or were simplified studies focusing on only one aspects of the community.
We maintain that a better test of how trophic interactions affect stromatolites requires
longer field studies where entire grazer assemblages can be manipulated.
Here we describe a yearlong field experiment testing how fish affect stromatolites
and invertebrate communities in Cuatro Ciénegas, México one of the few sites worldwide
with freshwater stromatolites. Despite the challenges of extrapolating from a modern
food web with fish and invertebrates to a Precambrian food web, where vertebrates had
yet to evolve, this study elucidates the potential for higher trophic levels to control
stromatolite growth. Specifically, we manipulated the accessibility of three dominant
fish morphs/species with different mouth parts and feeding strategies to compare the
direct and indirect effects of fish on stromatolites and associated invertebrate
communities. We predicted that the molariform morphs of the endemic cichlid
(Herichthys minckleyi), which can crush and consume snails (Husley et al. 2006), would
have a direct negative effect on snails and an indirect positive effect on stromatolites via
a trophic cascade, illustrating the potential for grazers to reduce stromatolite growth as
suggested by Garrett (1970) and Awramik (1971). In contrast, we expected that
omnivorous pupfish, which eat primarily algae and detritus, would have direct negative
effects on stromatolites. We expected that the papilliform morph of the dominant cichlid,
which consumes detritus, algae, and soft-bodied invertebrates, would have a direct
negative effect on stromatolites that was slightly tempered by their ability to reduce
grazers. We compared the interaction strengths of the three fish using a trophic index
11

described by Osenberg et al. (1997) to determine which species have the strongest effects
on structuring stromatolites and their associated invertebrate assemblages. This index has
been used as a standardized metric for measuring both the direct effects of predators on
herbivores and the indirect effects of predators or trophic cascade strength, on primary
producers (Shurin et al. 2002, Borer et al. 2005).
Methods
Study site
Cuatro Ciénegas, Coahuila, México in the Chihuahuan Desert, is one of the few
places globally with freshwater stromatolites. We conducted our studies in the outflow of
Mojarral Este, which forms the Río Mesquites (26° 55’ N, 102° 07’ W) in the Area
Protegida de Flora y Fauna. The basin of Cuatro Ciénegas was declared a protected area
in 1994 by the Mexican government due to a variety of ongoing threats to the biological
diversity of the area (Minckley 1992). The high amount of endemism in the basin has
been well described in the literature (e.g. Cole 1984, Hershler 1984), as have the habitats
of the basin (esp. Minckley 1969).
The water chemistry of Río Mesquites is dominated by Ca2+ and SO42-. High
densities of oncoid stromatolites (5.8 ± 0.76 per m2), shaped like oblong spheres with
diameters ranging from 2-30 cm are found in the middle of the channel. These
stromatolites of Cuatro Ciénegas are laminated, benthic, microbial calcium carbonate
deposits caused by biological activity, where the microbial components incorporate
carbonate into their extracellular material. Algal components of the stromatolites are
dominated by the green alga, Gongrosira calcifera Krieger, Cyanostylon microcystoides;
the Cyanobacteria Homeothrix balearica Bornet and Flahault, Schizothrix lacustris A.
12

Brown; and the diatoms Eunotia sp., Amphora katii Selva, Epithemia argus Kütz, and
Gomphonema intricatum Ehr. (Winsborough 1990). For more details of the study site
see Dinger et al. (2006).
These stromatolites harbor a diverse invertebrate assemblage dominated by two
endemic snails, Nymphophilus minckleyi and Mexithauma quadripalium, (Hydrobiidae)
which constitute roughly 45 percent of the invertebrate biomass, although Chironomidae
midges (Diptera) and Hyalella sp. (Amphipoda) are often numerically dominant (Dinger
et al. 2005). There are three dominant fish in our study site: 1) the molariform morph of
the endemic cichlid Herichthys minckleyi which has dentition capable of crushing snails
(Hulsey et al. 2005), 2) a papilliform dentition morph that rarely consumes snails but eats
algae, detritus, and soft bodied invertebrates (Hulsey et al. 2005) and 3) the small pupfish
Cyprinidon bifasciatus, which feeds on algae, detritus and soft-bodied invertebrates.
Experimental design
We ran two experiments side by side for 380 days, from 20 April 2003 to 10 May
2004. One experiment tested the effects of different morphs of H. minckleyi on
stromatolites, and the other tested the effects of C. bifasciatus on stromatolite
assemblages.
Experiment 1 – Herichthys minckleyi
We used 1 m2 cages made of PVC framing wrapped in 6.35 mm plastic
aquaculture mesh to exclude/include different morphs of H. minckleyi. Cages were 1 m
tall, allowing the top of the cages to extrude from the water so that no tops were
necessary and fish could not jump into or out of cages. Previous attempts at cages
without bottoms proved ineffective at maintaining desired fish densities, necessitating
13

cage bottoms of 1 mm hardware mesh, with approximately 50 haphazard 3 cm slits to
facilitate invertebrate migration from the sediment to the stromatolites.
Every treatment type was replicated 10 times. One treatment was stocked with a
single molariform morph, one was stocked with a single papilliform morph, and one was
not stocked with H. minckleyi. Additionally, one treatment was constructed identically to
the other cages, but with one full side open to the environment to act as a cage control.
The cage control served to mimic the possible cage artifacts of reduced water velocity
and sunlight. The aquaculture mesh allowed the smaller pupfish C. bifasciatus to enter
and exit the cage unimpeded. This allowed us to assess the effects of H. minckleyi
morphs in the context of the rest of the ecosystem.
Experiment 2 – Cyprinidon bifasciatus
To test the effects of the pupfish, C. bifasciatus, on stromatolites, we constructed
1 m2 cages made of PVC framing wrapped in 1mm fiberglass hardware mesh. Other
than using a smaller mesh size, cages were identical to those used in experiment 1. Cages
were assigned to one of three treatments (n = 10 for each): 1) C. bifasciatus only (initially
stocked with 10 pupfish each), 2) No fish, and 3) Cage controls, identical to experimental
cages, but with one side open to the ambient stream, allowing fish to enter and exit the
cage control.
Field and lab protocols
At harvest time, a random stromatolite was collected from each cage.
Stromatolites were slowly and carefully lifted out of the water, and a 1mm mesh
aquarium net was used to retain snails or other invertebrates dislodged during removal.
Stromatolites were digitally photographed and measured for height. Mini-cores made of
14

aluminum tubing (0.71 cm2) were used to take samples for Chlorophyll pigment analyses.
These cores were driven through the top surface of the living biofilm of the stromatolite
to lower lithified layers. The cores were then placed on ice for later analysis in the lab.
Stromatolites and any dislodged invertebrates were then placed in 5-gal buckets.
Invertebrates were removed by creating a low oxygen environment in each
bucket, a technique recommended by the late W.L. Minckley. Stromatolites were
immersed in 20 l of water, and dissolved CO2 was aerated (~ 0.34 m3/hr) until the O2
level dropped below 0.5 mg l-1 (monitored with a Hydrolab Minisonde 4 oxygen sensor).
When the O2 level dropped below 0.5 mg l-1, the CO2 addition was halted, and kept in
stasis for 10 additional minutes. Stromatolites were then removed from the bucket and
visually inspected for any invertebrates remaining on the stromatolite surface. Special
attention was given to the rugulose crevices of the stromatolites, where narcotized
invertebrates may have been stuck. Any invertebrates encountered were added to the
floating, narcotized invertebrates in the bucket. The contents of the bucket were filtered
through a 250 µm mesh net, and preserved in 95% ethanol. Each stromatolite was then
returned to the stream, barren of invertebrates, but otherwise undisturbed. Other methods
of removing invertebrates, such as simply picking invertebrates off with forceps would
overlook many invertebrates. This method allowed us to collect invertebrates while
protecting these rare, protected life forms.
Invertebrates were identified and enumerated using a dissecting microscope in the
lab. Identifications of non-gastropod invertebrates were determined using North
American invertebrate keys (Pennak 1989, Thorp and Covich 1991, Merritt and
Cummins 1996). Snails were identified using pictures (Taylor 1966, Hershler 1985).
15

Invertebrate densities were standardized to individuals per m2, based on the size of the
stromatolite. Stromatolite height (measured in the field) was averaged with width and
length (measured from digital photographs) to determine an average radius, which was
then used in the standard formula for the surface area of a sphere (S = 4πr2).
Chlorophyll pigment analysis was used as a surrogate for biomass. Other
methods, such as Ash-Free-Dry-Mass were not used because of difficulties in separating
combustible carbon and water trapped in the lower layers of calcium carbonate from the
upper organic algal carbon as well as potentially older, organic carbon trapped prior to
the experimental period. Chlorophyll was extracted in acetone following standard
methods (Greenberg et al. 1992). Chlorophyll concentration was measured with a
Perkin-Elmer Coleman 124 Spectrophotometer. We used a multi-spectral analysis to
simultaneously determine Chlorophyll a, b, and c concentrations (Greenberg et al. 1992).
Chlorophyll concentrations were then converted to chlorophyll biomass per m2.
Statistical analyses
Effects of fish manipulation were analyzed using Analysis of Variance (ANOVA)
routine in the statistical computer package JMPin (version 4.02). Post-hoc pair wise
differences were measured using Tukey's HSD test. Statistical significance was set at a
p-value of 0.05. Least squares regression was used to investigate the relationship
between algal biomass and invertebrate densities.
We used the log ratio of plant biomass (Chl a mg m-2) or herbivore density (snails
m-2) in the presence versus absence of pupfish and cichlid morphs to assess the trophic
cascade strength (e.g. Osenberg et al. 1997). Reasons for using the log ratio include 1)
clear biological meaning (proportional change in the response variables), 2) it has strong
16

statistical properties (Shurin et al. 2002) plus 3) it allows comparisons to other published
meta-analyses of cascade strength (Shurin et al. 2002, Borer et al. 2005). Positive log
ratios on algae can be interpreted as a trophic cascade, whereas a negative log ratio
indicates predation pressure (i.e. decreases in algal biomass or snail densities).
Additionally, we used the log ratio to examine the effect of the entire fish assemblage
(molariform, papilliform, and pupfish) by comparing cage controls and ambient
stromatolites with treatments that excluded all fish in experiment 2.
Results
The demonic intrusions of Hurlbert (1984) reduced the number of replicates
surviving at the experimental harvest. Reasons for replicate loss ranged from escaped
fish, wind damage, and anthropogenic intrusions (i.e. unintentional vandalism from
curious kayakers). In experiment 1 (H. minckleyi manipulation), the numbers of
replicates remaining were: 4 Molariform only, 8 Papilliform only, 9 Cage controls, and 9
No cichlids. In experiment 2 (pupfish manipulation) the numbers of replicates remaining
were: 5 Pupfish only, 8 Cage controls, and 7 No fish.
Removal of invertebrates with CO2 resulted in the collection of 30 taxa from all of
the treatments (Appendix 1). We ran analyses on only the dominant invertebrate orders:
Amphipoda, Diptera, Ephemeroptera, Gastropoda, and Trichoptera. Other taxa, such as
the odonates and trombidiformes were found in such low densities that they were not
analyzed separately. Additionally, throughout the experimental period, cage control
variables resembled ambient variables indicating that there were no artifacts due to
enclosures.
17

Fish morphs/species differed in their effects on snails and algae, both in direction
and magnitude (Table 1). Molariform morphs had the biggest effect on both snails and
algae, exerting strong controls on snails (-0.82), which cascaded into a net positive effect
on stromatolite biomass (0.58). Papilliform morphs, in contrast, released snails from
predation – causing a positive effect on snails (0.79). Surprisingly, although papilliforms
have a positive effect on snails compared to the no cichlid treatments, the stromatolite
algae had a small positive effect (0.14), and not a negative effect. Pupfish, without
molariforms or papilliforms, had a negative effect on both snails (-0.16) and stromatolite
algae (-0.43). The fish assemblage as a whole had effects similar to the molariform
treatments – a strong negative effect on snails (-0.98) and a positive effect on stromatolite
algae (0.30).
In experiment 1, molariform treatments had significantly fewer snails than
treatments excluding molariforms (no cichlids and papilliform only) (Fig. 1c, Table 2).
Other invertebrates significantly affected by molariform presence (versus papilliform
presence) were an increase in overall densities (Fig. 1a), Amphipoda (Fig. 1b), and
Diptera (Fig. 2b). Molariform treatments had significantly higher algal biomass than
treatments that excluded cichlids (Fig. 3, ANOVA F4,35 = 4.14, p = 0.0075).
Papilliform treatments had different effects compared to molariform treatments.
Papilliform treatments had a significant increase in snails compared to other treatments
(460% increase compared to cage controls) (Fig. 1c, Table 2). The only other significant
effect on invertebrates was a significant increase in Ephemeroptera (Fig. 2c).
Stromatolite algae, however, was substantially lower in papilliform treatments relative to
18

ambient stromatolites, cage controls and molariform enclosures indicating that
papilliforms do not cause a trophic cascade (Fig. 3).
In experiment 2, pupfish enclosures had no significant effect on most invertebrate
groups (Fig. 4, Table 3), compared to other treatments, only significantly decreasing
Trichoptera and Diptera densities, which likely had little effect on algal biomass (Fig.
5a,b). Average snail densities doubled in pupfish enclosures compared to cage controls
and ambient stromatolites (Fig. 4c) and was marginally significant (ANOVA F3,26 = 2.72,
p = 0.065). Pupfish enclosures significantly reduced stromatolite algal biomass by
approximately half (Fig. 6; ANOVA F3,26 = 4.28, p = 0.0139). The same general patterns
were seen in the exclusion of all fish – an increase in snails but no other strong effects on
invertebrates. There was a non-significant decrease in algal biomass (Fig. 6).
Across all treatments, mean algal biomass significantly decreased as a function of
mean snail density (slope significantly < 0, t7 = -2.44, p = 0.049, Fig. 7). Overall, only
stromatolites in the molariform treatments mimicked ambient stromatolites, suggesting
molariform morph persistence is essential in maintaining stromatolites.
Discussion
The molariform morph of H. minckleyi is a keystone predator, essential for structuring
stromatolites and associated invertebrate assemblages in Cuatro Ciénegas. Although all
three fish had distinct and significant effects on stromatolites and invertebrates the
strongest interaction chain extends from molariform fish through snails to stromatolites.
We know of no other studies, where a subpopulation of a species plays a keystone role.
Comparisons of our cascade strength values to a meta-analysis looking at cascade
strengths across a variety of ecosystems (e.g. lentic benthos, lentic plankton, terrestrial,
19

stream benthos, etc) (Shurin et al. 2002) indicates that our 2 comparisons that resulted in
trophic cascades (Molariform enclosures vs. no cichlids, and cage controls vs. no fish)
had similar effect sizes to other published experiments, although the effect size was
closer to observed effect sizes in marine plankton and terrestrial ecosystems than stream
benthic ecosystems.
Most notable is the contrasting effect of the two morphs of H. minckleyi. As
predicted, the molariform morph decreased snails and increased algae through a trophic
cascade, whereas the papilliform morph increased snails and slightly increases algae. In
contrast to the molariform morph pupfish reduced both snails and algae which may be
due to direct pupfish herbivory on stromatolites and competition with snails (see below).
Although snails almost doubled increased when pupfish were excluded they were
statistically non-significant, and did not match the 5 fold increase caused by molariform
exclusion (with papilliforms). The 35% decrease in chlorophyll a in the presence of
pupfish relative to treatments without fish is probably attributable to both direct grazing
by pupfish and increased grazing by snails.
Snails were more important than other, more numerically dominant invertebrates
in controlling stromatolites. For example, although amphipods almost quadrupled in
treatments which excluded papilliforms (presumably from a lack of papilliform
predation), there was no observable effect on primary production. The importance of
gastropod grazers in other stromatolite forming systems has also been observed. In
particular, Kinsman and Park (1976) noted that stromatolites in the Trucial Coast, Saudi
Arabia only formed in areas where gastropods were absent due to high salinities – in
20

other nearby habitats, where salinities are lower, stromatolites were prevented due to
gastropod grazing.
Are there threshold snail densities beyond which stromatolites cannot persist? Our
results show clear reductions in stromatolite productivity under increased grazing
pressure by snails and suggest that over time stromatolites in Cuatro Ciénegas could go
extinct if molariform densities decreased and snails increased. Algal biomass dropped
roughly 39% in treatments with the removal of molariforms but was never below 97 mg
m-2, a value that may still constitute actively forming stromatolites. Previous work
however, comparing calcification rates of Cuatro Ciénegas stromatolite algae versus snail
consumption (“bioerosion”) found that calcification rates were only about 24% higher
than bioerosive rates of snail consumption at ambient snail densities (Garcia-Pichel et al.
2004). Assuming that biomass estimates are directly related to calcification rates, the
39% decrease that we observed would likely be below the threshold calcification rate
needed for stromatolites to generate calcification rates higher than snail consumption.
Factor alongside this our observed increase in snail densities (as high as 460% increase –
which represents a huge increase in the bioerosive capacity), and continued stromatolite
formation is likely impossible.
Our results contrast experimental work by Elser et al. (2005) who studied the
effects of phosphorous enrichment and elevated snail densities on Cuatro Ciénegas
stromatolites. In a 7-week factorial experiment on stromatolites isolated in buckets, they
added phosphorous while manipulating snail densities from 9 per stromatolite to 12 per
stromatolite and found that phosphorus stimulated algal growth whereas the addition of 3
snails had no effect. Much of the discrepancy between their study and ours is likely due
21

to differences in snail densities. Their estimate of 9 snails per stromatolite (287 snails m-
2) is far below our estimate of 448 snails m-2 in ambient and cage control stromatolites.
Hence, their treatment with "high" snail densities of 12 per stromatolite (or 382 snails m-
2) was still lower than our observed ambient densities. Fish removal increased snails to
roughly 1200 snails m-2 showing the potential for snail densities to increase by over
300% if relieved from predator pressure. Garcia-Pichel et al. (2004) showed that it would
take only a 33% increase in snail bioerosion to match stromatolite calcification,
suggesting that the 33% increase would result in snail grazing matching accretion rates,
but would not necessarily result in snail bioerosion surpassing stromatolite formation.
Additionally, they used only one species of snail, M. quadripalium, and excluded the
other commonly occurring snail, N. minckleyi, which sometimes outnumbers M.
quadripalium on stromatolites. Finally, given the slow growth of stromatolites (~1-2 mm
year-1), 7 wks may not be long enough to discern potential long-term effects of snails on
stromatolites. We conducted a similar fish exclosure experiment to the one described
here that was only run for 12 weeks. This shorter experiment showed significant
increases in snails but no effect on stromatolite biomass (Dinger et al 2006) indicating the
importance of longer studies for indirect interactions to be manifested. Viewing these
studies together, we concur with Elser et al.(2006), that under ambient snail densities,
which are maintained at “low” levels by molariform fish, stromatolites are primarily
phosphorus limited. However, if densities of this threatened fish decline, the balance
could easily shift to strong grazer limitation.
22

Paleobiology implications
The Precambrian past differs in many ways from the modern environment of
Cuatro Ciénegas (e.g. presence of higher trophic levels, different algal taxa involved in
stromatolite formation), making many direct comparisons difficult. But one
paleobiological observation that has, and can be made using Cuatro Ciénegas as a
Precambrian analogue is that invertebrates and stromatolites co-occur. This has been
used to suggest that invertebrate radiation and evolution were not the cause of declining
diversity and distribution of stromatolites during the Cambrian transition (Farmer 1992).
Here we show that stromatolites, invertebrates and invertebrate predators co-exist
primarily because predators maintain grazer densities at low enough levels that the snails
are released by grazing pressure. Without their vertebrate predators and the resulting
trophic interactions, invertebrate grazers can reduce stromatolites, as is consistent with
the invertebrate interference hypothesis for stromatolite decline.
Conservation biology implications
These results show that trophic interactions are essential for maintaining
stromatolite growth, pointing to the importance of managing entire food webs rather than
single species. In Cuatro Ciénegas, even if managers focused on what may be an
appropriate species, H. minckleyi, efforts must be made to ensure that both morphs persist
in the ecosystem. Persistence of both morphs depend on ensuring ample snail and soft-
bodied invertebrate population, which in turn will maintain stromatolite growth. In other
words, survival of stromatolites require that all levels of the food web are protected.
However, in Cuatro Ciénegas, the morphs of H. minckleyi are threatened by non-native
species (Tilapia – Oreochromis sp. and African Jeweled cichlids – Hemichromis guttatus)
23

and water extraction, both within the basin and by groundwater pumping outside the
basin. Furthermore, the “keystone” morphotype, molariforms are already the less
frequent morph found within the basin (Swanson et al. 2003). Monitoring and
management plans must include studying the ratios of morphs, snail populations, and
stromatolite growth to ensure that this unique ecosystem is preserved.
Literature Cited
Awramik, S.M. 1971. Precambrian columnar stromatolite diversity: Reflection of metazoan appearances. Science 174:825-827.
Awramik, S.M. 1984. Ancient stromatolites and microbial mats. In Cohen, Y., R.W.
Castenholtz, and H.O. Halvorson (editors) Microbial mats: Stromatolites. Alan R. Liss, Inc. New York, New York. Pages 1-22.
Bauld, J., E. D’Amelio, and J.D. Farmer. 1992. Modern microbial mats. In Schopf, J.W.
and C. Klein (editors) The Proterzoic Biosphere: A Multidisciplinary Study. Cambridge University Press, New York, New York. Pages 261-270.
Borer, E.T., E.W. Seabloom, J.B. Shurin, K.E. Anderson, C.A. Blanchette, B. Broitman,
S.D. Cooper, and B.S. Halpern. 2005. What determines the strength of a trophic cascade? Ecology 86:528-537.
Carpenter S.R., J.F. Kitchell, and J.R. Hodgson. 1985. Cascading trophic interactions and
lake productivity. Bioscience 35(10):634-639. Colletti, P.J., D.W. Blinn, A. Pickart and V.T. Wagner. 1987. Influence of different
densities of the mayfly grazer Heptagenia criddlei on lotic diatom communities. Journal of the North American Benthological Society 6(4): 270-280.
Dinger, E.C. 2001. Aquatic invertebrates of Cuatro Ciénegas, Coahuila, México and
effects of fish on stromatolite invertebrate assemblages. Unpublished Masters thesis. Northern Arizona University. Flagstaff, Arizona. 61 pages.
Dinger, E.C., D.A. Hendrickson, B.M. Winsborough and J.C. Marks. 2006. Role of fish
in structuring invertebrates on stromatolites in Cuatro Ciénegas, México. Hydrobiologia 563(1): 407-420.
Elser, J.J., J.H. Schampel, F. Garci-Pichel, B.D. Wade, V. Souza, L. Eguiarte, A.
Escalante, and J.D. Farmer. 2005. Effects of phosphorous enrichment and grazing snails on modern stromatolitic microbial communities. Freshwater Biology 50:1808-1825.
24

Elser, J.J., J. Watts, J.H. Schampel, and J.D. Farmer. 2006. Early cambrian food webs on a trophic knife-edge? A hypothesis and preliminary data from a modern stromatolite-based ecosystem. Ecology Letters 9: 295-303.
Farmer, J.D. 1992. Grazing and bioturbation in modern microbial mats. In Schopf, J.W.
and C. Klein (editors) The Proterzoic Biosphere: A Multidisciplinary Study. Cambridge University Press, New York, New York. Pages 295-298.
Fretwell, S.D. 1977. The Regulation of plant communities by food chains exploiting
them. Perspectives in Biology and Medicine 20:169-185. Garcia-Pichel, F., A. Al-Horani, J.D. Farmer, R. Ludwing, and B.D. Wade. 2004.
Balance between microbial calcification and metazoan bioerosion in modern stromatolitic oncolites. Geobiology 2(1): 49-57.
Garrett, P. 1970. Phanerozoic stromatolites: Noncompetitive ecological restriction by
grazing and burrowing animals. Science 169:171-173. Gebelein, C.D. 1976. The effects of the physical, chemical and biological evolution of
the Earth. In Walter, M.R. (Editor) Stromatolites. Elsevier Scientific Publishing Co. New York, New York. Pages 499-516.
Greenberg, A.E., L.S. Clesceri, and A.D. Eaton, editors. 1992. Standard methods for the
examination of water and wastewater. 18th ed. American Public Health Association, Washington D.C. 1100 pages.
Hairston, N.G., F.E. Smith, and L.D. Slobodkin. 1960. Community structure, population
control and competition. American Naturalist 94:421-425. Hansson, L.A., M. Lindell and L.J. Tranvik. 1993. Biomass distribution among trophic
levels in lakes lacking vertebrate predators. Oikos 66(1): 101-106 Hershler, R. 1985. Systematic revision of the Hydrobiidae (Gastropoda: Rissoacea) of the
Cuatro Cienegas basin, Coahuila, Mexico. Malacologia 26: 31-123. Hulsey, C.D., D.A. Hendrickson, and F.J. Garcia-de Leon. 2005. Trophic morphology,
feeding performance and prey use in the polymorphic fish Herichthys minckleyi. Evolutionary Ecology Research 7(2): 303-324.
Hurlbert, S.H. Pseudoreplication and the design of ecological field experiments.
Ecological Monographs 54: 187-211. Kinsman, D.J.J. and R.K. Park. 1976. Algal belt and coastal sabkha evolution, Trucial
Coast, Persian Gulf. In Walter, M.R. (Editor) Stromatolites. Elsevier Scientific Publishing Co. New York, New York. Pages 421-434.
25

Kloeppel, H. 2002. Molluscivore (Herichthys minckleyi) effects on snail (Mexipyrgus carranzae) densities and size in Cuatro Ciénegas, Mexico. Unpublished Masters thesis. Northern Arizona University. Flagstaff, Arizona. 33 pages.
Lamberti, G.A. and V.H. Resh 1983. Stream periphyton and insect herbivores: An
experimental study of grazing by a caddisfly population. Ecology: 64(5):1124–1135.
Lamberti, G.A., S.V Gregory, L.R. Ashkenas, A.D. Steinman, and C.D. McIntire. 1989.
Productive capacity of periphyton as a determinant of plant-herbivore interactions in streams. Ecology 70(6): 1840-1856.
Merritt, R.W., and K.W. Cummins, editors. 1996. An introduction to the aquatic insects
of North America. 3rd ed. Kendall/Hunt Publishing Company. Dubuque, Iowa. 862 pages.
Minckley, W.L. 1969. Environments of the Bolsón of Cuatro Ciénegas, Coahuila,
México. Science Series, University of Texas, El Paso, Texas 2: 1-65. Minckley, W.L. 1984. Cuatro Ciénegas fishes: Research review and a local test of
diversity versus habitat size. Journal of the Arizona-Nevada Academy of Science 19:13-21.
Minckley, W.L. 1992. Three decades near Cuatro Ciénegas, México: Photographic
documentation and a plea for area conservation. Journal of the Arizona-Nevada Academy of Science 26(2):89-118.
Monty, C.L.V. and L.A. Hardie. 1976. The Geological significance of the freshwater
blue-green algal calcareous marsh. In Walter, M.R. (Editor) Stromatolites. Elsevier Scientific Publishing Co. New York, New York. Pages 447-478.
Pennak, R.W. 1989. Freshwater invertebrates of the United States. 3rd ed. John Wiley
and Sons, Inc. New York, New York. 628 pages. Playford, P.E. and A.E. Cockbain. 1976. Modern Stromatolites at Hamelin Pool, a
Hypersaline Barred Basin in Shark Bay, Western Australia. In Walter, M.R. (Editor) Stromatolites. Elsevier Scientific Publishing Co. New York, New York. Pages 389-412.
Polis, G.A. and K.O. Winemiller, Editors. 1996. Food webs: Integration of patterns and
dynamics. Chapman and Hall, New York, New York. 472 pages. Power, M.E., A.J. Stewart, and W.J. Matthews. 1988. Grazer control of algae in an
Ozark Mountain stream: effects of short-term exclusion. Ecology 69:1894-1898. Pratt, B.R. 1982. Stromatolite decline—A reconsideration. Geology 10:512-515.
26

Rosemond, A.D., P.J. Mulholland and J.W. Elwood. 1993. Top-down and bottom-up
control of stream periphyton: Effects of nutrients and herbivores. Ecology 74(4):1264-1280.
Shurin, J.B., E.T. Borer, E.W. Seabloom, K. Anderson, C.A. Blanchett, B. Broitman,
S.D. Cooper, and B. Halpern. 2002. A cross-ecosystem comparison of the strength of trophic cascades. Ecology Letters 5:785-791.
Taylor D.A. 1966. A remarkable snail fauna from Coahuila, Mexico. Veliger 9:152-228. Thorp, J.H. and A.P. Covich, editors. 1991. Ecology and classification of North
American freshwater invertebrates. Academic Press, Inc. San Diego, California. 911 pages.
Walter, M.R. and G.R. Heys. 1985. Links between the rise of the metazoa and the decline
of stromatolites. Precambrian 29(1-3): 149-174.
Winsborough B.M. and Golubic S. 1987. The role of diatoms in stromatolite growth: Two examples from modern freshwater settings. Journal of Phycology 23(1):195-201.
Winsborough, B.M. 1990. Some ecological aspects of modern fresh-water stromatolites in lakes and streams of the Cuatro Ciénegas Basin, Coahuila, México. Dissertation, University of Texas, Austin. 341 pages.
Winsborough, B.M., 2000. Diatoms and benthic microbial carbonates. In Riding, R.E and
Awramik, S.M. (editors) Microbial sediments. Springer-Verlag Berlin, Germany. Pages 76-83.
27

Table 1. Cascade strength results as measured as ln ratios. Values represent the ln ratio of average snails (individuals m-2) or Chl a (mg m–2) between treatments. Positive values indicate positive trophic cascades (promoting growth), and negative values represent negative trophic cascades (preventing growth).
ln (Np+/Np-) Comparison Snails Chl a Molariform/no cichlids -0.82 0.58 Papilliform/no cichlids 0.79 0.14 Pupfish/no pupfish -0.16 -0.43 All fish/no fish -0.98 0.30
Table 2. Summary of invertebrate means and ANOVA results of dominant orders in Herichthys minckleyi experiment. Numbers are average number of individuals m-2. Degrees of freedom = 4,35 for all ANOVAs.
Treatment Means (±SE)
Taxa group
Ambient Cage Control
Molariform Only
Papilliform Only No Cichlids F ratio p value
All Invertebrates 2436 (505) 2462 (314) 7820 (3657) 5619 (622) 3092 (583) 4.8152 0.0034
Amphipoda 1416 (425) 1557 (554) 6590 (3135) 3154 (536) 2027 (529) 4.5257 0.0047
Diptera 373 (30) 379 (41) 800 (297) 428 (82) 157 (45) 5.7254 0.0012
Ephemeroptera 17 (6) 19 (8) 20 (20) 65 (21) 19 (7) 2.7722 0.0422
Gastropoda 483 (74) 380 (110) 352 (226) 1775 (284) 803 (100) 14.433 <0.0001
Trichoptera 75 (12) 85 (30) 47 (18) 89 (20) 8 (4) 3.3454 0.0202
Table 3. Summary of invertebrate means and ANOVA results of dominant orders in Cyprinodon bifaciatus experiment. Numbers are average number of individuals m-2. Degrees of freedom = 3,26 for all ANOVAs. Treatment Means (±SE)
Taxa group
Ambient Cage Control Pupfish Only No Fish F ratio p value
All Invertebrates 2436 (505) 3510 (872) 2505 (1098) 2968 (384) 0.5322 0.664 Amphipoda 1416 (425) 2342 (718) 1225 (522) 1150 (180) 1.14 0.351 Diptera 373 (30) 511 (121) 116 (48) 553 (103) 4.16 0.016 Ephemeroptera 17 (6) 52 (19) 3 (3) 14 (5) 3.5198 0.029 Gastropoda 483 (74) 497 (116) 1026 (547) 1201 (239) 2.7253 0.065 Trichoptera 75 (12) 51 (19) 10 (10) 15 (5) 5.3855 0.005
28

Ave
rage
Inve
rtebr
ate
Den
sitie
s (p
er m
2 )
0
2000
4000
6000
8000
10000
12000
14000
A A
A,B
A
B
Ave
rage
Am
phip
oda
Den
sitie
s (p
er m
2 )
0
2000
4000
6000
8000
10000
12000
A A
A,BA
B
Ambient
Cage Control
Molariform Only
Papilliform Only
No CichlidsAve
rage
Sna
il D
ensi
ties
(per
m2 )
0
500
1000
1500
2000
2500
A A A
A
B
(a)
(b)
(c)
Figure 1. Average invertebrate response to H. minckleyi morph manipulation (± 1 SE) for (a) Total invertebrates, (b) Amphipods and (c) Gastropods. Different letters indicate significant differences (Post – Hoc Tukey HSD test). Overall means and ANOVA results are presented in Table 2.
29

Ave
rage
Dip
tera
Den
sity
(per
m2 )
0
200
400
600
800
1000
1200
Ave
rage
Tric
hopt
era
Den
sity
(per
m2 )
0
20
40
60
80
100
120
140
B B
A
A,B
A,B
Ambient
Cage Control
Molariform Only
Papilliform Only
No Cichlids
Ave
rage
Eph
emer
opte
ra D
ensi
ty (p
er m
2 )
0
20
40
60
80
100
A A
A A
B
A
A
A
B
A,B
(a)
(b)
(c)
Figure 2. Average invertebrate response to H. minckleyi morph manipulation (± 1 SE) for (a) Trichoptera, (b) Diptera and (c) Ephemeroptera. Different letters indicate significant differences (post-hoc Tukey HSD test). Overall means and ANOVA results are presented in Table 2.
30
Ambient
Cage Control
Molariform Only
Papilliform Only
No Cichlids
Chl
a (m
g pe
r m2 )
0
50
100
150
200
250
A AA
A,BB
Figure 3. Average stromatolite algal biomass response to H. minckleyi morph manipulation (± SE). Different letters indicate significant differences (post-hoc Tukey HSD test).
31

Ave
rage
Inve
rtebr
ate
Den
sitie
s (p
er m
2 )
0
1000
2000
3000
4000
5000NS
Ave
rage
Am
phip
oda
Den
sitie
s (p
er m
2 )
0
500
1000
1500
2000
2500
3000
3500NS
Ambient Cage Control No Fish Only PupfishAve
rage
Sna
il D
ensi
ties
(per
m2 )
0200400600800
10001200140016001800
NS
(a)
(b)
(c)
Figure 4. Average invertebrate response to C. bifasciatus manipulation (± 1 SE) for (a) Total invertebrates, (b) Amphipods and (c) Gastropods. Different letters indicate significant differences (post-hoc Tukey HSD test). Overall means and ANOVA results are presented in Table 3.
32

Ave
rage
Tric
hopt
era
Den
sitie
s (p
er m
2 )
0
20
40
60
80
100
A
A,B
B B
Ave
rage
Dip
tera
Den
sitie
s (p
er m
2 )
0
100
200
300
400
500
600
700
A,B
B
AA
Ambient Cage Control No Fish Only Pupfish
Aver
age
Ephe
mer
opte
ra D
ensi
ties
(per
m2 )
0
20
40
60
80
A,B
B
A,B
A
(a)
(b)
(c)
Figure 5. Average invertebrate response to C. bifasciatus manipulation (± 1 SE) for (a) Trichoptera, (b) Diptera and (c) Ephemeroptera. Different letters indicate significant differences (post-hoc Tukey HSD test). Overall means and ANOVA results are presented in Table 3.
33

Ambient Cage Control No Fish Only Pupfish
Chl
a (m
g pe
r m2 )
0
50
100
150
200
250
AA
A,B
B
Figure 6. Average stromatolite algal biomass response to C. bifasciatus manipulation (± SE). Different letters indicate significant differences (post-hoc Tukey HSD test).
34

Gastropoda abundance (ind. per m2)
200 400 600 800 1000 1200 1400 1600 1800 2000
Chl
a b
iom
ass
(mg
per m
2 )
80
100
120
140
160
180
200
220
y = -0.0645x + 212.83R2 = 0.5001
Figure 7. Stromatolite biomass (as Chl a) for all treatments from both experiments in relation to snail density (Gastropoda).
35

Appendix 1. Invertebrates collected from experimental stromatolites during harvest time. Order Order Family Family Lowest taxonomic level Lowest taxonomic level Amphipoda Gastropoda Hyalellidae Physidae Hyalella sp. Physa sp. Annelida Hydrobiidae Unidentified oligochaetes Durangonella sp. Coleoptera Mexipyrgus carranzae Elmidae Mexithauma quadripalium Dryopidae Nymphophilus minckleyi Helichus sp. Lepidoptera Hydrophilidae Pyralidae Hydraenidae Odonata Octhebius Coenagrionidae Decapoda Argia sp. Palaemonidae Enallagma sp. Palaemonetes suttkusi Libellulidae Diptera Macromia sp. Ceratopogonidae Ostracoda Bezzia sp Unidentified Culicoides sp. Trichoptera Chironomidae Hydroptilidae Various spp. Oxytheira sp. Tipulidae Leptoceridae Tipula sp. Nectopsyche sp. Ephemeroptera Polycentropidae Baetidae Cernotina sp. Callibaetis sp. Trombidiformes Caenidae Unidentified water mites Caenis sp. Turbellaria Leptohyphidae Unidentified flatworms Tricorythodes sp. Leptophlebiidae Traverella sp.
36

Antimycin A affects macroinvertebrates: mortality and recovery
Eric C. Dinger1,2 and J.C. Marks1
1Merriam-Powell Center for Ecological Research, Department of Biology, Northern
Arizona University, Box 5640, Flagstaff, AZ 86011, USA
2Current Address: National Aquatic Monitoring Center, Department of Watershed
Science, 5210 Old Main Hill, Logan, UT 84322, USA
37

Abstract
Restoring native fish to freshwater habitats often requires removal of exotic fish
using chemicals such as Antimycin A . Despite widespread use, there are limited field
studies quantifying the effects of Antimycin A on aquatic macroinvertebrates.
Laboratory bioassays indicate that Antimycin A is less toxic to invertebrates than other
chemicals such as rotenone, particularly when it is used at low concentrations. These
studies do not assess how diverse invertebrate assemblages respond to chemical treatment
under real world applications where complex habitats require that relatively high
concentrations need to be used. We studied the immediate and lingering effects of
Antimycin A on macroinvertebrates during a fish renovation project in Fossil Creek,
Arizona. We employed before-after-control-impact (BACI) designs to measure the
effects of Antimycin A (at 54 µg/L and 100 µg/L) on macroinvertebrate drift, densities
and species composition. We used the Hilsenhoff Biotic Index, a measure of invertebrate
pollutant tolerance, to study changes in species composition. At the highest dose (100
µg/L) Antimycin A increased drift five fold and immediately decreased invertebrate
standing stocks in pools and riffles. Densities rebounded in riffles within five months but
remained depressed in pools. At lower concentrations macroinvertebrate mortality,
measured as increased drift, was 24-fold higher than pretreatment levels. At this lower
concentration, however, macroinvertebrate densities in the benthos were not reduced.
Under both concentrations, there were shifts in species composition towards more
tolerant species. Although Antimycin A effects were mostly short-term, several species
were extirpated. We caution managers contemplating the use of Antimycin A in fish
renovations to consider the risks to macroinvertebrates. We suggest bioassays at
38

anticipated treatment levels to predict the effects upon macroinvertebrates, especially
sensitive species. Where there are sensitive species, steps should be taken to reduce
effects. Additionally, timing Antimycin A treatments with natural disturbances may help
mitigate treatment effects.
39

Introduction
Exotic species are implicated as one of the primary threats to freshwater
biodiversity worldwide (Allan and Flecker 1993, Richter et al. 1997). Exotic fish have
displaced native fish throughout the Southwestern United States where the majority of
native fish are listed as extinct, endangered, or threatened, or are candidates for listing
(Cross 1978, Marsh and Minckley 1990, Anderson et al. 1995, Dudley and Matter 2000).
The threat of exotic species is often magnified by habitat degradation, leading managers
to consider removing non-natives in conjunction with habitat improvements (Brasher
2003, Ormerod 2003). Eradicating non-native fish usually requires chemical treatment,
although there have been some successes in lakes with intensive netting (Knapp and
Matthews 1998) and in streams with intensive electrofishing (Kulp and Moore 2000).
The two main piscicides approved for fish kills are Rotenone and Antimycin A, which
both inhibit cellular metabolism of exposed organisms. Rotenone has been used since the
1930’s, but severe impacts to non-target organisms, plus negative public perception of
Rotenone has led to many fisheries managers favoring Antimycin A, even though much
less is known about its effects on other organisms (Finlayson et al. 2002).
Antimycin A, a fungal antibiotic, was discovered in the late 1940’s, and it’s
potential for use as a piscicide was recognized in the early 1960’s (Walker et al. 1964).
Like Rotenone, it affects cellular metabolism and inhibits the electron transport chain in
mitochondria, effectively stopping cellular energy production (Rieske et al. 1967).
Antimycin A is viewed as a preferred fish toxicant to Rotenone due to three perceived
advantages: 1) it is toxic to fish at low concentrations (usually µg/L, not mg/L needed for
40

Rotenone), 2) it degrades rapidly into non-toxic constituents (hours to days), and 3) it has
low toxicity to non-target organisms, targeting fish more effectively (Finlayson 2002).
Most of the evidence supporting Antimycin A as a better piscicide is based on
laboratory studies or small-scale field studies (Walker et al. 1964, Houf and Campell
1974, Snow 1974) with few field studies from large fish eradication projects (Gilderhus
et al. 1969). Effects of Antimycin A on non-target organisms are still not fully
understood. Although effects on other vertebrates (e.g. amphibians, reptiles, and
mammals) seem to be minimal (Walker et al. 1964, Gilderhus et al. 1969, Greselin and
Herr 1974), reports on aquatic invertebrates are varied (e.g. Morrison 1979, Minckley and
Mihalick 1981). The prevailing notion, however, is that there are minimal effects – and
when there are effects, they are not long-term. These perceptions are based largely on
government publications, which have not been peer reviewed and are often unavailable to
the public. Much of the research has been conducted using low concentrations of
Antimycin A (< 10 µg/L); but real-world applications of Antimycin A can exceed these
concentrations by several fold. This study documents the effects of Antimycin A, applied
at concentrations exceeding 50 µg/L, on the invertebrate assemblage in Fossil Creek,
Arizona.
To study the effects of Antimycin A, we employed a modified before-after-
control-impact (BACI) design comparing drift rates and benthic samples in two treated
and one control site before and after chemical treatment. We used invertebrate drift as an
immediate measure of application effects and benthic samples from pools and riffles to
measure immediate effects as well as longer-term impacts, four and five months
following treatment. We predicted that Antimycin A would create high mortality
41

evidenced by higher drift rates during treatment and reduced standing stock immediately
after treatment. We predicted that invertebrate densities would rebound within six
months of treatment. We also hypothesized that the species composition of the
community would shift to more tolerant invertebrates.
This is one of the most comprehensive studies of macroinvertebrate responses to
Antimycin A. By drawing on a large pre-treatment database we were able to view
changes caused by chemical treatment within the context of seasonal and annual
variation. Results from this study will inform future projects where managers are
considering using piscicides.
Study site
Fossil Creek (Fig. 1) is a perennial, travertine depositing spring-fed stream
originating from a layer of Mississippian Naco Limestone along the Mogollon rim in
northern Arizona. A series of seven springs (UTM Zone 12: 3809309 N, 447275 E;
Elevation above sea level: 1304 m) create the majority of baseflow of 1.302 m3/s,
although scattered smaller springs along the length of the stream also contribute (Malusa
et al. 2003). This spring water contains large concentrations of calcium bicarbonate and
dissolved carbon dioxide (Table 1). During this study, the majority of flow was diverted
at a small diversion dam less than 1 km below the springs but some seepage flow (<
0.056 m3/s) created a perennial stream except during severe droughts.
Exotic fish were removed as part of a larger restoration program involving the
decommissioning of the hydropower operation and restoration of flows in June 2005.
The exotic fish removal took place during the fall of 2004 prior to decommissioning so
42

that it could be conducted under reduced flows. This study took place from August 2002
to March 2005 while the hydropower plant was still in operation.
The areas above and directly below the diversion dam were not treated because
there were no exotics. The predominant native fish above the dam are desert suckers
(Catostomus clarki), speckled dace (Rhinichthys osculus) and headwater chub (Gila
nigra). Below the dam, the headwater chub is replaced by the roundtail chub (Gila
robusta), and the Sonoran sucker (Catostomus insignis) is also encountered. Exotic green
sunfish (Lepomis cyanellus) extended from the confluence of the Verde River to
approximately 1.6 km from the springs. Their uppermost limit marked the beginning of
the treatment reaches. Exotic bass (Micropterus dolomieui) were abundant from the
Verde River to the Irving Power Plant, where roughly 0.142 m3/s water was returned to
the creek increasing flow to 0.198 m3/s. Closer to the confluence with the Verde River,
two more exotic fish are present – flathead catfish (Pylodictis olivaris) and yellow
bullhead (Ameiurus natalis).
Invertebrate Assemblages
Prior to restoration, Fossil Creek supported a diverse assemblage of
macroinvertebrates with over 135 taxa found in the basin (Marks et al. 2005). Two
species of special concern are found within the Fossil Creek drainage – a microcaddisfly
(Trichoptera: Hydroptilidae), Metrichia nigritta, that is throughout Fossil Creek and an
endemic Hydrobiidae (Gastropoda) snail (Pyrgulopsis simplex) limited to the Fossil
Springs and several smaller springs within the drainage.
43

Methods
Renovation schedule and procedures
Arizona Game and Fish Department (AZGFD) partitioned the stream into two
separate reaches for renovation corresponding to the two flow regimes in the regulated
portion of the stream. Treatment reach 1 started at the furthest known distribution of
exotic fish (approximately 1.6 km below the spring) and ended downstream at a large
waterfall at the Irving Power Plant. Treatment reach 2 started at the end of reach 1 and
ended approximately 9.8 km downstream where the Bureau of Reclamation constructed a
fish barrier. Native fish were salvaged from both reaches prior to chemical treatment,
transported by helicopter to a holding facility, and returned to the river after chemical
treatment.
The first reach was treated with Antimycin A (Finitrol ®) on the 19th and 20th of
October 2004. Antimycin A target dosage was 50 µg/L in the main channel, but the
bottom of the reach had a target dosage of 100 µg/L (increased due to high iron in the
water). Additional treatment of side channels was at 10 µg/L. Application was
accomplished using bucket drip stations approximately 150 m apart, during a 4-hour
exposure period following instructions recommended by the manufacturer. In addition to
the drip stations, Antimycin A was applied in two other manners. First, Antimycin A
laden sand (Fintrol 15) was added to deep pools to ensure full treatment of pools with
slow turnover. Second, backpack sprayers added additional Antimycin A to isolated
water bodies, backwaters, and vegetated stream margins – with renovation crews
instructed to approximate an application of 50 µg/L. Because of these additional
application methods, final treatment concentrations of Antimycin A experienced by the
44

stream biota were probably in excess of the targeted application of 50 or 100 µg/L.
Detoxification of Antimycin A was done using a drip station of Potassium Permanganate
(3 mg/L) at the bottom of the treatment reach.
Treatment of reach 2 was conducted in a similar manner with some exceptions.
Although the initial application plan called for a concentration of 100 µg/L, increased
stream flow from recent precipitation diluted the actual application concentration.
Managers were unable to secure additional Antimycin A and proceeded with the
treatment plan using quantities calculated under normal base flow. The upper portion of
the reach was treated on 9 November 2004 at application concentration of 35 µg/L. The
lower section was treated on 10 November 2004 when water levels were lower resulting
in an application of 54 µg/L. Backpack sprayers and Antimycin A laden sand were
applied as described above. Detoxification used sodium permanganate instead of
potassium permanganate, at 3 mg/L.
Site Selection
Site selection is an important aspect of environmental impact detection. We
selected two impact sites and one control site that corresponded with long-term survey
sites. As part of our monitoring program all sites had been sampled six times in the two
years prior to restoration. In treatment reach 1 the impact site, which was directly above
the Irving Power Plant, experienced target applications of Antimycin A of 100 µg/L. In
treatment reach 2 the impact site was just downstream of the middle of the 2nd treatment
reach and received target Antimycin A concentrations of 54 µg/L. These different
treatment regimes allowed us to assess the impacts of Antimycin A at two different
levels.
45

One control site was used as a reference site for both treatment sites. The control
site was 100 meters below the diversion dam and experienced the same flow regime as
treatment site 1. This site was sufficiently close to the impact sites that it experienced the
same natural variation in flow and climate as the impact sites. We were constrained to
one control site because downstream sites may have been contaminated and sites above
the diversion dam had considerably different flow regimes.
Benthic sampling
We sampled the benthic macroinvertebrate assemblages in both riffles and pools,
before and after the treatments (Table 2). Riffles were sampled using a 929 cm2 surber
sampler with a 250 µm mesh, following standard protocols (Hauer and Resh 1996).
Samples were taken at haphazard locations within the study reach. Invertebrates and
substrate (cobble, gravel, particulate matter) collected in the Surber sampler were
transferred to a 5-gal bucket, and elutriated into another bucket to remove the inorganic
matter. Invertebrates were preserved in 95% Ethanol. Pool invertebrates were sampled
using a 324 cm2 core sampler, driven into the pool substrate as deep as possible at a
haphazard location. A trowel was used to retain the sample while transferring it to a 5-
gal bucket. Once in the bucket, samples were elutriated, preserved in 95% Ethanol and
processed in the same manner as the Surber samples. The number of replicates of core
and Surber samples depended on the sampling period. Five replicates were taken as part
of long-term studies, and ten replicates were taken in the periods leading up to and
following the Antimycin A treatment (Table 2). In the laboratory, invertebrates were
sorted with a magnifying glass and identified to the lowest practical taxonomic level
(usually genus, except for Chironomidae which was left at family) and enumerated.
46

Drift Samples
Drifting invertebrates were collected following standard protocols (Smock 1996)
with two different net designs – one large design by a commercially available
manufacturer and one small homemade design. The manufactured design was purchased
at Aquatic Ecosystems and measures 30 cm by 30 cm, with either a 250 µm or a 500 µm
mesh net. The homemade designs were 14 cm by 14 cm with 500 µm mesh net. Nets
were placed in riffles and secured in place using rebar driven into the stream substrate.
The nets were left in the water column for approximately 120 minutes, after which we
recorded current velocity and depth of the net. After nets were removed from the water,
samples were washed into buckets, and processed in a similar manner to benthic samples.
Samples were washed through a 1mm mesh sieve to standardize for different mesh sizes
of the nets. Invertebrates were sorted and counted and reported as the # individuals per
100 m3 of water (Smock 1996).
Because simple changes in density do not address changes in community structure
we used the Hilsenhoff Biotic Index (HBI) as an additional variable in our analyses. The
Hilsenhoff Biotic Index is a weighted average of tolerance values for each sample
(Hilsenhoff 1987, 1988) and is calculated as:
HBI = Σniti /N
where ni = number of individuals counted for species I, ti = tolerance value for species i,
and N is the total number of individuals in a sample. Tolerance values range from 0 to
10, with 0 being intolerant of stress, and 10 being very tolerant of stress. Tolerance
47

values for invertebrates in our samples were taken from regional values developed for the
US Environmental Protection Agency (Barbour et al. 1999). Because no values have
been developed for the Southwest, we used the values developed for the Northwest.
When no value existed for the Northwest, we used Midwest values. In the rare case when
no value existed for a taxon, we omitted that taxon from the HBI. Because these values
were developed to measure the tolerance of organisms to organic pollutants, we feel that
they are relevant and indicative of Antimycin A effects. Increases in HBI values
following treatment indicate a shift in community composition to more tolerant species.
Statistical analyses
Significance of short-term HBI and density changes for both benthos and drift
were analyzed with ANOVA analyses using a standard Before-After-Control-Impact
(BACI) model (Green 1979). This method uses both time (before and after) and site
(control and impact) as factors in the model, but significance of the impact is revealed in
the interaction of site and time. For the analysis of the drift, we modified this test in that
it was a Before-During/Control-Impact design. All density data used in the analyses were
log (x +1) transformed to normalize variances.
We used a Before-After-Control-Impact Paired Series (BACIPS) test to measure
the long-term impacts (Stewart-Oaten 1996). It uses paired differences in the Control-
Impact sites as the dependent variable, and uses time (Before-After) as the sole factor.
Because our drift samples were limited to before and during the treatment, this analysis
was not applied to the drift. All ANOVAs were analyzed using JMP IN (version 4.02).
Where there were significant or marginally significant effects in either the short or
long-term HBI, we visualized the assemblages using Non-Metric Multidimensional
48

Scaling ordination (NMDS) routine in PC-ORD (version 4.02). These ordinations provide
a graphical representation of community differences using the Sorenson (Bray-Curtis)
distance measures. In the case of drift, we relativized the data to sample maximum to
adjust for potentially large density differences between pretreatment and during treatment
samples. To assist in the interpretation of these ordinations, we used the joint plot
function of PC-ORD using the following secondary variables: Total Species Richness
(SR), Eveness, Shannon’s H, Simpson’s D, Coleopteran SR, Dipteran SR,
Ephemeropteran SR, Trichopteran SR, Other (miscellaneous taxa) SR, and the Hilsenhoff
Biotic Index. When the joint plot is run, it creates a directional vector that shows the
relationship between the secondary variables and the ordination scores. If a vector points
toward a certain group of samples, those samples are positively correlated with the
secondary variable. PC-ORD also calculates an r2 associated with the secondary variable.
A common concern is that Antimycin A may result in the local extirpation of
species that will fail to recover. To this end, we performed indicator species analysis in
PC-ORD to detect if there were any species that were only present in the benthos prior to
treatment, and had failed to either persist or recover following treatment. In interpreting
the results, we considered only species that were present prior to treatment, but were
absent in 100% of the post-treatment samples. Significance of the indicator species
analysis is tested using a Monte Carlo randomization test in PC-ORD. Because absence
of certain taxa could be explained by seasonal differences (e.g. emergence), we also
performed the indicator species analysis on the control site as a comparison.
49

Results
Treatment Site 1
There were significant short-term treatment effects of Antimycin A in Treatment
Site 1 (Table 3). Drifting invertebrates significantly increased from a pretreatment
average of 83.5 ind/100 m3 of water to 443.2 ind/100 m3 of water during the treatment, a
more than five fold increase (BACI ANOVA; F1,55 = 4.075, p = 0.048) (Fig. 2A).
Observations of drifting invertebrates indicated that the majority were dead upon
collection. The HBI values of the during treatment invertebrate assemblage were not
significantly different from pretreatment values (BACI ANOVA; F1,53 = 2.372, p =
0.129).
Invertebrates were scarce in samples taken initially after treatment. Densities of
riffle invertebrates significantly dropped from pretreatment values of 2,802 ind/m2 to 300
ind/m2 (BACI ANOVA; F1,39 = 8.41, p = 0.007)(Fig. 2B). Riffle HBI also increased
from 4.98 to 6.98 (BACI ANOVA; F1,39 = 18.062, p <0.001) indicating a shift to more
tolerant species. The effects in riffles were mirrored in pools, with a drop in density from
3,162 ind/m2 pretreatment to 610 ind/m2 after treatment, a five fold drop in density
(BACI ANOVA; F1,39 = 4.624, p = 0.038). There was no effect on the HBI in pools
(BACI ANOVA; F1,39 = 0.035, p = 0.585) (Fig. 2C).
Macroinvertebrates mostly rebounded within five months after treatment. There
were no detectable long-term effects either in density or HBI in riffles (Table 3). Five
months after the treatment, riffle invertebrates had increased to 3,326 ind/m2, a value
slightly higher than the immediate pretreatment value (2,802 ind/m2). HBI had similarly
rebounded to values similar to pretreatment levels within two months. Pool invertebrates
50

had also increased from post treatment lows of 610 ind/m2 to 1,410 ind/m2 five months
after treatment. Although densities had not yet recovered to pretreatment levels, the test
for long-term effects was only marginally significant (BACIPS ANOVA; F1,8 = 5.583, p
= 0.051).
Because there was a detectable shift in the HBI in the invertebrate riffle
assemblage, we ran NMS ordination to visualize the shift in community (Fig. 3). The
ordinations shows clear grouping of samples taken shortly after treatment, compared to
the pretreatment and samples taken five months following treatment, indicating that the
assemblages changed following treatment and then recovered close to a pretreatment
state. Furthermore, the joint plot explanatory variables with an r2 higher than 0.4 were
HBI tolerance values (Toler) = 0.59, ephemeroptera diversity (E div) = 0.42, and species
richness (SR) = 0.48. In this configuration, higher tolerances are associated with the
samples taken shortly after treatment, whereas the pretreatment and five months later
samples are associated with increased species richness and mayfly diversity.
Treatment Site 2
Like Treatment Site 1, application of Antimycin A resulted in immediate, large
increases of drifting invertebrates (BACI ANOVA; F1,57 = 31.582, p < 0.001) (Table 4,
Fig. 4A). This increase was much larger than the increase in Treatment Site 1, being an
almost 24 fold increase (23.2 ind/100 m3 water prior to treatment, 556.3 ind/100 m3 water
during treatment). Visual inspection again indicated that the majority of invertebrates
were dead upon collection. Although the HBI of drift was not significantly different
(BACI ANOVA; F1,53 = 3.85, p = 0.055), there was a trend of lower HBI in the
invertebrates drifting during the treatment (average of 4.76) compared to HBI values
51

drifting prior to treatment suggesting that less tolerant species were more strongly
affected by chemical treatment (average of 5.48).
Unlike Treatment Site 1, there was no short term effect of Antimycin A
application on densities either in riffles or pools (Riffle: BACI ANOVA; F1,39 = 0.023, p
= 0.881, Pool: BACI ANOVA; F1,39 = 0.037, p = 0.848) (Table 4, Fig. 4B,C). Not
surprisingly, there was no long term effect either (Riffle: BACIPS ANOVA; F1,7 = 0.007,
p = 0.937; Pool: BACIPS ANOVA; F1,7 = 2.841, p = 0.144). There were however short
and long term effects on the riffle invertebrate assemblage, as measured by HBI (BACI
ANOVA: F1,39 = 11.884, p = 0.002; BACIPS ANOVA; F1,7 = 10.717, p = 0.017)
indicating that the community shifted to more tolerant taxa.
Ordination of drift assemblages separated pretreatment drift from treatment drift
(Fig 5). The joint plot function shows that the pretreatment drift was associated with
higher HBI tolerance values (r2 = 0.37), and that drifting invertebrates during treatment
had relatively lower HBI tolerance values indicating that less tolerant organisms as
measured by HBI are more susceptible to Antimycin A.
Ordination of the riffle assemblages (Fig. 6) shows clear separation between
pretreatment samples and samples taken shortly after treatment. In contrast to treatment
1 at this site, samples taken four months later still did not resemble the pretreatment
samples indicating that the assemblage did not yet fully recover. Joint plot function
shows that pretreatment assemblages were associated with high Ephemeroptera diversity
(E div; r2 = 0.528) and that samples four months after treatment were associated with
high Diptera diversity (D div; r2 = 0.53).
52

Control Site
Relative to Treatment Sites 1 and 2, there was little change in the drift, density, or
community (as measured by HBI) during the treatment periods (Fig. 7). Control drift
rates were similar to pretreatment drift rates during the 1st treatment (Treatment Site 1
average: 83.4 indiviuals/100 m3 water; Control Site average: 73.7 indiviuals/100 m3
water) as well as the 2nd treatment (Treatment Site 2 average: 23.3 individuals/100 m3
water; Control Site average: 17.3 individuals/100 m3 water). The decrease in drift for the
period between 13 October 2004 and 8 November 2004 was likely due to high flows
from precipitation events during that period.
Indicator Species Analyses
We found significant losses of invertebrate species in treatment reaches (Table 5).
These are species, that after over four or five months had still not reappeared, whereas the
control site experienced no loss of species. In treatment site 1, of the nine species that
were not found after the treatment, three were found to be significant using Monte Carlo
randomization. Treatment site 2 had eight taxa extirpated, with three being significant.
In treatment site 1, this represented a loss of 7% of the total diversity, and treatment site 2
lost 14% of the total diversity.
Discussion
Our results show that Antimycin A can detrimentally affect macroinvertebrates
depending on the concentrations of Antimycin A used and the species composition of the
macroinvertebrates. Initial mortality rates during treatment were high and dramatically
reduced densities. Nevertheless, densities recovered after five months at one site and
53

remained only slightly depressed at a second site where higher concentrations were used.
Some species were particularly vulnerable to chemical treatment, failing to recover after
five months. Short-term reductions in density were more dramatic in pools than in riffles
whereas changes in species composition were more pronounced in riffles than in pools.
The larger effect at treatment site 1 was probably due to the higher concentrations
used there and to the higher tolerance of the assemblage at site 2 as measured by the HBI
index. Given additional time, we expect full recovery in the invertebrates in both sites,
This study was limited in duration by the flow restoration which commenced in June
2005. We will continue to monitor invertebrates particularly to see if the species that
were not found after treatment recover. We anticipate however major changes in density
and species composition of invertebrates with increased base flow, challenging our ability
to detect lingering effects of Antimycin A. Nevertheless this study remains one of the
most comprehensive evaluations of Antimycin A on invertebrates.
It is difficult to predict a priori which species may be extirpated from the
community. Some species were locally extirpated in treatment site 1, but persisted in
treatment site 2, and vice versa. HBI tolerance values were also not useful in predicting
species losses. The average HBI tolerance values for the species lost was 4.3 for
treatment site 1, and 4.2 for treatment site 2, which are not indicative of sensitive taxa.
Our results are consistent with other studies that showed drastic short-term effects
of Antimycin A applications of 10-44 µg/L (Jacobi and Deagan 1977, Minckley and
Mihalick 1981). Both studies reported recovery of common taxa within one to three
years (Jacobi and Deagan 1977, Minckley and Mihalick 1981). Species responses were
not reported in the first study, whereas Minckley and Mihalick (1981) reported that six
54

species were still absent after three years which they attribute to sampling errors or
possibly flooding events. Our more in-depth analysis, however, revealed that the
absences of some species in Fossil Creek are unlikely due to sampling error or natural
disturbance but are due to the chemical treatment. In contrast to our results, other
researchers report no effect of Antimycin A, probably because these studies were
conducted at lower concentrations (10 µg/L Antimycin A) (Gilderhus et al. 1969,
Morrison 1979, Minckley and Mihalick 1981). Some of these studies were limited to
artificial pools, with few to no controls (Snow 1974, Houf and Campbell 1977).
Interestingly, some government studies that concluded that Antimycin A is safe
for invertebrates actually documented mortality rates of 50% to 99% but nevertheless
concluded that Antimycin A is “largely specific to fish and causes no harm to most of
the other aquatic animals” (Gilderhus et al. 1969, page 20), and that there are “no grossly
toxic effects” (Walker et al. 1964, page 14).
Recovery in Fossil Creek was likely facilitated by the location and timing of the
project. First, there was an upstream site that was untreated. Because invertebrate
colonization is largely from upstream sources, the presence of a colonizing source nearby
in the same watershed almost certainly increased recovery rates. Second, the AZGFD
department timed the project for the late fall when many Arizona streams experience
heavy rain and flash floods. This is a process that desert aquatic invertebrates are adapted
to – either by finding refuge in the hyporheic zone, or in different life stages (e.g.
terrestrial adults). This was evident in the control samples that showed low densities
during the treatment period relative to other sampling periods. Although trying to
implement a large-scale project during foul, fall weather was not easy, by placing the
55

artificial disturbance in the background of natural disturbance, overall effects to the biota
may have been minimized.
The use of Antimycin A to eradicate exotic fish increased in the 1990’s as
managers confronted the difficult issues of conserving native fish, a trend that will likely
continue (Finlayson 2002). Higher concentrations will need to be used as managers
attempt to eradicate exotic fish in larger more complex rivers such as Fossil Creek. In
most cases environmental assessments are required challenging managers and other
stakeholders to consider the positive and negative effects on the health of the entire
ecosystem.
We maintain that there is a misconception that Antimycin A does not affect
aquatic invertebrates. Our results and others indicate that Antimycin A can kill
macroinvertebrates and that some species may not recover. The dearth of peer-reviewed
studies evaluating the effects of Antimycin A on macroinvertebrates argues for including
comprehensive monitoring programs as mandatory components of chemical treatment.
This will help scientists and managers build a database to assess the effects of Antimycin
A under different field conditions. In Fossil Creek, macroinvertebrates were scarcely
mentioned in the Environmental Assessment (USDA 2003) and were not included in the
subsequent monitoring program, in part because of the commonly held belief that
Antimycin A does not harm macroinvertebrates. As with all management actions, the
concerned parties must carefully weigh the risks and benefits allowing stakeholders to
decide whether the risk to aquatic invertebrates is justifiable for the continued health of
native fisheries.
56

We offer four general lessons that emerged from this study that can be applied to
proposed projects. First, if there are listed or endemic macroinvertebrate taxa in the study
site then Antimycin A treatment should have provisions for protecting these taxa. In
Fossil Creek, there are two species of special concern. Pretreatment surveys revealed that
both species were concentrated above the diversion dam in an area that would not be
treated. In projects where species of special concern are not naturally protected the
protocol should include a plan for salvaging individuals prior to treatment. Second, in
projects where native fish are reintroduced into the river from other sites or captive
populations, it may be prudent to wait at least six months, while macroinvertebrates
recover, before reintroducing fish species that feed on macroinvertebrates. Third, in situ
bioassays can help predict site-specific effects. In the Fossil Creek project, we worked
with AZGFD while they determined the necessary Antimycin A concentrations. To do
this we measured drift in small test reaches. We were able to advise that high mortalities
of aquatic invertebrates would likely occur upon full treatment. Although this method
cannot predict long-term impacts, it does give managers the information needed to judge
the risks and benefits involved. Multiple bioassays, at a variety of concentrations can
also help determine the best choice – a concentration low enough so that there is minimal
effect on aquatic invertebrates, but high enough so that 100% fish kill is ensured. When
the amount of Antimycin A needed is high enough so that large kills of invertebrates are
unavoidable, this may suggest the use of alternative piscicides, such as the more
accessible and cost effective Rotenone. This suggestion is based on the premise that one
of the main advantages of Antimycin A over Rotenone is lower mortalities on aquatic
57

invertebrates. Fourth, when possible, projects should be timed to coincide with natural
disturbance regimes or when the majority of insects are in their terrestrial life stage.
Literature Cited
Allan, J.D. and A.S. Flecker. 1993. Biodiversity conservation in running waters. Bioscience 43:32-43.
Anderson, A.A., C. Hubbs, K.O. Winemiller, and R.J. Edwards. 1995. Texas freshwater
fish assemblages following three decades of environmental change. The Southwestern Naturalist 40:314-321.
Barbour, M.T. J.Gerritsen, B.D. Snyder, and J.B. Stribling. 1999. Rapid bioassessment
protocols for use in streams and wadeable rivers: periphyton, benthic macroinvertebrates and fish, 2nd edition. EPA 841-B-99-002. U.S. Environmental Protection Agency; Office of Water, Washington, D.C.
Brasher, A.M.D. 2003. Impacts of human disturbance on biotic communities in
Hawaiian streams. Bioscience 53:1052-1060. Cross J.N. 1978. Status and ecology of the Virgin River roundtail chub, Gila robusta
seminuda (Osteichthyes: Cyprinidae). The Southwestern Naturalist 23:519-528. Dudley, R.K. and W.J. Matter. 2000. Effects of small green sunfish (Lepomis cyanellus)
on the recruitment of Gila chub (Gila intermedia) in Sabino Creek, Arizona. The Southwestern Naturalist 45:24-29.
Fagan, W.F., P.J. Unmack, C. Brugess, and W.L. Minckley. 2002. Rarity, fragmentation,
and extinction risk in desert fishes. Ecology 83:3250-3256. Finlayson, B.J., R.A. Schnick, R.L. Cailteux, L. DeMong, W. McClay, and C.W.
Thompson. 2002. Assessment of Antimycin A use in fisheries and its potential for reregistration. Fisheries 27:10-18
Gilderhus, P.A., B.L. Berger, and R.E. Lennon. 1969. Field trials of Antimycin A as a
fish toxicant. U.S. Bureau of Sport Fisheries and Wildlife, Investigations in Fish Control No. 27. Washington, D.C.
Green, R.H. 1979. Sampling design and statistical methods for environmental biologists.
Wiley and Sons, New York, NY. Greselin, E. and F. Herr. 1974. Further toxicity studies with Antimycin, a fish eradicant.
Journal of Agricultural and Food Chemistry 22:996-998.
58

Hauer, F.R. and V.H. Resh. 1996. Benthic Macroinvertebrates. Pages 339-369 in F.R.
Hauer and G.A. Lamberti (Eds.) Methods in Stream Ecology. Academic Press, San Diego, CA.
Hilsenhoff, W. L. 1987. An improved biotic index of organic stream pollution. Great
Lakes Entomologist 20:31-39. Hilsenhoff, W.L. 1988. Rapid field assessment of organic pollution with a family level
biotic index. Journal of the North American Benthological Society 7:65-68. Houf, L.J. and R.S. Campbell. 1977. Effects of Antimycin A and Rotenone on
macrobenthos in ponds. U.S. Fish and Wildlife Service, Investigations in Fish Control 80. Washington, D.C.
Jacobi, G.Z. and D.J. Deagan. 1977. Aquatic Macroinvertebrates in a small Wisconsin
trout stream before, during, and two years after treatment with the fish toxicant Antimycin. U.S. Fish and Wildlife Service, Investigations in Fish Control 81. Washington, D.C.
Knapp, R.A. and K.R. Matthews. 1998. Eradication of non-native fish from a small
mountain lake: gill netting as a non-toxic alternative to the use of rotenone. Restoration Ecology 6:207-213.
Kulp, M.A. and S.E. Moore. 2000. Multiple electrofishing removals for eliminating
rainbow trout in a small southern Appalachian stream. North American Journal of Fisheries Management 20:351-356.
Malusa, J., Overby, S.T. and R.A. Parnell. 2003. Potential for travertine formation:
Fossil Creek, Arizona. Applied Geochemistry 18:1081-1093. Marks, J.C., G.A. Haden, E.C. Dinger and K.J. Adams. 2005. A survey of the aquatic
community at Fossil Creek, Arizona. Arizona Game and Fish Department Heritage Grant I03003, Final Report, Phoenix, AZ.
Marsh, P.C. and W.L. Minckley. 1990. Management of endangered Sonoran topminnow
at Bylas Springs, Arizona: Description, critique, and recommendations. Great Basin Naturalist 50:265-272.
Minckley, W.L. and J.E. Deacon (Eds.) 1991. Battle against extinction: native fish
management in the American West. University of Arizona Press. Tucson, Arizona.
Minckley, W.L and P. Mihalick. 1981. Effects of chemical treatment for fish eradication
on stream-dwelling invertebrates. Journal of the Arizona-Nevada Academy of Science 16:79-82.
59

Morrison, B.R.S. 1979. An investigation into the effects of the piscicide Antimycin A
on the fish and invertebrates of a Scottish stream. Fisheries Management 10:111-122.
Omerod, S.J. 2003. Current issues with fish and fisheries: editor’s overview and
introduction. Journal of Applied Ecology 40:204-213. Rieske, J.S., H. Baum, C.D. Stoner, and S.H. Lipton. 1967. On the Antimycin-sensitive
cleavage of complex III of the mitochondrial respiratory chain. The Journal of Biological Chemistry 21:4854-4866.
Rinne, J.N. and W.L. Minckley. 1991. Patterns of variation and distribution in Apache
trout (Salmo apache ) relative to co-occurrence with introduced salmonids. Copeia 1985:285-292.
Richter, B.D., Braun, D.P., Mendelson, M.A. and L.L. Master. 1997. Threats to
imperiled freshwater fauna. Conservation Biology 11:1081-1093. USDA (United States Department of Agriculture), Forest Service. 2003. Draft
Environmental Assessment – Native fish restoration in Fossil Creek. Coconino and Tonto National Forests, Phoenix, Arizona.
Snow, H. E. 1974. Notes on the zooplankton and benthos of Rush Lake, Douglas
County, six years after application of Antimycin. Department of Natural Resources, State of Wisconsin, Research Report 79.
Stewart-Oaten, A. 1996. Problems in the analysis of environmental monitoring data.
Pages 109-132 in Schmitt, R.J. and C. Osenberg (Eds.), Detecting Environmental Impact. Academic Press, San Diego, CA.
Walker, C.R., Lennon, R.E., and B.L. Berger. 1964. Preliminary observations on the
toxicity of Antimycin A to fish and other aquatic animals. Bureau of Sport Fisheries and Wildlife, Investigations in Fish Control 2.
60
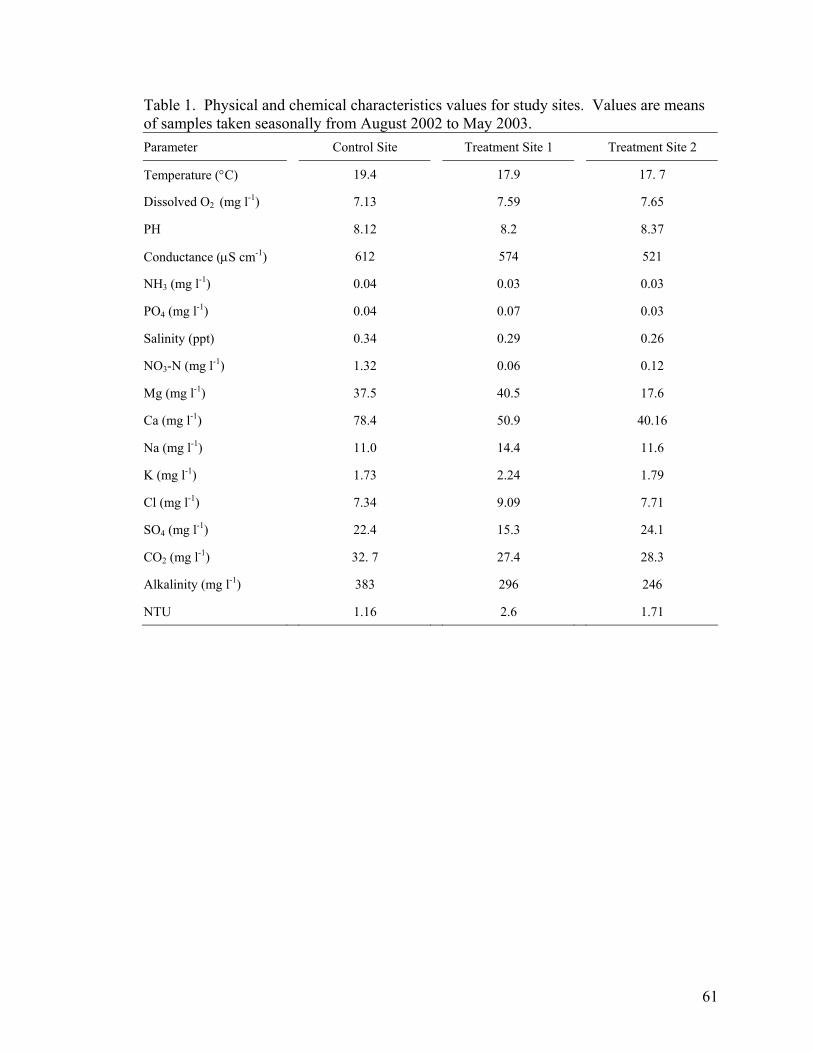
61
Table 1. Physical and chemical characteristics values for study sites. Values are means of samples taken seasonally from August 2002 to May 2003. Parameter Control Site Treatment Site 1 Treatment Site 2
Temperature (°C) 19.4 17.9 17. 7
Dissolved O2 (mg l-1) 7.13 7.59 7.65
PH 8.12 8.2 8.37
Conductance (µS cm-1) 612 574 521
NH3 (mg l-1) 0.04 0.03 0.03
PO4 (mg l-1) 0.04 0.07 0.03
Salinity (ppt) 0.34 0.29 0.26
NO3-N (mg l-1) 1.32 0.06 0.12
Mg (mg l-1) 37.5 40.5 17.6
Ca (mg l-1) 78.4 50.9 40.16
Na (mg l-1) 11.0 14.4 11.6
K (mg l-1) 1.73 2.24 1.79
Cl (mg l-1) 7.34 9.09 7.71
SO4 (mg l-1) 22.4 15.3 24.1
CO2 (mg l-1) 32. 7 27.4 28.3
Alkalinity (mg l-1) 383 296 246
NTU 1.16 2.6 1.71

Table 2. Treatment and sampling schedule for Antimycin A treatment of Fossil Creek. Numbers in parentheses indicate the number of replicates taken in that period. Benthos sampling numbers are for each type of sample (Pool and Riffle). * indicates Drift control dates for Treatment Site 2. NA indicates not applicable.
62
Benthos Dates Drift Dates
Treatment
Concentration Treatment
Date Pre Post Pre During
Control 0 ppb NA 8/14/2002 (5) 11/19/2004 (10) 10/13/2004 (10) 10/19/2004 (21)
Site
12/4/2002 (5) 12/14/2004 (10) 11/8/2004 (10)* 11/10/2004 (16)* 10/1/2003 (5) 3/17/2005 (10)
5/5/2003 (5)1/31/2004 (5)
10/13/2004 (10)
Treatment >100 ppb 10/19/04 8/15/2002 (5) 11/4/2004 (10) 10/18/2004 (10) 10/19/2004 (18)
Site 1 12/16/2002 (5) 12/13/2004 (10) 5/5/2003 (5) 3/16/2005 (10) 9/30/2003 (5)1/30/2004 (5)
10/18/2004 (10)
Treatment >54 ppb 11/10/04 8/12/2002 (5) 12/13/2004 (10) 11/5/2004 (10) 11/10/2004 (24)
Site 2 12/16/2002 (5) 3/16/2005 (10) 5/5/2003 (5)9/30/2003 (5)1/30/2004 (5)11/5/2004 (10)

Table 3. Results of ANOVA tests at Treatment Site 1 on changes in total invertebrate densities and changes in HBI from Antimycin A treatment. For BACI tests (Before-After-Control-Impact) only the interaction (site X date) is given.
Sample ANOVA Type Response Variable Degrees of
Freedom F - Value
p - Value
Drift Immediate (BACI) Density 1, 55 4.076 0.048
HBI 1, 53 2.372 0.129
Riffles Short-term (BACI) Density 1, 39 8.413 0.007
HBI 1, 39 18.062 0.001
Long-term (BACIPS) Density 1, 8 0.985 0.354
HBI 1, 8 0.341 0.577
Pools Short-term (BACI) Density 1, 39 4.642 0.038
HBI 1, 39 0.305 0.585
Long-term (BACIPS) Density 1, 8 5.583 0.051
HBI 1, 8 0.920 0.370
63

Table 4. Results of ANOVA tests at Treatment Site 2 on changes in total invertebrate densities and changes in HBI from Antimycin A treatment. For BACI tests (Before-After/Control-Impact) only the interaction (site X date) is given.
Sample ANOVA Type Response Variable Degrees of
Freedom F - Value
P - Value
Drift Immediate (BACI) Density 1,57 31.582 <0.001
HBI 1,53 3.854 0.055
Riffles Short-term (BACI) Density 1, 39 0.023 0.881
HBI 1, 39 11.884 0.002
Long-term (BACIPS) Density 1, 7 0.007 0.937
HBI 1, 7 10.717 0.017
Pools Short-term (BACI) Density 1, 39 0.037 0.848
HBI 1, 39 1.387 0.248
Long-term (BACIPS) Density 1, 7 2.815 0.144
HBI 1, 7 1.068 0.341
64

Table 5. Results of indicator species analysis for control and treatment sites showing extirpation of invertebrates following Antimycin A treatment. All listed taxa failed to show in any post treatment sampling. Extirpations significant by Monte Carlo simulation are denoted with a *. Percent Affected is the proportion of missing taxa to total no. of taxa appearing before treatment. E = Ephemeroptera, D = Diptera, T = Trichoptera, O = Odanata, C = Coleoptera, H = Heteroptera, L = Lepidoptera
Control Treatment Site 1 Treatment Site 2
Extirpated Taxa p - Value Extirpated Taxa p - Value Extirpated Taxa p - Value
None Baetodes (E) * 0.002 Aquatic Mites 0.101
Bezzia (D) 0.056 Chimarra (T) 0.101
Chimarra (T) * 0.011 Corydalus (M)* 0.031
Haeterina (O) 0.248 Hemerodromia (D) 0.098
Lutrochus (C) 0.252 Hydropsyche (T)* 0.001
Metrichia (T) 0.255 Lutrochus (C)* 0.029
Rhagovelia (H) * 0.003 Petrophila (L) 0.325
Tinodes (T) 0.056 Tricorythodes (E) 0.331
Tricorythodes (E) 0.255
Total Significant 0 Total Significant 3 Total Significant 3
Percent Affected 0% Percent Affected 7% Percent Affected 14%
65

Control Site
Treatment Site 1Treatment Site 2
Figure 1. Map of Fossil Creek, Arizona showing study sites.
66

0
100
200
300
400
500
600
700
18 Oct 2004 19 Oct 20040
1
2
3
4
5
6
7
8
9
10Drift DensityHBI
0
2000
4000
6000
8000
10000
12000
14000
16000
18000
15 Aug2002
16 Dec2002
5 May2003
30Sept2003
30 Jan2004
18 Oct2004
4 Nov2004
13 Dec2004
16 Mar2005
0
1
2
3
4
5
6
7
8
9
10DensityHBI
0
5000
10000
15000
20000
25000
30000
35000
40000
15 Aug2002
16 Dec2002
5 May2003
30 Sept2003
30 Jan2004
18 Oct2004
4 Nov2004
13 Dec2004
16 Mar2005
0
1
2
3
4
5
6
7
8
9
10DensityHBI
Den
sity
(ind
ivid
uals
/m2 )
Drif
t Den
sity
(ind
ivid
uals
/100
m3 H
2O)
Hils
enho
ff Bi
otic
Inde
x (H
BI)
A. Drift
B. Riffles
C. Pools
Figure 2. Mean drift, benthos densities and HBI in Treatment Site 1. A (top) is drift and HBI before and during treatment. B (middle) is densities and HBI in riffles before and after treatment. C (bottom) densities and HBI in pools before and after treatment. Treatment is indicated by red arrow. Bars = 1 SE.
67

Stress = 7.9
Figure 3. Non-Metric Multidimensional Scaling ordination of invertebrate riffle assemblages in Treatment Site 1 showing relationship of samples. Joint plots shown in red are variables that explained more that 40% variability (r2 > 0.4) along axes 1 or 2. Toler = HBI tolerance values, SR = Species Richness, E div = Ephemeroptera diversity.
68

0
100
200
300
400
500
600
700
5 Nov 2004 10 Nov 20040
1
2
3
4
5
6
7
8
9
10Drift DensityHBI
0
500
1000
1500
2000
2500
3000
3500
4000
4500
5000
12 Aug2002
16 Dec2002
5 May2003
30 Sept2003
30 Jan2004
5 Nov2004
13 Dec2004
16 Mar2005
0
1
2
3
4
5
6
7
8
9
10DensityHBI
0
5000
10000
15000
20000
25000
12 Aug2002
16 Dec2002
5 May2003
30 Sept2003
30 Jan2004
5 Nov2004
13 Dec2004
16 Mar2005
0
1
2
3
4
5
6
7
8
9
10DensityHBI
Den
sity
(ind
ivid
uals
/m2 )
Drif
t Den
sity
(ind
ivid
uals
/100
m3 H
2O)
Hils
enho
ff B
iotic
Inde
x (H
BI)
A. Drift
B. Riffles
C. Pools
Figure 4. Mean drift, benthos densities and HBI in Treatment Site 2. A (top) is drift and HBI before and during treatment. B (middle) is densities and HBI in riffles before and after treatment. C (bottom) densities and HBI in pools before and after treatment. Treatment is indicated by red arrow. Bars = 1 SE.
69

Stress = 11.2
Figure 5. Non-metric Multidimensional Scaling ordination of Treatment Site 2 drift before and during treatment showing relationship of samples. The only joint plot with a r2 > 0.3 was Toler (HBI tolerance values).
70

Stress = 17.1
Figure 6. Non-Metric Multidimensional Scaling ordination of invertebrate riffle assemblages in Treatment Site 2 showing relationship of samples. Joint plots shown in red are variables that explained more that 40% variability (r2 > 0.4) along axes 1 or 2. D div = Diptera Diversity, E div = Ephemeroptera diversity.
71

0
100
200
300
400
500
600
700
13 Oct 2004 19 Oct 2004 8 Nov 2004 10 Nov 20040
1
2
3
4
5
6
7
8
9
10Drift DensityHBI
0
2000
4000
6000
8000
10000
12000
14000
16000
18000
14 Aug2002
4 Dec2002
5 May2003
1 Oct2003
31 Jan2004
13 Oct2004
19 Nov2004
14 Dec2004
17 Mar2005
0
1
2
3
4
5
6
7
8
9
10DensityHBI
0
20000
40000
60000
80000
100000
120000
14 Aug2002
4 Dec2002
5 May2003
1 Oct2003
31 Jan2004
13 Oct2004
19 Nov2004
14 Dec2004
17 Mar2005
0
1
2
3
4
5
6
7
8
9
10DensityHBI
Den
sity
(ind
ivid
uals
/m2 )
Drif
t Den
sity
(ind
ivid
uals
/100
m3 H
2O)
Hils
enho
ff B
iotic
Inde
x (H
BI)
A. Drift
B. Riffles
C. Pools
Trt 1 Trt 2
Trt 1 Trt 2
Trt 1 Trt 2
Figure 7. Mean drift, benthos densities and HBI in Control Site. A (top) is drift and HBI before and during treatments. B (middle) is densities and HBI in riffles before and after treatments. C (bottom) densities and HBI in pools before and after treatments. Treatments are indicated by red arrows. Bars = 1SE.
72

Evidence of rapid responses by macroinvertebrate communities to restored flow in a
previously regulated river.
Eric C. Dinger1,2 and J.C. Marks1
1Merriam-Powell Center for Ecological Research, Department of Biology, Northern
Arizona University, Box 5640, Flagstaff, AZ 86011, USA
2Current Address: National Aquatic Monitoring Center, Department of Watershed
Science, 5210 Old Main Hill, Logan, UT 84322, USA
73

Abstract Although stream restoration programs are increasing, relatively few have
associated monitoring programs to evaluate success of the project. Here, we studied the
effects of flow restoration on the macroinvertebrates of Fossil Creek, a central Arizona
stream that had flow diversion for the past 100+ years. Fossil Creek is a spring-fed,
travertine stream with a small diversion dam scheduled for decommissioning. As part of
a multi-faceted restoration project, flows were restored in June 2005. We collected 3
years of pre-restoration data and 15 months of post-restoration data. Our pre-restoration
data suggested that patterns in travertine deposition were a major factor in determining
macroinvertebrate assemblages. Following restoration, there was no detectable change in
macroinvertebrate density or diversity in restored sites. However, macroinvertebrate
assemblages in restored sites all showed significant shifts using non-metric multi-
dimensional scaling – whereas there were no shifts in control sites. In particular, the site
immediately below the dam shifted to resemble our control sites (relatively pristine, with
no history of flow diversion) suggesting that increased flow is now an important
determinant of assemblage composition. Other changes were driven by changes in
densities of filter-feeding organisms, primarily Hydropsyche (Trichoptera:
Hydropsychidae) and Simulium (Diptera: Simuliidae). We suggest that this is a response
to changing flow and travertine deposition patterns associated with restoration. We
conclude that macroinvertebrate communities can show rapid changes associated with
stream restoration activities, despite a century of flow regulation. Long-term effects,
however, will likely be a result of long-term trends in changing geomorphology and
biogeochemistry associated with travertine deposition.
74

Introduction
Streams and rivers are dynamic ecosystems that recover quickly from
disturbances through a self-cleaning property associated with unidirectional, constantly
flushing flow (Hynes 1970). Hence, steams are widely considered to be systems with a
high potential for restoration after short and long-term disturbances (Allan 1995) and
successful restoration creates naturally resilient systems (Palmer et al. 2005). Restoration
programs for streams have been increasing in recent years, and have taken many different
forms (e.g. exotic species removal, clean water programs, riparian reparation, etc.).
Despite this, few studies have reported on the success of stream restoration programs or
have associated long-term monitoring to detect success (Niemi et al. 1990, Bernhardt et
al. 2005). Over 1 billion dollars are spent annually on stream restoration projects in the
US, with fewer than 10% having associated monitoring programs to document successes
and failures (Bernhardt et al 2005).
Dams and the associated flow diversions are attractive subjects for stream
restoration projects. The effects of dams and flow alterations on the aquatic communities
are well understood (e.g. Power et al. 1996, Cortes et al. 1998, Vinson 2001, Greathouse
et al. 2006). By altering physical parameters (especially flow) and disrupting the
upstream/downstream connectivity of the river, invertebrate assemblages below dams
often experience local extirpation of sensitive species and greatly reduced diversities
(Vinson 2001, Greathouse et al. 2006). However, in the case of small diversion dams,
these effects may be mitigated or erased by flow restoration. Rivers with smaller dams,
which comprise the majority of dams in the United States, are candidates for restoration
success for 2 primary reasons. First, the higher number and old age of many of them
75

make them likely sites to be decommissioned (Heinz Center 2002). Second, because
ecological impacts associated with smaller dams are likely to be less severe than larger
dams communities may be able to return to pre-disturbed states. (Thomson et al. 2005).
Many of these small dams are run-of-the-river dams, meaning that excess flows discharge
over the dams. The overflow helps maintain river connectivity and allows upstream
allochthonous material to be supplied downstream, helping to maintain the natural
processing of organic material, as in the River Continuum Concept (Vannote et al. 1980)
and not the Serial Discontinuum Concept (Ward and Stanford 1983). Reservoir sizes
behind these dams are smaller; increasing the likelihood that upstream migration of
terrestrial stages of aquatic macroinvertebrates is uninhibited. Also, without a large
reservoir there is no release of cold hypolimnetic water that often is responsible for large-
scale changes in the aquatic macroinvertebrate assemblages (e.g. Vinson 2001). Finally,
without the storage capacity of large reservoirs, the natural hydrograph is more likely to
be maintained, although with water diversions the baseflow is typically greatly reduced.
In this study, we report on the effects of flow restoration to aquatic invertebrates
in a travertine forming, central Arizona stream that had water diverted for the past 100
years. A small dam (6 m tall) had diverted water into a flume network for hydropower
generation at a series of 2 small, downstream generating plants. The diversion had large
impacts not only on the flow regime of the river, but radically changed the
geomorphology of the river by redistributing the deposition of travertine in the stream
(Malusa et al. 2003, Marks et al. 2006). Travertine has major effects on invertebrate
assemblages (Minckley 1963), and the historic redistributing of travertine presumably
altered the invertebrate assemblages. In June 2005 flow was restored throughout Fossil
76

Creek as part of a dam decommissioning. The diversion dam was left in place and will
likely be lowered or removed in 2009. This decoupling of flow restoration and dam
removal allowed us to independently study the effects of increased flow on
macroinvertebrate communities.
In response to flow restoration, we expected to see short-term increases (just over
1 yr) in diversity but no change in densities at restored sites. Our reasoning for this is
based on several factors. First, although there may be initial decreases in both diversity
and density caused by the disturbance of restoration activities we expect this to be short-
lived (weeks to months) because of rapid colonization. Southwest invertebrates are
typically multi-voltine, having many generations in a single year – often as quick as two
wks for Baetis sp. (Ephemeroptera: Baetidae) (Gray 1981), a prevalent mayfly in Fossil
Creek. Hence, any disturbance-caused declines could be quickly overcome with
surviving colonists from affected sites, or from new colonists in unaffected upstream
sites. Second, because there is no sediment plug behind a dam associated with flow
restoration, we do not expect any large smothering or sediment pollution associated with
this particular event. Third, flow restoration will create a large amount of new habitat –
increasing habitat availability, allowing for new microhabitats, and affording opportunity
for new species of macroinvertebrates to colonize newly created habitats. We expect the
new habitat to increase the overall number of invertebrates, but individuals per square
area should be unaffected. Lastly, increased connectivity of the headwaters with the
lower reaches should assist in downstream transport of invertebrates and resources –
which should help increase diversity. However, we also expect species composition to
77

change as a result of increased nutrient supply, changing flow conditions, and increased
downstream sediment transport from the headwater reach following restoration.
We expect long-term effects (5+ years) of restoration to be manifested not only by
the above short-term effects, but also by the changing travertine geomorphology. The
redistribution of travertine in Fossil Creek should reinforce and enlarge the travertine
dams immediately below the diversion dam, and increase the distribution of travertine
dams. Previous locations that may have been characterized by cobble substrate may be
transformed into travertine dam/pools, and hence alter the macroinvertebrate habitat and
assemblage.
Methods
Study Site
Fossil Creek is a perennial, travertine depositing spring-fed stream originating
from a layer of Mississippian Naco Limestone along the Mogollon rim in central Arizona
(Fig. 1). Baseflow from the springs are typically 1,218 L s-1, but the majority of the
water was diverted into a flume at the dam, less than 1 km from the spring source. At a
powerplant mid-way down the stream, a portion of the water was returned, creating 3
distinct flow regimes: 1) unaltered, full flow above the diversion dam, 2) seepage flows
of about 5.6 L s-1 below the diversion dam, and 3) increased flows of 56.6 L s-1 just
below the mid-way power plant.
We choose 6 sampling sites prior to restoration to encompass the range of flow
and travertine deposition (Table 1). Two of these were above the dam upstream of the
small reservoir, 2 were in the seepage zone, and the last 2 were below the power plant
where 56.6 L s-1 was returned to the streambed. Despite high concentrations of Ca2+ and
78

HCO3-, the sites above the diversion dam (Control Sites 1 and 2) do not exhibit travertine
deposition because they are supersaturated with CO2. The relatively low gradient and
mostly laminar flow of the control sites limit the off-gassing of CO2. Below the diversion
dam (Restored Site 1), travertine deposition began and created a series of small travertine
dams (Fig. 2), creating a travertine dam/pool series where the dams formed steep,
shallow cascades. This section was fed by seepage flows, and at the point just above the
mid-way power plant, much of the Ca2+ and HCO3- had been deposited as CaCO3 so that
there was just a slight amount of travertine deposition (Restored Site 2). Below the
power plant, a portion of flume water (~56.6 L s-1) was returned to the stream channel
after being used to generate power. This return of water introduced a new source of
water supersaturated with respect to CaCO3 renewed the deposition of travertine, and
created a new series of travertine dams (Restored Site 3). By the time this water had
reached the furthest downstream site (Restored Site 4), CaCO3 supersaturation levels had
again dropped so that substrate was armored by low rates of travertine precipitation
which creates coatings but there was no travertine dam formation.
Fossil Creek Restoration
A collaborative effort of many government and non-government agencies (e.g.
Fish and Wildlife Service, National Forest Service, Arizona Game and Fish, Bureau of
Reclamation, Arizona Public Service, and Northern Arizona University) pursued the
restoration of Fossil Creek in 2 primary ways: 1) Fish repatriation and 2) Flow
restoration.
Prior to flow restoration, fish repatriation was conducted in the fall of 2004 by
installing a fish barrier in the lower reaches of Fossil Creek, salvaging available native
79

fish, eradicating non-natives with the piscicide antimycin A, and reintroducing the native
fish. Effects of the antimycin A treatments on aquatic invertebrates are covered in detail
elsewhere (Dinger and Marks, in revision), but was characterized by short term decreases
in density and diversity at affected sites, although invertebrates densities had recovered
within 5 months, and diversity was increasing by March 2005 (Dinger and Marks, in
revision).
Flow into the flume was shut off on 18 June 2005, and full flow was returned to
Fossil Creek.
Invertebrate sampling
Invertebrates were haphazardly sampled with 5 replicate Surber samples (250 µm
mesh size, 0.093 m2) at each sampling site and period. Substrate was agitated and
scrubbed, and in the case of travertine areas, a screwdriver was used to assist in the
breakup of armored substrate. Agitation and scrubbing was continued until all substrate
was affected. Samples were transferred to a 5 g bucket, and elutriated to separate
invertebrates from inorganic substrate. The remaining substrate was scanned for snails
and stone-cased Trichoptera. Samples were then filtered through a fine-aquarium net
(100 µm), and preserved in 95% ethanol.
Invertebrates were sorted from associated debris and detritus under low power
magnification, and enumerated and identified to the lowest practical level (except
Chironomidae which was left at family) using standard taxonomic references (e.g.
Pennak 1989, Thorp and Covich 1991, Merritt and Cummins 1996, Wiggins 1996).
Invertebrate collections for this study started in August 2002 and continued in
December 2002, May 2003, October 2003, January 2004, March 2005, September 2005,
80

and August 2006. During the fall and winter of 2004, we focused sampling efforts on
examining the effects of the fish renovation project with antimycin A (Dinger and Marks,
in revision).
Data analyses
Non-metric Multidimensional Scaling (NMS) ordinations were used to examine
patterns and shifts in invertebrate assemblages. Invertebrate densities were standardized
to species maximum to equalize the importance of each taxon, and converted to a
similarity matrix using the Bray-Curtis similarity index in the computer program
PRIMER 5 (version 5.2.8) prior to NMS ordination. Significance of grouping was then
tested using the ANOSIM routine in PRIMER. ANOSIM is a permutation-based
hypothesis test that tests for differences between a priori groups using Bray-Curtis
dissimilarity measures. In ANOSIM, the R-value is a measure of grouping strength, with
a value of 1 indicating strong separation and a value of 0 indicating no separation. Where
there were significant differences, we used the SIMPER routine to examine the species
contributing to the observed group differences. This routine calculates the percent
contribution of each species to the dissimilarity observed between the groups. Lastly, to
understand which species are driving overall patterns, we used the PRIMER routine
BVSTEP, which is a step wise procedure based on rank correlations to find the most
“influential” species driving observed patterns in ordinations. Taken together, these 4
analyses offer a robust method of examining ecological data.
Effects of flow restoration on invertebrate densities (log x +1 transformed) and
species richness were analyzed using a Before-After/Control-Impact Analysis of
Variance (BACI ANOVA). In this model, sites above the dam served as control sites
81

unaffected by flow restoration, whereas sites below the dam were impact sites. The
significance of flow restoration is determined by the significance of the interaction term
(Green 1979).
Results
Data from pre-restoration samples showed that there were distinct groupings
based on the amount of travertine deposition (Fig 3.) ANOSIM analysis showed that all
groups were significantly different. Sites with no travertine (Control Sites 1 and 2) were
significantly different from both travertine dam sites (Restored Sites 1 and 3) (R = 0.599,
p = 0.001) and from moderate travertine (R = 0.503, p = 0.001). Sites with moderate
amounts of travertine were significantly different from sites with travertine dams (p =
0.001), but the effect size (R = 0.07) was small, indicating substantial overlap in these
assemblages.
Our pre-restoration data did indicate that downstream sites (to be Restored Sites)
had similar levels of density and diversity as pristine, upstream sites (Control Sites).
Following restoration, there was no discernable pattern on either density or species
richness, in either the Control or Restored Sites (Fig. 4). There was a significant effect of
date (before vs. after) on the density data, but the test for flow restoration effects using
the interaction term was non-significant (Table 2).
Following our predictions, all of the restored sites had significantly different
invertebrate assemblages following flow restoration (Table 3). Likewise, the control sites
did not show any shift in species assemblage (Table 3, Fig. 4). Using R-values as a
measure of strength of change, the site that changed the most was the Restored Site 1
with a value of 0.455, with the ordination showing distinct grouping (Fig. 5). Other sites
82

showed interesting patterns, such as the Restored Site 2, which had distinct post-
restoration grouping, but had one set of samples (September 2005) at the right side of the
graph, and August 2006 samples forming another distinct group on the left side, with pre-
restoration samples in between (Fig. 6). As shown using the ANOSIM R-values, the
changes in the last 2 Restored Sites (3 and 4) were not as strong, but still distinct (Fig. 7).
The species responsible for observed differences using SIMPER were generally
the same in most cases: Simulium (Diptera: Simuliidae), Hydropsyche (Trichoptera:
Hydropsychidae), Baetis sp., Chironomidae (Diptera) (Table 2). However, the direction
of change in these species was not consistent among sites: Simulium decreased in the
Restored Sites 1 and 2, but increased in the Restored Site 3. Similarly, Hydropsyche
decreased in the Restored Site 3, but increased Restored Site 4.
To understand the context of the changing downstream sites, we performed a
follow-up ordination using all sampling sites. To reduce noise in the ordination (of 240
samples), we composited the 5 replicate surber samples from each date into a single,
composite sample. This ordination shows the similarity of the Control sites, pre and post
restoration, and highlights the differences of the other sites (Fig. 6). In particular, the site
directly below the dam (Restored Site 1) has shifted post-restoration to resemble the
Control Sites, towards the left side of the plot. The other sites, however, were shifted to
the right. Using BVSTEP, 5 taxa were the most influential for the ordination pattern in
Figure 8 – Chironomidae, Baetis, Elmidae (Coleoptera), Simulium, and Thraulodes
(Ephemeroptera: Leptophlebiidae).
83

Discussion
The aquatic macroinvertebrates of Fossil Creek responded rapidly to flow
restoration, although there was no change in either average densities or diversity.
Instead, the response was made of species shifts in restored sites. Although diversity in
Fossil Creek was not increased by flow restoration, other studies on diversity have
yielded mixed results. Some studies show higher diversity in non-regulated reaches
relative to regulated reaches (Munn and Brusven 1991) whereas others suggest that there
is no relationship between diversity and the degree of regulation or number of diversions
(e.g. Collier 2002, Marchant and Hehir 2002). Our results show that despite shifts in
community composition, diversity did not increase as predicted with restoration of flows.
This is consistent however, with our pre-restoration observations where neither diversity
nor abundance in the relatively pristine sites above the diversion dam were higher relative
to the disturbed sites. During several sampling periods, the highest diversity was found
in the low flow, travertine dam sites. Since diversity was already high in these regulated
sites, it is not surprising that flow regulation did not, as yet, further increase diversity in
the restored sites.
In just slightly more than a year after flow restoration, the invertebrate
assemblages in Fossil Creek are already showing significant responses. Firstly, the site
immediately below the dam started to resemble the unchanged sites above the dam. The
puzzling aspect is that our perception of the dominant substrate in this reach has not
changed – travertine dams are still actively forming. Our pre-restoration data had
demonstrated strong differences in invertebrate assemblages depending on travertine
deposition (Fig. 3). Hence, we suggest that in this site, the controlling factor of
84

macroinvertebrates shifted: from travertine towards flow. This could be caused by 2
factors: 1) Increased connectivity has increased upstream invertebrates dispersal,
allowing them to inhabit previously unavailable lower reaches, and/or 2) the importance
of flow in determining assemblages now outweighs the import of travertine. The effects
of flow on aquatic invertebrates are complex, but well studied (Hynes 1970, Allan 1995).
Effects of flow on the availability of invertebrate habitat (e.g. Minshall 1984), flow
effects on primary production (e.g. Keithan and Lowe 1985), nutrient supply,
evolutionary adaptations (e.g. Hynes 1970), feeding mechanisms (Cummins 1974),
microdistribution of invertebrates (Statzner 1981), dispersal ability of invertebrates
(Elliott 1971) etc. have all been studied, but the effects of travertine on invertebrates are
still poorly studied (Minshall 1984).
Secondly, invertebrates downstream also appear to be changing in response to
flow restoration, a shift that appears to be mostly made up of changing densities of
Simulium and Chironomidae midges. Two downstream sites were also marked by an
increase in Hydropsyche caddisflies densities, (Restored Site 1 and 4). Increases in
Simulium were often offset by decreases in Hydropsyche, and vice versa. These 2 taxa
compete for the same space and resources (Hemphill and Cooper 1983, Hemphill 1988).
We hypothesize that the changes in the 2 taxa are due to interacting effects of changes in
travertine deposition and flow. Our observation prior to flow restoration is that
Hydropsyche benefited from travertine deposition in reinforcement of their silken capture
nets, used for filter-feeding. This reinforcement would help the net to withstand
increased velocities, considering that Hydropsychidae caddisflies are commonly
relegated to slower velocities (Hemphill and Cooper, 1983). Increased flows, along with
85

reduced travertine deposition might give Simulium larvae the advantage in this situation –
especially since Simulium is the more competitive in higher flows (Hemphill 1988). In
the site with increased flows, but also increasing travertine, the Restored Site 1,
Hydropsyche became more dominant. In the site with increased flows, but decreased
travertine (the Below Power Plant site), Simulium became the more abundant. Both of
these observations are consistent with our suggestion that both flow and travertine are
determining the outcomes of Hydropsyche and Simulium competition.
Changes in flow might be particularly important to both Simulium and
Hydropsyche since they are filter-feeders, requiring flow to transport processed detritus
downstream to lower river habitats (Cummins 1974). As predicted by the River
Continuum Concept (Vannote et al. 1980), re-establishing connectivity between
headwaters and lower stream reaches would result in increasing fine-particulate organic
matter downstream. This is despite the continued presence of reservoir behind the
diversion dam, which still acts to trap much of the suspend sediments prior to overflow.
Reestablishing this connectivity is especially relevant because one of the few large
shredding organisms of Fossil Creek, the caddisfly Phylloicus sp. (Trichoptera:
Calamoceratidae) is abundant in the Control Sites (although infrequently represented in
our samples owing to a preferred habitat in unsampled pools and side channels). Hence,
restoring flow connectivity between the small headwater reach (less than 1 km) and
downstream sites increased available resources for filter-feeders downstream.
Lastly, we did not observe any decrease in invertebrate density following flow
restoration. In the available flow restoration literature, a common theme is that both
invertebrate diversity and density decrease following restored flows (e.g. Bednarek
86

2001). The important difference is that in all of these examples, the dam was also
removed as part of stream restoration – releasing the reservoir sediment plug. This
follows the findings of Thomson et al. (2005) who observed that densities declined only
with the removal of a Pennsylvania dam, and not with an initial partial removal. In Fossil
Creek the dam has so far been left intact, but managers will likely remove a portion or all
of it. Hence, the potential for sediment to temporarily decrease the invertebrate densities
and diversity still exists for Fossil Creek, although dam removal studies have shown this
decrease to be short-lived (Bednarek 2001, Stanely and Doyle 2003), the process of
leaching stored nutrients and transporting sediments out of the system could last a
number of years (Ahern and Dahlgren 2005).
Long-term changes to the invertebrates will also depend on the changing
geomorphology of Fossil Creek. Even though the amount of travertine depositing in
different reaches has been altered, the relics of 100+ years of flow alteration have not
changed. For example, in the Restored Site 3 reach there are still large, remnant dams,
although they are no longer forming as they used to. In time, these may break down due
to flooding or other disturbance, eventually restoring the original, pre-dam
geomorphology, effectively changing the invertebrate habitat. Future changes will also
depend on the whole or partial removal of the diversion dam. Currently the reservoir
behind the dam still serves as a sediment trap, allowing suspended sediments to settle.
Although we believe that the restoration of flows have so far allowed for an increase in
downstream transport of these particles, removal of the dam will further enhance food
resources for downstream filter-feeders.
87

These results show that aquatic communities can respond quickly to restoration.
Although it is too early to document the long term changes caused by restoration this data
shows how responsive macroinvertebrates can be. Depending on both invertebrate
colonization rates and the changing travertine geomorphology of Fossil Creek, it will
require long-term (5+ years) of monitoring until the effects are known.
Literature Cited Ahern, D.S. and R.A. Dahlgren. 2005. Sediment and nutrient dynamics following a low-
head dam removal at Murphy Creek, California. Limnology and Oceanography 50:1752-1762.
Allan, J.D. 1995. Stream ecology: Structure and function of running waters. Chapman and Hall. New York, New York.
Bednarek, A. 2001. Undamming rivers: A review of the ecological impacts of dam
removal. Environmental Management 27:803-814. Bernhardt, E.S., Palmer, M.A., Allan, J.D., Alexander, G., Barnas, K., Brooks, S., Carr,
J., Clayton, S., Dahm, C., Follstad-Shah, J., Galat, D., Gloss, S., Goodwin, P., Hart, D., Hassett, B., Jenkinson, R., Katz, S., Kondolf, G.M., Lake, P.S., Lave, R., Meyer, J.L., O’Donnell, T.K., Pagano, L., Powell, B., and E. Sudduth. 2005. Synthesizing U.S. river restoration efforts. Science 308:636-637.
Collier, K.J. 2002. Effects of flow regulation and sediment flushing on instream habitat
and benthic invertebrates in a New Zealand river influenced by a volcanic eruption. River Research and Applications 18:213-226.
Cortes, R.M.V., Ferreira, M.T., Oliveria, S.V. and F. Godinho. 1998. Contrasting impact
of small dams on the macroinvertebrates of two Iberian mountain rivers. Hydrobiologia 389:51-61.
Cummins, K.W. 1974. Trophic relations of aquatic insects. Annual Review of
Entomology 18:183-206.
Dinger, E.C. and J.C. Marks, in revision. Antimycin A affects macroinvertebrates: mortality and recovery. North American Journal of Fisheries Management.
Elliott, J.M., 1971. The distances traveled by drifting invertebrates in a Lake District
stream. Oecologia 6: 191-220.
88

Gray, L.J. 1981. Species composition and life histories of aquatic insects in a lowland sonoran desert stream. The American Midland Naturalist 106(2):229-242.
Greathouse, E.A., C.M. Pringle, W.H. McDowell, and J.G. Holmquist. 2006. Indirect
upstream effects of dams: Consequences of migratory consumer extirpations in Puerto Rico. Ecological Applications 16(1):339-352.
Green, R.H. 1979. Sampling design and statistical methods for environmental biologists.
Wiley and Sons, New York, NY. Hairston, N.G., F.E. Smith, and L.D. Slobodkin. 1960. Community structure, population
control and competition. American Naturalist 94:421-425. Heinz Center, Graf, W. (Chair). 2002. Dam removal: Science and decision making. The
H. John Heinz III Center of Science, Economics and the Environment. Washington, D.C.
Hemphill, N. 1988. Competition between two stream dwelling filter-feeders,
Hydropsyche oslari, and Simulium virgatum. Oecologia 77: 73-80. Hemphill, N. and S.D. Cooper. 1983. The effect of physical disturbance on the relative
abundance of two filter-feeding insects in a small stream. Oecologia 58: 378-382. Hynes, H.B.N. 1970. The ecology of running waters. University of Toronto Press.
Toronto. Keithan, E.D. and R.L. Lowe. 1985. Primary productivity and spatial structure of
phytolithic growth in streams in the Great Smokey Mountains National Park, Tennessee. Hydrobiologia 123: 59-67.
Malusa, J., Overby, S.T. and R.A. Parnell. 2003. Potential for travertine formation:
Fossil Creek, Arizona. Applied Geochemistry 18:1081-1093. Marchant, R. and G. Hehir. 2002. The use of AUSRIVAS predictive models to assess
the response of lotic macroinvertebrates to dams in south-east Australia. Freshwater Biology 47: 1033-1050.
Marks, J.C., Parnell, R., Carter, C., Dinger, E.C., G.A. Haden. 2006. Interactions
between geomorphology and ecosystem processes in travertine streams – implications for dam decommissioning in Fossil Creek, Arizona. Geomorphology 77: 299-307.
Merritt, R.W., and K.W. Cummins, editors. 1996. An Introduction to the Aquatic
Insects of North America. 3rd ed. Kendall/Hunt Publishing Company. Dubuque, Iowa.
89

Minckley, W.L. 1963. The ecology of a spring stream: Doe Run, Meade County, Kentucky. Wildlife Monographs 11: 1-124.
Minshall, G.W. 1984. Aquatic insect-substratum relationships. In The ecology of
aquatic insects. Eds. Resh and Rosenberg. Praeger Publishers, New York. pp. 358-400.
Munn, M.D. and M.A. Brusven. 1991. Benthic macroinvertebrate communities in nonregulated and regulated waters of the Clearwater River, Idaho, USA. Regulated Rivers: Research and Management: 6: 1-11.
Niemi, G.J., P. DeVore, N. Detenbeck, D. Taylor, A. Lima, J. Pastor, J.D. Yount, and
R.J. Naiman. 1990. Overview of case studies on recovery of aquatic systems from disturbance. Environmental Management 14: 571-587.
Palmer, M.A., E.S. Bernhardt, J.D. Allan, P.S. Lake, G. Alexander, S. Brooks, J. Carr, S.
Clayton, C.N. Dahm, J. Follstad Shah, D.L. Galat, S. Gloss, P. Goodwin, D.D. Hart, B. Hassett, R. Jenkinson, G.M. Kondolf, R. Lave, J.L. Meyer, T.K. O’Donnell, L. Pagano and E. Sudduth. 2005. Standards for ecologically successful river restoration. Journal of Applied Ecology 42: 208-217.
Pennak, R.W. 1989. Freshwater Invertebrates of the United States. 3rd ed. John Wiley
and Sons, Inc. New York, New York. Power, M.E., Dietrich, W.E. and J.C. Finlay. 1996. Dams and downstream aquatic
biodiversity: Potential food web consequences of hydrologic and geomorphic change. Environmental Management 20(6): 887-895.
Stanley, E.H. and M.W. Doyle. 2003. Trading off: the ecological effects of dam
removal. Frontiers in Ecology and Environment 1:15-22. Statzner, B. 1981. The relation between “hydraulic stress” and microdistribution of
benthic macroinvertebrates in a lowland running water system, the Schierenseebrooks (North Germany). Archiv fur Hydrobiologie 91: 192-218.
Thomson, J.R., D.D. Hart, D.F. Charles, T.L. Nightengale, and D.M. Winter. 2005.
Effects of removal of a small dam on downstream macroinvertebrae and algal assemblages in a Pennsylvania stream. Journal of the North American Benthological Society 24:192-207.
Thorp, J.H. and A.P. Covich, editors. 1991. Ecology and Classification of North
American Freshwater Invertebrates. Academic Press, Inc. San Diego, California. Vannote, R.L., G.W. Minshall, K.W. Cummins, J.R. Sedell, and C.E. Cushing. 1980.
The river continuum concept. Canadian Journal of Fisheries and Aquatic Sciences 37:130-137.
90

Vinson, M.R. 2001. Long-term dynamics of an invertebrate assemblage downstream
from a large dam. Ecological Applications 11:711-730. Ward, J.V. and J.A. Stanford. 1983. The serial discontinuity concept of lotic
ecosystems. In Dynamics of lotic ecosystems, Fontaine, T.D. and S.M. Bartell (editors). Ann Arbor Science, Ann Arbor, Michigan. Pages 29-42.
Wiggins, G.B. 1996. Larvae of the North American caddisfly genera (Trichoptera). 2nd
ed. University of Toronto Press. Toronto, Canada.
91

92
Table 1. Sample site characteristics and hypothesized changes for invertebrate assemblages in Fossil Creek, Arizona. Note that after restoration flows are 1,218 L s-1 for all sites.
Site
Approx. Distance
Downstream (km)
Flows before
Restoration (L s-1)
Travertine Deposition
Pre Restoration
Predicted Travertine Deposition
Post Restoration
Change Predicted?
Control Site 1 0 1,218 None None No
Control Site 2 0.25 1,218 None None No
Restored Site 1 0.5 5.6 Active Dams Active Dams Yes
Restored Site 2 6.5 5.6 Slight Active Dams Yes
Restored Site 3 7 56.6 Active Dams Armoring Yes
Restored Site 4 16 56.6 Armoring Slight Yes
Table 2. BACI ANOVA results for density and species richness. p-values in bold are significant at α = 0.05. Density Species Richness df Mean SS F Ratio p-value Mean SS F Ratio p-valueDate (i.e. Before/After) 1 1.636 6.8552 0.0095 0.571 0.0265 0.8708Location (i.e. Above/Below) 1 0.564 2.3612 0.1259 25.459 1.1801 0.2786Date X Location 1 0.500 2.0961 0.1492 60.240 2.7923 0.0962Residual 206 0.239 21.574
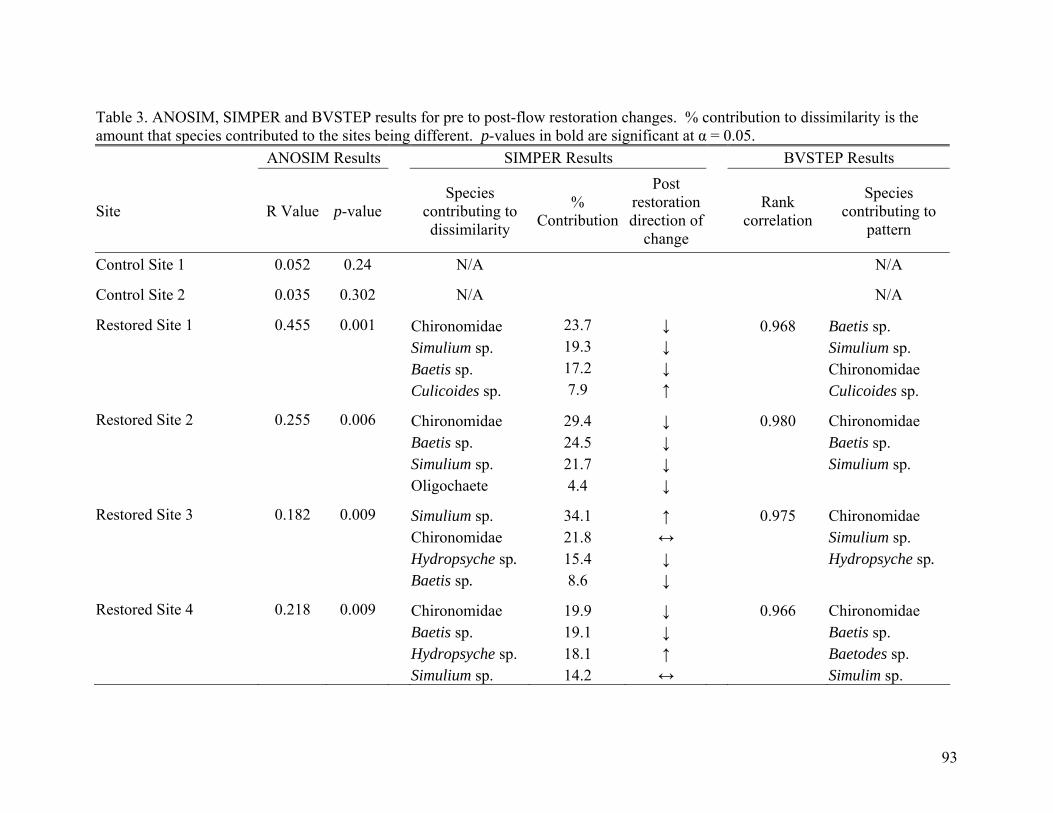
93
Table 3. ANOSIM, SIMPER and BVSTEP results for pre to post-flow restoration changes. % contribution to dissimilarity is the amount that species contributed to the sites being different. p-values in bold are significant at α = 0.05. ANOSIM Results SIMPER Results BVSTEP Results
Site R Value p-value Species
contributing to dissimilarity
% Contribution
Post restoration direction of
change
Rank correlation
Species contributing to
pattern
Control Site 1 0.052 0.24 N/A N/A
Control Site 2 0.035 0.302 N/A
N/A
Restored Site 1
0.455 0.001 Chironomidae
23.7 ↓ 0.968 Baetis sp. Simulium sp. 19.3 ↓ Simulium sp. Baetis sp. 17.2 ↓ Chironomidae Culicoides sp. 7.9 ↑ Culicoides sp.
Restored Site 2
0.255 0.006 Chironomidae
29.4 ↓ 0.980 Chironomidae Baetis sp. 24.5 ↓ Baetis sp. Simulium sp.
21.7 ↓ Simulium sp.
Oligochaete 4.4 ↓
Restored Site 3
0.182 0.009 Simulium sp. 34.1 ↑ 0.975
Chironomidae Chironomidae 21.8 ↔ Simulium sp. Hydropsyche sp.
15.4 ↓ Hydropsyche sp.
Baetis sp. 8.6 ↓
Restored Site 4 0.218 0.009 Chironomidae 19.9 ↓ 0.966
Chironomidae Baetis sp. 19.1 ↓ Baetis sp. Hydropsyche sp. 18.1 ↑ Baetodes sp. Simulium sp. 14.2 ↔ Simulim sp.

Figure 1. Map showing physical and cultural aspects of the Fossil Creek watershed. Green arrows indicate sampling site locations
94
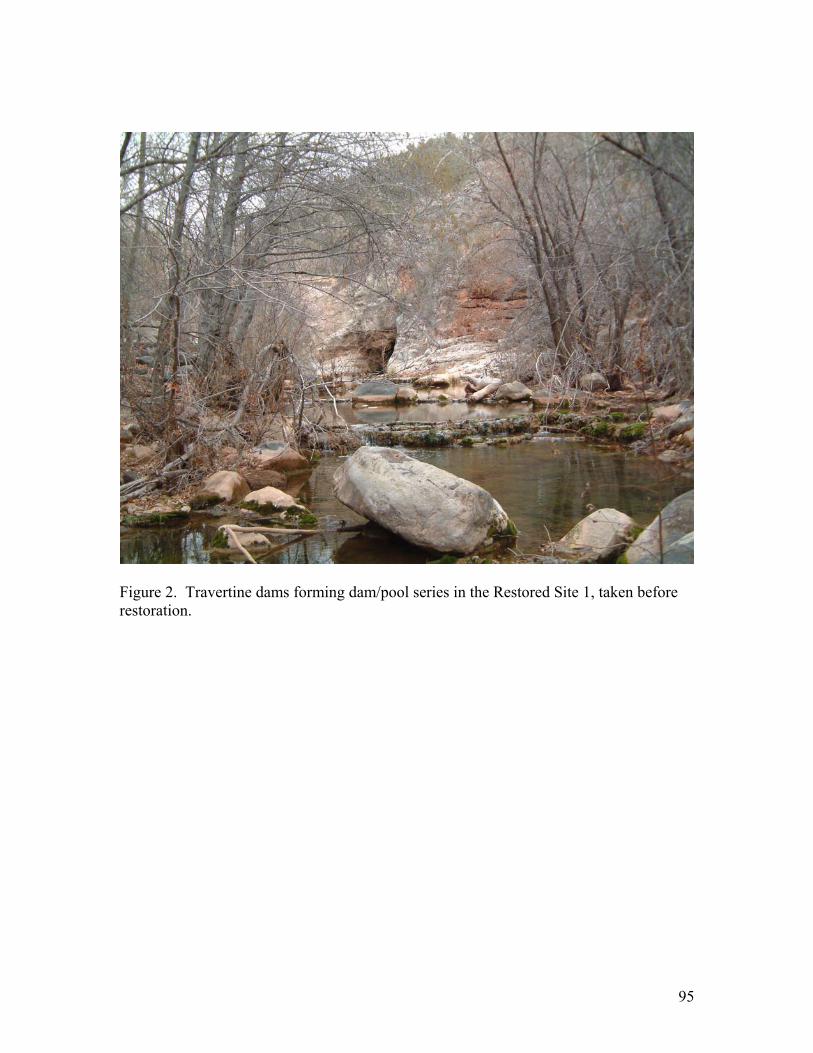
Figure 2. Travertine dams forming dam/pool series in the Restored Site 1, taken before restoration.
95

None
Moderate
Dams
Stress: 0.19
Figure 3. NMS ordination of pre-restoration data showing influence of travertine on invertebrate assemblages. Symbols indicate amount of travertine deposition for each sample: None = Control Sites 1 and 2, Moderate = Restored Sites 2 and 4, Dams = Restored Sites 1 and 3.
96

Jan Jul Jan Jul Jan Jul Jan Jul Jan Jul Jan Ave
rage
Inve
rtebr
ate
Den
sity
(ind
ivid
uals
m-2
)
0
2000
4000
6000
8000
10000Control sitesRestored sites
2002 2003 2004 2005 2006
Flow Restoration
Jan Jul Jan Jul Jan Jul Jan Jul Jan Jul Jan
Ave
rage
Spe
cies
Ric
hnes
s
0
2
4
6
8
10
12
14
16
18Control sitesRestored sites
2002 2003 2004 2005 2006
Flow Restoration
Figure 4. Average aquatic invertebrate densities (Top) and Species Richness (Bottom) for Control sites (Black circles) and Restored sites (white circles). Red line indicates date of flow restoration
97

Control Site 1
Before
After
Stress: 0.16
Control Site 2
Before
After
Stress: 0.14
Figure 5. MDS ordinations of Control Site 1 (Top) and Control Site 2 (Bottom) invertebrate assemblages. ANOSIM analyses did not reveal significant differences following restoration at either of these sites.
98

Restored Site 1
Before
After
Stress: 0.14
Restored Site 2
Before
After
Stress: 0.1
Figure 6. MDS ordinations of Restored Site 1 (Top) and Restored Site 2 (Bottom) invertebrate assemblages. ANOSIM analyses indicate significantly different invertebrate assemblages before and after flow restoration.
99

100
Restored Site 3
Before
After
Stress: 0.11
Restored Site 4
Before
After
Stress: 0.17
Figure 7. MDS ordinations of Restored Site 3 (Top) and Restored Site 4 (Bottom) invertebrate assemblages. ANOSIM analyses indicate significantly different invertebrate assemblages before and after flow restoration.

CS 1 Before CS 1 After
CS 2 Before CS 2 After
RS 1 Before RS 1 After
RS 2 Before RS 2 After
RS 3 Before RS 3 After
RS 4 Before RS 4 After
Stress: 0.15
101
Figure 8. NMS ordination of composited samples for each sampling date. CS = Control Sites, RS = Restored Sites.

Appendix 1. Taxa list and numbers collected in all 6 sites over the course of the study. Control
Site 1 Control Site 2
Restored Site 1
Restored Site 2
Restored Site 3
Restored Site 4
Order Family Genus species Pre Post Pre Post Pre Post Pre Post Pre Post Pre Post
Amphipoda Hyalellidae Hyalella 278 107 0 0 0 0 0 0 1 0 0 0
Annelida Hirudinea Unknown 8 2 0 0 0 0 0 0 0 0 0 0
Annelida Tubificidae Branchiura sowerbyi 0 0 2 0 0 0 125 0 68 3 79 2
Annelida Oligochaete Unknown 373 310 152 25 260 109 620 16 171 207 155 45
Bivalvia Corbiculidae Corbicula 0 0 0 0 0 0 0 1 1 0 2 0
Bivalvia Pisiidae Pisidium 11 1 21 0 10 0 2 0 2 0 2 0
Coleoptera Curclionidae Unknown 0 0 0 0 0 0 0 0 1 0 1 0
Coleoptera Dryopidae Helichus 8 2 1 1 0 0 5 0 1 0 0 0
Coleoptera Dryopidae Postelichius 6 4 0 0 10 6 37 1 5 1 5 1
Coleoptera Dyticidae nr. Agabetes 0 0 0 0 2 0 0 0 0 0 0 0
Coleoptera Dytiscidae Stictotarsus 6 0 0 0 9 0 0 0 0 0 0 0
Coleoptera Dytiscidae Unknown 0 4 0 1 0 0 0 0 0 0 0 0
Coleoptera Dytiscidae Neoclypeodytes 0 4 0 0 0 0 0 0 0 0 0 0
Coleoptera Elmidae Various 1020 704 598 93 136 134 432 10 102 42 198 30
Coleoptera Haliplidae Peltodytes 0 2 0 0 0 0 0 0 0 0 0 0
Coleoptera Haliplidae Haliplus 0 0 0 0 2 0 0 0 0 0 0 0
Coleoptera Hydrophilidae Berosus 0 2 0 1 0 0 3 0 0 0 0 0
Coleoptera Hydrophilidae Laccobius 0 0 0 0 0 0 0 0 0 0 1 0
Coleoptera Hydrophilidae Tropisternus 0 0 1 0 1 0 0 0 0 0 0 0
Coleoptera Lutrochidae Lutrochus 0 0 0 0 0 0 4 0 0 0 96 14
Coleoptera Psephenidae Psephenus 0 0 2 1 0 0 0 0 0 0 0 0
Coleoptera Scirtidae Scirtes 1 0 0 0 0 0 0 0 0 0 0 0
Coleoptera Staphylinidae Unknown 0 1 0 0 0 1 0 0 0 0 0 1
Collembola Unknown Unknown 0 0 0 0 0 0 0 0 0 0 1 0
Decapoda Cambaridae Orconectes 0 0 0 0 0 0 0 0 0 1 0 1
Diptera Ceratopogonidae Bezzia 7 2 20 1 54 4 19 2 4 11 12 0
Diptera Ceratopogonidae Culicoides 7 2 4 6 92 105 65 42 56 24 12 2
Diptera Ceratopogonidae Forciomyia 0 0 0 0 0 0 0 0 1 0 0 0
Diptera Chironomidae Various 1198 125 1813 242 15683 869 10529 695 2508 876 2381 215
Diptera Culicidae Anopheles 1 0 0 0 1 0 0 0 0 0 0 0
Diptera Unknown Unknown 0 0 0 0 0 0 0 1 0 1 1 0
Diptera Dolichopodiae Unknown 0 0 0 0 0 0 0 0 0 7 0 0
Diptera Dixidae Dixa 0 0 0 0 2 0 0 0 0 0 0 0
Diptera Dixidae Dixella 1 0 0 0 1 0 0 0 0 0 0 0
Diptera Empididae Chelifera 0 0 0 0 21 1 15 1 2 1 4 0
Diptera Empididae Clinocera 0 0 0 0 0 0 3 0 0 0 0 0
Diptera Empididae Hemerodromia 0 0 1 0 25 27 12 15 10 15 26 5
102

Control Site 1
Control Site 2
Restored Site 1
Restored Site 2
Restored Site 3
Restored Site 4
Order Family Genus species Pre Post Pre Post Pre Post Pre Post Pre Post Pre Post
Diptera Empididae Unknown 0 0 0 0 0 3 0 0 0 0 0 0
Diptera Muscidae Limnophora 0 0 0 0 2 0 7 0 0 0 0 0
Diptera Psychodidae Pericoma 0 0 0 0 1 0 1 0 7 1 0 0
Diptera Simuliidae Simulium 2 0 150 30 7318 108 9092 1343 4064 3241 639 177
Diptera Stratiomyiidae Caloparyphus 1 0 0 0 39 3 11 42 14 48 5 2
Diptera Stratiomyiidae Euparyphus 0 1 1 0 5 0 2 0 2 2 0 3
Diptera Tabanidae Tabanus 0 0 0 0 1 0 11 1 2 0 2 0
Diptera Tipulidae Antocha 0 0 0 0 1 0 4 0 0 0 0 0
Diptera Tipulidae Dicranota 0 0 0 0 32 0 29 0 0 0 1 0
Diptera Tipulidae Hexatoma 0 0 0 0 0 1 0 0 0 0 0 0
Diptera Tipulidae Molophilus 1 0 0 0 0 18 0 0 0 0 0 0
Diptera Tipulidae Tipula 0 0 0 0 7 0 5 0 10 0 0 0
Diptera Tipulidae Unknown 1 0 0 0 0 0 0 0 0 0 0 0
Ephemeroptera Baetidae Baetis 1310 29 626 354 4328 393 6322 151 909 131 1402 40
Ephemeroptera Baetidae Baetodes 0 1 0 3 149 12 301 33 161 65 486 64
Ephemeroptera Baetidae Callibaetis 10 8 0 5 6 2 45 0 2 0 4 0
Ephemeroptera Baetidae Cameleobaetidius 0 0 0 1 0 0 0 0 0 0 1 0
Ephemeroptera Caenidae Caenis 30 4 91 6 185 9 108 0 0 0 0 0
Ephemeroptera Ephemerellidae Serratella micheneri 0 0 0 0 0 0 1 0 0 0 0 0
Ephemeroptera Heptageniidae Epeorus 0 0 0 0 1 0 0 0 0 0 0 0
Ephemeroptera Heptageniidae Heptagenia 0 0 0 0 0 0 1 0 0 0 0 0
Ephemeroptera Leptohyphidae Leptohypes 0 0 3 0 0 0 5 0 0 0 1 1
Ephemeroptera Leptohyphidae Tricorythodes 836 77 127 81 271 280 43 8 1 5 4 3
Ephemeroptera Leptophebiidae Thraulodes 71 35 584 275 47 10 7 0 0 0 0 0
Gastropoda Ancylidae Ferrissia 0 0 2 0 0 0 0 0 0 0 0 0
Gastropoda Unknown Unknown 0 0 0 0 0 0 19 0 0 0 0 0
Gastropoda Hydrobiidae Pyrgulopsis simplex 86 1 7 4 0 0 20 0 0 0 0 0
Gastropoda Lymnaeidae Fossaria 0 0 0 0 0 0 0 0 0 0 1 0
Gastropoda Physidae Physa 2 0 2 0 6 0 7 0 2 0 1 0
Gastropoda Planorbidae Gyralus 0 0 1 0 1 0 0 0 0 0 0 0
Hemiptera Belostomatidae Belostoma 0 0 0 0 3 0 0 0 0 0 0 0
Hemiptera Gelastocoridae Gelastocoris 0 0 0 0 0 0 0 0 0 0 1 0
Hemiptera Gerridae Gerris 0 0 0 0 0 0 0 0 0 0 1 0
Hemiptera Gerridae Metrobates 0 0 0 0 1 0 0 0 0 0 0 0
Hemiptera Hebridae Hebrus 0 0 0 0 4 0 0 0 0 0 0 0
Hemiptera Naucoridae Ambrysus 17 7 6 7 1 1 0 0 0 0 0 0
Hemiptera Veliidae Mesovelia 0 1 0 0 0 0 0 0 0 0 0 0
103

Control Site 1
Control Site 2
Restored Site 1
Restored Site 2
Restored Site 3
Restored Site 4
Order Family Genus species Pre Post Pre Post Pre Post Pre Post Pre Post Pre Post
Hemiptera Veliidae Microvelia 0 1 0 0 2 0 1 0 0 0 0 0
Hemiptera Rhagovelia 2 1 5 1 37 0 18 Veliidae 6 6 1 7 9
Lepidoptera Pyralidae Petrophila 8 3 48 21 34 89 70 6 166 15 97 16
Megaloptera Corydalidae Corydalus 6 1 13 21 16 53 58 4 8 29 8 8
Odonata Anisoptera Unknown 9 0 3 0 8 0 37 0 9 0 7 0
Odonata Calopterygidae Hetareina 3 0 1 2 5 0 16 0 2 0 1 0
Odonata Coenagrionidae Coenagrionidae 21 4 21 8 108 3 69 0 11 0 1 3
Odonata Gomphidae Erpetogomphus 4 9 1 8 3 4 8 1 0 2 2 0
Odonata Libelluilidae Brechmorhaga 1 0 0 0 1 0 19 0 0 0 10 0
Odonata Libelluilidae Unknown 0 5 0 1 0 1 0 6 0 0 0 0
Odonata Unknown Unknown 13 0 8 0 9 0 8 1 11 0 1 0
Ostracoda Unknown Unknown 157 0 272 0 391 2 25 0 3 0 2 0
Plecoptera Capniidae Capnia 0 0 0 0 0 0 4 0 0 0 4 0
Plecoptera Nemouridae Malenka 0 0 0 0 2 0 1 0 0 0 0 0
Plecoptera Perlodidae Isoperla 0 0 0 0 7 0 9 0 0 0 12 0
Trichoptera Calomatoceridae Phylloicus 3 0 1 0 5 1 0 0 0 0 0 0
Trichoptera Glossosomatidae Culoptila/Protoptila 0 0 4 0 0 0 1 0 0 0 0 1
Trichoptera Helicopsychidae Helicopsyche 3708 576 0 5 5 0 0 0 0 0 0 0
Trichoptera Hydropsychidae Chuematopsyche 0 0 25 15 38 7 16 0 0 0 10 14
Trichoptera Hydropsychidae Hydropsyche 167 21 209 312 140 170 134 0 1194 4 75 424
Trichoptera Hydropsychidae Smicridea 0 0 0 0 0 0 0 0 0 0 12 0
Trichoptera Hydroptilidae Hydroptila 0 0 0 1 47 8 46 0 0 1 3 2
Trichoptera Hydroptilidae Unknown 5 0 0 0 0 0 10 0 0 0 0 0
Trichoptera Hydroptilidae Luecotrichia 0 0 16 5 3 2 0 0 0 0 1 0
Trichoptera Hydroptilidae Mayatrichia 0 0 0 0 0 0 18 0 0 0 5 2
Trichoptera Hydroptilidae Metrichia 270 78 231 27 22 14 39 1 41 0 8 5
Trichoptera Hydroptilidae Neotrichia 0 0 0 0 1 0 0 0 0 0 2 0
Trichoptera Hydroptilidae Oxytheira 1 0 0 0 0 0 0 0 0 0 0 0
Trichoptera Lepidostomitadae Lepidostoma 0 0 1 0 0 0 0 0 0 0 0 0
Trichoptera Leptoceridae Nectopsyche 9 0 4 1 10 1 0 0 0 0 0 0
Trichoptera Leptoceridae Oecetis 0 0 0 0 5 0 0 0 0 0 0 0
Trichoptera Limnephilidae Limnephilus 0 0 0 0 2 0 27 0 0 0 0 0
Trichoptera Odontoceridae Marilia flexuosa 1 0 7 0 3 0 0 0 0 0 0 0
Trichoptera Philopotamidae Chimarra 0 0 8 5 43 31 65 0 3 2 8 0
Trichoptera Philopotamidae Wormaldia 0 0 0 0 12 3 4 0 93 1 1 0
Trichoptera Polycentropidae Polycentropus/Cernotina 0 0 7 5 101 0 23 1 0 0 1 0
Trichoptera Polycentropidae Polyplectropus 0 0 3 3 0 0 0 0 0 0 0 0
104

Control Site 1
Control Site 2
Restored Site 1
Restored Site 2
Restored Site 3
Restored Site 4
Order Family Genus species Pre Post Pre Post Pre Post Pre Post Pre Post Pre Post
Trichoptera Psychomyiidae Tinodes 0 0 1 0 74 51 20 3 5 1 1 0
Trichoptera Unknown Unknown 0 0 4 1 1 1 1 0 1 0 0 0
Trombidiformes Unknown Unknown 6 11 11 26 57 39 44 33 7 1 22 2
Turbellaria Tricladia Dugesia tigrina 308 137 57 60 26 17 33 0 15 0 0 0
105