aquatic environment - terrapub€¦ · aquatic environment. for example, let us consider the...
TRANSCRIPT
1
Chapter I
AQUATIC ENVIRONMENT
Ken FURUYA and Ichiro YASUDA
The most important chemical compound that enables the existence of livingorganisms on Earth is water. Circulating in the solid (ice), liquid, and gaseous(vapor) states, water supports the activities of living organisms on Earth. Ahydrosphere is that in which water exists in either of the phases, and is describedas the mass of water found on, under, and over the surface of the Earth. When weaccept this definition, and call organisms living in hydrosphere as aquaticorganisms, most of the organisms on Earth can be regarded as aquatic organisms.In this book, we therefore define the aquatic organisms as those living mainly inliquid water bodies such as ponds, lakes, rivers or oceans.
It is said that Earth was born 4.6 billion years ago. Compared to the age ofthe cosmos, 13.7 billion years old, birth of the Earth was a relatively recent event.On the contrary, when we compare the birth of life on Earth, the history of theEarth can be said to be very long. In the early days of the Solar System after itsbirth, gases and dusts clumped together and formed the micro-planets. The Earthwas born from the fusion of these micro-planets. Heat released during this processcreated the ocean of magma on the Earth, while the gases from the magma, ofwhich, vapor, carbon dioxide and nitrogen were the main components, formed thehot atmosphere on the Earth. With a decrease in the temperature of the Earth,dense cloud covered the upper layer of the atmosphere leading to rain. The rainfalling on the hot magma produced vapor in the lower layer of the atmosphere.This process repeated over and over again for a long period. After the fusion ofthe micro-planets subsided, the temperature decreased gradually and solid crustof the Earth was formed. This is a generally accepted theory on the early historyof the Earth. Ocean was produced ca. 4 billion years ago with the formation of thecrust. Life originated in the ocean shortly after its formation. Appearance ofphotosynthetic organisms which produced free oxygen molecules changed theatmosphere of the Earth from reductive to oxidative. After its origin in the ocean,living organisms diversified, adapted to various aquatic environments, andfurther moved on to the terrestrial environments. This short outline story maymake one feel that living organisms evolved along a simple straight line from itsorigin until the present. Modern ecosystems on Earth have developed throughcontinuous environmental changes, extinction of species, appearance of new
2 Chapter I
species and adaptation to new environments. Today, in the debate on globalwarming, the rapidness of the shifts is seriously concerned about its impact onecosystems, as the living organisms have so far not experienced such a rapidchange. Can living organisms adapt to these changes? How will the ecosystemsbe reorganized? How can human being reap the benefits from the ecosystems,which are indispensable for their existence? We need multi-disciplinary effortsto find a way to answer these questions. For this, understanding of biologicalactivities in present environment is a prerequisite. Let us study aquaticenvironments, biological activities therein, and its relationship with humansociety.
(Ken Furuya)
1. FORMATION AND DISTRIBUTION OF AQUATIC ENVIRONMENTS
1.1 Aqua planet
The Earth was called “the planet of water”. When we see the picture of theEarth floating in the real black cosmos, the Earth is totally bluish even in landparts just like its name. In fact, 75% of the Earth’s surface is covered with waterwhen we include the ice-covered areas. Water is indispensable for living organisms.Life originated in water and all living organisms are dependent on it. Among theplanets of the Solar System, liquid water exists only on the Earth. The distancebetween the Earth and the Sun enables the existence of liquid water on the Earth.Venus, moving on an inner orbit around the Sun than the Earth, receives muchhigher solar energy than the Earth, and the heat is trapped by its atmosphere as agreenhouse effect. The surface temperature of the Venus is about 500°C. Mars,the planet circulating on an outer loop than the Earth, has only solid water (ice)because its surface temperature is –60°C. Since the Earth moves on an orbitbetween Venus and Mars, it receives intermediate flux of solar energy, and itssurface temperature calculated from the heat from the Sun is –18°C. In reality,mean temperature is about 15°C because of the greenhouse effect of water vaporand other gasses. Water is a unique matter which can exist in three phases, namelygaseous, liquid and solid, at the surface temperature and pressure of the Earth.Water on the Earth’s surface absorbs solar energy and changes to vapor. Vaporforms clouds in the air and returns to the Earth’s surface as rain or snow. This isa global circulating system of water. If the Earth was smaller than its present size,the gravitational force of the Earth would be too weak to maintain the vaporsaround the Earth, and consequently the Earth would lose its water. This presumptionis plausible by seeing the Moon, which likely had air and water when it wasformed, and lost not only the vapors but also the air because of insufficientgravitational force.
Total amount of water in the Earth is 137 × 109 km3, 97% of which exists inthe oceans (Table 1.1). As the second largest pool, 1.7% is permanent ice/glacier,and another 1.7% is underground water. Thus, it is not possible for us to use most
Aquatic Environment 3
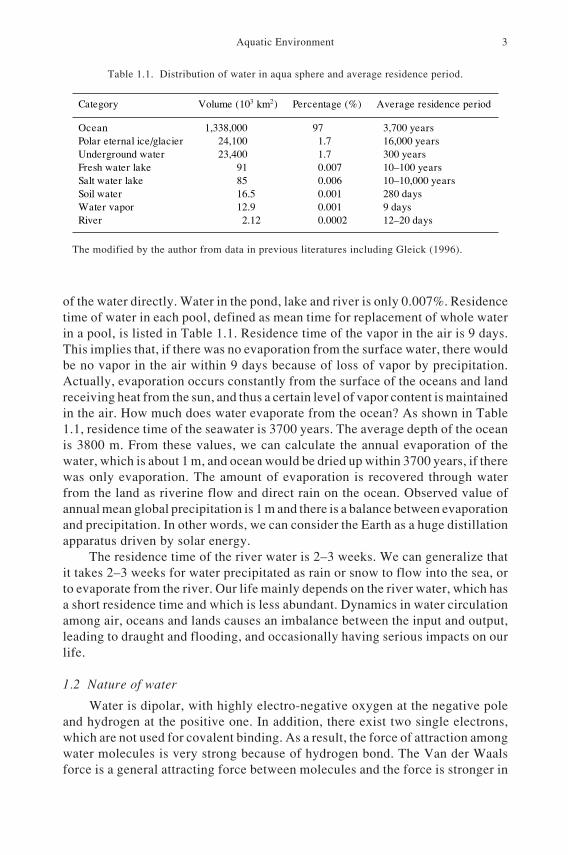
of the water directly. Water in the pond, lake and river is only 0.007%. Residencetime of water in each pool, defined as mean time for replacement of whole waterin a pool, is listed in Table 1.1. Residence time of the vapor in the air is 9 days.This implies that, if there was no evaporation from the surface water, there wouldbe no vapor in the air within 9 days because of loss of vapor by precipitation.Actually, evaporation occurs constantly from the surface of the oceans and landreceiving heat from the sun, and thus a certain level of vapor content is maintainedin the air. How much does water evaporate from the ocean? As shown in Table1.1, residence time of the seawater is 3700 years. The average depth of the oceanis 3800 m. From these values, we can calculate the annual evaporation of thewater, which is about 1 m, and ocean would be dried up within 3700 years, if therewas only evaporation. The amount of evaporation is recovered through waterfrom the land as riverine flow and direct rain on the ocean. Observed value ofannual mean global precipitation is 1 m and there is a balance between evaporationand precipitation. In other words, we can consider the Earth as a huge distillationapparatus driven by solar energy.
The residence time of the river water is 2–3 weeks. We can generalize thatit takes 2–3 weeks for water precipitated as rain or snow to flow into the sea, orto evaporate from the river. Our life mainly depends on the river water, which hasa short residence time and which is less abundant. Dynamics in water circulationamong air, oceans and lands causes an imbalance between the input and output,leading to draught and flooding, and occasionally having serious impacts on ourlife.
1.2 Nature of water
Water is dipolar, with highly electro-negative oxygen at the negative poleand hydrogen at the positive one. In addition, there exist two single electrons,which are not used for covalent binding. As a result, the force of attraction amongwater molecules is very strong because of hydrogen bond. The Van der Waalsforce is a general attracting force between molecules and the force is stronger in
Category Volume (103 km2) Percentage (%) Average residence period
Ocean 1,338,000 97 3,700 yearsPolar eternal ice/glacier 24,100 1.7 16,000 yearsUnderground water 23,400 1.7 300 yearsFresh water lake 91 0.007 10–100 yearsSalt water lake 85 0.006 10–10,000 yearsSoil water 16.5 0.001 280 daysWater vapor 12.9 0.001 9 daysRiver 2.12 0.0002 12–20 days
Table 1.1. Distribution of water in aqua sphere and average residence period.
The modified by the author from data in previous literatures including Gleick (1996).
4 Chapter I
heavier molecules. Although the molecular weight of water is 18, the force ofattraction between water molecules derived from the hydrogen bond is comparableto Van der Waals force in molecules with molecular weight of 100. This strongattractive force makes boiling point and melting point of water 100°C and 0°C inwater, respectively. If there was no hydrogen bond among water molecules, theboiling and melting temperature would be lower than –90°C and –110°C,respectively. This means that all water on the Earth would exist as vapor and therewould be no liquid or ice water. In addition to this, water is a good solvent becauseof hydrogen bond, and can easily break ion bonding of salts such as sodiumchloride using polarized power. Furthermore, water bind with other variousmolecules by hydrogen bond as shown in dissolution of sugar. Using this naturewater dissolves many biological substances and provides the environment forchemical reaction.
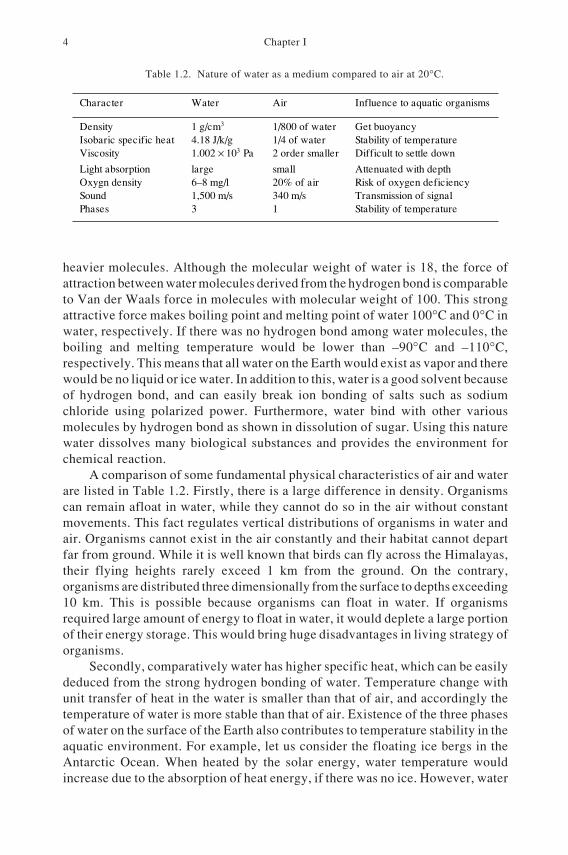
A comparison of some fundamental physical characteristics of air and waterare listed in Table 1.2. Firstly, there is a large difference in density. Organismscan remain afloat in water, while they cannot do so in the air without constantmovements. This fact regulates vertical distributions of organisms in water andair. Organisms cannot exist in the air constantly and their habitat cannot departfar from ground. While it is well known that birds can fly across the Himalayas,their flying heights rarely exceed 1 km from the ground. On the contrary,organisms are distributed three dimensionally from the surface to depths exceeding10 km. This is possible because organisms can float in water. If organismsrequired large amount of energy to float in water, it would deplete a large portionof their energy storage. This would bring huge disadvantages in living strategy oforganisms.
Secondly, comparatively water has higher specific heat, which can be easilydeduced from the strong hydrogen bonding of water. Temperature change withunit transfer of heat in the water is smaller than that of air, and accordingly thetemperature of water is more stable than that of air. Existence of the three phasesof water on the surface of the Earth also contributes to temperature stability in theaquatic environment. For example, let us consider the floating ice bergs in theAntarctic Ocean. When heated by the solar energy, water temperature wouldincrease due to the absorption of heat energy, if there was no ice. However, water
Character Water Air Influence to aquatic organisms
Density 1 g/cm3 1/800 of water Get buoyancyIsobaric specific heat 4.18 J/k/g 1/4 of water Stability of temperatureViscosity 1.002 × 10³ Pa 2 order smaller Difficult to settle down
Light absorption large small Attenuated with depthOxygn density 6–8 mg/l 20% of air Risk of oxygen deficiencySound 1,500 m/s 340 m/s Transmission of signalPhases 3 1 Stability of temperature
Table 1.2. Nature of water as a medium compared to air at 20°C.
Aquatic Environment 5
temperature does not increase unless all the ice thaws away, because the heatenergy absorbed is used as energy for melting of ice. Inversely, in the case of lossof heat energy from the sea by cooling, temperature decrease is hindered by theformation of ice. In the warm waters in tropical and subtropical areas, heat energyof the sun is lightened up by the evaporation of water. Thus, water helps inbuffering the temperature change with heat exchange on the ocean surface.
Viscosity is also higher in water. We can experience the high viscosity ofwater by feeling the resistance of the water when we walk in the pool. Viscosityworks as a resistance to moving and settling of floating bodies. In other words,it is advantageous for floating and disadvantageous for movement of plankton inwater, which have limited swimming capability. Thus plankton life is stronglycontrolled by viscosity of water.
Density of water affects its light absorption and sound propagation. Light isattenuated and sound propagates rapidly in water. Light is absorbed also by air inatmosphere, but it is absorbed more acutely by water, and is attenuated rapidlywith depth. Even in the most transparent sea, light intensity at 100 m depth isabout 1% of that at the surface. On the other hand, sound can propagate deeperin water than in air.
Concentrations of oxygen, which is indispensable for aerobic organisms,differ considerably between water and air. Anoxic condition rarely occurs onland, except under exceptional conditions, although it is often common in water.We will discuss the details of anoxic conditions in water in the later part of thisbook.
Seawater contains several inorganic salts as compared with fresh water, andalmost all natural elements exist in the sea. Among these, Sodium chloride andMagnesium Sulfate account for 95% of dissolved matters. Major ions in seawaterare Na+, K+, Ca++, Sr+, Cl–, SO4
–, Br–, and F–, with lower concentrations in coastalarea and higher in the offshore. The relative ionic composition however, isconstant among the different seas.
Because of the presence of inorganic salts, specific gravity of seawater ishigher than that of fresh water, and concentrations of dissolved gases such asdinitrogen and oxygen are lower in seawater. Salt content regulates the osmoticpressure which is an important environmental condition for aquatic organisms indetermining the distribution of marine, fresh and brackish species.
As summarized in Table 1.2, there are various differences in the characteristicsof water and air. Therefore, we can easily infer that aquatic organisms havedifferent nature from terrestrial organisms. Creatures that shift their habitat fromland to waters such as whale evolved their life in water. The largest creature onthe Earth is blue whale. Blue whales are much huge compared to the Africanelephant, which is the largest terrestrial creature. Shifting its habitat to the aquaticenvironment enabled the whale to increase the body weight.
1.3 Vertical zonation of sea
Considering the sea surface as the border, the surface of the Earth can be
6 Chapter I
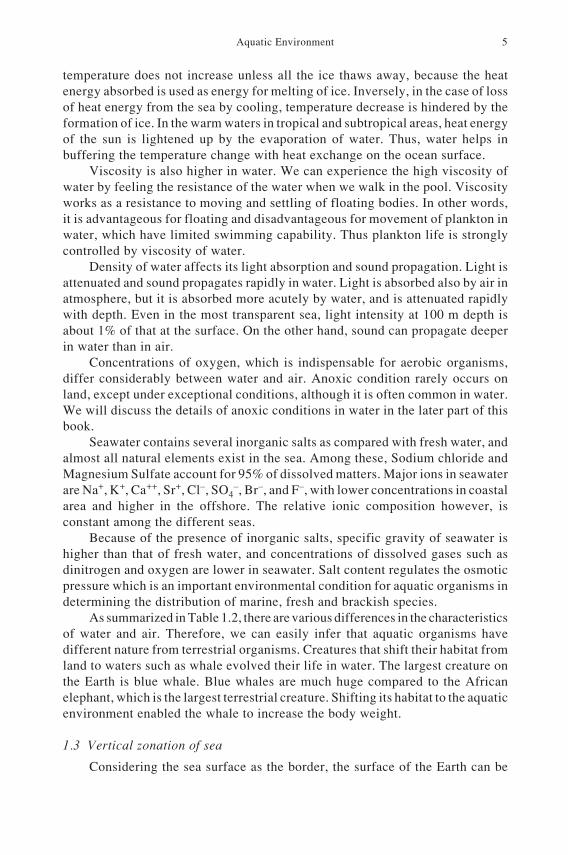
divided in two, the upper region is land and air, and the lower is ocean (Fig. 1.1).The height of Mount Everest, the highest summit on the Earth, is 8,848 m andmean height of the land is 840 m. Pond, lakes, river and inland seas are distributedbetween 0 m to 8,848 m altitude. The deepest part of the ocean is the MarianaTrench in North Pacific Sea. Its depth is 11,035 m and mean depth of the oceanis 3,800 m. If we trim the undulation on the Earth’s surface and fill the depressionevenly by cutting and scraping, an ocean with a depth of 2,340 m will cover thesurface of the Earth. At the margins of the continent, the shoreline slopes gentlyoffshore and steeps down at the point called the shelf break. The slope before thispoint is called the continental shelf and that after the shelf break is called thecontinent slope. The average depth of the continental shelf is 130 m. It isconsidered that continental shelf was a coastal plain in the glacial age when theshore line was 100 m lower than the present shore line.
Based on the depth, the ocean can be divided into the epipelagic zone (0 mto 200 m), mesopelagic zone (200 m to 1000 m) and bathypelagic zone (deeperpart than 1000 m). The bathypelagic zone may be further divided to 3 zonesnamely, bathypelagic (1000 m to 3000–4000 m), abyssopelagic (3000 m to 4000–6000 m) and the hadal zone (deeper than 6000 m). In the epipelagic zone,phytoplankton produce organic matter through photosynthesis in the presence ofsun light, resulting in highest standing stock of organisms in this zone. Themesopelagic zone is located between the epipelagic and bathypelagic zones. It ischaracterized by diffused light, the intensity of which is insufficient forphotosynthesis but allows visibility, and has a low temperature around 5°C. Withno light penetration, the bathypelagic zone is dark and cold.
Fig. 1.1. Distribution of altitude form sea surface (left) and altitude curve.
Aquatic Environment 7
1.4 Ocean current
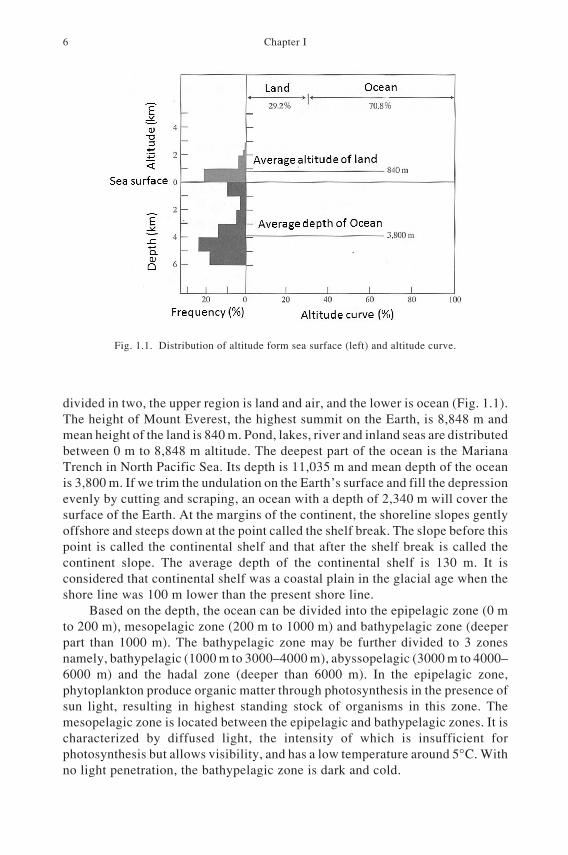
When we see the surface of the sea on a global scale, we can observe theexistence of regular flow pattern of the sea surface. These are the ocean currents,which are divided into warm currents, flowing from low latitudes to highlatitudes, and cold currents flowing from high latitudes to low latitudes (Fig. 1.2).We can observe the existence of two circular current systems in the North PacificOcean formed by warm and cold currents. One consists of Kuroshio (Japancurrent) in the Western Pacific, California current in the eastern Pacific and thenorth equatorial current. The other consists of Oyashio current and Alaskacurrents. The velocities vary according to currents and location, with a velocityof more than 1 m/sec observed in some strong current such as the Kuroshiocurrent. Strong currents caused by the rotation of the Earth are observed on thecoast along the western boundaries of the ocean. Kuroshio current, Gulf stream,east Australian current and Brazilian current are some examples. Mechanism ofocean current is described in the later part of this book. Warm currents adds watervapor to the atmosphere and heats up the air in the process of cooling. Therefore,coasts along the warm current are generally humid. On the contrary, cold currentsprovide little vapor, and coasts along the cold currents tend to be dry and cold. Asdescribed above, currents influence the climate through transportation of heat andformation of clouds, and their temperature and salinity regimes regulate thedistribution of organisms.
Currents are highly important for fisheries. Migratory fishes utilize the
Fig. 1.2. Pattern diagram of ocean current.
8 Chapter I
currents effectively during their life history. Larval sardines that hatch out on thecoast of Japan move towards the north through the Kuroshio current, grow up inthe off Sanriku region rich in food organisms, and then return along the coast backto their spawning grounds in the south. Many other marine creatures such as thetuna, eel, sea turtles etc. are observed to depend on the currents. Currents are alsoimportant for the formation of fishing grounds. The offshore region of Sanriku isrich in plankton stocks and forms a very good fishing ground. This is due to themeeting of the Kuroshio and Oyashio currents and mixing up of the two waterbodies in this region. Regions where two different water bodies, such as the warmand cold currents, or the coastal and oceanic water merges, form good fishingground.
(Ken Furuya)
2. PHYSICAL ENVIRONMENT
2.1 Physical property of seawater
Physical nature of water is dependent on its temperature, salinity andpressure. Water density is a function of these variables. Salinity (S) represents thetotal content (in gram) of dissolved substances in 1000 g of water, and wasexpressed as parts per thousand (‰ per mil) until 1960s, when water sampleswere titrated by AgNO3 and the weight of precipitated AgCl was measured.Salinity was calculated by multiplying the composition ratio to the weight ofchloride (S = 1.80655Cl). This method is based on the fact that the compositionof substances in sea water is constant. However, this method involves laborioussampling, titration and weighing, and the accuracy was limited at 0.02‰, whichis insufficient for deep water studies. The titration method was then replaced bythe measurements of conductivity, temperature and pressure as simpler and moresensitive methods. In 1978, PSS78 (Practical Salinity Scale 1978) was introduced,in which salinity was defined as a function of conductivity, temperature andpressure. With the modifications in the measurement techniques, salinity wasliberated from the concept of relative weight. No unit is then added to salinity, orpsu (Practical Salinity Unit) is added as the salinity unit. Conductivity,Temperature, Depth (CTD) sensors developed as monitoring equipment forpressure, conductivity and temperature, helped to considerably simplify themeasurement of physical characteristics of sea water. However, performance ofthe sensors changes with time due to the attachment of settling (bio-fouling)organisms and other factors. Hence, it is necessary to calibrate the CTD usingstandard sea water, salinity of which is measured by accurate salino-meter undertemperature regulated conditions.
Pressure of 1 m thick water is about 0.1 barometric pressure. The unit ofbarometric pressure is bar. The unit dbar (deci bar) is generally used inoceanography as an alternative to indicate water depth. Deci means one tenth.Pressure of seawater at 1000 m depth corresponds to about 1,010 dbar. 1 mseawater = 1 dbar = 104 Pa = 102 hPa (h represents hector or 100, Pa represents
Aquatic Environment 9
Pascal).Density of sea water varies from 1,020 to 1,070 kg/m3. Sigma (σ), the unit
used for density of seawater, is obtained by subtracting 1,000 from the value ofdensity. Sea water has various substances dissolved in it. Density of pure freshwater without dissolved substances reaches the maximum at 4°C, while seawatercontaining various dissolved substances reaches the maximum density at freezingtemperature. The density of sea water is lower in higher temperature at the samesalinity and pressure, higher in higher salinity at the same pressure and temperature,and is higher in higher pressure at the same temperature and salinity. When weplace sea water at the same temperature and salinity under different pressureconditions, the densities of the sea waters are higher in higher pressure, due tocompression under pressure.
The density at a certain salinity, temperature and pressure is called in-situdensity and is represented as σstp. For example, the density of seawater;σs=35psu, t=0°C,p=0dbar = 28.13, changes to σs=35psu,t=0°C,p=4000dbar = 48.49. Refer toAppendix 1 for calculation of the in-situ density.
When seawater is displaced to different pressure (depth) without heatexchange, adiabatic expansion (in case of from deep to shallow), or adiabaticcontraction (in case of from shallow to deep) occurs and seawater temperaturedecreases for the expansion or increases for the contraction. When the seawaterat 0 dbar pressure, 35 psu salinity and 5°C temperature moves adiabatically to4000 dbar, the temperature changes to 5.45°C. The temperature of seawater thuschanges with the changes in pressure. Temperature values varying with thechanges in pressure are not convenient for the identification or comparison of seawater. Potential temperature (θ) is sometimes used instead of in-situ temperatureto identify the water. θ is defined as the temperature when the water is adiabaticallymoved to standard (for example at the surface) pressure. Potential temperature atthe surface, where pressure p = 0 dbar can be calculated using equation inAppendix 2. Two water bodies that have the same θ and S could have the sameorigin.
The density obtained from the equation of in-situ density in Appendix 1 forthe value of salinity, potential water temperature (θ) and standard pressure (Pr),σs,t=θ,p=Pr, is called potential density. For ocean shallower than 1000 m, potentialdensity at sea surface, σ0 or σθ are often used. When sea water has no contact withair at the surface or bottom and mixing is weak, water tends to move along thesame potential density keeping the same potential temperature and salinity.Therefore, tracing conservative properties such as potential temperature orsalinity is a useful method to infer the distribution of currents or the origin ofseawater in the ocean interior. For depths shallower than 500 m, sigma-t is alsoused (σt = σs,t=T,p=0), where the density is calculated for in-situ temperature,salinity and surface pressure.
2.2 Outline of ocean hydrographic structure
Driving force that produces currents and internal structure of ocean is mainly
10 Chapter I
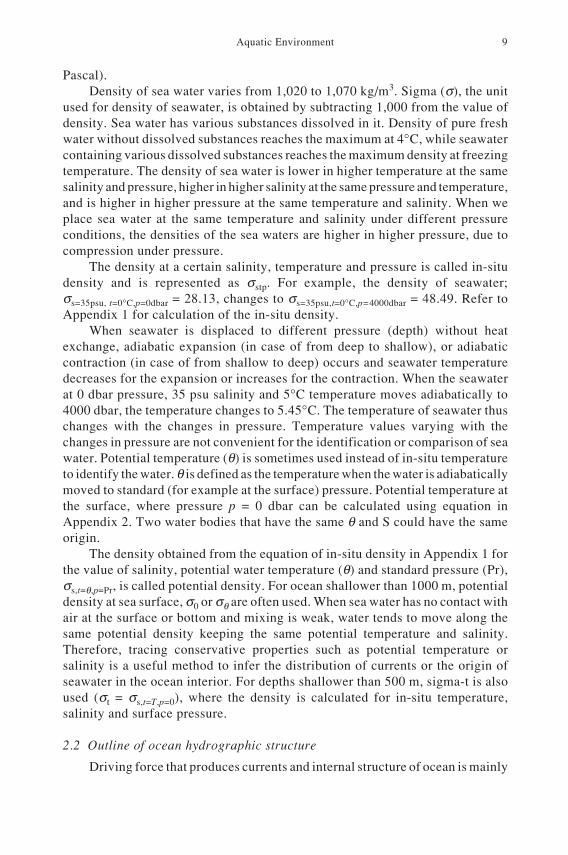
at the surface where sea water is in contact with air. As shown in the distributionof annually averaged sea surface temperature (SST) (Fig. 1.3 upper), SST is lowin high latitudes (minimum temperature is –1.8°C, the freezing temperature forice formation) and high in low latitudes (maximum is about 30°C). The isothermsare generally zonal because SST is affected by solar radiation which depends on
Fig. 1.3. Horizontal distribution of sea surface temperature (SST: upper) and sea surface salinity(SSS: lower).
Aquatic Environment 11
latitude. Regions where the isotherms are not zonal, usually have special reasons:the existence of heat transportation by strong currents (Kuroshio current alongthe coast of Japan etc.), cold upwelling regions by equator-ward alongshorewinds along the east coast of Pacific and by easterly Trade Wind along the easternequatorial Pacific etc., and low temperature regions by strong vertical mixing(Kuril island regions and Aleutian Islands etc.).
Heat exchange at sea surface consists of heating by solar radiation (Qsranging 0–400 W/m2), cooling by long wave radiation from the surface (Qb, Ca–50 W/m2), heat loss by latent heat flux through evaporation of sea water (Qe),and heat exchange of sensible heat flux caused by temperature difference betweensea water and air (Qh, ±100 W/m2). Sum of these heat exchanges, (Qs + Qb +Qe + Qh), is net heat flux (Qnet). Positive value of Qnet means heating of sea waterand negative value of Qnet means cooling of sea water. In a long term period (morethan 1 year), sea water temperature does not change even in the place where theQnet is positive (negative), because the heat increase (decrease) is compensatedby horizontal heat transport or vertical diffusion of heat. The latent heat flux, Qe,and the sensible heat flux, Qh, are both proportional to wind speed over the seasurface. Cooling by Qe is enhanced when dry and cold air blows over the warmocean. Surface heat exchange through Qh increases with the increase of temperaturedifference between SST and air temperature. Therefore, cooling is enhanced inwinter along the western boundary currents such as the Kuroshio south of Japan,the Gulf Stream south of U.S.A. and Tsushima warm current regions in the JapanSea.
Distribution of sea surface salinity (SSS) is different from SST as shown inlower panel of Fig. 1.3. High salinity is observed along 20° latitude. Salinity isgenerally low in high latitudes. When we compare the Pacific Ocean with theAtlantic, salinity is higher in Atlantic Ocean. Some low salinity regions are seennear the coasts. Sea surface salinity distribution is determined mainly byevaporation, precipitation and river discharge. In regions where evaporation (E)exceeds precipitation (P) plus river discharge (R), that is E – P – R > 0, salinitytends to be higher. On a long term basis (over a year), SSSs do not change, becausethe excess salinity is transported to ocean interior by diffusion and currents, andsalinity budget is balanced.
In the Labrador Sea in the North Atlantic, high saline water transported fromlow latitudes is cooled and sinks down to the bottom in winter forming the NorthAtlantic Deep Water (NADW). On the contrary, in high latitudes of the NorthPacific, surface salinity is low because of excess precipitation without deep waterformation. Sea-ice forms at freezing temperature. Since the sea ice includes littlesalt, sea-ice formation releases low temperature, high salinity and high densitywater called “brine”. Sometimes this brine plays a role in forming deep orintermediate water.
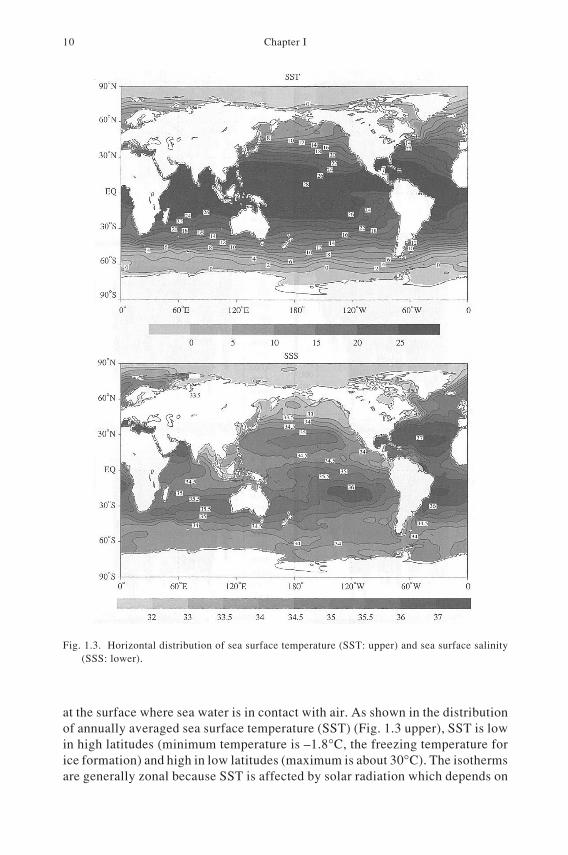
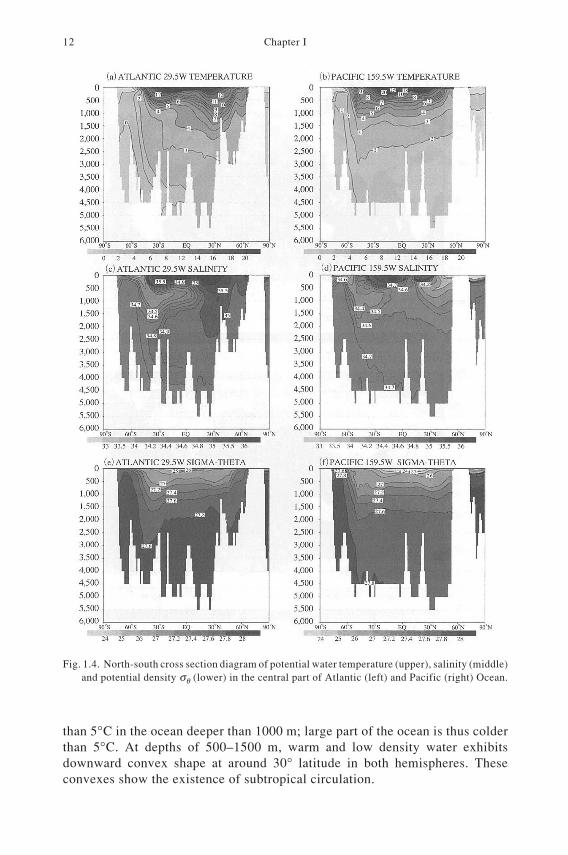
Meridional vertical cross-sections of potential temperature θ, salinity S andpotential density σθ at 29.5°W for the Atlantic and 159.5°W for the Pacific areshown in Fig. 1.4. θ and S are conservative properties that tend to keep theoriginal values along currents in the ocean interior. Potential temperature θ is less
12 Chapter I
than 5°C in the ocean deeper than 1000 m; large part of the ocean is thus colderthan 5°C. At depths of 500–1500 m, warm and low density water exhibitsdownward convex shape at around 30° latitude in both hemispheres. Theseconvexes show the existence of subtropical circulation.
Fig. 1.4. North-south cross section diagram of potential water temperature (upper), salinity (middle)and potential density σθ (lower) in the central part of Atlantic (left) and Pacific (right) Ocean.
Aquatic Environment 13
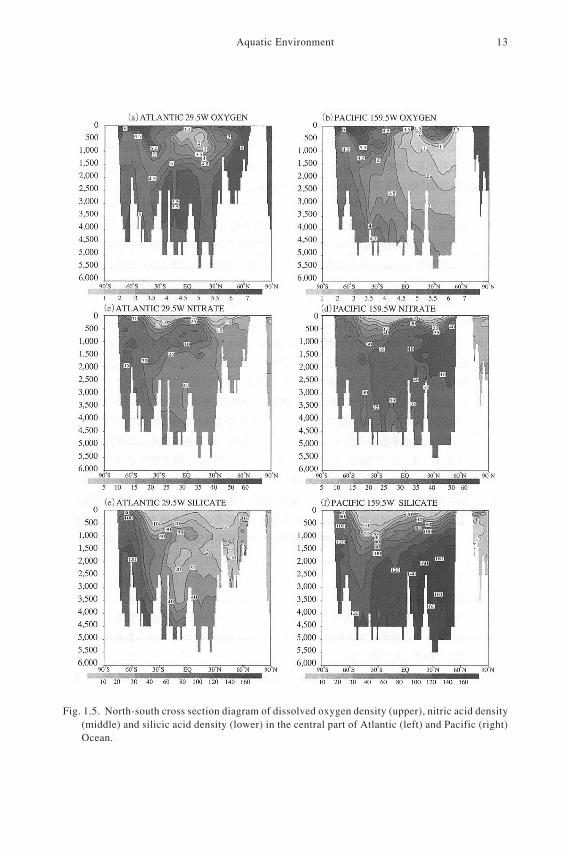
Fig. 1.5. North-south cross section diagram of dissolved oxygen density (upper), nitric acid density(middle) and silicic acid density (lower) in the central part of Atlantic (left) and Pacific (right)Ocean.
14 Chapter I
Distributions of salinity are more complicated than potential temperatureand reflect circulations of intermediate and deep water masses. NADW isproduced by sinking of surface water near the coasts of Greenland or LabradorSea. Along the 3000 m layer in the Atlantic Ocean, NADW extends to the south,that makes the deep layer of Atlantic Ocean warmer, saltier and denser than thedeep Pacific. Antarctic Bottom Water (AABW) with relatively low temperatureand low salinity sinks along the coast of Antarctica. Origin of deep water in thePacific Ocean is considered to be the mixture of NADW and AABW produced byupwelling of NADW that is cooled and diluted in surface around Antarctica. Inthe intermediate depths of 500–1000 m, low salinity waters called intermediatewater is observed. This is characterized by the existence of vertical salinityminimum. The low salinity water in the southern hemisphere is called AntarcticIntermediate Water (AAIW), and the one in the North Pacific is called NorthPacific Intermediate Water (NPIW). The high temperature and salinity wateraround 30° in the layer from 500 m to 2000 m in the North Atlantic is calledMediterranean Water.
Figure 1.5 represents vertical cross-sections of dissolved Oxygen (O2),dissolved nitrate (NO3
–) and silicate (Si(OH)4). Being different from conservativeproperties of potential temperature and salinity, concentrations of these propertieschange along with water movements due to decomposition or biological activities,and are called non-conservative properties. Oxygen in the air rapidly dissolvessea water to nearly saturation at surface when sea water contacts with theoverlying air. In the ocean interior, oxygen is consumed by the decomposition oforganic substances originally produced from biological activities near the surfaceeuphotic zone. After the departure from surface, concentration of dissolvedoxygen thus gradually decreases along the water pathway.
Nitrate is an essential nutrient for production of phytoplankton byphotosynthesis near the ocean surface. Dissolved nitrate is utilized duringphytoplankton production; nitrate concentration is generally quite low near thesurface in low-mid latitudes. Biological wastes and excretory substances aggregateand form particles that sink down to intermediate and deep oceans. In the processof sinking, the particles are decomposed and nutrient is remineralized. Therefore,the concentration of nitrate is relatively high in older intermediate and deeperwaters.
Silicate is also used as nutrient by phytoplankton such as diatoms whichforms sinking particles of opal. These particles containing silica are alsodecomposed and silicate is remineralized. Silica decomposition occurs at greaterdepths than the nitrate decomposition; silica maximum is thus deeper than that ofnitrate in the Pacific Ocean.
As described above, distributions of dissolved oxygen and nutrient aredetermined by a combination of circulation of sea water (mainly for horizontaldirection) and circulation of materials (mainly for vertical direction) throughbiological activities, sinking particles and decomposition of biogenic materials.It can be roughly considered that sea water containing high oxygen and lownutrient spends relatively short time after the contact with air and is thus younger.
Aquatic Environment 15
In contrast, the water containing low oxygen and high nutrient is relatively old.For the difference in concentrations of oxygen and nutrient between the Atlanticand the Pacific, it can be explained by the ocean deep circulation that NADWproduced in the North Atlantic eventually flows into the north Pacific through theSouthern Ocean, rising very slowly by vertical diffusion. It takes about 1000years from formation of NADW to North Pacific Low oxygen regions.
2.3 Introduction of fluid dynamics
Movement of water like ocean currents and changes in temperature andsalinity of water can be described by equations in fluid dynamics and thermo-dynamics. Here the author tries to explain the laws of fluids that representchanges of physical environments in sea, lake and river. For further detailedinformation, readers are recommended to read relevant books.
Movement of water basically follows Newton’s second law (m· ra =
rF ,
where m is mass of a point particle, ra acceleration and
rF force working on the
point particle). Strictly, water is not a point particle and can change its shape andcontact with surrounding area. But let us here regard a infinitely small rectangularcuboid water, of which length are δx, δy and δz in the direction of x, y, z, as a pointparticle, for simplicity, and consider the forces on the point particle. When thedensity of the water is ρ, and mass is m,
m = ρ·δx·δy·δz.
As forces working on water that will be described from the next paragraph,pressure gradient force works from high to low pressure, Coriolis force works ona moving particle to the right (left) direction perpendicular to the movingdirection in the northern (southern) hemisphere on the rotating Earth, and gravityforce works in the vertical direction.
Pressure p (x, y, z, t) works on area, and is scalar quantity that has nodirection. The pressure gradient force in the x-direction is expressed as thedifference of pressure force p·δy·δz (pressure multiplied by area) working on thetwo areas whose distance is δx.
–(p(x + δx, y, z) – p(x, y, z))·δy·δz,
where the negative sign means that the force works from high to low pressure.Since this force is equal to mass multiplied by acceleration m·Du/Dt,
ρ δ δ δ δ δ δ δ δ⋅ ⋅ ⋅ ⋅ = − +( ) − ( )( )( ) ⋅ ⋅ ⋅x y zDu
Dtp x x y z p x y z x x y z, , , ,
where u is the velocity in the x-direction, and Du/Dt is the velocity accelerationin the x-direction. Similar arguments can be applied for y and z direction.Therefore, Newton’s second low with the pressure gradient force can be expressed
16 Chapter I
as,
ρ ⋅ = −∇ = ( ) ∇ = ∂∂
∂∂
∂∂
Du
Dtp u u v w p
p
x
p
y
p
z
rr
, , , , , , .
All things on the Earth including human being and sea water rotate 360° inone day. We usually do not notice this rapid rotation in a daily life; though we aremoving very fast in the view from space. All the things receive a gravity forcetoward the center of the Earth which balances with the centrifugal force; they aremoving in a uniform rotation with constant rotational speed. For the descriptionof motion of oceanic currents, it is convenient to describe relative motion to therotating Earth, that is, on the moving frame which rotates exactly with the Earth,because we are observing from surface of the Earth. The resulting equation canbe obtained by coordinate transformation of the equation ρ·D
ru /Dt = –∇p. This
procedure means make ru relative velocity to the Earth.
The equation is expressed as follow
ρ ρ ρ⋅ = −∇ − ⋅ × − ⋅ × ×( )Du
Dtp u r
r r r r r r2 Ω Ω Ω .
Where rΩ is the angular speed vector of the Earth’s rotation. Please refer to text
books on fundamental mechanics for the derivation of this equation. The secondterm on the right hand side is the Coriolis force and the third term is the centrifugalforce. Adding the gravity force and combining the gravity force and the centrifugalforce into modified gravity force, the final equation of motion is obtained as
ρ ρ ρ⋅ = −∇ − ⋅ × − ⋅Du
Dtp u g
r r r r2 Ω ,
where rg is modified gravity acceleration.
This equation of motion is for a point particle which moves by its velocity
ru whose acceleration is D
ru /Dt, and the position of the point particle changes
from time to time. We call this type of time derivative D/Dt, as Lagrangederivative, that is the derivative on the moving frame of reference attached to themoving point particle. This Lagrange time derivative is distinguished from thetime derivative on the fixed (not moving) frame (∂/∂t)x,y,z, that we call Eulerderivative. Since potential temperature (heat) and salinity of the point particle(water particle) do not change with time under the condition of no exchange ofheat and substances with surrounding environment, the time change rate ofpotential temperature and salinity can be expressed by Lagrange time derivativeas follows
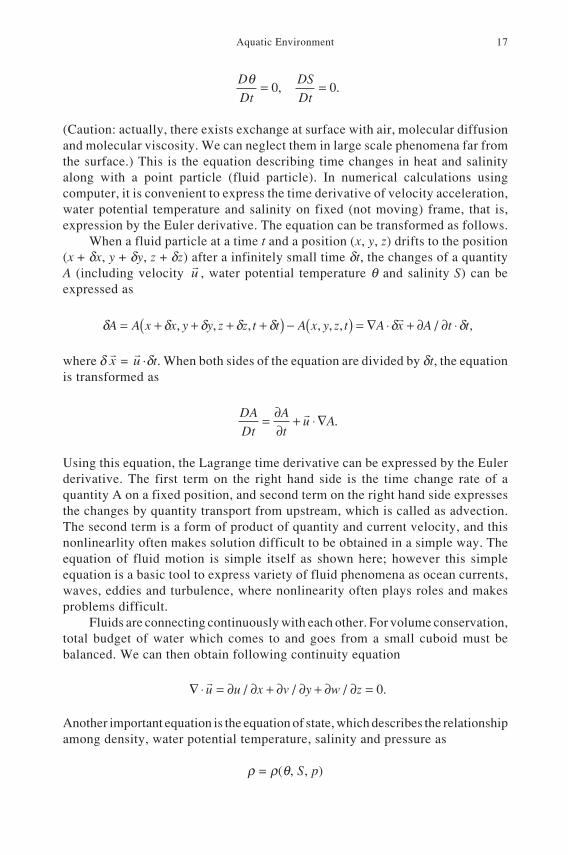
Aquatic Environment 17
D
Dt
DS
Dt
θ = =0 0, .
(Caution: actually, there exists exchange at surface with air, molecular diffusionand molecular viscosity. We can neglect them in large scale phenomena far fromthe surface.) This is the equation describing time changes in heat and salinityalong with a point particle (fluid particle). In numerical calculations usingcomputer, it is convenient to express the time derivative of velocity acceleration,water potential temperature and salinity on fixed (not moving) frame, that is,expression by the Euler derivative. The equation can be transformed as follows.
When a fluid particle at a time t and a position (x, y, z) drifts to the position(x + δx, y + δy, z + δz) after a infinitely small time δt, the changes of a quantityA (including velocity
ru , water potential temperature θ and salinity S) can be
expressed as
δ δ δ δ δ δ δA A x x y y z z t t A x y z t A x A t t= + + + +( ) − ( ) = ∇ ⋅ + ∂ ∂ ⋅, , , , , , / ,r
where δ rx =
ru ·δt. When both sides of the equation are divided by δt, the equation
is transformed as
DA
Dt
A
tu A= ∂
∂+ ⋅ ∇
r.
Using this equation, the Lagrange time derivative can be expressed by the Eulerderivative. The first term on the right hand side is the time change rate of aquantity A on a fixed position, and second term on the right hand side expressesthe changes by quantity transport from upstream, which is called as advection.The second term is a form of product of quantity and current velocity, and thisnonlinearlity often makes solution difficult to be obtained in a simple way. Theequation of fluid motion is simple itself as shown here; however this simpleequation is a basic tool to express variety of fluid phenomena as ocean currents,waves, eddies and turbulence, where nonlinearity often plays roles and makesproblems difficult.
Fluids are connecting continuously with each other. For volume conservation,total budget of water which comes to and goes from a small cuboid must bebalanced. We can then obtain following continuity equation
∇ ⋅ = ∂ ∂ + ∂ ∂ + ∂ ∂ =ru u x v y w z/ / / .0
Another important equation is the equation of state, which describes the relationshipamong density, water potential temperature, salinity and pressure as
ρ = ρ(θ, S, p)
18 Chapter I
(see Appendix 1 for detailed formulation).As 7 equations are given for 7 unknown variables, the unknown variables are
obtainable at least numerically. It is called as “numerical simulation” to computecurrents, temperature and salinity step by step from initial conditions withboundary conditions using computer. The computer simulation is useful toestimate future trend and so on. In the case when the calculation is doneexperimentally, it is called numerical experiment. Numerical calculation methodsfor meteorological and oceanographic phenomena have been developed andforecasting in climate and ocean currents is actively performed. However, it isimpossible to solve these equations in time and space resolution that can resolvemolecular diffusion and molecular viscosity to resolve turbulence, even usingmost advanced computer. Therefore, simplified equations obtained byapproximation are used in numerical simulations. Recently, ecological numericalsimulations are performed including biological and chemical process in thenumerical simulation.
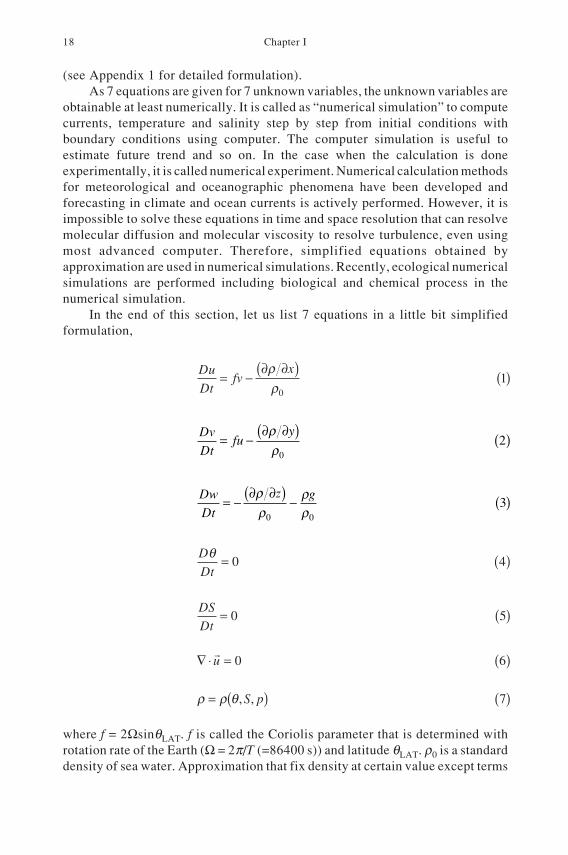
In the end of this section, let us list 7 equations in a little bit simplifiedformulation,
Du
Dtfv
x= −
∂ ∂( ) ( )ρρ0
1
Dv
Dtfu
y= −
∂ ∂( ) ( )ρρ0
2
Dw
Dt
z g= −∂ ∂( ) − ( )ρ
ρρρ0 0
3
D
Dt
θ = ( )0 4
DS
Dt= ( )0 5
∇ ⋅ = ( )ru 0 6
ρ ρ θ= ( ) ( ), ,S p 7
where f = 2ΩsinθLAT. f is called the Coriolis parameter that is determined withrotation rate of the Earth (Ω = 2π/T (=86400 s)) and latitude θLAT. ρ0 is a standarddensity of sea water. Approximation that fix density at certain value except terms
Aquatic Environment 19
of gravity, second term on right hand side of Eq. (3), is named Boussinesqapproximation and is commonly used in numerical calculation in Oceanography.
(Ichiro Yasuda)
2.4 Light environment
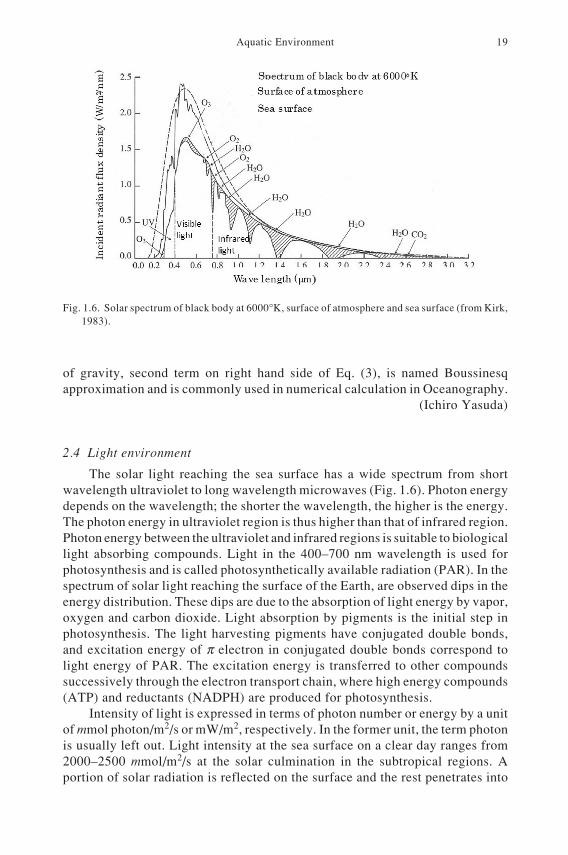
The solar light reaching the sea surface has a wide spectrum from shortwavelength ultraviolet to long wavelength microwaves (Fig. 1.6). Photon energydepends on the wavelength; the shorter the wavelength, the higher is the energy.The photon energy in ultraviolet region is thus higher than that of infrared region.Photon energy between the ultraviolet and infrared regions is suitable to biologicallight absorbing compounds. Light in the 400–700 nm wavelength is used forphotosynthesis and is called photosynthetically available radiation (PAR). In thespectrum of solar light reaching the surface of the Earth, are observed dips in theenergy distribution. These dips are due to the absorption of light energy by vapor,oxygen and carbon dioxide. Light absorption by pigments is the initial step inphotosynthesis. The light harvesting pigments have conjugated double bonds,and excitation energy of π electron in conjugated double bonds correspond tolight energy of PAR. The excitation energy is transferred to other compoundssuccessively through the electron transport chain, where high energy compounds(ATP) and reductants (NADPH) are produced for photosynthesis.
Intensity of light is expressed in terms of photon number or energy by a unitof mmol photon/m2/s or mW/m2, respectively. In the former unit, the term photonis usually left out. Light intensity at the sea surface on a clear day ranges from2000–2500 mmol/m2/s at the solar culmination in the subtropical regions. Aportion of solar radiation is reflected on the surface and the rest penetrates into
Fig. 1.6. Solar spectrum of black body at 6000°K, surface of atmosphere and sea surface (from Kirk,1983).
20 Chapter I
the ocean interior. The surface reflectance depends on incident angle of the lightand surface wave. Reflection is negligibly small when the light enters within 50°from the orthogonal axis to the surface. Downward irradiance decreasesexponentially with depth in the water.
Ez = E0e–kz. (8)
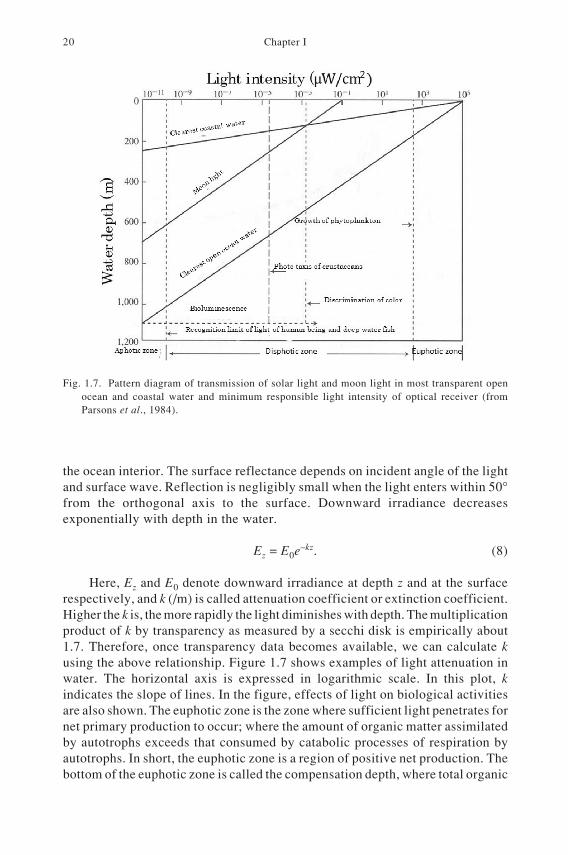
Here, Ez and E0 denote downward irradiance at depth z and at the surfacerespectively, and k (/m) is called attenuation coefficient or extinction coefficient.Higher the k is, the more rapidly the light diminishes with depth. The multiplicationproduct of k by transparency as measured by a secchi disk is empirically about1.7. Therefore, once transparency data becomes available, we can calculate kusing the above relationship. Figure 1.7 shows examples of light attenuation inwater. The horizontal axis is expressed in logarithmic scale. In this plot, kindicates the slope of lines. In the figure, effects of light on biological activitiesare also shown. The euphotic zone is the zone where sufficient light penetrates fornet primary production to occur; where the amount of organic matter assimilatedby autotrophs exceeds that consumed by catabolic processes of respiration byautotrophs. In short, the euphotic zone is a region of positive net production. Thebottom of the euphotic zone is called the compensation depth, where total organic
Fig. 1.7. Pattern diagram of transmission of solar light and moon light in most transparent openocean and coastal water and minimum responsible light intensity of optical receiver (fromParsons et al., 1984).
Aquatic Environment 21
matter production (gross primary production) is equal to loss by respiration.Since intensity of solar radiation changes in the day, the instantaneouscompensation depth varies with time. It is located at the surface during night, andreaches its deepest at the solar culmination. Therefore, the term compensationdepth is defined on a daily basis, where daily gross primary production equalsrespiration. The light intensity at the compensation depth is approximately 1% ofthat at the surface. The compensation depth is shallow in coastal areas andoccasionally it is less than several tens centimeters in highly turbid water. Incontrast, it is deeper and occasionally reaches 150 m or more in highly transparentopen oceans. The disphotic zone is located below the euphotic zone, where no netphotosynthesis occurs, but enough light reaches for visual recognition. This zoneis also called the twilight zone, and there are many luminescent organisms. Thedisphotic zone is ecologically important, because biological activity in this zoneconnects the organic matter production in the euphotic zone and the deep sea.From the view point of light environments, classifications of oceanic verticalzones, namely epipelagic, mesopelagic and bathypelagic zone respectivelycorresponds to the euphotic, disphotic and aphotic zone where no solar lightreaches.
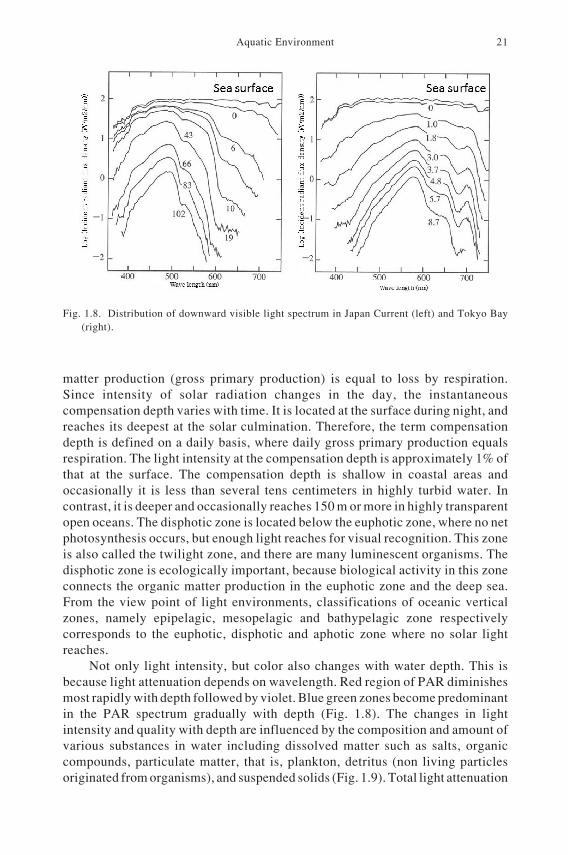
Not only light intensity, but color also changes with water depth. This isbecause light attenuation depends on wavelength. Red region of PAR diminishesmost rapidly with depth followed by violet. Blue green zones become predominantin the PAR spectrum gradually with depth (Fig. 1.8). The changes in lightintensity and quality with depth are influenced by the composition and amount ofvarious substances in water including dissolved matter such as salts, organiccompounds, particulate matter, that is, plankton, detritus (non living particlesoriginated from organisms), and suspended solids (Fig. 1.9). Total light attenuation
Fig. 1.8. Distribution of downward visible light spectrum in Japan Current (left) and Tokyo Bay(right).
22 Chapter I
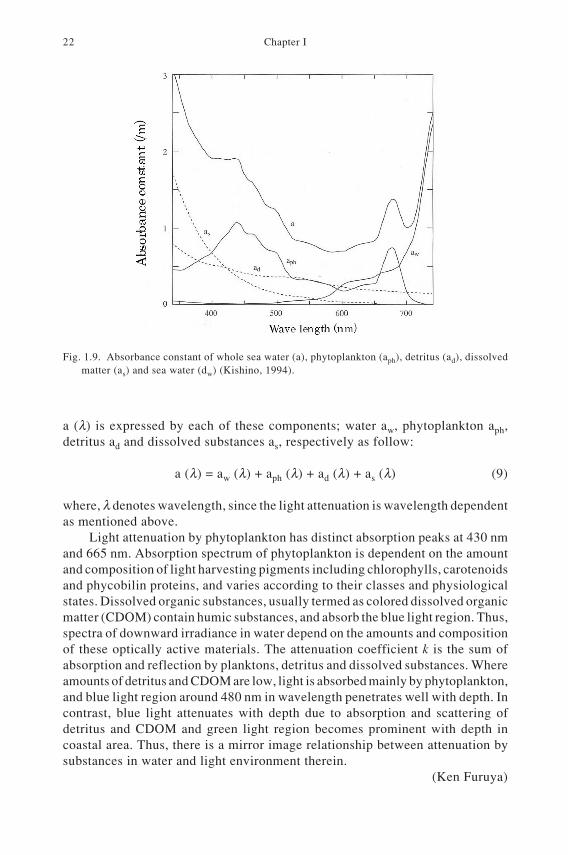
a (λ) is expressed by each of these components; water aw, phytoplankton aph,detritus ad and dissolved substances as, respectively as follow:
a (λ) = aw (λ) + aph (λ) + ad (λ) + as (λ) (9)
where, λ denotes wavelength, since the light attenuation is wavelength dependentas mentioned above.
Light attenuation by phytoplankton has distinct absorption peaks at 430 nmand 665 nm. Absorption spectrum of phytoplankton is dependent on the amountand composition of light harvesting pigments including chlorophylls, carotenoidsand phycobilin proteins, and varies according to their classes and physiologicalstates. Dissolved organic substances, usually termed as colored dissolved organicmatter (CDOM) contain humic substances, and absorb the blue light region. Thus,spectra of downward irradiance in water depend on the amounts and compositionof these optically active materials. The attenuation coefficient k is the sum ofabsorption and reflection by planktons, detritus and dissolved substances. Whereamounts of detritus and CDOM are low, light is absorbed mainly by phytoplankton,and blue light region around 480 nm in wavelength penetrates well with depth. Incontrast, blue light attenuates with depth due to absorption and scattering ofdetritus and CDOM and green light region becomes prominent with depth incoastal area. Thus, there is a mirror image relationship between attenuation bysubstances in water and light environment therein.
(Ken Furuya)
Fig. 1.9. Absorbance constant of whole sea water (a), phytoplankton (aph), detritus (ad), dissolvedmatter (as) and sea water (dw) (Kishino, 1994).
Aquatic Environment 23
3. CHEMICAL ENVIRONMENT
3.1 Biophile elements
Living organisms require various elements for growth. C, H, O, N, P, Mg,Ca, K, S and Si are required relatively in large amount. In contrast, Fe, Mn, Cu,Zn, B, Mo, V and Co are required in relatively small amounts. These essentialelements are named as biophile elements. Relative concentrations of biophileelements between plankton and seawater differ among elements: while carbonand potassium concentrations are higher in seawater, those of nitrogen, phosphorusand silica are higher in plankton body than in sea water. This relative concentrationcan be regarded as supply and demand ratios of these elements, that is, demandsof the elements of which concentrations are lower in seawater exceed their supplyand such elements tend to be deficient. Some trace elements such as iron and zincas well as nitrogen, phosphorus, and silica are in short supply. These elements inshort supply play important roles in regulation of biological production in the sea,because these elements often limit primary production. Inorganic salts of nitrogen,phosphorus, and silica, viz NO3
–, NO2–, NH4
–, PO43– and Si (OH)4, are called
nutrient salts. The most abundant form of nitrogenous nutrients is nitrate. Whilenitrogen, phosphorus, and potassium are three most important elements infertilizers used in terrestrial ecosystems for increasing agricultural crop production,potassium exists in excess amount in seawater. Since concentrations of nutrientsalts are much higher than trace elements, and are required in higher amounts,nutrient salts are regarded as macro nutrients. Major biophile elements aresummarized below:
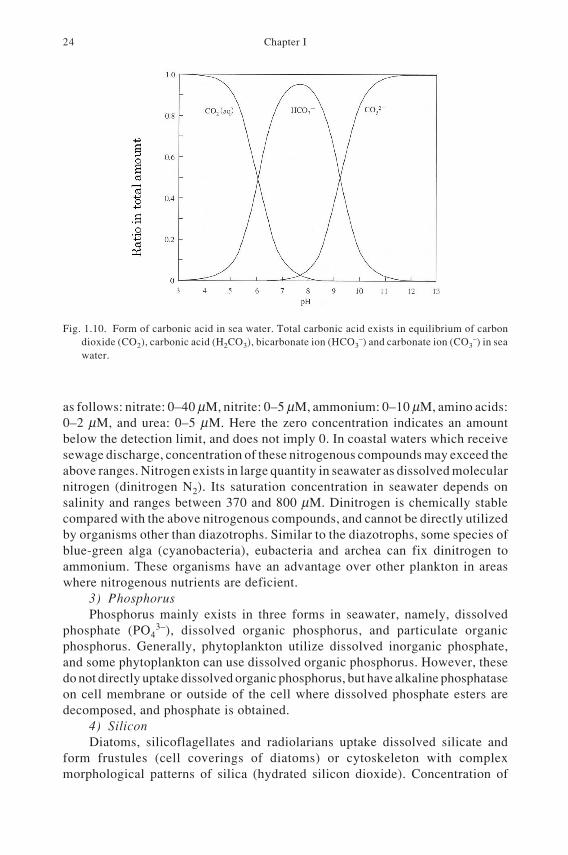
1) CarbonCarbon dioxide is dissolved in seawater and concentrations of carbonic ion,
bicarbonic ion, dissolved carbon dioxide and its hydrated form are in an equilibriumin seawater (Fig. 1.10). Their total amount in seawater is called total carbonate.Around pH 8, the common pH of seawater, bicarbonate is the dominant chemicalform, and the equilibrium shifts toward carbonate dominance at a higher pH, andshifts oppositely at a lower pH. Because of the presence of the equilibrium,seawater dissolves far more amount of total carbonate than expected from thesolubility of carbon dioxide. The concentration of total carbonate is about 2 mMin the epipelagic zone. This amount is sufficient for photosynthesis ofphytoplankton, and deficiency of carbon dioxide occurs rarely. Overall,concentration of carbon dioxide in the ocean is 50 times higher than that in the air.If 2% of carbon dioxide is released from the ocean into the air, the concentrationof carbon dioxide in the air will be doubled. Thus, the ocean is a huge pool ofcarbon dioxide, and together with its ecosystems plays a crucial role in carboncycling on this globe.
2) NitrogenNitrogen is an important element for metabolism of organisms, present in
protein, nucleic acid and other biomolecules. Major usable forms of nitrogen fororganisms are nitrate, nitrite, ammonium, and organic nitrogen such as aminoacids and urea. Concentrations of these chemical components in seawater range
24 Chapter I
as follows: nitrate: 0–40 µM, nitrite: 0–5 µM, ammonium: 0–10 µM, amino acids:0–2 µM, and urea: 0–5 µM. Here the zero concentration indicates an amountbelow the detection limit, and does not imply 0. In coastal waters which receivesewage discharge, concentration of these nitrogenous compounds may exceed theabove ranges. Nitrogen exists in large quantity in seawater as dissolved molecularnitrogen (dinitrogen N2). Its saturation concentration in seawater depends onsalinity and ranges between 370 and 800 µM. Dinitrogen is chemically stablecompared with the above nitrogenous compounds, and cannot be directly utilizedby organisms other than diazotrophs. Similar to the diazotrophs, some species ofblue-green alga (cyanobacteria), eubacteria and archea can fix dinitrogen toammonium. These organisms have an advantage over other plankton in areaswhere nitrogenous nutrients are deficient.
3) PhosphorusPhosphorus mainly exists in three forms in seawater, namely, dissolved
phosphate (PO43–), dissolved organic phosphorus, and particulate organic
phosphorus. Generally, phytoplankton utilize dissolved inorganic phosphate,and some phytoplankton can use dissolved organic phosphorus. However, thesedo not directly uptake dissolved organic phosphorus, but have alkaline phosphataseon cell membrane or outside of the cell where dissolved phosphate esters aredecomposed, and phosphate is obtained.
4) SiliconDiatoms, silicoflagellates and radiolarians uptake dissolved silicate and
form frustules (cell coverings of diatoms) or cytoskeleton with complexmorphological patterns of silica (hydrated silicon dioxide). Concentration of
Fig. 1.10. Form of carbonic acid in sea water. Total carbonic acid exists in equilibrium of carbondioxide (CO2), carbonic acid (H2CO3), bicarbonate ion (HCO3
–) and carbonate ion (CO3–) in sea
water.
Aquatic Environment 25
dissolved silicate is high in coastal waters and deep waters in the open ocean, andlow in the surface water.
5) Trace metalsSome metals including iron, magnesium, zinc, copper, cobalt, molybdenum
and selenium are essential elements for organisms required in extremely smallquantities. Some of them can be toxic in high concentration. As a component ofheme protein, Iron is important in energy metabolism in cells. Ionic iron is eitherbivalent or trivalent iron ion, and the latter is a common form in oxidative aquaticenvironments. Since the solubility of trivalent ironic ion in alkaline water such asseawater is very low, excess iron exists as particles which are not directly utilizedby organisms. Therefore dissolved iron concentration is extremely low in the sea,and the iron availability may control biological productivity. Large-scale irondeficiencies occur in the North Pacific subarctic water, Pacific equatorial regionand Antarctic Ocean. Major sources of iron supply to the ocean are riverdischarge, upwelling from deeper layers and dust deposition from the air. Inparticular, dust depositions is significant in distant oceanic regions from landmass, where other sources are insignificant. Yellow sand from the Chinese desertis an important iron supply for oceanic phytoplankton in the Pacific, while it oftencause health issues in the East Asian countries.
Chelating substances in seawater are important in the availability of trace
i
i
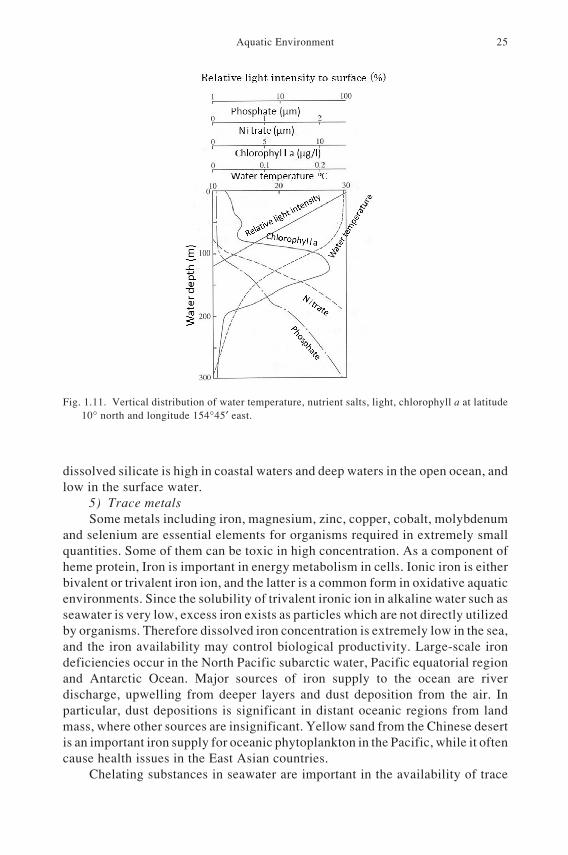
Fig. 1.11. Vertical distribution of water temperature, nutrient salts, light, chlorophyll a at latitude10° north and longitude 154°45′ east.
26 Chapter I
metals for organisms. When a metal forms a strong complex with a chelatingsubstance, it can be difficult for organisms to absorb the metal. Toxicity of metalscan be reduced when they form a complex compared with its free state. Whileorigins and sources of chelating substances are not well understood presently,various biological activities appear to be responsible.
3.2 Chemical environment in open ocean
Chemical environment of the open ocean can be characterized by lowconcentrations of nutrient salts near the surface. Vertical distributions of nitrateand phosphate in a region where stratification develops in the upper water columnthroughout the year, shows that both nutrient salts are exhausted near the surface(Fig. 1.11). Concentrations of nutrients increase rapidly with depth in the vicinityof thermocline, that is, below the surface mixed layer. Nutrients are consumedactively by phytoplankton near the surface, but the thermocline prevents upwardtransport of nutrient salts from the deeper layer. The layer where concentrationsof nutrients rapidly increase with depth is the nutricline, which is often locatedat the depth where the light intensity is 0.1–1% of that at the surface. Below thenutricline concentrations of nutrient salts increase with depth and reach stableconcentrations in deeper layer than 1 km (Fig. 1.4). Below the euphotic zone,regeneration of nutrients from organic matter through mineralization byheterotrophic organisms such as zooplankton and bacteria exceeds the consumptionby phytoplankton due to light deficiency leading to accumulation of nutrients.Mineralization of organic matter also occurs in the euphotic zone, but theconsumption by phytoplankton exceeds the mineralization.
3.3 Chemical environment in coastal waters and estuary
Coastal water is the area between the land and open ocean. Here, we adoptthe definition by E. Haeckel who defined coastal water as an area between thecoast line and 200 m depth. The 200 m depth corresponds to the outer boundaryof the continental shelf. Enclosed and semi enclosed coastal areas such as baysand inland seas are surrounded by land mass. Water exchange between the insideand outside of an enclosed area depends on the topography and depth, and isgenerally limited. Tokyo Bay, Ise Bay, and Seto Inland Sea are typical enclosedbays.
The coastal waters are under influences of material supply from land, inparticular, in the vicinity of highly populated big cities and industrialized areas,where anthropogenic pollutants and nutrients are released as sewage effluent andagricultural run-off carrying fertilizers. Various substances are transported fromforests, arable lands and cities into coastal waters, including inorganic substances(nutrient salts, heavy metals, sand, etc.), organic substances (living drainagessuch as dietary oil and food waste, human excretion, manmade harmful organismssuch as PCB and dioxin, plastics, etc.), radioactive wastes and so on. In anextreme rhetoric, as a land-side end of water circulation, coastal water mayreceive all residuals and wastes from land. Stable toxic substances such as heavy
Aquatic Environment 27
metals tend to accumulate within organisms through trophic chains. This is calledbiological concentration. Using of transported substances from land as resources,productivity of marine organisms is generally high in coastal areas. Coastalwaters are also influenced by material supply from bottom. Because of its shallowdepth, material accumulated on the bottom can easily reach near the surface byre-suspension caused by physical turbulence, such as wind-induced verticalmixing.
Eutrophication is an increase in concentrations of nutrient salts such asnitrogen and phosphorus from an oligotrophic condition (low concentrations) toan eutrophic condition (high concentrations) resulting in high primary productivityof the ecosystem. Eutrophication occurs very slowly in deep lakes as a naturalprocess by sedimentation of sand, soil and plant litters and other biogenicmaterials. However, recent human-related eutrophication poses seriousenvironmental problems. Eutrophication of some coastal areas, in particular inenclosed and semi-enclosed areas has been accelerated from the mid 20th centuryin developed countries. As a result, high standing stocks of phytoplankton persistin eutrophic waters, and red tides occur frequently. Typical symptoms of theprogress of eutrophication are lowering of transparency (high turbidity), andincrease in Chemical Oxygen Demand (COD). The reduced transparency impliesattenuation of light by high abundance of plankton and detritus. COD defined asthe amount of oxygen required for oxidization of organic substances in water, isthe most common measure of eutrophication. At an early phase of eutrophication,both the pelagic and benthic fish catch may increase due to increased biomass offood plankton. However, along with further progress of eutrophication, seriousimpacts on both biota and chemical environments become evident.
Eutrophication influences not only plankton biomass but also the speciescomposition, because the change in chemical environment poses selective impactson organisms. For example, anthropogenic eutrophication generally results inincreased availability of nitrate, ammonium and phosphate, but not silicate.Therefore, such conditions favor species other than diatoms which requiresilicate as an essential element. In fact, phytoplankton assemblages in eutrophicwaters are often characterized by dominance of dinoflagellates and raphidophytesin western Japan. Such a change in species composition of phytoplankton induceschanges in zooplankton assemblages through trophic interaction, and these shiftsin plankton composition thus spread to the whole local ecosystem.
Formation of hypoxia and anoxia is a typical negative environmental impactof eutrophication. Accumulation of organic matters such as dead remains oforganisms, feces and other detritus proceeds with eutrophication. Organic mattersform soft sediments called sludge that are actively decomposed by bacteria andother heterotrophs. Dissolved oxygen is consumed during the process ofdecomposition. If the consumption of oxygen exceeds supply, oxygen content ofwater is exhausted to a certain level that affects the biological activity. This stateis called hypoxia, and an ultimate condition of hypoxia is anoxia. In summer whenthermocline is developed and the water column becomes stratified, seawaterbetween the near-surface and bottom does not mix much, and supply of oxygen
28 Chapter I
to the bottom is extremely limited. Consequently, anoxic condition prevails nearthe bottom, under which aerobic organisms cannot live, and are replaced byorganisms that can live under reductive conditions. Under anoxia, sulfate reducingbacteria consume organic materials and sulfate as an electron acceptor of electrontransport activity. By this, hydrogen sulfide, a toxic substance is produced. In theinner Tokyo Bay and Mikawa Bay in late summer, when prolonged wind blowstowards the offshore, a wind-induced upwelling occurs near the coast, and anoxicwater is transported from the bottom to surface. Organisms such as clams exposedto this upwelled anoxic water die. The resulting dead remains cause furtheranoxigenic consumption of sulfate, and thus a negative feedback proceeds.Hydrogen sulfite in the anoxic water is oxidized by dissolved oxygen to colloidalsulfur near the surface, which makes the sea surface greenish blue in color. Thisphenomenon is called the blue tide. This eerie color of blue tide is the worseconsequence of eutrophication on fisheries and coastal ecosystems.
3.4 Chemical environment of inland waters
Water pollution and eutrophication are serious issues in inland water as well.Pollution is caused by contamination of hazardous substances from the air,industrial drainage and sewage. In rivers, amount of organic matter isconventionally monitored by Biochemical Oxygen Demand (BOD), while CODis used as the index of water quality for lakes and ponds. BOD is defined as theamount of oxygen required for decomposition of organic substances bymicroorganisms within water. Thus, the different indices have been used forflowing (lotic) and stagnant (lentic) water systems.
4. DYNAMICS IN EUPHOTIC ZONE
4.1 Surface mixed layer
Stirring by surface wind or convection by surface cooling develop a surfacemixed layer characterized by vertical uniformity of temperature and so on. Aswill be described in next subsection (4.2), mixed layer depth h and mixed layertemperature T have a strong impact on biological productivity.
The time change rate of temperature (Lagrangian time derivative) DT/Dt inmixed layer is formulated by heat exchange at surface Q (W/m2) with air and byentrainment of cold subsurface water when the mixed layer deepens. Here we usethe notations of entrainment velocity we, entrained water temperature Td, fromjust beneath the mixed layer to mixed layer, and mixed layer temperature T.Temperature difference between the mixed layer and the entrained water isdenoted as ∆T = T – Td. Change in total amount of heat is expressed as
ρ δ δ δ ρ δ⋅ ⋅ +( ) ⋅ +( ) − ⋅[ ] = ⋅ + ⋅ ⋅ ⋅ ( )c h h T T h T Q t c h Td . 10
Left hand side means change in total heat amount of the mixed layer when the
Aquatic Environment 29
depth and the temperature increase to h + δh and T + δT after infinitely small timeδt. Right hand side is the sum of heat from the overlying atmosphere throughsurface net heat flux and heat by entrainment water, of which thickness is δh =we·δt where we is entrainment velocity. Change in total heat amount and the sumof heat exchange should be balanced. If we neglect δh·δT, because it is quadricproduct of small quantity, time change of the mixed layer temperature can beformulated as
ρ δ δ ρ ρ⋅ ⋅ = = − ⋅ ⋅ ⋅ −( ) ( )c T t cDT Dt Q c w T Te d/ / . 11
Surface mixed layer develops more rapidly under stronger surface wind andstronger cooling conditions when the depth becomes deeper (we > 0). In warm andheating seasons (Q > 0), generally, stratification progress from surface; andformation of seasonal thermocline and mixed layer depth decreases. The layerbecomes deep when effects of wind stirring exceed the stratification by heating.
4.2 Surface mixed layer depth and biological production
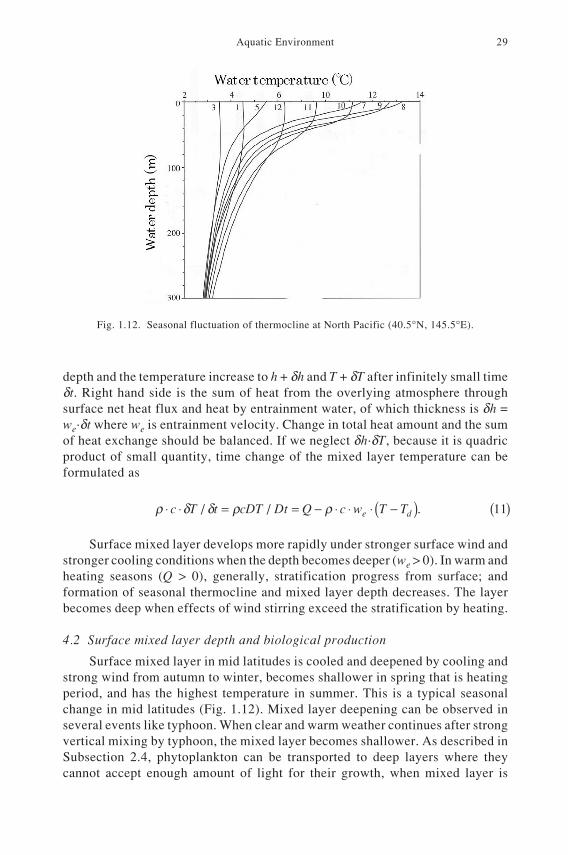
Surface mixed layer in mid latitudes is cooled and deepened by cooling andstrong wind from autumn to winter, becomes shallower in spring that is heatingperiod, and has the highest temperature in summer. This is a typical seasonalchange in mid latitudes (Fig. 1.12). Mixed layer deepening can be observed inseveral events like typhoon. When clear and warm weather continues after strongvertical mixing by typhoon, the mixed layer becomes shallower. As described inSubsection 2.4, phytoplankton can be transported to deep layers where theycannot accept enough amount of light for their growth, when mixed layer is
Fig. 1.12. Seasonal fluctuation of thermocline at North Pacific (40.5°N, 145.5°E).
30 Chapter I
deeper than compensation depth. The maximum depth of distribution ofphytoplankton, at which positive population growth of phytoplankton in themixed layer can be maintained is called critical depth. Critical depth is the depthwhere rates of respiration and photosynthesis are balanced when we integrate theamount along the depth in mixed layer (Sverdrup’s critical depth theory). Thistheory can explain the phenomena that phytoplankton biomass is smaller inwinter season when the mixed layer is deeper than critical depth and thatphytoplankton blooms rapidly in early spring when the mixed layer becomesshallower than the critical depth (spring bloom).
Using Eq. (8) in Subsection 2.4, energy for production by photosynthesis ata depth z can be expressed as Ez = E0e–kz (k is light attenuation coefficient). Whenwe express the amount of respiration converted to light energy as Ic. Total amountof photosynthesis (left side) and respiration in water column from surface tocritical depth are expressed as follows:
E e dz E e k I DkzD k Dc cr
r
cr cr00 0 1 12− − ⋅∫ = −[ ] = ⋅ ( ).
Here, we assume that rate of respiration does not depend on light intensity and isvertically uniform.
When mixed layer becomes shallower by heating or critical depth becomesdeeper by increasing solar radiation and elongation of day length with time from
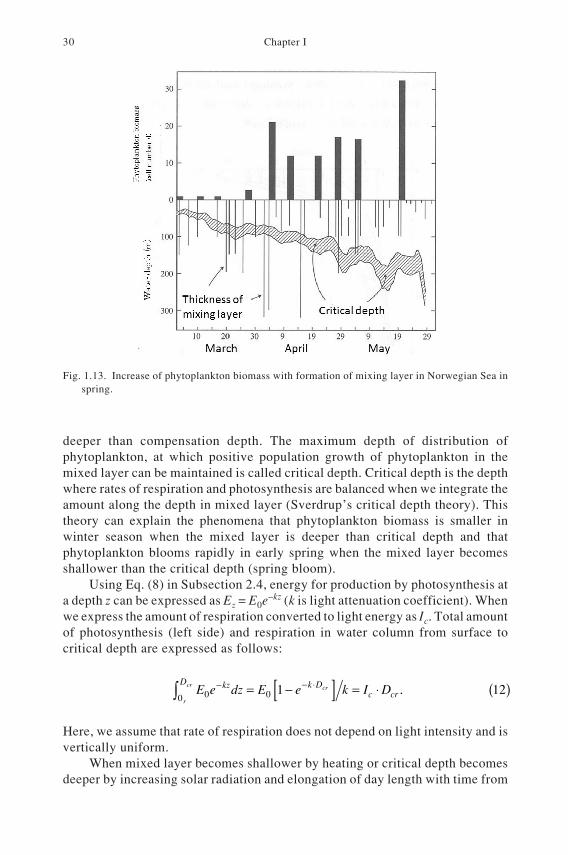
Fig. 1.13. Increase of phytoplankton biomass with formation of mixing layer in Norwegian Sea inspring.
Aquatic Environment 31
winter to spring, growth of phytoplankton is enhanced near the surface, and masspropagation called spring bloom starts (Fig. 1.13). The changes of mixed layerdepth and critical depths are actually complicated and influenced by weatherconditions such as passing of low atmospheric pressure and continuous clearweather. Mixed layer depth in Fig. 1.13 largely fluctuates from beginning to midApril. Standing stock of phytoplankton increases when mixed layer depth becomesshallower than critical depth. Figure 1.13 is modified from the original article onthe concept of critical depth (Sverdrup, 1953).
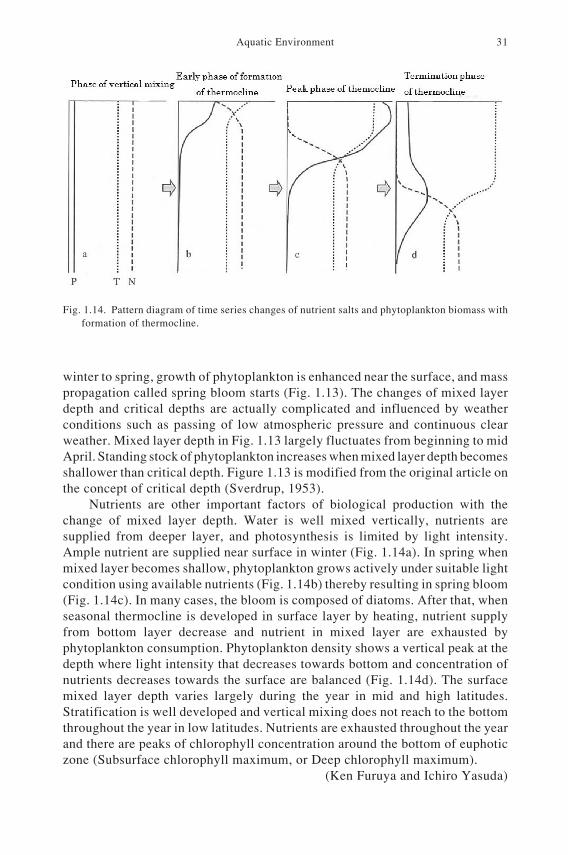
Nutrients are other important factors of biological production with thechange of mixed layer depth. Water is well mixed vertically, nutrients aresupplied from deeper layer, and photosynthesis is limited by light intensity.Ample nutrient are supplied near surface in winter (Fig. 1.14a). In spring whenmixed layer becomes shallow, phytoplankton grows actively under suitable lightcondition using available nutrients (Fig. 1.14b) thereby resulting in spring bloom(Fig. 1.14c). In many cases, the bloom is composed of diatoms. After that, whenseasonal thermocline is developed in surface layer by heating, nutrient supplyfrom bottom layer decrease and nutrient in mixed layer are exhausted byphytoplankton consumption. Phytoplankton density shows a vertical peak at thedepth where light intensity that decreases towards bottom and concentration ofnutrients decreases towards the surface are balanced (Fig. 1.14d). The surfacemixed layer depth varies largely during the year in mid and high latitudes.Stratification is well developed and vertical mixing does not reach to the bottomthroughout the year in low latitudes. Nutrients are exhausted throughout the yearand there are peaks of chlorophyll concentration around the bottom of euphoticzone (Subsurface chlorophyll maximum, or Deep chlorophyll maximum).
(Ken Furuya and Ichiro Yasuda)
Fig. 1.14. Pattern diagram of time series changes of nutrient salts and phytoplankton biomass withformation of thermocline.
32 Chapter I
5. MATERIAL CYCLING
5.1 Concept of primary production
Organic matter produced by plants through photosynthesis is distributed tovarious heterotrophic organisms through food chain. Finally, the organic matteris mineralized to inorganic matter by decomposers which are also heterotrophs,and is re-used by plants. The whole process is called material cycling, and occursthroughout the biosphere. Carbon, hydrogen, oxygen and nitrogen compose themain structure of the cycling as major elements and other biophile elementscirculate along with major elements. Driving force of the circulation is the lightenergy from the sun. Thus, production of organic matter by photosynthesis is thestarting point of material cycling, thus called the primary production. Primaryproduction is not exactly equal to photosynthesis, but includes the entire processesof organic matter production in which various biophile elements are incorporatedinto organic compounds originated from carbohydrate produced by photosynthesis.In photosynthesis, glucose is synthesized from carbon dioxide through reductionand chemical energy released during the light reaction of photosynthesis wheremolecular oxygen is produced as a byproduct of degradation of water. Primaryproduction is limited to the euphotic zone where sufficient intensity of solar lightcan penetrate. A rough indication of the lower limit is 0.1–1% of surface lightintensity. Major primary producers in open ocean are phytoplankton, whilemacro algae and sea-grass (angiosperms in sea such as Zosteraceae) are importantin shallow waters. Photosynthetic bacteria use hydrogen sulfite, thiosulfate ororganic substances as reducing power of carbon assimilation under anerobicconditions, and do not produce molecular oxygen. Primary production by oxygenicphotosynthesis is overwhelmingly large in ocean. Only in reductive environmentswhere sufficient light reaches but dissolved oxygen is very low, photosyntheticbacteria are the primary producer.
Driving force of primary production is not only photosynthesis, but alsoincludes chemosynthesis. In chemosynthesis energies obtained by oxidization ofinorganic substances such as hydrogen sulfite, sulfur, and ammonium are used forcarbon assimilation instead of light energy. A typical example can be found inhydrothermal vents where no light reaches but reducing substances are suppliedfrom vents. Thus, chemosynthesis depends on supply of reducing substances. Itis important locally, but in terms of amounts of organic matter produced,chemosynthesis is minor compared to photosynthesis.
Primary production and respiration functions as consumption and productionof carbon dioxide, respectively. As defined in Subsection 2.4, difference betweengross primary production Pg and net primary production Pn is respiration R ofphytoplankton.
Pg = Pn + Rp (13)
Net primary production is net amount of organic matter that can be utilized
Aquatic Environment 33
by organisms in the ecosystem. This definition is very clear, but in practice, netprimary production is difficult to measure. Let’s have a brief look at itsmeasurement procedure. First, seawater sample containing phytoplankton isintroduced into a number of transparent bottles. Some bottles (light bottles) areexposed to light, and the others (dark bottles) are kept in dark place. Both groupsof bottles are incubated for some period. In the light bottles organic matters areproduced by primary production (Pg) and a portion of the products are consumedby algal respiration (Rp). Thus the light bottles denote net primary production(Pn). In the dark bottles, photosynthesis does not occur and only respiration (Rp)takes place. Thus, gross production (Pg) can be derived from the above equation.However, by this process we cannot obtain algal respiration, because numeroussmall heterotrophic plankton including bacteria and zooplankton are present inthe water sample along with phytoplankton, and cannot be eliminated from thebottles. Thus, the respiration measured in the dark bottles denotes the sum ofrespiration by phytoplankton (Rp) and that by heterotrophic organisms (Rh). Thesum is called community respiration (Rc), and the above equation should bemodified as follow:
Pg = Pc + Rc (14)
Thus, in planktonic ecosystems, it is impossible to measure net primary productiondirectly, the net production is estimated with some assumptions.
5.2 Primary production in the ocean
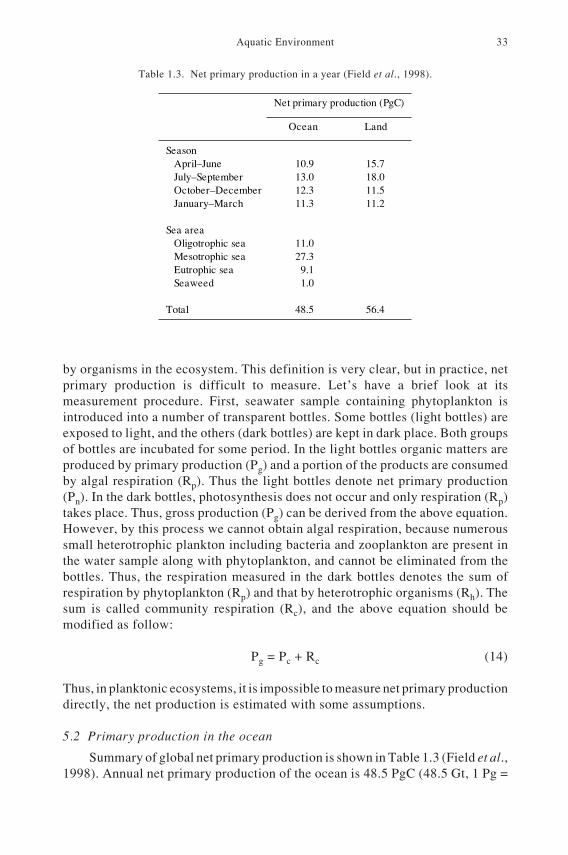
Summary of global net primary production is shown in Table 1.3 (Field et al.,1998). Annual net primary production of the ocean is 48.5 PgC (48.5 Gt, 1 Pg =
Table 1.3. Net primary production in a year (Field et al., 1998).
Net primary production (PgC)
Ocean Land
SeasonApril–June 10.9 15.7July–September 13.0 18.0October–December 12.3 11.5January–March 11.3 11.2
Sea areaOligotrophic sea 11.0Mesotrophic sea 27.3Eutrophic sea 9.1Seaweed 1.0
Total 48.5 56.4
34 Chapter I
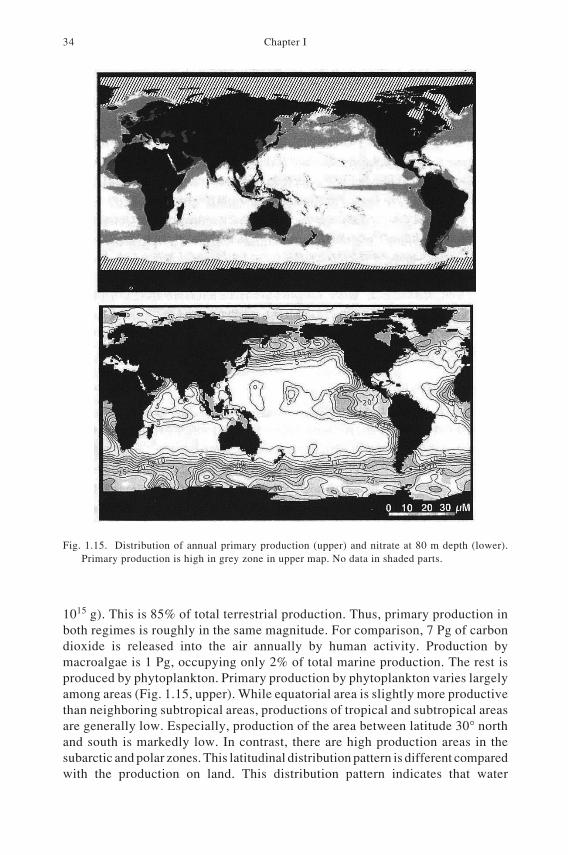
1015 g). This is 85% of total terrestrial production. Thus, primary production inboth regimes is roughly in the same magnitude. For comparison, 7 Pg of carbondioxide is released into the air annually by human activity. Production bymacroalgae is 1 Pg, occupying only 2% of total marine production. The rest isproduced by phytoplankton. Primary production by phytoplankton varies largelyamong areas (Fig. 1.15, upper). While equatorial area is slightly more productivethan neighboring subtropical areas, productions of tropical and subtropical areasare generally low. Especially, production of the area between latitude 30° northand south is markedly low. In contrast, there are high production areas in thesubarctic and polar zones. This latitudinal distribution pattern is different comparedwith the production on land. This distribution pattern indicates that water
Fig. 1.15. Distribution of annual primary production (upper) and nitrate at 80 m depth (lower).Primary production is high in grey zone in upper map. No data in shaded parts.
Aquatic Environment 35
temperature which regulates metabolic rates is not a major controlling factor ofprimary production. Let us compare the global distribution of primary productionwith that of solar light intensity and nutrient salts. Annual total solar radiation atthe surface decrease from the equator to higher latitudes, and this distributiondoes not match the primary production in Fig. 1.14a. On the contrary, thedistribution of nitrate at bottom of euphotic zone (80 m depth layer) that indicatedupward supply of nitrate well agrees with the distribution of primary production.Thus we can understand that major factor controlling global primary productionis the supply of nutrient salts to the euphotic zone.
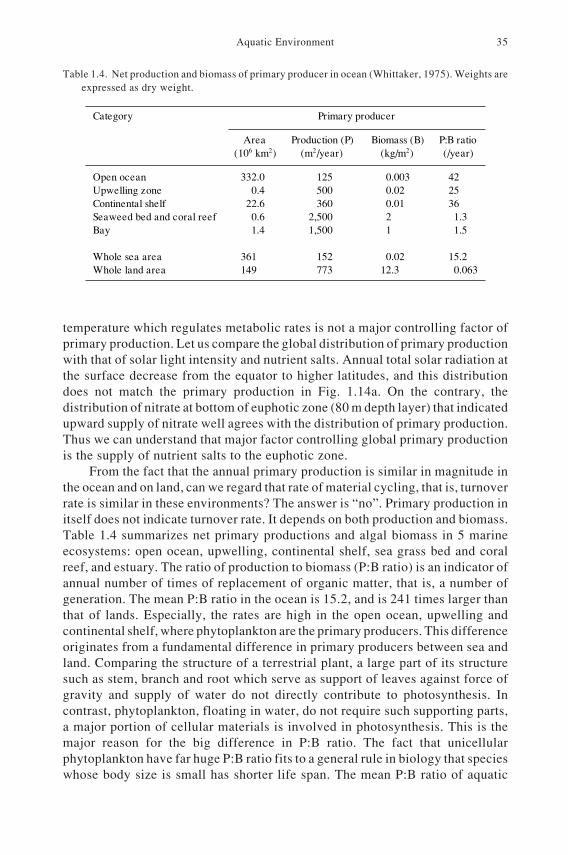
From the fact that the annual primary production is similar in magnitude inthe ocean and on land, can we regard that rate of material cycling, that is, turnoverrate is similar in these environments? The answer is “no”. Primary production initself does not indicate turnover rate. It depends on both production and biomass.Table 1.4 summarizes net primary productions and algal biomass in 5 marineecosystems: open ocean, upwelling, continental shelf, sea grass bed and coralreef, and estuary. The ratio of production to biomass (P:B ratio) is an indicator ofannual number of times of replacement of organic matter, that is, a number ofgeneration. The mean P:B ratio in the ocean is 15.2, and is 241 times larger thanthat of lands. Especially, the rates are high in the open ocean, upwelling andcontinental shelf, where phytoplankton are the primary producers. This differenceoriginates from a fundamental difference in primary producers between sea andland. Comparing the structure of a terrestrial plant, a large part of its structuresuch as stem, branch and root which serve as support of leaves against force ofgravity and supply of water do not directly contribute to photosynthesis. Incontrast, phytoplankton, floating in water, do not require such supporting parts,a major portion of cellular materials is involved in photosynthesis. This is themajor reason for the big difference in P:B ratio. The fact that unicellularphytoplankton have far huge P:B ratio fits to a general rule in biology that specieswhose body size is small has shorter life span. The mean P:B ratio of aquatic
Table 1.4. Net production and biomass of primary producer in ocean (Whittaker, 1975). Weights areexpressed as dry weight.
Category Primary producer
Area Production (P) Biomass (B) P:B ratio(106 km2) (m2/year) (kg/m2) (/year)
Open ocean 332.0 125 0.003 42Upwelling zone 0.4 500 0.02 25Continental shelf 22.6 360 0.01 36Seaweed bed and coral reef 0.6 2,500 2 1.3Bay 1.4 1,500 1 1.5
Whole sea area 361 152 0.02 15.2Whole land area 149 773 12.3 0.063
36 Chapter I
animals is also larger than that of terrestrial animals, reflecting the difference inprimary producers. The high P:B ratio of planktonic ecosystem implies that thesystem produces large amount of organic matter from relatively small biomass.This high turnover capacity is a characteristic nature of the aquatic ecosystem.
FURTHER COMMENT
Twentieth century is the first time when human being recognized that aquaticenvironments are disturbed by human activities, as exemplified by pollution byharmful and toxic substances, negative impacts of eutrophication with whichsubstances are not harmful and toxic in itself in normal concentration. We readnewspaper articles on environmentally negative issues almost everyday. Theissues used to be local, but recently many global issues become to be critical. Ourenvironments and their ecosystems are facing critical points (MillenniumEcosystem Assessment; http://www.millenniumassessment.org/en/index.aspx).The most serious problem of these phenomena is that those degradation processesproceed in high speeds which human being and organisms on the Earth have notexperienced. Can aquatic ecosystem adapt to such rapid changes?
CITED LITERATURE
Field, C. B., M. J. Behrenfield, J. T. Randrson and P. Falkowski (1998): Primary production of thebiosphere: Integrating terrestrial and oceanic components. Science, 281, 237–240.
Gleick, P. H. (1996): Water resources. p. 817–823. In Encyclopedia of Climate and Weather, Vol.2, ed. by S. H. Schneider, Oxford Univ. Press, New York.
Kirk, J. T. O. (1983): Light and Photosynthesis in Aquatic Ecosystems. 1st ed., Cambridge Univ.Press, New York, 528 pp.
Kishino, M. (1994): Interrelationships between light and phytoplankton in the sea. p. 73–92. InOcean Optics, ed. by R. W. Spinard, K. L. Carder and M. J. Perry, Oxford Univ. Press, NewYork.
Parsons, T. R., M. Takahashi and B. Hargrave (1984): Biological Oceanographic Processes. 2nd ed.,Pargamon Press, Oxford, 344 pp.
Sverdrup, H. U. (1953): On conditions for vernal blooming of phytoplankton. J. Cons. Int. Explor.Mer., 18, 287–295.
Whitakker, E. (1975): Communities and Ecosystems. 2nd ed., Macmillan, New York, 385 pp.
REFERENCE BOOKS
Lalli, C. M. and Parsons, T. R. (1997): Biological Oceanography. An Introduction. Elsevier.Parsons, T. R., M. Takahashi and B. Hargrave (1984): Biological Oceanographic Processes. 2nd ed.,
Pargamon Press, Oxford, 344 pp.Yanagi, T. (2004): UMI NO KAGAKU (Science of Sea). 2nd ed., Kouseisha-Kouseikaku, Tokyo, 137
pp. (in Japanese).