aquatic prey communities in southwest wood stork …...aquatic prey communities in southwest florida...
TRANSCRIPT
Aquatic Prey Communities in Southwest Aquatic Prey Communities in Southwest Florida Wood Stork Foraging SitesFlorida Wood Stork Foraging Sites
Shawn E. Liston, Jason A. Lauritsen and Jerome J. LorenzShawn E. Liston, Jason A. Lauritsen and Jerome J. Lorenz

South FL Wood Stork PopulationSouth FL Wood Stork Population
• Prior to 1970s 70% of U.S. WOST population nested inWOST population nested in South FL
• Corkscrew Colony
– Historically, largest colony in U.S.
6 000 nesting pairs in 1961 &– 6,000 nesting pairs in 1961 & 1966
– Recently, nesting is more intermittent ‐‐ a ‘good year’ is 2,000‐3,000 pairs

Wood Stork ForagingWood Stork Foraging
Storks are highly selective –
Utilize the highest quality prey patches q y p y pand abandon them quickly
(Gawlik 2002)

What are they eating?What are they eating?
Ogden, Kushlan & Tilmant (1976)

Southwest FLSouthwest FL(core foraging range of the Corkscrew Colony)(core foraging range of the Corkscrew Colony)(core foraging range of the Corkscrew Colony)(core foraging range of the Corkscrew Colony)
GOAL: To describe variation in dry season GOAL: To describe variation in dry season aquatic prey standing stock at Wood aquatic prey standing stock at Wood q p y gq p y gStork foraging sitesStork foraging sites
T l (i t d i t l)‐ Temporal (intra‐ and inter‐annual)
‐ Habitat

• Suburban &Suburban & agricultural interface
• Fragmented landscapep
• Rainfall‐driven hydrology
• Topography

Study DesignStudy Design
Corkscrew Swamp
Corkscrew Colony’s Core Foraging Area SanctuaryCore Foraging Area

Study DesignStudy Design
• 50 Sites

Study DesignStudy Design
( i )• 2007 (no nesting)– Jan‐May
– N=32
• 2009 (nesting)M M– Mar‐May
– N=18

Study DesignStudy Design
( i ) 16
17
Nest initiation
20092007 2008
• 2007 (no nesting)– Jan‐May
– N=32 14
15
16
BCA2
• 2009 (nesting)M M
12
13
14er level (ft) at
– Mar‐May
– N=18
10
11
12
Wat
May06
Nov06
May07
Nov07
May08
Nov08
May09
9

Study DesignStudy Design
• Agriculture (N=3)• Agriculture (N=3)
• Canal/Ditch (N=15)
• Cypress (N=7)
• Graminoid Prairie (N 19)(N=19)
• Pond/Lake (N=6)

AGRICULTURE

CANAL/DITCH

CANAL/DITCH

CANAL/DITCH

CYPRESS

GRAMINOID PRAIRIE

GRAMINOID PRAIRIE

POND/LAKE

2 to 6 throws/site depending on size

Community StructureCommunity Structure
ABUNDANCEEastern mosquitofish
Grass shrimp
ABUNDANCE
Aquatic beetles
Flagfish
Least killifish
Brown hoplo
= 93% of total

Community StructureCommunity Structure
BIOMASSABUNDANCEBrown hoplo
Eastern mosquitofish
BIOMASSEastern mosquitofish
Grass shrimp
ABUNDANCE
Florida gar
Flagfish
Aquatic beetles
Flagfish
Orinoco sailfin catfish
Oscar
Least killifish
Brown hoplo
= 85% of total= 93% of total

Community StructureCommunity Structure
BIOMASSABUNDANCEBrown hoplo
Eastern mosquitofish
BIOMASSEastern mosquitofish
Grass shrimp
ABUNDANCE
Florida gar
Flagfish
Aquatic beetles
Flagfish
Orinoco sailfin catfish
Oscar
Least killifish
Brown hoplo
= 82% of total= 93% of total

Temporal VariationTemporal Variation
FISH DENSITY (ln(#/m2)+1)8
FISH BIOMASS (ln(g/m2)+1)FISH DENSITY (ln(#/m )+1)
5
6
7FISH BIOMASS (ln(g/m )+1)
2
3
4
Jan Feb Mar Apr May0
1
2
20092007
Jan Feb Mar Apr May
No variation in Month(Year)
Total fish density 2.7X higher in 2009
No variation in Month(Year)
Total fish biomass 7.0X higher in 2009

Habitat VariationHabitat Variation
6
4
5
2
3Average length of fish (< 8 cm) is
50% greater in Pond/Lake(vs Graminoid Prairie & Cypress)
FISH BIOMASS (ln(g/m2)+1)
Agriculture Pond/ Canal/ Graminoid CypressAgriculture Pond/ Canal/ Graminoid Cypress
FISH DENSITY (ln(#/m2)+1)0
1(vs. Graminoid Prairie & Cypress)
Lake Ditch Prairie
No variation
Lake Ditch Prairie
Graminoid Prairie & Cypress density is 5.7X higher than Pond/Lake
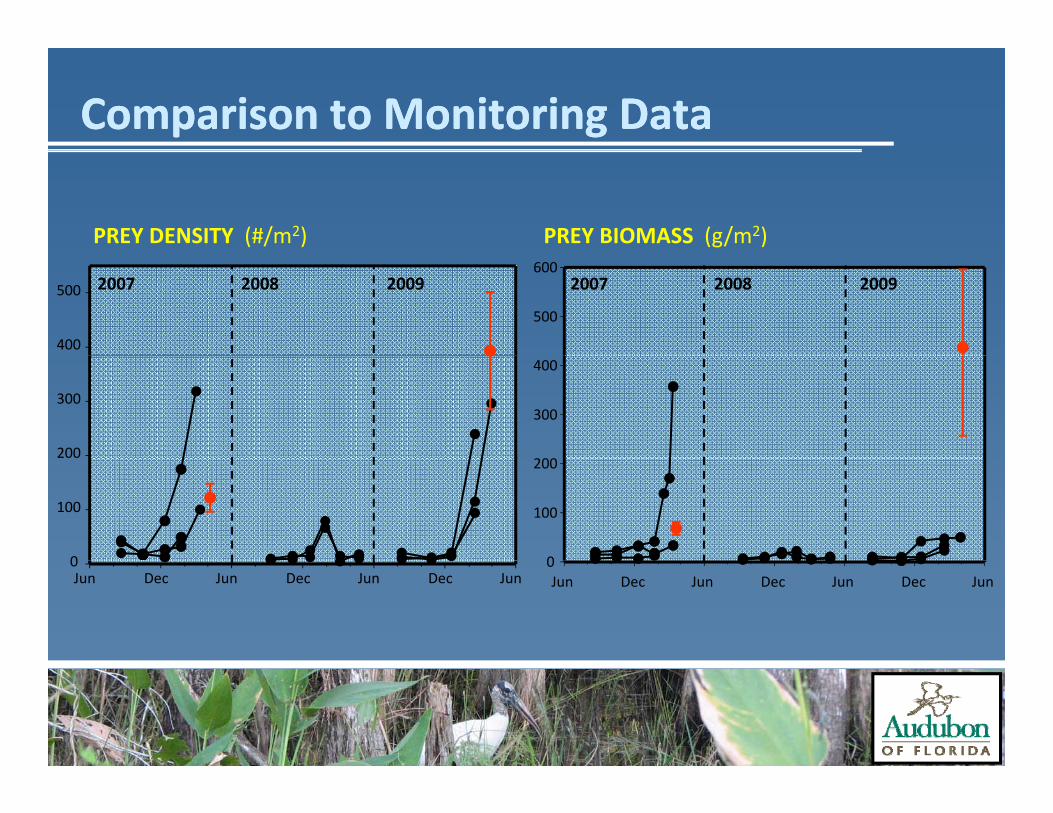
Comparison to Monitoring DataComparison to Monitoring Data
PREY BIOMASS (g/m2)PREY DENSITY (#/m2)
20082007 2009
500
600
400
500 20082007 2009
300
400
200
300
0
100
200
100
0Jun Dec Jun Dec Jun Dec Jun 0
Dec Jun Dec Jun Jun Dec Jun 0

Comparison to Other Studies/HabitatsComparison to Other Studies/HabitatsPREY BIOMASS (g/m2)
600
700
500
600PREY DENSITY (#/m2)
400
500
600
300
400
500
NI fishes
100
200
300
100
200
300
(excluding fish >8 cm)
0
100
0
12009 Late dry‐season, Liston & Lorenz (2009)22009, Botson & Gawlik (2010)3Concentration events, Lorenz (unpub)

‘Cream Skimmers’‘Cream Skimmers’200
100
120
150
80 Freque
–Day 1
Mechanism of selection?
100
40
60
ency –Day 4Fr
eque
ncy –
0
50
0
20
Day 4
Day 1
Length (SL, mm)Day 1: Avg = 18.7 ± 0.2
(N=1431)0 25 50 75 100 125 150
0
Fish Length (SL, mm)
( )
Day 4: Avg = 16.1 ± 0.4 (N=572)

ConclusionsConclusions
• In SW FL, biomass in late‐dry season foraging sites is dominated by large non‐native fishes (esp. brown hoplo & sailfin catfish)y g ( p p )
• Strong inter‐annual variation in prey abundance & biomass (little to no intra‐annual variation within the late dry season)
– High prey standing stock corresponded to a successful stork nesting season (but… N=2)
• Prey abundance varies among sites, but biomass is similar
• Foraging wading birds (including storks) remove largest fish first from foraging sites (function of fish behavior or size or both?)

ConclusionsConclusions
1. SW FL is historically, and consistently, one of the centers of Wood Stork nesting in FLcenters of Wood Stork nesting in FL
2. SW FL landscape is markedly different than other /South Florida/Everglades landscapes
3. To understand the dynamics that drive Wood Storks in SW FL, we must continue to study the prey‐base in this region

Future DirectionsFuture Directions
• Efforts must be made to understand the Wood Stork prey‐base early in the nesting season (and pre‐nesting)prey base early in the nesting season (and pre nesting)
• The impact of large non‐indigenous fish species (esp. armored catfish) on Wood Storks and other wadersarmored catfish) on Wood Storks and other waders needs further investigation
SW FL i d d i i i f di• SW FL is underrepresented in monitoring of wading birds and prey – efforts should be expanded in order to compliment existing Everglades monitoring effortscompliment existing Everglades monitoring efforts

Special thanks to…Special thanks to…
Dave Ceilley, Larry Bryan, Michael Bush, Dale Gawlik, Jennifer Rehage, Jana Newman, Vic Engel, Jennifer g , , g ,Stiner, Gretchen Ehlinger, Jim Snyder, Jim Burch, Ron Clark, Steve Schulze, Kevin Whelan, Raul Urgelles
Funding provided by NPS Critical Ecosystems Studies I i i i (CESI) d RECOVERInitiative (CESI) and RECOVER

and numerous intrepid field technicians and interns!

Study DesignStudy Design
• Selected sites with highest numbers of gstorks (effort made to represent different habitat types)habitat types)
• Landowner permission poften limiting factor for sampling (esp. agriculture)agriculture)


Tremendous Energy Requirement…Tremendous Energy Requirement…
One Wood Stork family (2 adults + 2 5 chicks) requires ~200 kg of live2.5 chicks) requires ~200 kg of live food during an average breeding season (Kahl 1964)season (Kahl 1964)
(estimated 2.5 g/small fish)
≈ 70,000 fish
(estimated 2.5 g/small fish)
70,000 fish

ll kStill working to better understand the links betweenthe links between wading birds and their aquatic preyq p y
Conceptual Ecological Model, RECOVER