aquaweb - abscm.seabscm.se/onewebmedia/81307051k_aquaweb_userguide... · management to the...
TRANSCRIPT

AquaWeb
User Guide
www.sulzer.com
EN
81307051K

Sulzer Page 2 of 98 Version K (2019-06-11)
81307051K
Copyright © 2019 Sulzer. All rights reserved. This manual, as well as the software described in it, is furnished under license and may be used or copied only in accordance with the terms of such license. The content of this manual is furnished for informational use only, is subject to change without notice, and should not be construed as a commitment by Sulzer. Sulzer assumes no responsibility or liability for any errors or inaccuracies that may appear in this book. Except as permitted by such license, no part of this publication may be reproduced, stored in a retrieval system, or transmitted, in any form or by any means, electronic, mechanical, recording, or otherwise, without the prior written permission of Sulzer. Sulzer reserves the right to alter specifications due to technical developments.

Sulzer Page 3 of 98 Version K (2019-06-11)
81307051K
Contents Introduction .............................................................................................................................................. 6
System requirements ............................................................................................................................... 6
Structure .................................................................................................................................................. 6
Login ........................................................................................................................................................ 7
The main screen ...................................................................................................................................... 8
Alarm overview .................................................................................................................................... 8
Logged on user .................................................................................................................................... 8
Contract levels ......................................................................................................................................... 9
Start screen ........................................................................................................................................... 10
Alarm list ................................................................................................................................................ 10
Alarm source .................................................................................................................................. 10
Severity class ................................................................................................................................. 10
Alarm status ................................................................................................................................... 10
Alarm events .................................................................................................................................. 10
Alarm notifications ......................................................................................................................... 11
Overview ........................................................................................................................................ 12
Event list ........................................................................................................................................ 15
Operator log ................................................................................................................................... 15
Map ........................................................................................................................................................ 16
Toolbar ........................................................................................................................................... 16
Navigation ...................................................................................................................................... 16
Legend ........................................................................................................................................... 17
Popup menu .................................................................................................................................. 17
Alarm list ........................................................................................................................................ 18
Remote control ...................................................................................................................................... 19
Overview ........................................................................................................................................ 19
Listing ............................................................................................................................................ 19
Online status .................................................................................................................................. 19
Cache ............................................................................................................................................ 19
Process mimics and signals list ..................................................................................................... 20
Toolbar ........................................................................................................................................... 20
Process mimic ............................................................................................................................... 22
Extended cache value collection ................................................................................................... 23
Signal lists ...................................................................................................................................... 24
Log lists .......................................................................................................................................... 25
Energy list ...................................................................................................................................... 25
Maneuver ....................................................................................................................................... 26
Multi Mimics ................................................................................................................................... 26
On screen diary ..................................................................................................................................... 27
Asset management ................................................................................................................................ 30
Overview ........................................................................................................................................ 30

Sulzer Page 4 of 98 Version K (2019-06-11)
81307051K
Equipment details .......................................................................................................................... 31
Energy calculation report ............................................................................................................... 32
Optimization ........................................................................................................................................... 33
Charts ................................................................................................................................................ 34
Filter panel ..................................................................................................................................... 35
Support for multiple axes ............................................................................................................... 37
Chart areas .................................................................................................................................... 37
High resolution chart ...................................................................................................................... 38
How to start second online log ...................................................................................................... 39
The zoom tool ................................................................................................................................ 40
Reports .............................................................................................................................................. 42
Filter panel ..................................................................................................................................... 42
Toolbar ........................................................................................................................................... 43
Zoom .............................................................................................................................................. 43
Alarm list ........................................................................................................................................ 44
High resolution sessions .................................................................................................................... 46
Data collection ................................................................................................................................... 47
Setup ..................................................................................................................................................... 48
Configuration change dialog .......................................................................................................... 48
Alarm management ........................................................................................................................... 48
Alarm groups ................................................................................................................................. 49
Overview ........................................................................................................................................ 50
Alarm group settings ...................................................................................................................... 50
Select alarms to include ................................................................................................................ 51
Select receivers ............................................................................................................................. 52
Rotate paging order ....................................................................................................................... 52
Areas ............................................................................................................................................. 53
Time settings ................................................................................................................................. 54
Working hours ................................................................................................................................ 55
Alarm causes ................................................................................................................................. 56
Other settings ................................................................................................................................ 57
Add new user ................................................................................................................................. 60
Add user to area ............................................................................................................................ 61
Enter vacation for user .................................................................................................................. 61
Edit user permissions .................................................................................................................... 62
Stations .............................................................................................................................................. 63
Edit station ..................................................................................................................................... 63
Functionality ................................................................................................................................... 64
Presentation settings ..................................................................................................................... 65
Communication settings ................................................................................................................ 65
Configuration ................................................................................................................................. 66
Fetch configuration from a GPRS/3G/4G station .......................................................................... 66
Sulzer Page 5 of 98 Version K (2019-06-11)
81307051K
Send stored configuration to a new station ................................................................................... 66
Change configuration for a GPRS/3G/4G station .......................................................................... 67
Remote control signals .................................................................................................................. 69
Installation complete ...................................................................................................................... 70
Chart templates ................................................................................................................................. 71
Edit chart template ......................................................................................................................... 71
Analogue signals ........................................................................................................................... 73
Digital signals ................................................................................................................................. 74
Scales ............................................................................................................................................ 74
Formulas ........................................................................................................................................ 76
Report templates ............................................................................................................................... 78
Edit report template ....................................................................................................................... 78
Channels ........................................................................................................................................ 79
Calculations ................................................................................................................................... 80
Formulas ........................................................................................................................................ 81
Display ........................................................................................................................................... 82
Settings .......................................................................................................................................... 83
Automatic maneuver .............................................................................................................................. 85
Trigger Formula Settings ............................................................................................................... 86
Delay .............................................................................................................................................. 89
Trigger repeating time interval ....................................................................................................... 89
Target ............................................................................................................................................ 90
Multi Mimic ............................................................................................................................................. 92
Multi mimic templates .................................................................................................................... 92
Edit multi mimic templates ............................................................................................................. 92
Formulas and signals .................................................................................................................... 94
Displaying a multi mimic ................................................................................................................ 95
Links ...................................................................................................................................................... 97

Sulzer Page 6 of 98 Version K (2019-06-11)
81307051K
Introduction AquaWeb is a control and monitoring system with a web interface to Sulzer controllers anywhere in the world. AquaWeb can manage alarms and send them out to different receivers via push notifications, e-mail and SMS. AquaWeb can collect log data for later analysis in graphical charts and alpha numeric reports. AquaWeb can also be used to remotely control different functions in the controller. AquaWeb can show status of the whole network and be setup with rules to prevent flooding and overflows. AquaWeb’s communication between equipment and server goes through highly secure private network APN (Access Point Name). This manual will focus on the web interface, both showing current application status and managing settings. The manual is built up with an introduction to the systems parts followed by the menus and tabs as headlines. It starts with the main tabs: Alarm list, Map, Remote control, On screen diary, Asset management and Optimization followed by the three sub tabs to Optimization. The main tab Setup is then followed by the seven sub tabs tied to it. The setup pages describe how to set up and configure each part of AquaWeb.
Figure 1 Overview of customers equipment connected to AquaWeb with Sulzer SIM cards and user connection via smartphones, tablets and computers
System requirements AquaWeb is a web-based system and therefore it’s necessary to have a working internet connection and a web browser such as Chrome, Safari, Firefox or Internet Explorer etc. AquaWeb connects through the secure https protocol with a valid certificate to any computer with any browser, iOS and Android smartphones and tablets
Structure AquaWeb is built up around seven main tabs. From the login page you end up on the Map tab.
Figure 2 AquaWeb’s main tabs.
Each main tabs leads to pages containing information of interest. The Alarm list contains the organizations alarms, the Map tab shows where the stations are placed geographical, Remote control leads to the process page, On screen diary to the organizations staff supervision of the plants, Asset management to the inventory of the plants, Optimization to analyze of log data and the Setup to configuration of all parts of AquaWeb. All part is described in this user guide
Figure 3 The Setup tab where all configuration of AquaWeb is done.

All contract levels
Sulzer Page 7 of 98 Version K (2019-06-11)
81307051K
Login Since the AquaWeb service requires authentication, the first thing you’ll see, when accessing the link provided in your welcome email, is the login page. Use the username and password supplied to you in the welcome email.
Figure 4 Login page
If you, at any time, forget your password you can always push the “Forgot password” button. Then you get to enter your email address and a new password is generated and sent to your mailbox. This new password, as well as the password in the welcome email, can be changed after logged in.
Figure 5 Request new password
Figure 6 Change password
When you have logged in you have access to different parts of AquaWeb. Some parts of AquaWeb, e.g. configuration functions, may not be available for you. All the commands, alarm acknowledgments and so forth that you perform will be tagged by your signature and saved by AquaWeb and it is therefore possible to view a list of all user activity to see what has been done with your equipment.

All contract levels
Sulzer Page 8 of 98 Version K (2019-06-11)
81307051K
The main screen Some parts of the AquaWeb site are common to all pages. The header contains the organization logo, the info bar, the alarm row and the navigation tabs. The information shown below the navigation tabs is changing depending on what page you’re visiting.
Figure 7 AquaWeb overview, the header and the navigation tabs.
Alarm overview In the headers info bar you get an overview of the alarms in your organization (in this example ABS Demo). The information is displayed in a matrix with rows showing status and columns showing severity. The first column shows personnel alarms, the second A-alarms and the third B-alarms. In the screen shot below we can see that there are no personnel alarms, 31 + 12 unacknowledged alarms (A + B) and 2 + 6 active alarms (A + B).
Figure 8 Info bar
The alarm row is displaying the oldest unacknowledged active alarm of the highest severity class. Next to the alarm text is an “Acknowledge” button you can use for acknowledging the displayed alarm. If you have entered the coordinates for the station you can also click on the “Map” button to show the station on the map page.
Figure 9 Alarm row
Logged on user The headers info bar also shows the organization name and the logged on user. Finally, there are three buttons from the dropdown menu. Starting from the top there is the logout button, the password button and the help button. The logout button obviously explicitly logs you out of AquaWeb. If you leave the browser running, you’ll be automatically logged out after 24 hours. The password button gives you a chance to set your own password and the show help button leads to the AquaWeb User Guide.
Figure 10 The headers dropdown list

All contract levels
Sulzer Page 9 of 98 Version K (2019-06-11)
81307051K
Contract levels AquaWeb offers two contract levels; Monitoring & reporting and Remote control & alarms. The monitoring & reporting contract level offers functionality such as viewing stations and receives log data. Automatic and manual data collection and visualization by charts and reports makes it possible to analyze the status and trends of the stations. It includes basic alarm indication, meaning alarms are possible to view on AquaWeb’s Alarm list tab. The second level, Remote control & alarms, also includes remote control and alarm handling. It makes it possible to look at the current status of a station and attempt a e.g. remote reset of motor protection devices before sending an engineer to site. It also includes alarm dispatch and routing. There are also some other features that only works in the Remote control & alarms level. Those features will be mentioned through this manual when necessary. The asset management is not an actual contract level.
Figure 11 Contract overview

All contract levels
Sulzer Page 10 of 98 Version K (2019-06-11)
81307051K
Start screen The main menu in the start screen is normally the map. The following chapters explains each main tab (Alarm list, Map, Remote control, On screen diary, Asset management, Optimization and Setup).
Alarm list First a few words about the alarm system and how to use and interpret the alarm list. All alarms share some common characteristics. They have an alarm source, a severity class and a status. Their status is changed by alarm events and they generate notifications sent to different receivers.
Alarm source All alarms have an alarm source. The source can be a signal from the external equipment, e.g. a motor protection that has tripped. Another type of alarm source is internal, e.g. from communication activities.
Severity class All alarms are classified and given a severity class from "A" to "C" with severity class "A" as the highest class. The oldest active alarm of highest severity class is always displayed in the alarm row, and an alarm with severity class "A" will remain in the alarm row even if new alarms are indicated, if the new alarms are of severity class "B" or "C". The severity class is also used for determining what type of alarm notifications to send from AquaWeb.
Alarm status An alarm can have one of these alarm statuses. Change of status for an alarm is carried out by alarm events, trigged either by the user or by the alarm source.
Alarm status Description
Normal (Off) The alarm is in the normal, i.e. deactivated state. Activated (On) The alarm source has indicated there is some problem in your
equipment. Acknowledged The alarm source has indicated there is some problem in your
equipment and a user has acknowledged the alarm condition. Blocked The alarm is blocked and will not be activated.
Alarm events An alarm event can be a status change caused by the alarm source, a system action or a user command. All events are time stamped and put in an event log. The list below describes the different events. NOTE sections regarding alarms sent out from the system is only for the higher contract level.
Event Event source Description
Activation The alarm source
The alarm is activated. If the alarm is blocked, the activation event is ignored. If the alarm status is "Normal", the status is changed to "Activated".
Deactivation The alarm source
The alarm is deactivated, i.e. the alarm source is no longer indicating any problem in your equipment. If the alarm status is "Acknowledged", the alarm status is changed to "Normal" otherwise the alarm status remains "Activated".
Acknowledgment A command from a user
The alarm is acknowledged by the user. If the alarm source is still indicating there is a problem in your equipment the alarm status is changed to "Acknowledged" otherwise the alarm status is changed to "Normal".
Reset in station A command from a user
The alarm is acknowledged by personnel locally at the station.

All contract levels
Sulzer Page 11 of 98 Version K (2019-06-11)
81307051K
Block A command from a user
The alarm status is changed to "Blocked". Use the Block command with caution since all alarm events are ignored for blocked alarms.
Unblock A command from a user
If the alarm source is indicating there is a problem in your equipment the alarm status is changed to "Activated" otherwise the alarm status is changed to "Normal".
Push snd The system Push notification to user’s smartphone. Android or iPhone Mail sent The system Mail sent to a user’s mailbox. Push dlv The phone Shows that the push has arrived to the user’s smartphone. Cause given A command
from a user The user has entered what caused the alarm.
Push Read The phone Push notification has been read by user.
Alarm notifications When an alarm is activated, alarm notifications are sent to different receivers. Which receivers will get a notification depends on how the alarm system is configured but some receivers are mandatory.
Notification receiver Description
Alarm list This is a mandatory receiver. Alarm row This is a mandatory receiver - the alarm row displays the latest alarm of
the highest severity class. Mobile phone Notifications to mobile phones are optional. This function is widely used
for sending notifications to on duty personnel so they can take action when an alarm condition is indicated. The notifications can be configured in such a way that different persons receive notifications from different parts of your equipment and also based on your duty schedule. Works with both SMS and Push for smartphones (Android and iOS)
Mailbox Notifications can be sent to mailboxes as well. Works in the same way as those to mobile phones.

All contract levels
Sulzer Page 12 of 98 Version K (2019-06-11)
81307051K
Overview The alarm list consists of four major parts: the header, the list itself, the command buttons and the filter parameters.
Figure 12 Alarm list overview
The header The header above the list shows the name of the view, number of alarms shown, current filter, list creation time and a print button.
Figure 13 List mode, number of alarms shown, filter description, creation time and print button
The list part The alarm list displays alarms from your stations. The list has two display modes - the status mode and the log (history) mode. You select the display mode (status or log) in the List type box. More about the different list types is described in the filter section below. Sometimes you want to group information by a certain part of the information. You can do this by dragging the column header to the area “Drag column here to group”. In the examples below the list is being grouped by station name.
Figure 14 Drag column header to group
Figure 15 List grouped by station name
You can change sort order by clicking on the column header. The arrow shows the current sort order. Arrow down means descending order.
All contract levels
Sulzer Page 13 of 98 Version K (2019-06-11)
81307051K
Figure 16 List sort order
The alarm list displays every alarm on one row. You select an alarm by clicking the checkbox to the left. By selecting an alarm, you make this alarm the target for the alarm commands described below.
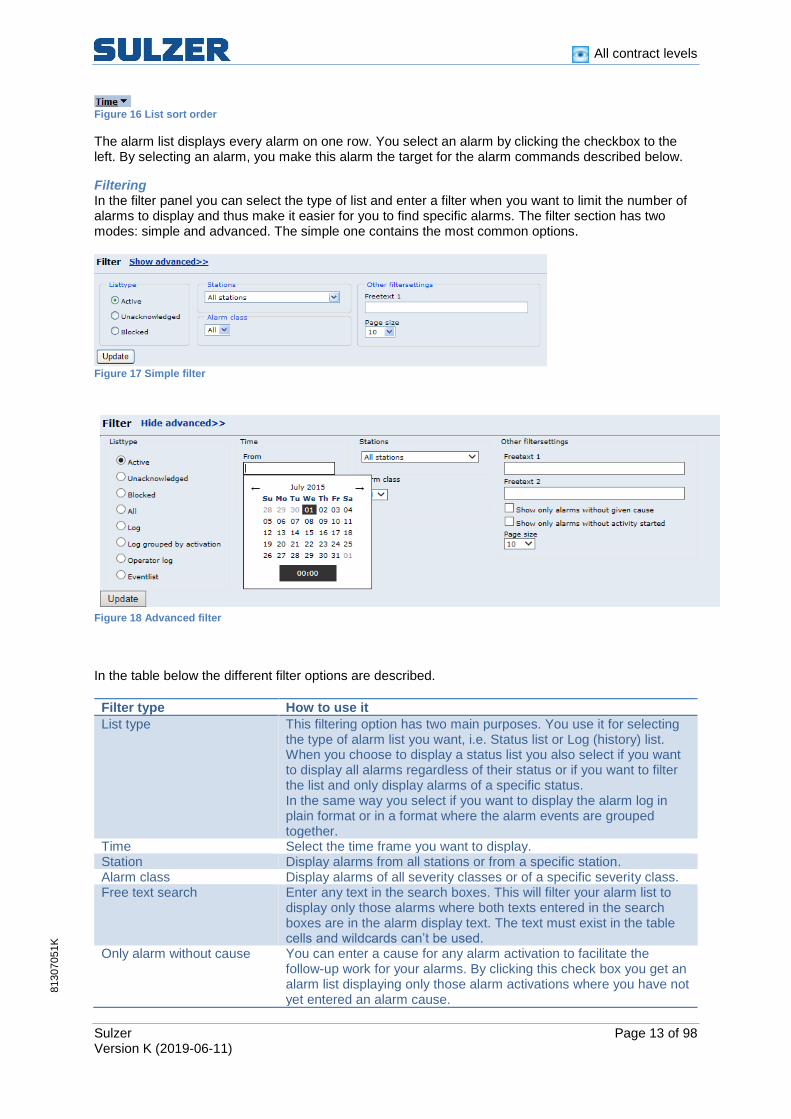
Filtering In the filter panel you can select the type of list and enter a filter when you want to limit the number of alarms to display and thus make it easier for you to find specific alarms. The filter section has two modes: simple and advanced. The simple one contains the most common options.
Figure 17 Simple filter
Figure 18 Advanced filter
In the table below the different filter options are described.
Filter type How to use it
List type This filtering option has two main purposes. You use it for selecting the type of alarm list you want, i.e. Status list or Log (history) list. When you choose to display a status list you also select if you want to display all alarms regardless of their status or if you want to filter the list and only display alarms of a specific status. In the same way you select if you want to display the alarm log in plain format or in a format where the alarm events are grouped together.
Time Select the time frame you want to display. Station Display alarms from all stations or from a specific station. Alarm class Display alarms of all severity classes or of a specific severity class. Free text search Enter any text in the search boxes. This will filter your alarm list to
display only those alarms where both texts entered in the search boxes are in the alarm display text. The text must exist in the table cells and wildcards can’t be used.
Only alarm without cause You can enter a cause for any alarm activation to facilitate the follow-up work for your alarms. By clicking this check box you get an alarm list displaying only those alarm activations where you have not yet entered an alarm cause.

All contract levels
Sulzer Page 14 of 98 Version K (2019-06-11)
81307051K
Only alarms without activity started
You can connect activities, for example a pump repair, to an alarm event. By clicking this check box you get an alarm list displaying only those alarm activations where you have not yet entered an alarm activity.
Page size Number of alarms to show in one page. If more alarms are shown, the paging appears below the list.
Commands You can perform a couple of commands for your alarms
Command Use the command when you want to:
Acknowledge Acknowledge the selected alarm. Paging calls for the alarm will stop when the alarm is acknowledged.
Block Block the selected alarm. Use this command when you want to block activations for alarms where the equipment is not working correctly and therefore sends a lot of false alarm activations.
Unblock Unblock a previously blocked alarm. The alarm returns to its previous status when it is unblocked.
Cause Enter a cause for alarm activation. Start activity To keep track on actions taken, you can enter the different activities
that follow an alarm activation.
To start a new alarm activity click on the “Start ?” link in the Activity column. An activity can have three different states: Not started, Started and Completed.
Figure 19 Alarm activity status
When you click the activity link (Start?) you can view and enter activities. You can also open the page Equipment details (See section Asset management).
Figure 20 Activity log

All contract levels
Sulzer Page 15 of 98 Version K (2019-06-11)
81307051K
Event list The event list shows all event counters activated in the stations. You can see the number of activations and you can reset the counter when needed, for example when a maintenance work is done. To view the Event list the filter must be set to advanced.
Figure 21 To view Event list set filter mode to advanced
Figure 22 Event list
Operator log All the commands, alarm acknowledgments, configuration changes and so forth that you perform will be tagged by your signature and saved by AquaWeb. These activities can be viewed in the operator log list. After changing a setting in the system, the user gets to enter a remark about what was done. This makes it possible to track who did what and why. The remark is then shown in the list. To view the operator log the filter must be set to advanced mode.
Figure 23 Operator log

All contract levels
Sulzer Page 16 of 98 Version K (2019-06-11)
81307051K
Map The map page shows a geographic overview of all your stations in the network and their current alarm status. The page consists of three parts: the toolbar, the map and the alarm list. Everything is tied together so if you change the map position, the alarm list is automatically updated to show the alarms for the selected region.
Figure 24 Map overview
Toolbar The toolbar simplifies navigating the map to common views. There are zoom buttons to the left. The back button takes you back to the previous position. The home button zooms and pans the map to show all stations in your organization. The warning button zooms and pans the map to show all stations with alarms. The search button lets you fill in search criteria with autocompleting, to find a specific station.
Figure 25 Map toolbar
Navigation Besides going to the shortcut positions via the toolbar there are many different ways you can change the map’s current position. To pan the map, drag it with the mouse in any direction or push the arrows on the keyboard. To zoom, push + - on keyboard or use scroll wheel or double click with the mouse. You can also click on the + - buttons on the map.
Figure 26 Zoom buttons

All contract levels
Sulzer Page 17 of 98 Version K (2019-06-11)
81307051K
Legend The stations are symbolized with different icons depending on the alarm status. If two or more stations are too close to show they are grouped together as a cluster in the map. In the table below the different symbols are explained.
Symbol Description
Station with normal status, no alarms.
Station with personnel alarm, unacknowledged. This symbol is blinking.
Station with personnel alarm, acknowledged but active.
Station with A-alarm, unacknowledged. This symbol is blinking.
Station with A-alarm, acknowledged but active.
Station with B-alarm, unacknowledged. This symbol is blinking.
Station with B-alarm, acknowledged but active.
Station setup without communication.
Cluster with normal status, no alarms.
One or more stations with personnel alarm, unacknowledged. This symbol is blinking.
One or more stations with personnel alarm, acknowledged but active.
One or more stations with A-alarm, unacknowledged. This symbol is blinking.
One or more stations with A-alarm, acknowledged but active.
One or more stations with B-alarm, unacknowledged. This symbol is blinking.
One or more stations with B-alarm, acknowledged but active.
Cluster setup without communication.
Arrow showing pumping direction.
Popup menu If you click on a cluster, the map zooms in to show all stations in the cluster. If you click on station a popup menu appears. This menu contains shortcuts to pages showing different aspects of the station.
Figure 27 Popup menu

All contract levels
Sulzer Page 18 of 98 Version K (2019-06-11)
81307051K
Alarm list To view the alarm list, click on the left pointing arrow to expand the list view:
Figure 28 Alarm list
Remote control & alarms
Sulzer Page 19 of 98 Version K (2019-06-11)
81307051K
Remote control
Overview Information below is for contract level CMS 251 Remote Control & Alarms. Sometimes it’s necessary to get a snapshot of the current status of the station. To view the current status of a station or to make a maneuver, click on the remote control-tab.
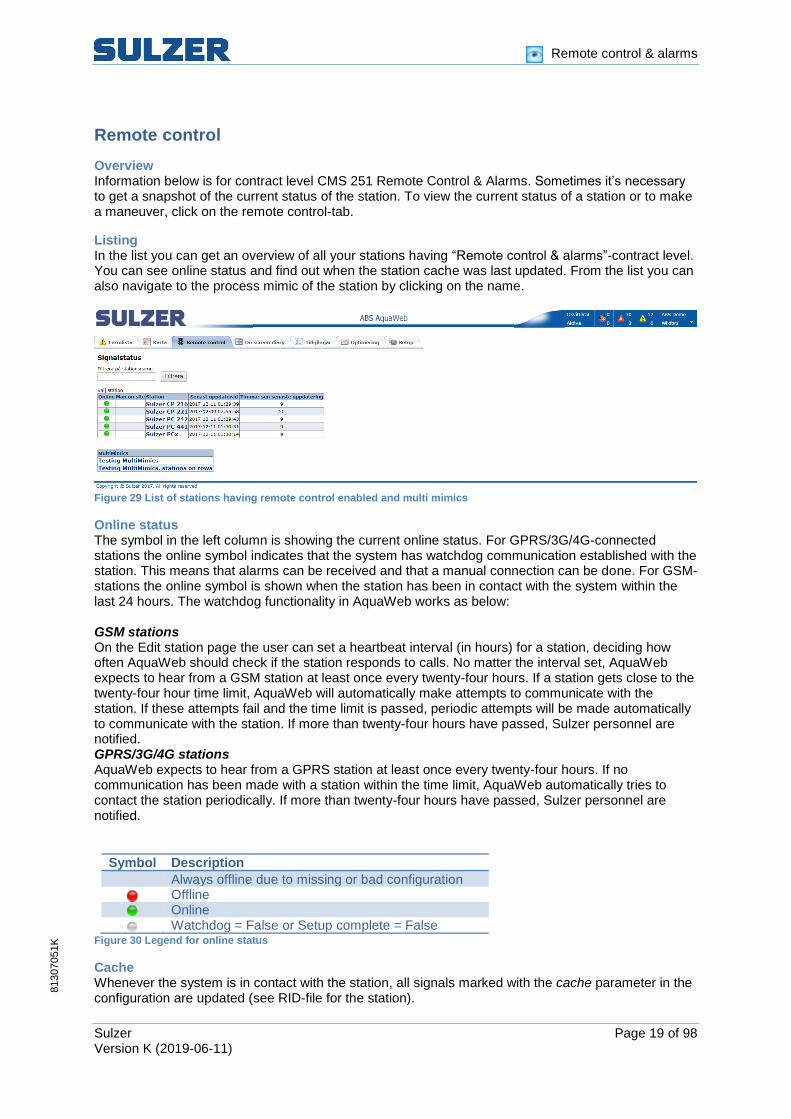
Listing In the list you can get an overview of all your stations having “Remote control & alarms”-contract level. You can see online status and find out when the station cache was last updated. From the list you can also navigate to the process mimic of the station by clicking on the name.
Figure 29 List of stations having remote control enabled and multi mimics
Online status The symbol in the left column is showing the current online status. For GPRS/3G/4G-connected stations the online symbol indicates that the system has watchdog communication established with the station. This means that alarms can be received and that a manual connection can be done. For GSM-stations the online symbol is shown when the station has been in contact with the system within the last 24 hours. The watchdog functionality in AquaWeb works as below: GSM stations On the Edit station page the user can set a heartbeat interval (in hours) for a station, deciding how often AquaWeb should check if the station responds to calls. No matter the interval set, AquaWeb expects to hear from a GSM station at least once every twenty-four hours. If a station gets close to the twenty-four hour time limit, AquaWeb will automatically make attempts to communicate with the station. If these attempts fail and the time limit is passed, periodic attempts will be made automatically to communicate with the station. If more than twenty-four hours have passed, Sulzer personnel are notified. GPRS/3G/4G stations AquaWeb expects to hear from a GPRS station at least once every twenty-four hours. If no communication has been made with a station within the time limit, AquaWeb automatically tries to contact the station periodically. If more than twenty-four hours have passed, Sulzer personnel are notified.
Symbol Description
Always offline due to missing or bad configuration Offline Online Watchdog = False or Setup complete = False
Figure 30 Legend for online status
Cache Whenever the system is in contact with the station, all signals marked with the cache parameter in the configuration are updated (see RID-file for the station).

Remote control & alarms
Sulzer Page 20 of 98 Version K (2019-06-11)
81307051K
Process mimics and signals list The remote control & alarms page shows the cached values for the station. If the station is currently connected the values shown are “live”. A while after the station is disconnected, the process mimic and the values in the lists are grayed out, marked as old, to remind you that they’re not the actual values any more, just a snapshot of the last known status. To update “live” status, see Figure 36 Extend session The page consists of three parts:
1. The toolbar 2. The process mimic 3. The list section.
Figure 31 Remote control page overview
Toolbar The toolbar enables you to perform commands tied to the station, and to navigate to other sections of the site with the station as a filter.
Figure 32 Remote control toolbar
1
2
3

Remote control & alarms
Sulzer Page 21 of 98 Version K (2019-06-11)
81307051K
The toolbar has the following set of commands:
Command Description
Back to list Takes you back to the list of stations Refresh Refreshes the display of the current station. This could be useful if the
station has been connected by either another user or by an alarm since your last update.
Request new values
Contacts the station and updates the cache values. If it’s a GSM station, the server sends a request via sms and the stations responds with the current signal status. If it’s a GPRS/3G/4G station, the server connects to the station and shows “live” values for 2 minutes and then disconnects again.
Chart Opens a new browser window showing the default chart for the station. Report Opens a new browser window showing the default report for the station.

Remote control & alarms
Sulzer Page 22 of 98 Version K (2019-06-11)
81307051K
Process mimic The process mimic shows the status of the station in a graphical view. Inflow, outflow, level and pump status are illustrated with texts and animations. In the station setup you can define which of the predefined system templates suits your station best. The mimics in figure 34 is a two pump station. Pump 2 is running. Signals in the process mimic are Level (2,13 m), Inflow (24,6 l/s), Outflow (112,5 l/s), Back pressure (0,7 bar) and Actual head based on system-and/or pump curve (9,25 m). Overflow sensor, high level float and low level float are all in a normal state.
Figure 33 Signals in mimics
Figure 34 process mimic with live values.
Figure 35 Values marked as old

Remote control & alarms
Sulzer Page 23 of 98 Version K (2019-06-11)
81307051K
Extended cache value collection When a user requests new values for a GPRS/3G/4G station, “live” values will be displayed for 4 minutes. When 1 minute remains, a dialog will appear below the process mimic allowing the user to extend the time cache values are collected and prevent them from being marked as old.
Figure 36 Extend session

Remote control & alarms
Sulzer Page 24 of 98 Version K (2019-06-11)
81307051K
Signal lists The signal lists show the current value for the cache signals. Depending on station type and configuration there may be one, two or three lists. The value column is shown in gray when marked as old.
Figure 37 Signal lists (example part from a PC441 station)
Remote control & alarms
Sulzer Page 25 of 98 Version K (2019-06-11)
81307051K
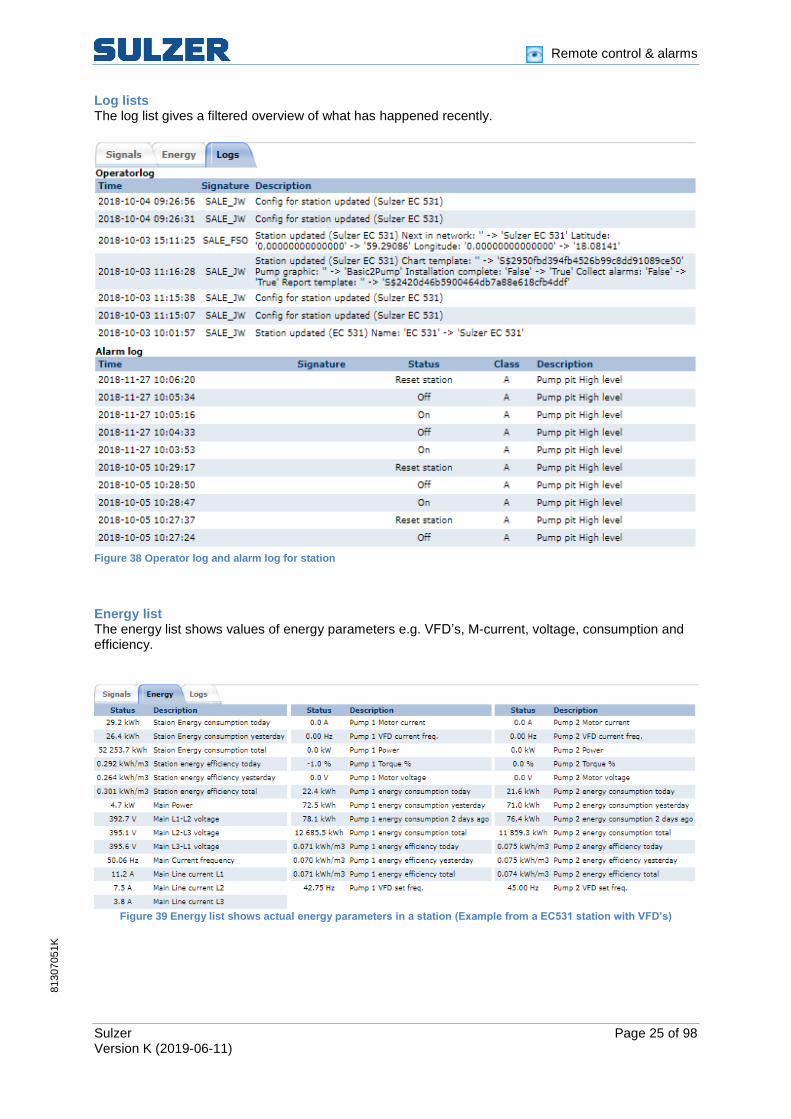
Log lists The log list gives a filtered overview of what has happened recently.
Figure 38 Operator log and alarm log for station
Energy list The energy list shows values of energy parameters e.g. VFD’s, M-current, voltage, consumption and efficiency.
Figure 39 Energy list shows actual energy parameters in a station (Example from a EC531 station with VFD’s)
Remote control & alarms
Sulzer Page 26 of 98 Version K (2019-06-11)
81307051K
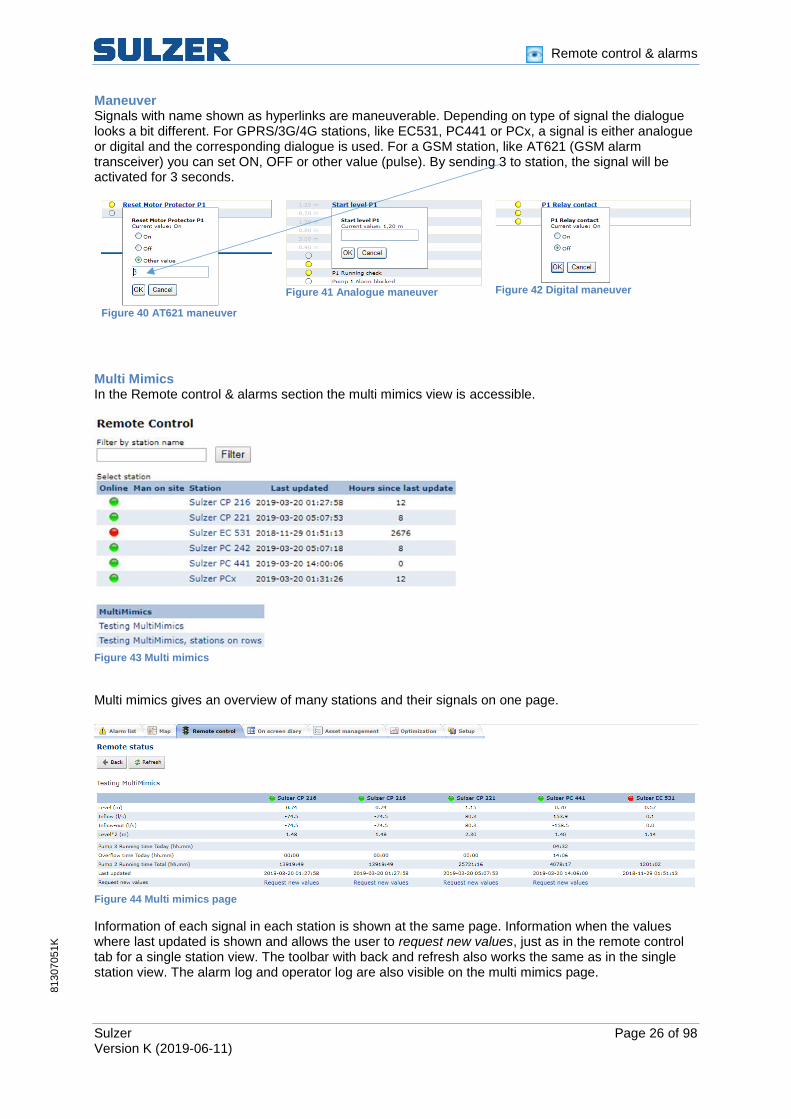
Maneuver Signals with name shown as hyperlinks are maneuverable. Depending on type of signal the dialogue looks a bit different. For GPRS/3G/4G stations, like EC531, PC441 or PCx, a signal is either analogue or digital and the corresponding dialogue is used. For a GSM station, like AT621 (GSM alarm transceiver) you can set ON, OFF or other value (pulse). By sending 3 to station, the signal will be activated for 3 seconds.
Figure 40 AT621 maneuver
Figure 41 Analogue maneuver
Figure 42 Digital maneuver
Multi Mimics In the Remote control & alarms section the multi mimics view is accessible.
Figure 43 Multi mimics
Multi mimics gives an overview of many stations and their signals on one page.
Figure 44 Multi mimics page
Information of each signal in each station is shown at the same page. Information when the values where last updated is shown and allows the user to request new values, just as in the remote control tab for a single station view. The toolbar with back and refresh also works the same as in the single station view. The alarm log and operator log are also visible on the multi mimics page.

Remote control & alarms
Sulzer Page 27 of 98 Version K (2019-06-11)
81307051K
On screen diary On screen diary is a tool to get an overview of the current personnel allocation and responsibilities to make sure that stations (in alarm groups) not are unattended. Select the period of interest in the date boxes either by entering the date directly or by clicking on the calendar and picking the date.
Figure 45 On screen diary overview
The tree to the left is grouped by areas, alarm groups, users and shift, which are all configurable under the setup tab. Areas could for example be categories, like electrical and mechanical, or geographical, like south municipality or north. The red line represents day time hours and the blue line on call hours. No line means vacation/absence and grey line means that the user does not exist in any alarm group. The alarm groups are the groups that are created under Setup -> Alarm management (see below):
Figure 46 Alarm groups
If you click on an alarm group on the On screen diary page, for example the group Standard tied to Area General (see below):

Remote control & alarms
Sulzer Page 28 of 98 Version K (2019-06-11)
81307051K
Figure 47 Alarm group Standard.
You will be redirected to the alarm management for that group.
Figure 48 Alarm group, redirected from On screen diary
In this example we can see three users in that alarm group during daytime. We will set up one of the user as vacation/absence during a period.
Figure 49 Users On screen diary
When clicking on a user you will be redirected to that user’s page for vacation/absence. Click on the icon for vacation/absence:
Figure 50 Setup vacation/absence
Setup the period the user will be off work:

Remote control & alarms
Sulzer Page 29 of 98 Version K (2019-06-11)
81307051K
Figure 51 Time period for the vacation/absence period.
Figure 52 Click on Add to store the registration.
After clicking on Add and then Back you can see in the On screen diary that there is a gap for that user during the period described above:
Figure 53 vacation/absence stored in the On screen diary.
The user only existed in one alarm group during daytime and therefore the line was red. The All users group is not an actual alarm group, it only shows all users in the system, they do not need to be tied to any alarm group, but their vacation/absence will be shown anyway.

Asset management
Sulzer Page 30 of 98 Version K (2019-06-11)
81307051K
Asset management
Overview On the “Asset Management” page you can view/register equipment details. If an Sulzer energy survey has been done in the station, you can also view station images and energy calculation reports. This type of calculation can only be done by Sulzer. To create an equipment list; go to Setup -> Stations and click on Show in column Equipment details:
Figure 54 Create an Equipment details page by clicking on Show.
You will be redirected to the Asset management page for equipment details.
Figure 55 Register equipment details via dropdown and free text. When the registration is done the station is added on the Asset management page.

Asset management
Sulzer Page 31 of 98 Version K (2019-06-11)
81307051K
Figure 56 Station list with Equipment details and Images.
Equipment details In the “Equipment details” page you can view and register all the details about the pumps and the application environment. If a pumping station survey is made by Sulzer, this type of information is automatically supplied.
Figure 57 Equipment details

Asset management
Sulzer Page 32 of 98 Version K (2019-06-11)
81307051K
Energy calculation report If Sulzer has made an energy calculation the conclusions in the report are based on the pumping station survey combined with many years of experience and know-how. It contains payback time for suggested actions, either repair or replace.
Figure 58 Energy calculation Pdf-report.
The photos taken during the survey can be uploaded and viewed in AquaWeb.
Figure 59 List of photos
Figure 60 Photo from a station
For more information regarding Asset management and MD681, please contact Sulzer.

All contract levels
Sulzer Page 33 of 98 Version K (2019-06-11)
81307051K
Optimization Log data is collected once every 24-hour from GPRS/3G/4G-connected stations. This data can be analyzed in two different ways in AquaWeb: charts with graphical view or reports with tabular data. The system includes preconfigured templates that work with standard pumping stations. A default template can be tied to each station. The templates contain visualization of values of general interest, like level, inflow, outflow, number of starts etc. To look at a chart or report, go to the optimization tab and click on the corresponding icon for Report or Chart. It opens up in a separate browser window. If you’d like to look at two charts at one time, just press the Ctrl-button on your keyboard when clicking the icon and it will open up another browser window. The following chapters explains Charts & Reports, High resolution session and Data collection. How a High resolution is started is explained in the part that follow the Chart chapter because it’s initiated from a chart.
Figure 61 Optimization overview with possibility to filter station of interest.

All contract levels
Sulzer Page 34 of 98 Version K (2019-06-11)
81307051K
Charts The chart page shows an overview of digital signals, A-alarms and analogue signals at the same time. It’s responsive and supported by touch/mobile devices. Support for multiple value axes. Navigation bar
for zooming and panning, horizontal helpline (in red), Smart date and time axis handling, which is
beneficial when zooming. Marker/ruler with balloons showing current value. Digital signals and alarms
integrated in chart. Integrated legend with show/hide functionality.
Figure 62 Upper part
Figure 63 Lower part

All contract levels
Sulzer Page 35 of 98 Version K (2019-06-11)
81307051K
Filter panel In the filter panel you define what to show in the chart.
1. Press left arrows to get earlier data in the format Day, Week or Month. 2. Press right arrows to get later data.
Figure 64 Filter panel
It’s also possible to use the slider on the top of the page for zooming and panning:
Figure 65 Filter panel
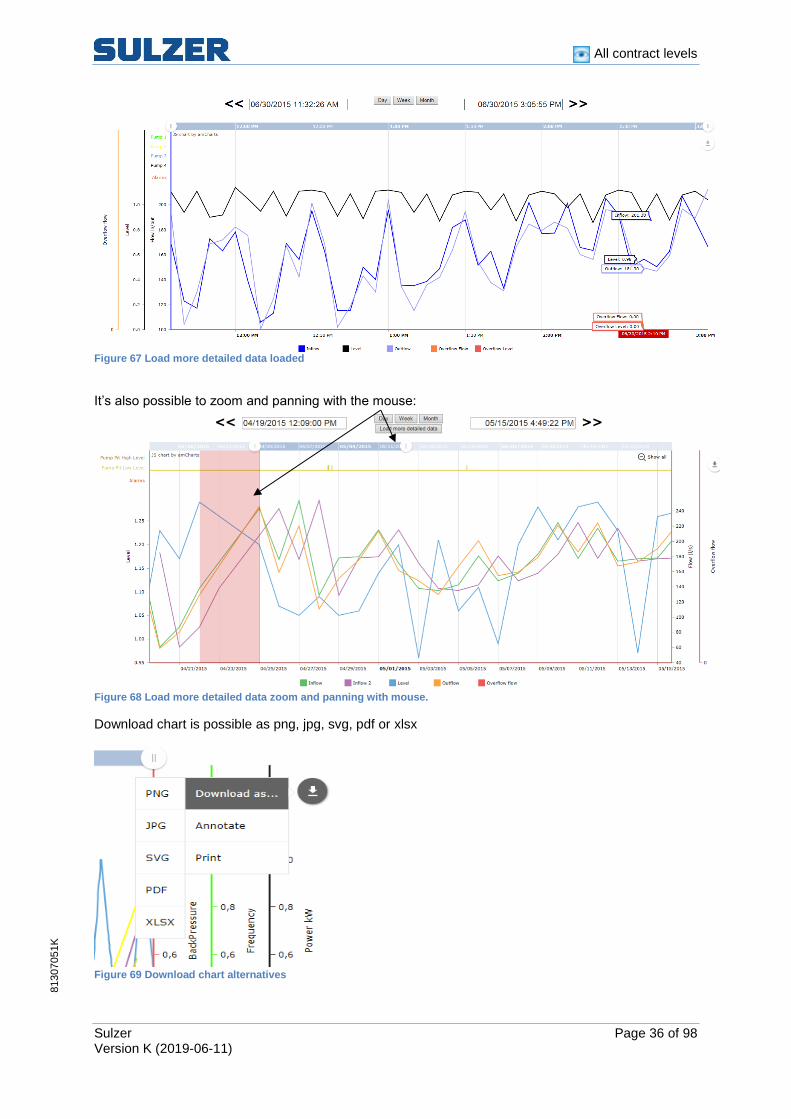
Load specific data in time interval by move the slider to the interval and press Load more detailed data:
Figure 66 Load more detailed data
All contract levels
Sulzer Page 36 of 98 Version K (2019-06-11)
81307051K
Figure 67 Load more detailed data loaded
It’s also possible to zoom and panning with the mouse:
Figure 68 Load more detailed data zoom and panning with mouse.
Download chart is possible as png, jpg, svg, pdf or xlsx
Figure 69 Download chart alternatives

All contract levels
Sulzer Page 37 of 98 Version K (2019-06-11)
81307051K
Support for multiple axes The chart functionallity supports multiple axes on both left and right side of the chart.
Figure 70 Multiple axis on the left side of the chart as well as on the right side of the chart
It’s possible to temporary hide signals from the chart by unticking the checkbox to get a cleaner view
Figure 71 Temporary uncheck signals.
Chart areas The chart consists of two areas connected with each other: the digital signals and the A-alarms in the top and the analogue signals in the bottom. A digital signal can be either high or low and this can be compared to the axis or by tooltip. All on events for A-alarms are represented by small A-icons. If you hold the mouse pointer over an icon a tooltip appears, with information about which alarm point it is and when the alarm event occurred.
All contract levels
Sulzer Page 38 of 98 Version I (2019-03-19)
81307051I
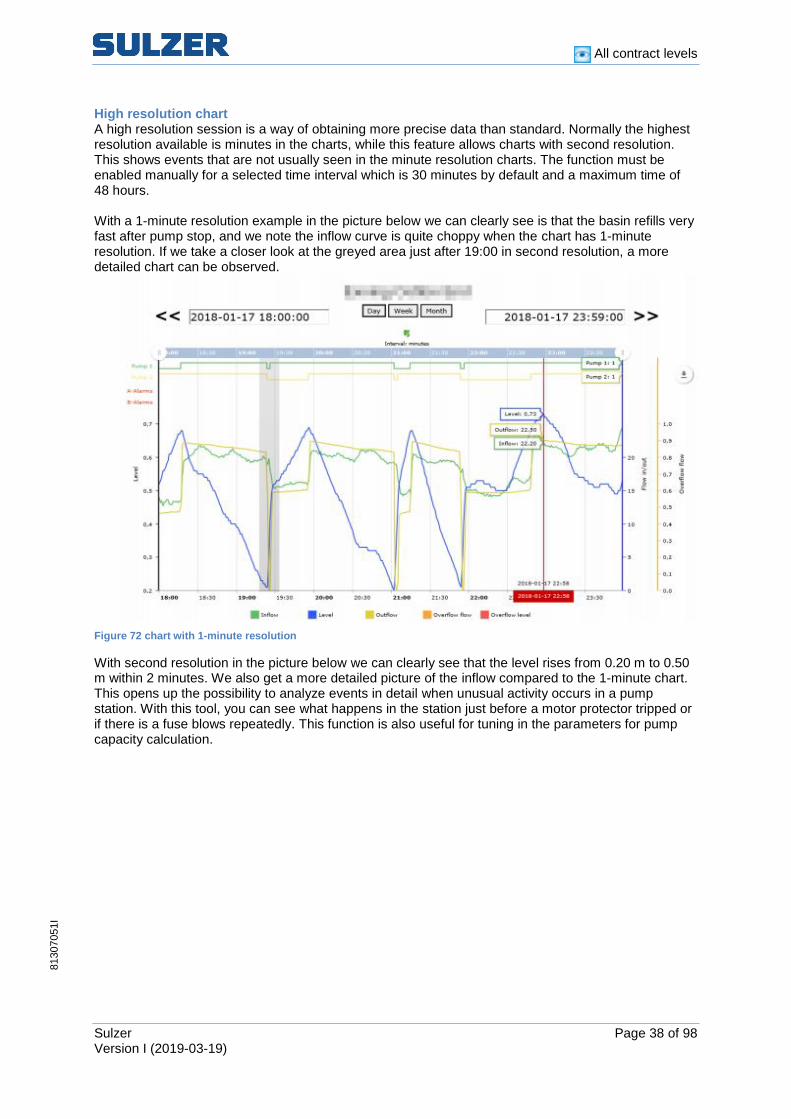
High resolution chart A high resolution session is a way of obtaining more precise data than standard. Normally the highest resolution available is minutes in the charts, while this feature allows charts with second resolution. This shows events that are not usually seen in the minute resolution charts. The function must be enabled manually for a selected time interval which is 30 minutes by default and a maximum time of 48 hours. With a 1-minute resolution example in the picture below we can clearly see is that the basin refills very fast after pump stop, and we note the inflow curve is quite choppy when the chart has 1-minute resolution. If we take a closer look at the greyed area just after 19:00 in second resolution, a more detailed chart can be observed.
Figure 72 chart with 1-minute resolution
With second resolution in the picture below we can clearly see that the level rises from 0.20 m to 0.50 m within 2 minutes. We also get a more detailed picture of the inflow compared to the 1-minute chart. This opens up the possibility to analyze events in detail when unusual activity occurs in a pump station. With this tool, you can see what happens in the station just before a motor protector tripped or if there is a fuse blows repeatedly. This function is also useful for tuning in the parameters for pump capacity calculation.

All contract levels
Sulzer Page 39 of 98 Version K (2019-06-11)
81307051K
Figure 73 chart with second resolution
How to start second online log A session is started from the chart by clicking the green arrow above the chart displaying collected values. The settings allow a user to decide a start time and a duration of up to 48 hours. If the user chooses a session of more than ten hours, a message will be displayed warning of possibly high data costs.
Figure 74 To start a session and the configuration window
The chart that will be used in the High Resolution is the same chart which are allocated for the station in the setup. If other signals are wanted, create a new chart in the tab Setup – Charts and allocate the new chart to the station to visualize the signals. If a session is started, information about it will be displayed in a table under the Optimization and High Resolution sessions tab. In the table it is possible for the user to write notes about each session. Sessions are saved here and can be deleted if desired. Other possibilities are jumping directly to the time span of the session in the corresponding chart or

All contract levels
Sulzer Page 40 of 98 Version K (2019-06-11)
81307051K
stop a started session as long as it has not already terminated. If a session is aborted, the end date of the session will be updated to reflect this. Finally, above the table is a search field enabling filtering on the Station and Notes columns.
Figure 75 Stored and ongoing sessions in High Resolution tab.
Because data is automatically collected every 24 hours, a session is required to spans over a midnight, a new “Collect New Values” must be done manually in Optimization – Data Collection tab. Just click on “Start” for the current station.
Figure 76 Data Collection tab
The zoom tool After a session of High Resolution Logging, open the chart from High Resolution Tab in AquaWeb. A more detailed view in the chart can be achieved by placing the mouse cursor at a specific time and left click and move the mouse to the right so we get a shaded area as the picture below.

All contract levels
Sulzer Page 41 of 98 Version K (2019-06-11)
81307051K
Figure 77 High Resolution Chart
A more detailed resolution chart appears, and it might be necessary to click on Load more detailed data above the chart.
Figure 78 The blue arrow toggles between dates
Figure 79 Detailed data loaded

All contract levels
Sulzer Page 42 of 98 Version K (2019-06-11)
81307051K
Reports The report page shows a grid of rows with analogue signals and columns with times and values. The four last columns contain statistics over the selected period. The view consists of three parts: the filter panel, the actual report and the alarm list.
Figure 80 Report overview
Filter panel In the filter panel you define what to show in the report. Here’s a walkthrough of the alternatives:
1. Select station from the dropdown list. 2. Select period by doing one of the following:
a. Click on the “Day” button = Data from yesterday. b. Click on the “Week” button = Data from last calendar week (Monday to Sunday). This
is the default view. c. Click on the “Month” button = Data from last running month and today up until last
automatic collection. d. Select exactly from and to by clicking on the calendar icons and clock icons.
3. Select resolution from the dropdown list. The contents vary depending on the selected period. 4. Click on the “Apply” button.
Figure 81 Filter overview

All contract levels
Sulzer Page 43 of 98 Version K (2019-06-11)
81307051K
Figure 82 Date picker
Figure 83 Time picker
Toolbar Here’s a description of the buttons in the toolbar:
Symbol Description
Changes report period a step backwards in time.
Goes back to the last view.
Zooms into the selected columns.
Exports to Excel.
Shows the report in a pdf-file.
Changes report period a step forwards in time.
Zoom To make it easy to drill down into more detailed levels, there’s zoom functionality in the grid. To select the columns you’re interested in, press the left mouse button, drag the mouse to the right and then release the button. Then click on the zoom button in the toolbar.
Figure 84 Zoom in report
All contract levels
Sulzer Page 44 of 98 Version K (2019-06-11)
81307051K
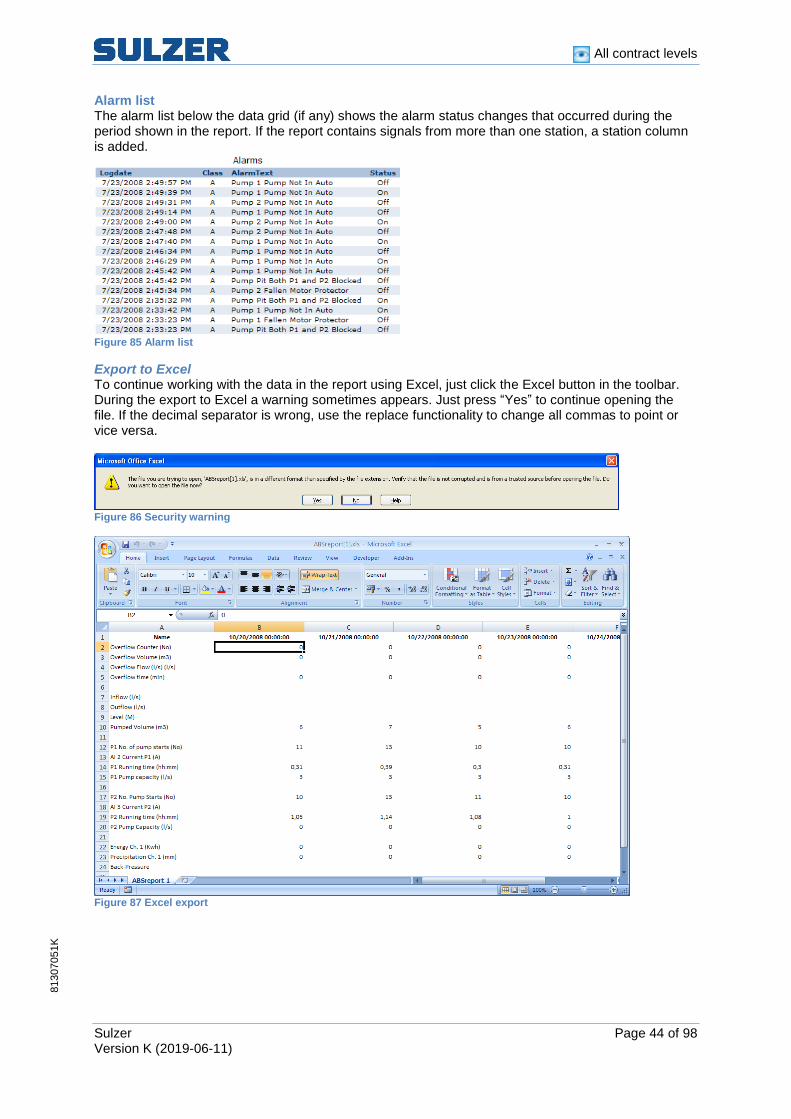
Alarm list The alarm list below the data grid (if any) shows the alarm status changes that occurred during the period shown in the report. If the report contains signals from more than one station, a station column is added.
Figure 85 Alarm list
Export to Excel To continue working with the data in the report using Excel, just click the Excel button in the toolbar. During the export to Excel a warning sometimes appears. Just press “Yes” to continue opening the file. If the decimal separator is wrong, use the replace functionality to change all commas to point or vice versa.
Figure 86 Security warning
Figure 87 Excel export

All contract levels
Sulzer Page 45 of 98 Version K (2019-06-11)
81307051K
Print or export to pdf The report can be exported or printed by clicking on the print button. The file can then either be printed, saved to file or sent to someone else by mail.
Figure 88 Pdf-export

All contract levels
Sulzer Page 46 of 98 Version K (2019-06-11)
81307051K
High resolution sessions From Optimization-> High resolution session you can see a view of all high resolution sessions created as described in the chart section with sub title High resolution charts. In this section the chart icon will open the session and the delete icon will obviously delete the session. The start date and the end date together with the station name will make it easy to find the session of interest.
Figure 89 High resolution sessions with possibilities to filter by station or notes
It’s possible to add notes to the sessions
Figure 90 Notes to high res session
Below is a chart from a high resolution session with a time span of 30 seconds. It has multiple axes with three axes to the left and three axes to the right.
Figure 91 High res. Chart

All contract levels
Sulzer Page 47 of 98 Version K (2019-06-11)
81307051K
Data collection The data is automatically collected once every 24-hours. The most recent data is also collected when an A-alarm is received from the station. This gives the operator access to the most current data when looking for the alarm cause. However if the operator for some reason needs more current data, this can be done by clicking the Start link. A manual collection will then be made. The page is automatically updated during the collection, so it’s possible to follow the progress.
Figure 92 Data collection
Column Description
Online Show the current online status Station Station name Collect new values Click the Start link to start collecting new values Last complete Shows the date the system has collected all data for Status Text describing the current status in the collection Progress Collection progress shown in percent
Figure 93 Legend for online status

All contract levels
Sulzer Page 48 of 98 Version K (2019-06-11)
81307051K
Setup The setup tab contains sections for configuring the system. Select one of the seven submenus. Each submenu is explained in the following chapters: Alarm management, Users, Stations, Charts, Reports, Automatic maneuvers and Multi Mimics. Note! that Alarm management, Automatic maneuvers and Multi mimics are only for the higher contract level CMS 251 Remote Control & Alarms.
Figure 94 Setup overview
Configuration change dialog Because of the flexibility of AquaWeb it’s important to keep track of who did what and when. All changes are logged in an operator log. After a change, the operator gets the option to enter a comment or reason for the change. This is useful when doing something on behalf of someone else. As confirmation and information, you can send a mail, either to a user in the system or to a mail address of choice. Just click in the checkbox called Send mail and select or enter one or more addresses (separated by semicolon).
Figure 95 Config change dialog
If you’re doing a lot of changes, for example during setup, it may not be necessary to comment every change; therefore, it’s possible to disable the comment dialog.
Alarm management The behavior of the alarm management system can be adjusted to your organization’s needs and desires. You can for example decide what the system will do when an alarm event comes in.

All contract levels
Sulzer Page 49 of 98 Version K (2019-06-11)
81307051K
Figure 96 Alarm management menu with sub menus
If you have a large organization it might be a good idea to define different areas of responsibility. These areas can for example be divided either by technique, competence or geographic regions.
Area of responsibility
UsersAlarm groups
Figure 97 Area of responsibility
Alarm group – Electrical errors
Station1\Electrical error 1
Station2\Electrical error 1
Station2\Electrical error 2
Station2\Electrical error 3
...
Alarms UsersDay time
1. Sven Svensson, GSM
2. Karl Karlsson, GSM
3. -
4. -
5. -
R. Sven Svensson, EMAIL
Night time
1. Lars Larsson, GSM
2. -
3. -
4. -
5. -
R. Sven Svensson, EMAIL
Figure 98 Alarm groups
When an alarm event occurs, the paging is following the schema shown in the diagram below, until someone has acknowledged the alarm. The adjustable settings are marked with asterisks (*).
Send message
Messagesent OK?
Wait for 1 * minute
Yes
Wait for 15 ** minutes
No
Moreattempts? ****
Yes, contact the same person again
No
More paging cycles? ***
Yes, contact first person in group again
Start cycle
More personsto page?
Yes, contact next person in group
No
Send messageto alarm group
responsible
No
Figure 99 Paging cycle with asterisks showing the settings
Alarm groups An alarm group is a description of how to handle events from a specified set of alarm points. In a group you define what alarms to handle and who to inform when the events occur.
All contract levels
Sulzer Page 50 of 98 Version K (2019-06-11)
81307051K
Overview
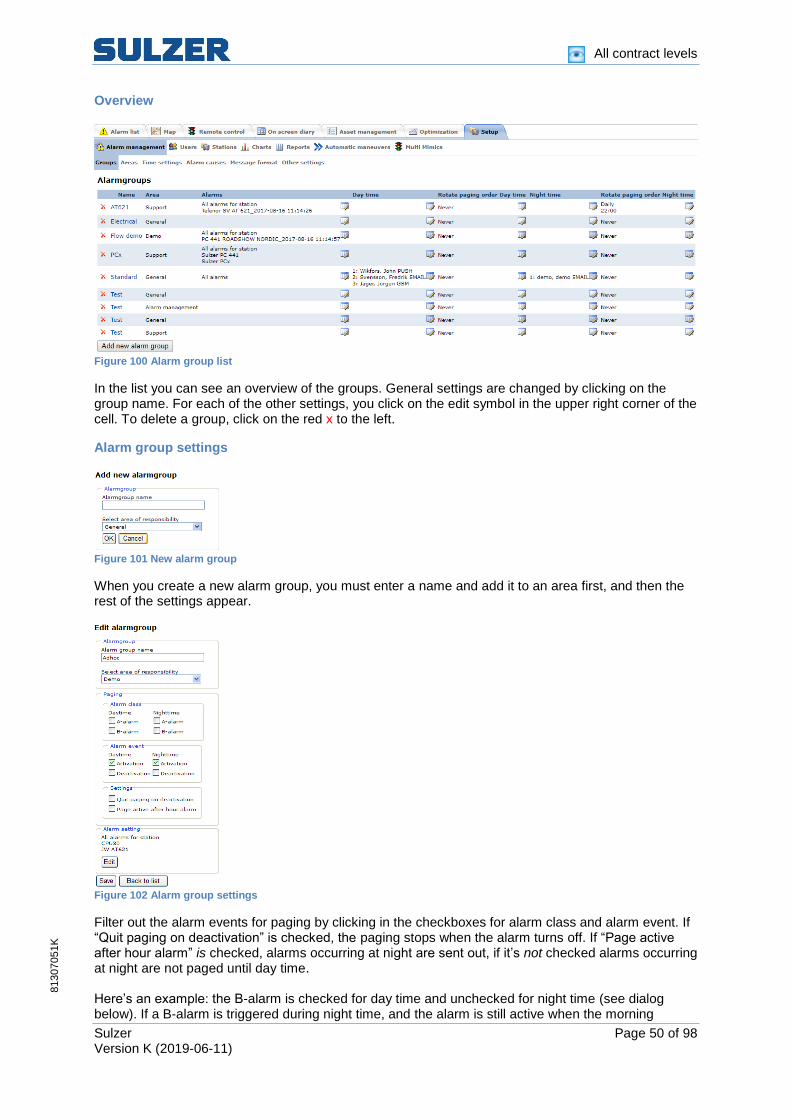
Figure 100 Alarm group list
In the list you can see an overview of the groups. General settings are changed by clicking on the group name. For each of the other settings, you click on the edit symbol in the upper right corner of the cell. To delete a group, click on the red x to the left.
Alarm group settings
Figure 101 New alarm group
When you create a new alarm group, you must enter a name and add it to an area first, and then the rest of the settings appear.
Figure 102 Alarm group settings
Filter out the alarm events for paging by clicking in the checkboxes for alarm class and alarm event. If “Quit paging on deactivation” is checked, the paging stops when the alarm turns off. If “Page active after hour alarm” is checked, alarms occurring at night are sent out, if it’s not checked alarms occurring at night are not paged until day time. Here’s an example: the B-alarm is checked for day time and unchecked for night time (see dialog below). If a B-alarm is triggered during night time, and the alarm is still active when the morning

All contract levels
Sulzer Page 51 of 98 Version K (2019-06-11)
81307051K
comes, a paging is made to remind users on the day time shift that the alarm cause needs to be taken care of.
Figure 103 Example showing "Page active after hour alarm"
Select alarms to include A specific alarm point can only be managed by one alarm group. The priority of the alarm groups is depending on the level of detail in the definition. The table below shows the order.
1 Selected alarm points
2 All alarms for selected
stations
3 All alarms
Figure 104 Alarm group priority

All contract levels
Sulzer Page 52 of 98 Version K (2019-06-11)
81307051K
Select receivers Select users to receive paging by clicking the checkbox to the left of the name and then the “Add” button. A user can get the notification either by PUSH notification on the smartphone, SMS to any type of phone or by mail (EMAIL). To change the order of the users in the right list, select the user and click on the “Up” or “Down” buttons. If you’d like to move the last person in the list up to the first position, click on the “Rotate” button.
Figure 105 Edit alarm receivers
The user set as “Responsible” is notified if none of the users has acknowledged the alarm. The settings for paging is set under Setup/Alarm management/Other settings The user set as first receiver of alarms can also by temporally override.
Rotate paging order When having several users in an alarm group, it may be useful to rotate the paging order, to level the work between the users. This can be done manually as described above, or automatically according to the rotate setting. Click on the edit symbol in the rotate paging order column to change it.
Figure 106 Manual
Figure 107 Rotate automatically once a day

All contract levels
Sulzer Page 53 of 98 Version K (2019-06-11)
81307051K
Figure 108 Rotate automatically weekly
Figure 109 Rotate automatically monthly
Areas The use of areas makes it easier to manage personnel for on call hours. When adding users to alarm groups, there’s a filter showing all personnel belonging to the same area as the alarm group. The “General” area is setup default and cannot be removed.
Figure 110 Areas overview
Click on the name to edit the name. Click on the users’ symbol to select users for the area.
Figure 111 Edit area
Select users by clicking the checkbox to the left of the name, and then the Add button.

All contract levels
Sulzer Page 54 of 98 Version K (2019-06-11)
81307051K
Time settings You can adjust the definition of day time and night time on a normal working week for your organization. Everything outside the times given is considered night time (or on call hours). If you enter 00:00 in both “From” and “To”, it means that the whole day is on call hours. After changing the time settings, click on the “Save” button.

All contract levels
Sulzer Page 55 of 98 Version K (2019-06-11)
81307051K
Working hours
Figure 112 Time settings overview
Special days Special days, that are common to all users, can also be entered here. These are then treated as on call hours. Enter date, time and description in the box to the right and click on the “Add” button.
Figure 113 Vacation/absence

All contract levels
Sulzer Page 56 of 98 Version K (2019-06-11)
81307051K
Alarm causes It’s important to keep track of what caused an alarm. AquaWeb comes with a standard set of causes, and it’s possible to add your own.
Figure 114 Alarm causes
Figure 115 Alarm causes in use in alarm list
All contract levels
Sulzer Page 57 of 98 Version K (2019-06-11)
81307051K
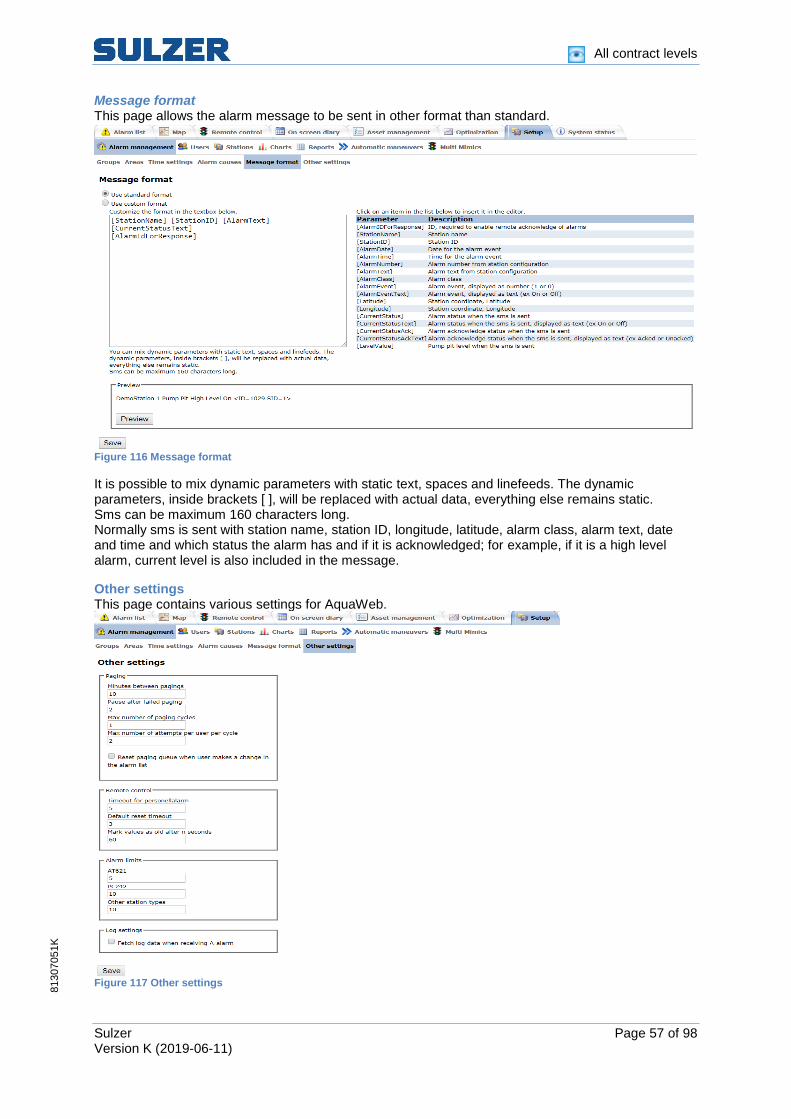
Message format This page allows the alarm message to be sent in other format than standard.
Figure 116 Message format
It is possible to mix dynamic parameters with static text, spaces and linefeeds. The dynamic parameters, inside brackets [ ], will be replaced with actual data, everything else remains static. Sms can be maximum 160 characters long. Normally sms is sent with station name, station ID, longitude, latitude, alarm class, alarm text, date and time and which status the alarm has and if it is acknowledged; for example, if it is a high level alarm, current level is also included in the message.
Other settings This page contains various settings for AquaWeb.
Figure 117 Other settings

All contract levels
Sulzer Page 58 of 98 Version K (2019-06-11)
81307051K
Alarm limits meaning: you can set how many alarms each station type is allowed to have within 24-hour. For example, PC242 can have 10 alarms per 24-hour. When this limit is passed an alarm is generated with the text: Stationname, ALarm not handled (The station has generated too many alarms today.) ON, date and time This is an indicates that there is probably something wrong in the station if it generates so many alarms. The alarms continue to send out as normal. Log settings: As described on page 47. More information on next page.

All contract levels
Sulzer Page 59 of 98 Version K (2019-06-11)
81307051K
Too make it easier to understand what the paging settings are for, here’s a diagram showing the paging cycle:
Send message
Messagesent OK?
Wait for 1 * minute
Yes
Wait for 15 ** minutes
No
Moreattempts? ****
Yes, contact the same person again
No
More paging cycles? ***
Yes, contact first person in group again
Start cycle
More personsto page?
Yes, contact next person in group
No
Send messageto alarm group
responsible
No
Figure 118 Paging cycle with asterisks showing the settings
Setting Description
Paging * Minutes between pagings Pause in minutes after a successful paging. ** Pause after failed paging Pause in minutes after a failed paging. *** Max number of paging cycles Number of cycles for the whole group **** Max number of attempts per user per cycle Number of attempts per user per cycle Remote control Timeout for personnel alarm Minutes after man sets station in local mode Default reset timeout Preset value for reset maneuvers for AT621 Mark as old after n seconds Process mimic and values are dimmed Alarm limits AT621 Number of alarms before limit alarm is set PC242 Number of alarms before limit alarm is set Other station types Number of alarms before limit alarm is set
Figure 119 Table describing the settings
Note: Old labeling is the function that n seconds after disconnection places a gray membrane over the entire process image to indicate that the values are no longer relevant. 4 minutes is the actual time period the station is connected and it has nothing to do with the old marking

All contract levels
Sulzer Page 60 of 98 Version K (2019-06-11)
81307051K
Users
On the user’s page you can see an overview of all users. Click on the user name to edit basic information, like name and phone number. To change area or add vacation, click on the edit symbols in the corresponding columns.
Figure 120 Users overview
Add new user To add a new user, click on the “New user” button below the list. Then you get to enter data for the new user. First name, last name and signature are mandatory. The permissions are explained in a later chapter “Edit user permissions”. The information field “Registered push notifications devices” is, in the example, when the smartphone first was registered and on what platform (Google or Apple). You must start with getting the app on your Appstore. There is a guide Here. You can also click on the question mark to view a table of what the permissions means in practice.
Figure 121 Add new/edit user
When you click OK, the user data is saved and a popup dialog appears, asking you if you’d like to send a welcome mail to the user. This could be done right away or later by clicking the mail symbol in the users list. Each time a welcome mail is sent, a new password is generated.
Figure 122 Send welcome mail?

All contract levels
Sulzer Page 61 of 98 Version K (2019-06-11)
81307051K
Figure 123 Welcome mail
The next popup asks whether the user should be added to the alarm group. If you click OK, the alarm group page is shown. It’s possible to add the user to an alarm group at a later occasion.
Figure 124 Add user to alarm group?
Add user to area The user is automatically added to the “General” area. If you’d like to change it or add the user to more areas, click on the edit symbol in the “Area” column (the calendar icon).
Figure 125 Areas of responsibility for user
Enter vacation for user To maintain the accuracy of the on screen diary for planning on call duty, planned vacations and other absence should be entered regularly. Click on the edit symbol in the “Vacation/Absence” column (the calendar icon).
Figure 126 Vacation/absence for user

All contract levels
Sulzer Page 62 of 98 Version K (2019-06-11)
81307051K
Edit user permissions In AquaWeb it’s possible to control each user’s permissions to access and edit information. The following table shows what the checkboxes in the edit user dialog means.
Figure 127 User permissions
No a
uth
ori
zation
Ack
now
ledge
alar
ms
Edit a
larm
han
dlin
gE
dit g
ener
alE
dit u
sers
Rem
ote
contr
ol
leve
l 1-3
Alarm managementContract: Alarm management
Alarm groups
- View X X X
- Edit X X
Areas
- View X X X
- Select users X X
Other alarm settings
(day time settings, holidays,
alarm causes and timeouts)
- View X X X
- Edit X X
UsersContract: Alarm management
Users
- View X X
- Edit everything for all users X
- Edit alarm settings for all users X X
SetupContract: Alarm management
Stations
- View settings X X X
- Edit settings X
- View configuration X X X
- Edit configuration X
- View equipment attributes X X X
- Edit equipment attributes X X X
Alarm listContract: Alarm management Advanced
Alarm list
- View X X X X X X
- Acknowledge X
- Block X
- Unblock X
- Select cause X X
- View activity log X X
- Edit activity log X X
Event list
- View X
- Reset X
Operator log
- View X
Personnel planningContract: Alarm management Advanced
Labour force calendar
- View X X
- (Edit, see alarms and users above) X
Signal statusContract: Remote Control & Surveillance
Signal status
- View X X X X X X
- Update X X
- Remote control 1, 2 and 3 X
Remote Control level 1:
Start/stop pumps, mixers etc
Remote Control level 2:
Cange set-points
Remote Control level 3:
Not in use
Charts and reportsContract: Optimization
Charts
- View X X X X X X
- Edit templates X
Reports
- View X X X X X X
- Edit templates X

All contract levels
Sulzer Page 63 of 98 Version K (2019-06-11)
81307051K
Stations Sulzer controllers are delivered from Sulzer with default communication parameters to AquaWeb, to make it easier to setup and run. The user just needs to set the unique ID in the controller. Find the ID in the email or by logging into AquaWeb. (Visit abscm.se if you are unsure how to set ID in the controller). In the stations list you can get an overview of the settings. You can also see the online status, and an indication of personnel working at the stations. To change a station’s settings, click on the station name. To view or change the equipment details, click the “Show” link in the rightmost column (see Asset management).
Figure 128 Stations overview with filter functionality.
Edit station Depending on station type different settings are enabled on the edit page.
Figure 129 Edit station settings

All contract levels
Sulzer Page 64 of 98 Version K (2019-06-11)
81307051K
Identification settings Name is mandatory and has to be unique. Short code could be added as a tag.
Figure 130 Identification settings
Map settings AquaWeb includes full mapping functionality and this is where to enter the station location. The coordinate system used is a world standard called WGS84 (world geodetic system). If you already have the coordinates for your station, just enter it in the Latitude and Longitude boxes. Otherwise you can click on the “Get position” button to point it out on a map. In the “Next in network” box you select the station that is next to this in the network. This adds arrows to the map showing the pumping direction.
Figure 131 Map settings
When the position is correct, click the OK button.
Figure 132 Map positioning
Functionality Log fetching is on by default, all others are off by default. (The Ignore APN is not in use). Fallback SMS will allow alarms to be set by SMS if GPRS/3G/4G is not available (Note! Can generate extra costs!) Note! The Automatic fetch cache values every XX minutes is a special function to be used together with Connect via another station. (Contact C&M for more information.)

All contract levels
Sulzer Page 65 of 98 Version K (2019-06-11)
81307051K
Figure 133 Functionality. Ignore APN for app connections are not in use
Presentation settings Select pump graphic for the remote control page from the predefined process mimics. Default report and chart template can also be selected. Those lists contain both predefined and your own templates.
Figure 134 Presentation settings
Communication settings Since the Sulzer sim-cards are Swedish, the phone number should always start with 0046. The protocol should be MODBUS for most GPRS/3G/4G stations. The heartbeat interval is adjustable in AquaWeb only for AT621 GSM stations between 1-18 hours. Default is 18 hours. It controls how often (in hours) the station contacts the system for heartbeat communication. The SIM card ID is collected from the station with GPRS/3G/4G communication first time it connects and the heartbeat is read from the substation. Default is 600 seconds. Not adjustable in AquaWeb. Connect via another station is for special solutions (Contact C&M for more information.)
Figure 135 Communication settings
Site info Site info can be general information about the station, for example description of the location.
Figure 136 Site info
Installation complete Installation complete is checked when the installation is done. When the tick box is not checked:
1. The red off-line symbol, indicating that the station is off line, is not showing. 2. Automatic collection of log values is not performed. 3. No alarms are sent out to pagers in the system and AquaWeb are not trying to wake up the
station if it has been off line for too long.
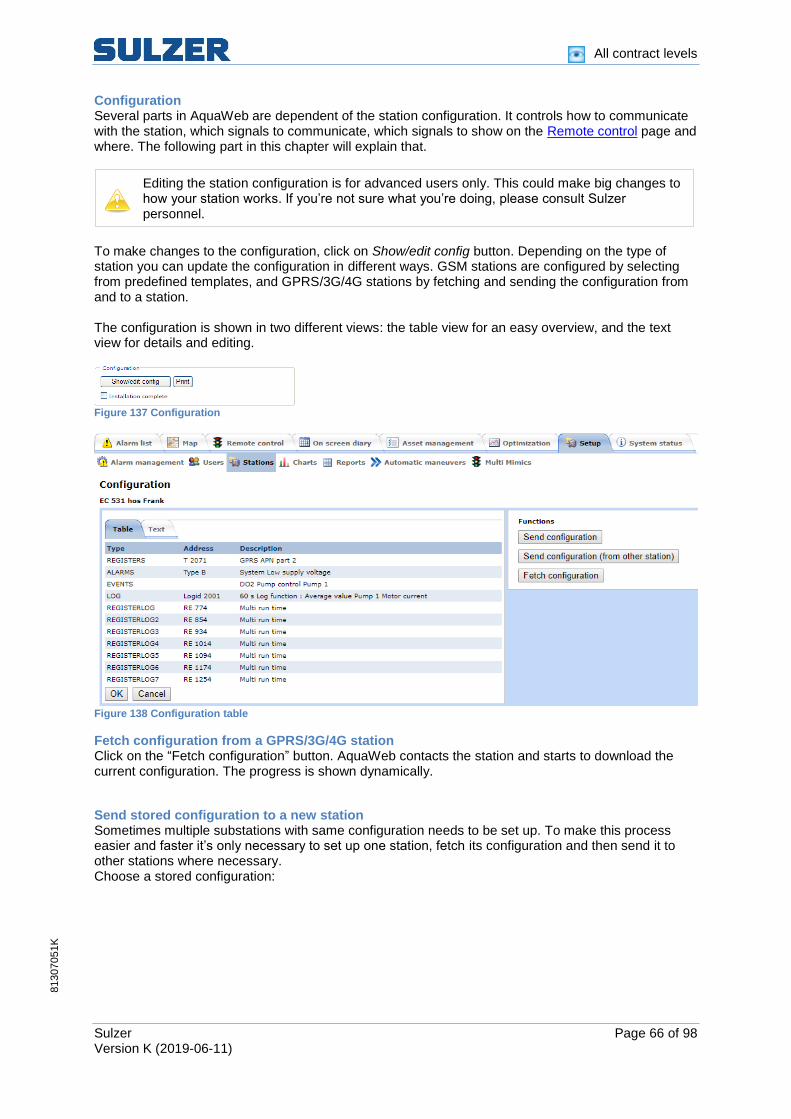
All contract levels
Sulzer Page 66 of 98 Version K (2019-06-11)
81307051K
Configuration Several parts in AquaWeb are dependent of the station configuration. It controls how to communicate with the station, which signals to communicate, which signals to show on the Remote control page and where. The following part in this chapter will explain that.
To make changes to the configuration, click on Show/edit config button. Depending on the type of station you can update the configuration in different ways. GSM stations are configured by selecting from predefined templates, and GPRS/3G/4G stations by fetching and sending the configuration from and to a station. The configuration is shown in two different views: the table view for an easy overview, and the text view for details and editing.
Figure 137 Configuration
Figure 138 Configuration table
Fetch configuration from a GPRS/3G/4G station Click on the “Fetch configuration” button. AquaWeb contacts the station and starts to download the current configuration. The progress is shown dynamically.
Send stored configuration to a new station Sometimes multiple substations with same configuration needs to be set up. To make this process easier and faster it’s only necessary to set up one station, fetch its configuration and then send it to other stations where necessary. Choose a stored configuration:
Editing the station configuration is for advanced users only. This could make big changes to how your station works. If you’re not sure what you’re doing, please consult Sulzer personnel.

All contract levels
Sulzer Page 67 of 98 Version K (2019-06-11)
81307051K
Figure 139 Choose a configuration that already exists
Make sure it’s the same stationtype (e.g. EC531, PC441, PCx) and that the configuration you want to send is correct and that the receiving station ID and name is correct before sending it.
Figure 140 Send stored configuration
If you try to send wrong station type an error will occur and it’s not possible to send:
Change configuration for a GPRS/3G/4G station Certain parts of the configuration could need to be adjusted to fit special purposes/functions in some projects. For example change the list of signals in the Remote control page. This can be done, for GSM stations, by editing the configuration text and clicking OK. The configuration is then saved to the database and the changes are applied immediately. This works fine also for GPRS/3G/4G stations, until you fetch the fresh configuration again from the station. The manual changes are then overwritten. The solution is to edit the station-specific Rid-information that resides on the server, via AquaWeb. The changes are then merged into the complete configuration when a new fetch is made.

All contract levels
Sulzer Page 68 of 98 Version K (2019-06-11)
81307051K
Figure 141 The configuration settings unique to this station (orange frame) are editable via AquaWeb.
To make a change to the station-specific Rid-file, edit the bottom textbox like this: 1. Find the row that you want to edit in the upper textbox. 2. Copy its section header (enclosed with [ ]) to the bottom textbox. 3. Copy the row to edit to the bottom textbox. 4. Make the changes. 5. Click the OK button.
In the example below RID91=RE 449 (GPRS signal in the register manual) appears in the rid file without the Cache and Web X parameters, meaning it’s not a visible signal. If we want it to be shown on the right column (web 2) on the Remote control page we need to set it in the unique rid file with the Cache and Web X parameters. The header for the unique rid-file must exists exactly as: [REGISTERS]
Figure 142 the signal before it's updated
Figure 143 the signal updated with header and Cache and Web x parameters
Configuration info fetched from
station
Configuration settings specific for
this station type
Configuration settings specific for
this station
Complete station configuration used
in AquaWeb

All contract levels
Sulzer Page 69 of 98 Version K (2019-06-11)
81307051K
Press OK and collect configuration from the substation to make the change permanent.
Remote control signals To define how signals are presented on the Remote control page, you can change the signal parameters in the configuration. The Web parameter defines in which of the lists the signal is shown. There are three possible positions for the Web X signal; column 1, column 2 and in the Energy tab there are three columns. The Cache parameter defines that the signals values should be updated and stored every time the system is in contact with the station. Without the Cache parameter the signal value won’t appear on the Remote control page.
Figure 144 web 1 and web 2 signal lists in Remote control page
The Energy signals also has columns. They are web 1E, web 2E and web 3E. Example of an web 1E signal from the rid file:
Figure 145 signal web 1E shows in the first Energy column
Figure 146 The E signals
Web 1 Web 2

All contract levels
Sulzer Page 70 of 98 Version K (2019-06-11)
81307051K
It’s even possible to have the same signal in many columns. It’s enough to edit the ‘web-part’ of a configuration row. For example, to have RID90 = RE 23 (Supply voltage) signal in both Signals tab column 1 AND under Energy tab column 1:
Note that pipe sign ‘|’ is necessary for this to work. To have the signal in three places at the same time just do as in this example: Web 1 | 1E | 2E . This will pipe the signal from Web 1 in Signals column 1 to Energy column 1 and 2 and the signal will be shown at all three places.
Send configuration This can be done on both GSM and GPRS/3G/4G stations. Click on the “Send configuration” button. AquaWeb contacts the station and starts to upload the current configuration. The progress is shown dynamically.
Installation complete When the station is configured, and all settings are applied, click the checkbox “Installation complete” to enable full functionality for the station. This means for example automatic watchdog handling for GSM stations and automatic log fetching for GPRS/3G/4G stations as well as sending out the alarms.
Figure 147 Check Installation complete
Note! It’s possible to add stations between organizations. An Administrator from Sulzer can help with that.
Figure 148 External station cross organizations

All contract levels
Sulzer Page 71 of 98 Version K (2019-06-11)
81307051K
Chart templates From the chart list you can delete, preview, copy, edit or add new template. There are two types of templates: general chart templates, without station name in the signal addresses, and special chart templates, with selected station’s name in the signal addresses. General templates can be connected to a station in the Edit station page. Specific templates are run stand alone and can be previewed from the list. It’s possible to use LogID for each channel (EC531, PC 242 and PC 441). Each channel has it’s on ID and therefore it’s possible to use the LogID instead of a name, this makes it possible to create non-language independent templates. The difference between LOGID and RLOGID is that LOGID are log channels and RLOGID are register logs.
Figure 149 LogID and Name of channel
Figure 150 Chart templates overview
Edit chart template If you copy, edit or add new, the Edit chart page is shown. The template name is mandatory and has to be unique. A chart template consists of digital signals and analogue signals. In the screen shot below you can see where they are placed when running the chart.
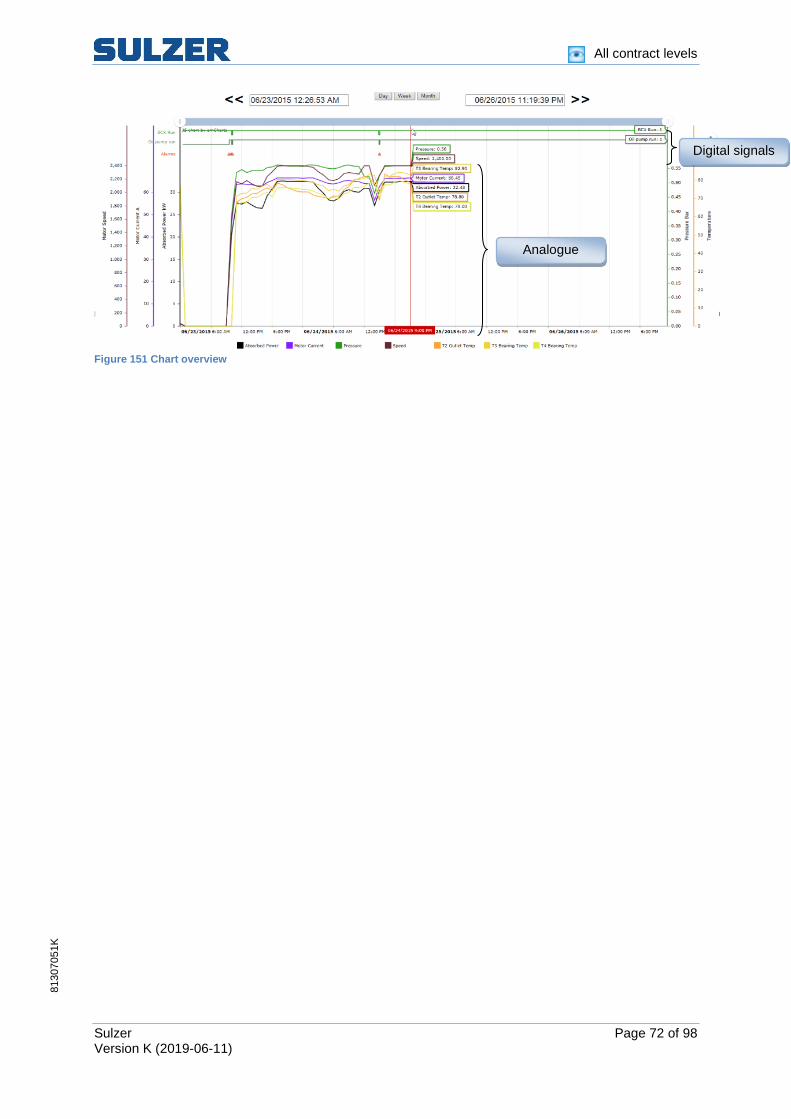
All contract levels
Sulzer Page 72 of 98 Version K (2019-06-11)
81307051K
Figure 151 Chart overview
Digital signals
Analogue signals

All contract levels
Sulzer Page 73 of 98 Version K (2019-06-11)
81307051K
Analogue signals In the first signal frame, you enter the analogue signals. Here’s a description of the columns:
Column Description
Delete Click on the delete symbol to delete the row. Name Identifies the signal in the chart. Mandatory. Description Shown in legend when running chart. Compare If checked, the time offset for this row is changed when running the chart,
according to the compare settings in the upper right corner of this page. Color Palette to select color for the signal. Axis Dropdown to choose witch Axis to use for this signal. Scale Min If the left scale is set to percent, Scale min and Scale max are used for
calculating the percentage. For example: an analogue value for motor currents can be extremely large for one pump and very small for another. To set up a chart with adapted display, you therefore set max and min scaling for each pump.
Scale Max See Scale min. Type Can be actual value, or a statistic value of choice: min, max, average or sum. Signal The address of the signal to show.
It could be station\signal or just signal. Click in the signal field to select. It could also be a formula. If so, encapsulate the channels with []. For example: [Station1\Signal1] + [Station2\Signal1]
Figure 152 Edit chart template
Click on the station name in the upper list and wait for that station’s channels to appear in the bottom list. Select the channel and click the “Insert” button, either for both station and channel or just the

All contract levels
Sulzer Page 74 of 98 Version K (2019-06-11)
81307051K
channel. You don’t need to enter any station to access the signals in the dropdown list for signals. The general LOGID and RLOGID signals appear without a station.
Figure 153 Select channel dialog.
Figure 154 Select channel dialog with LOGID.
Digital signals In the second signal frame, you enter the digital signals. When it comes to digital values, there are no standard addresses for these signals, which means that there is no possibility for AquaWeb to suggest any signals if you do not specify a station when making the selection. However, you can set up a general template that works for all the stations that have e.g. EVENT35 as P1 Rev Here’s a description of the columns:
Column Description
Delete Click on the delete symbol to delete the row. Name Identifies the signal in the chart. Mandatory. Description Shown in legend when running chart. Compare If checked, the time offset for this row is changed when running then chart,
according to the compare settings in the upper right corner of this page. Signal The address of the signal to show.
It could be station\signal or just signal. Click in the station\signal field to select.
Scales You can use left scale, or both left and right scale. Select automatic (default), manual or percent. The manual setting requires min and max limits. You can add as many axis as you want.

All contract levels
Sulzer Page 75 of 98 Version K (2019-06-11)
81307051K
Figure 155 Scale settings

All contract levels
Sulzer Page 76 of 98 Version K (2019-06-11)
81307051K
Formulas These are the operators available when using formulas.
Operator Meaning
() Sub expressions ^ Power *, / Multiplication, division %, Mod Modulus (remainder) \ Integer divide +, - Addition, subtraction >, >=, <, <=, <> Logical comparison. Returns 0 for False and -1 for True.
If you want to return 0 or 1 instead, add abs(int()) around the expression. Example: abs(int([Signal1]< [Signal2]))
&, |, And, Or Logical "and", logical "or"
In addition to the standard operators, the following built-in functions are supported (they are case insensitive): Abs, Sin, Cos, Tan, Atn, Log, Log10, Exp, Sqr, Int, Ceil and Floor.
Compare Signals marked with compare will have values from a different time frame. You can set the offset in five different units: hour, day, week, month or year.
Figure 156 Compare settings
Add the signals to be compared on two rows, one showing the current value and the other to show the compared value (eg yesterday's, two hours ago, or last week's). So if the value in offset for comparing signals is set to hour, the current value will be compared to the value of 12 hours ago, as in the example below:
Figure 157 Compare example
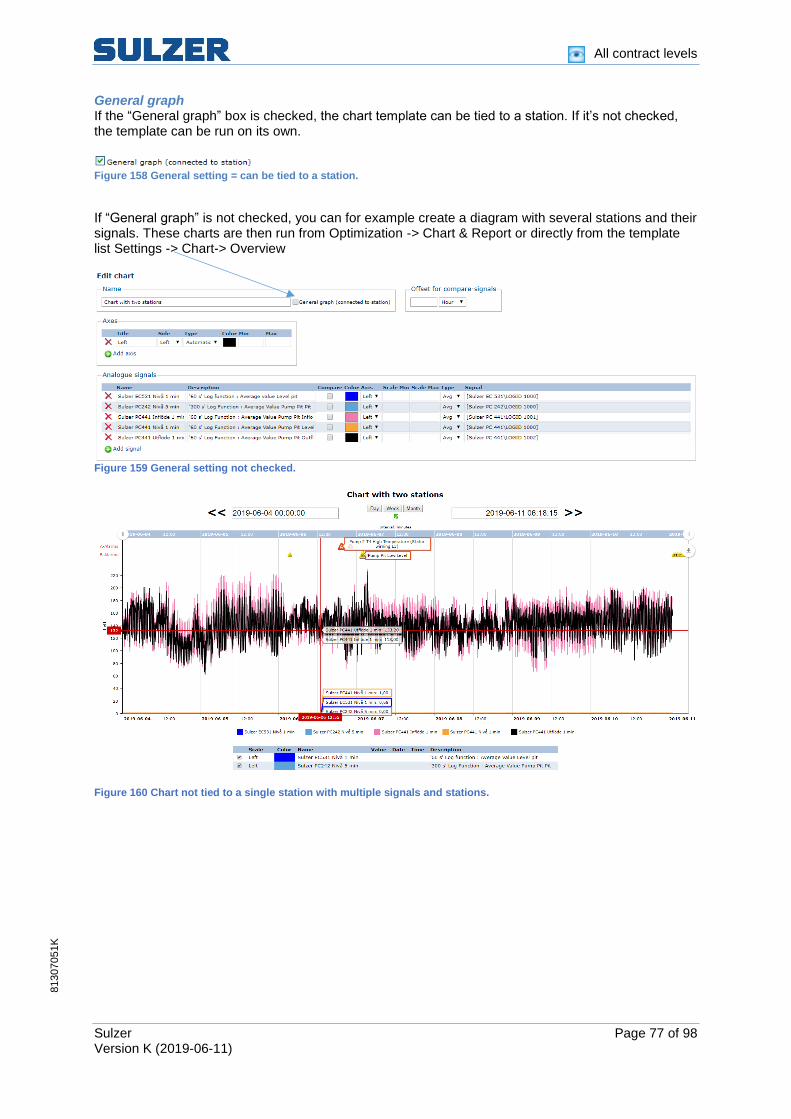
All contract levels
Sulzer Page 77 of 98 Version K (2019-06-11)
81307051K
General graph If the “General graph” box is checked, the chart template can be tied to a station. If it’s not checked, the template can be run on its own.
Figure 158 General setting = can be tied to a station.
If “General graph” is not checked, you can for example create a diagram with several stations and their signals. These charts are then run from Optimization -> Chart & Report or directly from the template list Settings -> Chart-> Overview
Figure 159 General setting not checked.
Figure 160 Chart not tied to a single station with multiple signals and stations.

All contract levels
Sulzer Page 78 of 98 Version K (2019-06-11)
81307051K
Report templates From the reports list you can delete, preview, copy, edit or add new template. There are two types of templates: general report templates, without station name in the signal addresses, and special report templates, with selected station’s name in the signal addresses. General templates can be connected to a station in the “Edit station” page. Specific templates are run stand alone and can be previewed from the list.
Figure 161 Report templates overview
Edit report template If you copy, edit or add new, the edit report page is shown. The template name is mandatory and must be unique.

All contract levels
Sulzer Page 79 of 98 Version K (2019-06-11)
81307051K
Figure 162 Report templates consist
The template consists of three parts:
1. Channels (values in) 2. Calculations 3. Display (values out)
Channels The input for the report engine is the channels. Enter the signal address manually or select from a dialog by click in the empty field.
Figure 163 Report templates channels
Calculations
Display
Channels

All contract levels
Sulzer Page 80 of 98 Version K (2019-06-11)
81307051K
Here’s a description of the columns:
Column Description
Delete Click on the delete symbol to delete the row. Name Identifies the channel in the report. Mandatory. Unit text Shown to the right of the name in the report. Type Can be actual value, or a statistic value of choice: min, max, average or sum. Station Station name should be entered if the template should be run on its own (General
report = False). Click on the … button to select. Signal The address of the signal to show. Click on the … button to select.
It could also be a formula. If so, encapsulate the channels with []. For example: [Station1\Signal1] OR [Station2\Signal1]
Click on the station name in the station column and the station's signals/channels are displayed in the signal column. Select signal/channel by clicking in the field for signals/channels, either for both station and signal/channel or just for the signal/channel. You can choose either analog signal, such as Level, Motor currents, Input etc., or digital signals, such as running indication and pump starts. When it comes to digital values, there are no standard addresses for these signals, which means that there is no possibility for AquaWeb to suggest any signals if you do not specify a station when making the selection. However, you can set up a general template that works for all the stations that have eg EVENT35 as P1 Rev.
Figure 164 Select signal dialog showing statistic signals
Calculations If the values from the channels need to be processed before presenting them, you can work with the calculation tool. For example, convert the running time value from PCx, which is stored in minutes, to Hours: Minutes.
Figure 165 Calculation overview

All contract levels
Sulzer Page 81 of 98 Version K (2019-06-11)
81307051K
Here’s a description of the columns:
Column Description
Delete Click on the delete symbol to delete the row. Name Identifies the channel in the report. Mandatory. Unit text Shown to the right of the name in the report. Calculation The formula. Click in the calculation builder field to edit it.
Click in the calculation builder field to open up the editor. Pick channels or Calculations by clicking on them in the Channels list\Calculations list. Channels are enclosed with [ ]. The formula operators are described in the next chapter.
Figure 166 Formula editor
Your formula will be verified as you are working with it.
Figure 167 Formula editor
Formulas These are the operators available when using formulas.
Operator Meaning
() Sub expressions ^ Power *, / Multiplication, division %, Mod Modulus (remainder) \ Integer divide +, - Addition, subtraction >, >=, <, <=, <> Logical comparison. Returns 0 for False and -1 for True.
If you want to return 0 or 1 instead, add abs(int()) around the expression. Example: abs(int([Signal1]< [Signal2]))
&, |, And, Or Logical "and", logical "or"
In addition to the standard operators, the following built-in functions are supported (they are case insensitive): Abs, Sin, Cos, Tan, Atn, Log, Log10, Exp, Sqr, Int, Ceil and Floor. Abs computes absolute value of an integral value (|x|) Sin(x) Returns the sine of x Cos(x) Return the cosine of x radians. Tan(x) Returns the tangent of x Atn returns the arctangent of a number (expressed in radians) Log(x[, base]) Returns the logarithm of x to the base (defaults to e) Log10(x) Returns the base-10 logarithm of x Exp returns e raised to the given power (ex) Sqr computes square root (√x)

All contract levels
Sulzer Page 82 of 98 Version K (2019-06-11)
81307051K
Int (number) is different from Fix(number) because Int (number) returns integer portion less than or equal to number. For example, Int (-5.80) returns -6. Ceil Round to integer toward + infinity. Floor(x) Returns the largest integer less than or equal to x
Display In this section you decide what to show on the report, and how to show it.
Figure 168 Example of a report template in use
Select the item to show from the drop down list of channels and calculations, or select an empty row as separator. Set the number of decimals to show. You can also add appropriate statistics for each channel. These statistics are shown in the rightmost four columns when running the report (see screenshot above). The statistics columns have three options:
Setting Description
Off Shows nothing. Indicated Shows statistics based on values visible in report. All Shows statistics based on all values.
Figure 169 Display overview
You can change the position of a row by clicking the arrow symbol, either up or down.
Figure 170 Move rows by clicking on the blue arrows

All contract levels
Sulzer Page 83 of 98 Version K (2019-06-11)
81307051K
Settings There are three settings that control the overall appearance of the report:
Setting Description
Header text Text to show at the top of the report. The tag <STATIONNAME> is replaced with the current station name when running the report. The tag can be inserted by clicking on the <- Station name button.
Values missing If a value is missing in a cell, this is shown instead. Show alarms If this box is checked, an alarm list is shown below the grid
containing the report values.
Figure 171 Settings overview
Figure 172 Header text
General report If the General report box is checked, the report template can be tied to a station. If it’s not checked, the template can be run on its own.
If “General report” is not checked, you can for example create a report with several stations and their signals. These charts are then run from Optimization -> Chart & Report or directly from the template list Settings -> Reports-> Overview
Figure 173 General report not checked.
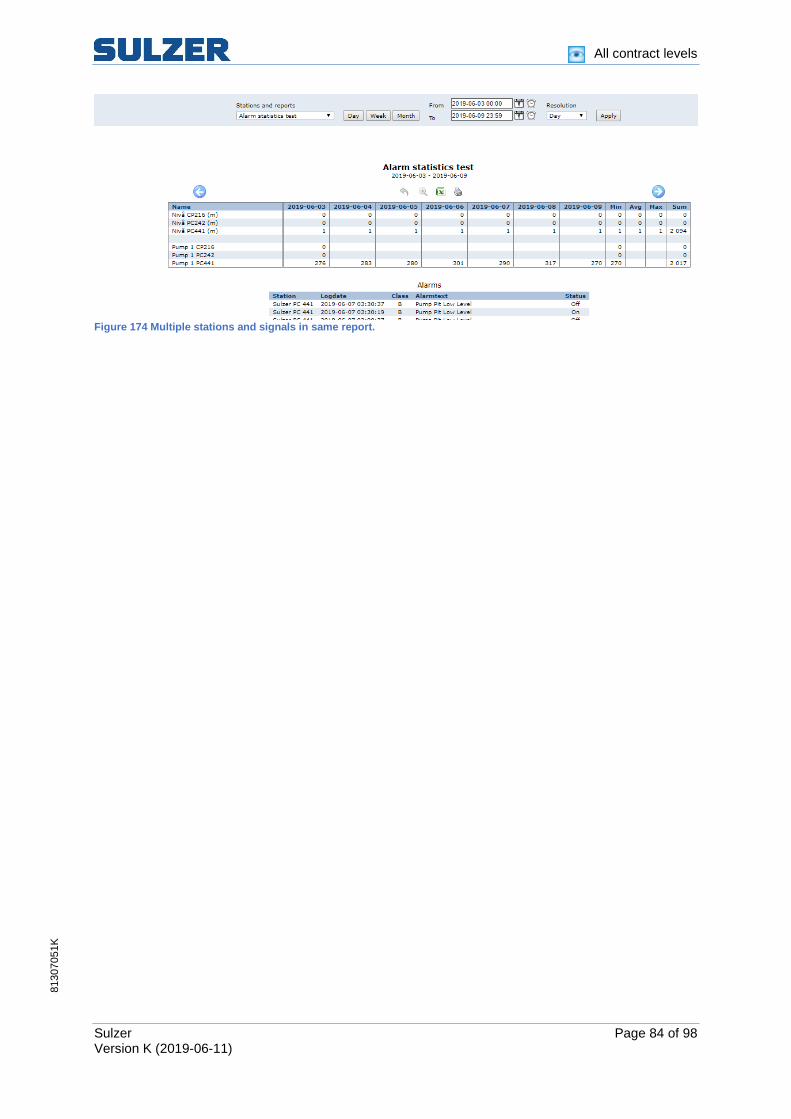
All contract levels
Sulzer Page 84 of 98 Version K (2019-06-11)
81307051K
Figure 174 Multiple stations and signals in same report.

Remote control & alarms
Sulzer Page 85 of 98 Version K (2019-06-11)
81307051K
Automatic maneuver In a sewage collection system there can arise occasions when it would be beneficial if the central control & monitoring system could perform automatic overruling actions over the settings in the local controllers. That is what Automatic maneuvers can be used for! Contract level needs to be CMS 251 Remote Control & Alarms.
Figure 175 Automatic maneuvers
To create a new Automatic Maneuver, click on Add new template:
Figure 176 Create Automatic maneuver
Give the Automatic Maneuver a name and a description. To make the Automatic Maneuver active the checkbox Enabled needs to be checked.
Figure 177 Enable and name the Automatic maneuver

Remote control & alarms
Sulzer Page 86 of 98 Version K (2019-06-11)
81307051K
Trigger Formula Settings
The function Trigger (conditions that will activate some action in another station) can be set up with several stations analogue and/or digital signals. In this example a PC242 High level float OR (|) PC441 pump pit level must be more than 1 meter for the Trigger to get activated (ON).
Figure 178 Settings trigger formula
The conditions can be seen by hover (mouse over) each function:
Figure 179 Settings trigger conditions
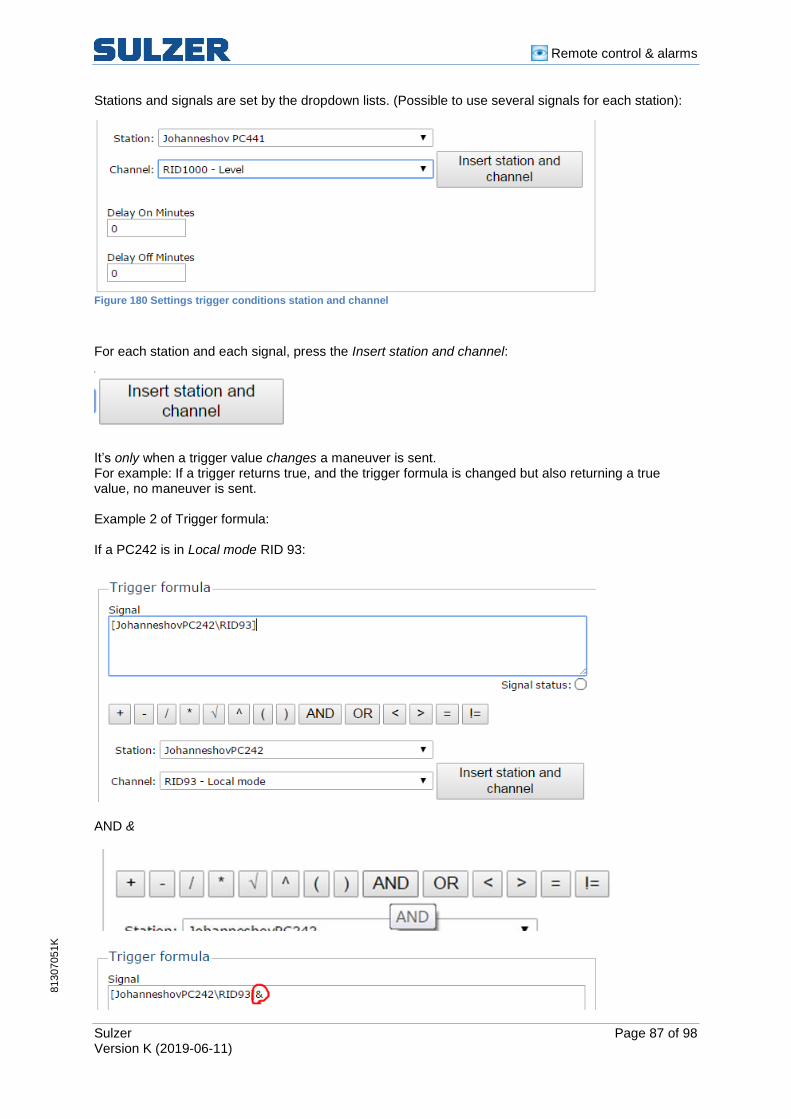
Remote control & alarms
Sulzer Page 87 of 98 Version K (2019-06-11)
81307051K
Stations and signals are set by the dropdown lists. (Possible to use several signals for each station):
Figure 180 Settings trigger conditions station and channel
For each station and each signal, press the Insert station and channel:
It’s only when a trigger value changes a maneuver is sent. For example: If a trigger returns true, and the trigger formula is changed but also returning a true value, no maneuver is sent. Example 2 of Trigger formula: If a PC242 is in Local mode RID 93:
AND &

Remote control & alarms
Sulzer Page 88 of 98 Version K (2019-06-11)
81307051K
A PC 441 numbers of overflows today RID 1030
Are more (Greater than)
Than one (1):
The trigger gets activated.

Remote control & alarms
Sulzer Page 89 of 98 Version K (2019-06-11)
81307051K
Delay It is possible to set a delay in minutes for the trigger function to activate ON or OFF:
Example:
07:00 Trigger value is set to 1 07:10 The system sends maneuver ON to the station (Delay ON 10 minutes) 07:40 Trigger value is set to 0 08:00 The system sends maneuver OFF to the station (Delay OFF 20 minutes)
Trigger repeating time interval The trigger can be set up with a repeating interval. For the Trigger Repeating time interval to work, it is necessary to have values in both ON and OFF: For example: OFF 180 and ON 60.
The interval is supposed to be OFF 180 minutes and ON 60 minutes.
09:30 Maneuver OFF is sent 12:30 Maneuver ON is sent (Has been OFF for 180 minutes) 13:30 Maneuver OFF is sent (Has been ON for 60 minutes) 16:30 Maneuver ON is sent (Has been OFF for 180 minutes)

Remote control & alarms
Sulzer Page 90 of 98 Version K (2019-06-11)
81307051K
Target The trigger functionality’s target station and signal.
Target station and signal is chosen by the dropdown list for station and signal When a trigger is activated (ON), an alarm gets activated for the station:
Only one target can be set for a trigger maneuver.
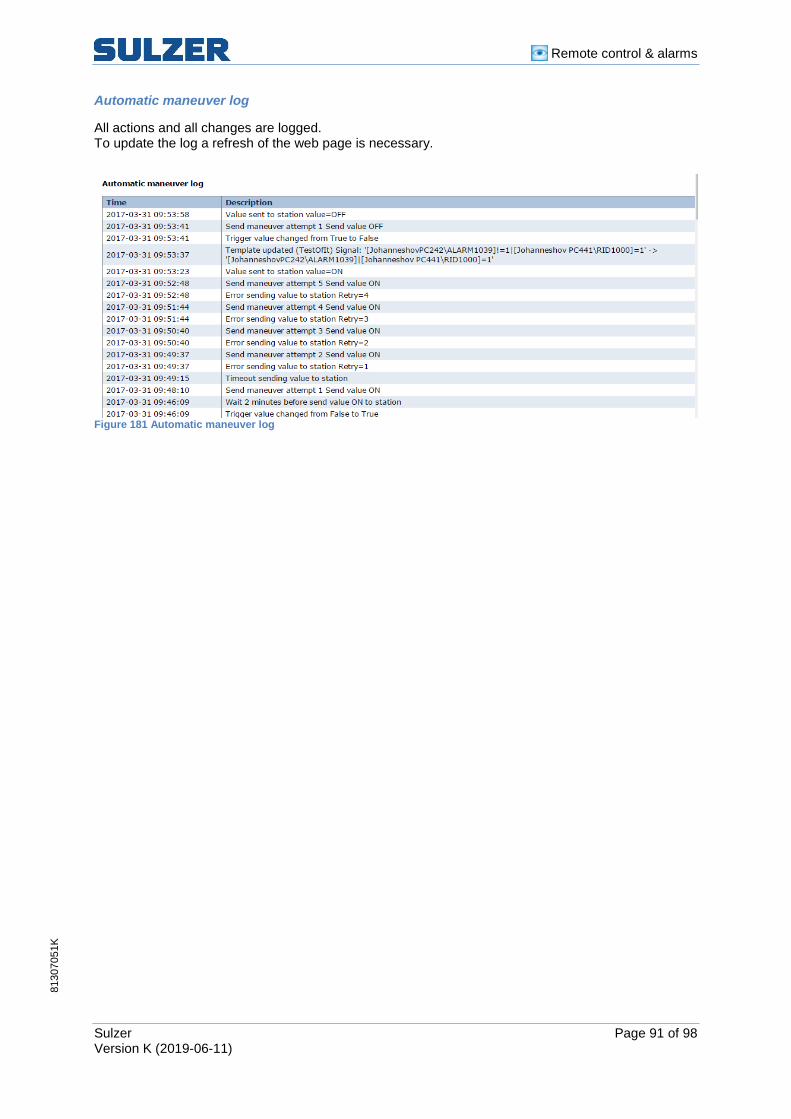
Remote control & alarms
Sulzer Page 91 of 98 Version K (2019-06-11)
81307051K
Automatic maneuver log
All actions and all changes are logged. To update the log a refresh of the web page is necessary.
Figure 181 Automatic maneuver log

Remote control & alarms
Sulzer Page 92 of 98 Version K (2019-06-11)
81307051K
Multi Mimic It can be useful to see process mimics from many stations in one screen. In order to see stations in a Multi Mimic you first have to create a template, under Setup/Multi Mimics. Contract level needs to be CMS 251 Remote Control & Alarms.
Figure 182 Multi Mimics
Multi mimic templates Under Setup/Multi Mimics you can find the list of the existing multi mimics, here you can choose to edit an existing multi mimic, copy it or add a new one.
Edit multi mimic templates Inside the edit page (Setup/Multi Mimics) you must choose a name for the multi mimic. Then you choose which stations will be a part of this multi mimic, with the arrows you can choose in which order to display them. After that you will choose which signals to show. The signal can be a numerical value, a time value or a digital value. For the numerical values it is possible to make formulas using one or more signals. There is an option to show the stations on rows or in columns and if you want to include the alarms and the operator log. The multi mimic will not be saved until you press ok.

Remote control & alarms
Sulzer Page 93 of 98 Version K (2019-06-11)
81307051K
Figure 183 Edit/Create Multi Mimics
The difference on having stations on rows or in columns is shown below. The first picture is on rows and the second is in columns. The only difference is how it is displayed, there is no difference in output or functionality.
Figure 184 Multi Mimics rows
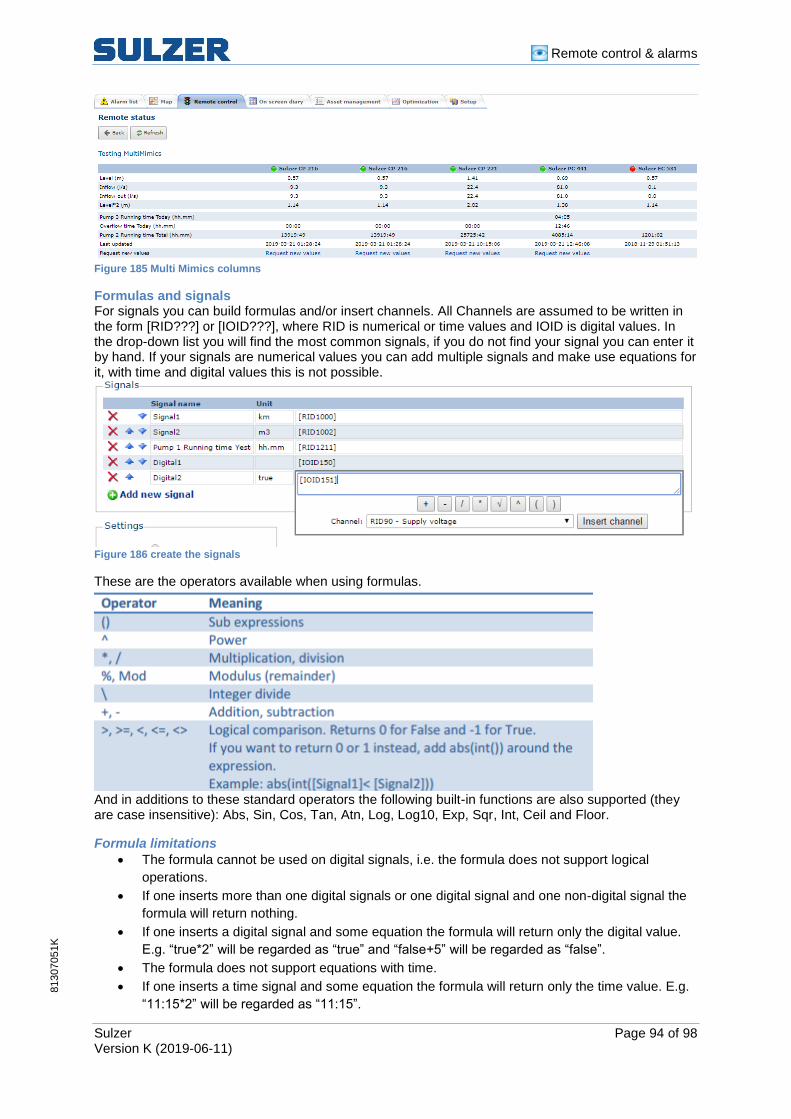
Remote control & alarms
Sulzer Page 94 of 98 Version K (2019-06-11)
81307051K
Figure 185 Multi Mimics columns
Formulas and signals For signals you can build formulas and/or insert channels. All Channels are assumed to be written in the form [RID???] or [IOID???], where RID is numerical or time values and IOID is digital values. In the drop-down list you will find the most common signals, if you do not find your signal you can enter it by hand. If your signals are numerical values you can add multiple signals and make use equations for it, with time and digital values this is not possible.
Figure 186 create the signals
These are the operators available when using formulas.
And in additions to these standard operators the following built-in functions are also supported (they are case insensitive): Abs, Sin, Cos, Tan, Atn, Log, Log10, Exp, Sqr, Int, Ceil and Floor.
Formula limitations
• The formula cannot be used on digital signals, i.e. the formula does not support logical
operations.
• If one inserts more than one digital signals or one digital signal and one non-digital signal the
formula will return nothing.
• If one inserts a digital signal and some equation the formula will return only the digital value.
E.g. “true*2” will be regarded as “true” and “false+5” will be regarded as “false”.
• The formula does not support equations with time.
• If one inserts a time signal and some equation the formula will return only the time value. E.g.
“11:15*2” will be regarded as “11:15”.

Remote control & alarms
Sulzer Page 95 of 98 Version K (2019-06-11)
81307051K
• The formula will not work with having multiple signals including one which is a time signal, i.e.
if one or more signal is a time signal in an equation containing more than one signal the
formula will not work.
• The formula assumes all signal starting with RID to either be numerical values or time values.
• The formula assumes all signal starting with IOID to be digital values.
Displaying a multi mimic Under Remote control/MultiMimics a hyper link redirects to the multi mimic of interest.
Figure 187 Multi Mimics display
The first table will show the stations and signals you picked in the edit part. For stations which are connected you can Request new values, the program will then try to connect to the station and fetch new values. If you press refresh it will fetch new values from the database, not connecting to the station. The Last updated column shows what time and date the signal was collected. The second table is the alarm log, here will you see up to the last 20 alarms for all the stations in the multi mimic. The third table is the operatorlog, here will you see up to the last 20 posts in the operatorlog.

Remote control & alarms
Sulzer Page 96 of 98 Version K (2019-06-11)
81307051K
Figure 188 Display Multi Mimics

81307051I
Links Troubleshooting guide and other AquaWeb related information can be found at: abscm.se Sulzer global site for C&M: https://www.sulzer.com/en/products/control-and-monitoring-equipment

81307051I
Sulzer Pump Solutions Ireland Ltd, Clonard Road, Wexford, Ireland
Tel +353 53 91 63 200, www.sulzer.com