ar09 pg1-64 final - creative technologyimages.americas.creative.com/docs/fy09.pdfdigital signs,...
TRANSCRIPT

1
CONTENTS
Chairman’s Message 2
Board of Directors and Executive Officers 4
Corporate Governance 5
Directors’ Report 10
Statement by Directors 14
Independent Auditor’s Report 15
Consolidated Income Statement 16
Balance Sheets 17
Consolidated Statement of Changes in Equity 18
Consolidated Cash Flow Statement 19
Notes to the Financial Statements 20
SGX-ST Listing Manual Requirements 62
AR09 pg1-64_Final.indd 1 10/2/2009 10:38:05 AM

2
CREATIVE TECHNOLOGY LTD AND ITS SUBSIDIARIES
CHAIRMAN’S MESSAGE
Dear Shareholders,
In my message last year, I shared our vision to create a totally new Creative, with a new product line and a new business model, leveraging on the innovative technologies we have developed over the years which will again see Creative set a major trend in the industry and open up opportunities for all.
We started unveiling this vision with the launch of our System-on-Chip, the ZiiLABS ZMS-05 SoC, and the Zii Platform, ushering in the era of StemCell Computing. The Zii Platform includes our Plaszma OS, Plaszma SDK and the Zii EGG for developers, which runs the Plaszma OS or Android OS. The Zii Platform also includes the ZMS-05 System Module, a compact, media-rich module targeted for outside developers and OEMs to use with Plaszma software to significantly reduce the design and manufacturing complexity in creating next-generation devices and applications.
With our Zii Platform and the ZMS-05 System Module, we now have solutions to sell into the huge ‘Shanzhai’ OEM market in China, which is a key part of our new business model. We recently announced our ‘Shanzhai’ OEM Marketing Program that will outreach and build demand in this burgeoning OEM market. The ‘Shanzhai’ OEMs and other enterprising organizations around the world may not have brands of their own, but they do have an insatiable appetite for ready-to-go technologies, and can adapt quickly to new market opportunities. Using our Zii Platform and ZMS-05 System Module, these enterprising OEMs can leverage on our state-of-the-art technologies and brand equities to rapidly bring a plethora of high quality and low cost Zii-powered products to market. These products can possibly include mobile phones, TV set-top boxes, video conferencing systems, digital signs, netbooks, eBooks and other mobile communication devices.
In addition, we plan to utilize the Zii Platform in a new line of our own Zii-branded products, including portable media players, speakers, audio solutions and other personal digital entertainment devices.
The development of the Zii Platform has required a significant ongoing investment in research and development. Now that we are bringing the Zii Platform to market and beginning to deliver on our new vision, we will also require a substantial investment in marketing to build our new business model. We are prepared to make these strategic expenditures, as our strong cash position of over US$250 million provides us with the financial flexibility to continue to invest in the development and marketing of the Zii Platform, and to take advantage of the opportunities for new product lines and businesses offered by the Zii Platform.
Our strong cash position was a bright spot in an otherwise difficult and challenging fiscal year for Creative, with an extremely turbulent and uncertain global economic environment.
With the onset of the unprecedented crisis in the global financial markets and the resulting global economic downturn, we took aggressive measures to position Creative to meet the challenges in the tough period ahead of us. We undertook a complete restructuring of our worldwide sales and marketing operations, including closing or consolidating certain operations that were too costly or underperforming. We significantly lowered our operating expenses by sharply reducing our international headcount and infrastructure costs, primarily in Europe and the US, while simultaneously driving down our inventory position, substantially reducing inventory exposure.
The global economic downturn had a negative impact on the demand and selling prices for our products across all product categories and, combined with the closure or consolidation of certain businesses, resulted in substantially lower revenues and gross margins for the year.
Sales for fiscal year 2009 were US$466 million, 37% lower than the previous fiscal year sales of US$737 million. Gross profit as a percentage of sales came in at 17% in fiscal 2009, down from 22% in fiscal 2008. Net loss for fiscal 2009 was US$138 million, compared to a net income of US$128 million in fiscal 2008. Net loss for fiscal 2009 was impacted by the lower sales and gross profit in the year, and restructuring charges of US$11.2 million, exchange losses of US$24.9 million, investment losses of US$13.2 million, and a provision of US$12.8 million for potential unrecoverable advances due from a former subsidiary that had been divested in 2007. Net income for fiscal 2008 included a US$148 million gain from the sale of Creative’s headquarters building (Creative Resource) in Singapore, an exchange gain of US$14.6 million, an investment gain of US$18.8 million and restructuring charges of US$11.7 million.
AR09 pg1-64_Final.indd 2 10/2/2009 10:38:05 AM

3
CREATIVE TECHNOLOGY LTD AND ITS SUBSIDIARIES
During the 2009 fiscal year, we repaid the entire US$100 million outstanding balance of our syndicated term loan. We are now practically debt-free, with no bank borrowing and a strong balance sheet with over US$250 million in cash.
Notwithstanding the challenges from the adverse market conditions during the year, we continued with our research and development efforts for our current product lines in areas that hold promise for the future, and introduced exciting new products in each category.
In our audio business, we expanded our market potential, launching the Sound Blaster Wireless for iTunes together with Wireless Receivers, the first time we have targeted the huge base of iTunes users on both the PC and the Mac. Sound Blaster Wireless for iTunes allows users to significantly improve the audio quality of music, movies and games on their notebooks and play them wirelessly through speakers in any room in the home. We also extended our Sound Blaster X-Fi product line by introducing the PCI Express Sound Blaster X-Fi Titanium Fatal1ty Professional Series and the PCI Express Sound Blaster Titanium Fatal1ty Champion Series sound cards. These high-performance sound cards unleashed the full power of our X-Fi technology and EAX ADVANCED HD audio processing.
For the multimedia speaker business, we announced our highest-end GigaWorks T3 speaker system that delivers audio precision in style. We also updated our main speaker offerings with the introduction of the GigaWorks T40 Series II and GigaWorks T20 Series II, and the Inspire T3200 and Inspire T6200 speaker systems.
For our headphone business, we introduced the ultra-lightweight and stylish Aurvana Air earphones, the latest addition to our premium Aurvana designer earphone series. We also extended our earphone offerings with the introduction of the Creative EP-630 in-ear stereo earphones in a variety of fun and exciting colors, and the Creative EP-430 noise-isolating in-ear earphones.
For the PC gaming market, we unveiled the Sound Blaster Arena Surround USB Gaming Headset, the Creative Fatal1ty Professional Series Gaming Headset Mk II and the Digital Wireless Gaming Headset HS-1200. These high-performance headsets provide gamers with our advanced proprietary audio technologies to further enhance their gaming experiences.
To differentiate our MP3 players in a highly competitive global MP3 market, we added our X-Fi audio technology to the high end of our product line with the introduction of the Creative ZEN X-Fi early in the fiscal year, followed by the Creative ZEN X-Fi2 in September 2009. These are the only players that have award-winning X-Fi audio enhancement solutions that significantly improve the quality of MP3 music playback.
We also introduced the Vado Pocket Video Cam, followed by the next generation Vado HD Pocket Video Cam. The user-friendly Vado HD allows users to shoot videos in high definition, easily share them online, and play them back in true HD on an HDTV with our HDMI connection.
Looking ahead, the global economic outlook remains uncertain, and the overall market for Creative’s current products remains difficult and unpredictable. However, with the aggressive restructuring efforts we have taken, we are now a much leaner company with a lower operating cost structure, which allows us to weather these challenges and positions us well when the global economy recovers.
With Zii, I see a bright and exciting Creative finally emerging in the horizon.
Thank you.
Sim Wong HooChairman & Chief Executive Officer
AR09 pg1-64_Final.indd 3 10/2/2009 10:38:05 AM

4
CREATIVE TECHNOLOGY LTD AND ITS SUBSIDIARIES
BOARD OF DIRECTORS AND EXECUTIVE OFFICERS
DIRECTORS AND EXECUTIVE OFFICERS
Creative’s directors and executive officers are as follows:-
Name Age Position
Sim Wong Hoo 54 Chairman of the Board and Chief Executive Officer
Lee Kheng Nam 61 Director
Ng Kai Wa 53 Director
Lee Gwong-Yih 54 Director
Ng Keh Long 50 Chief Financial Officer
SIM WONG HOO founded Creative in Singapore in 1981 and has been its Chairman of the Board and Chief Executive Officer since its inception.
LEE KHENG NAM became a Director of Creative in 1991. Mr Lee is currently a non-executive chairman of Vertex Management (II) Pte Ltd, and has been appointed as non-executive chairman of Vertex Venture Holdings Ltd (“VVH”) on 1 September 2008, which are wholly-owned subsidiaries of Temasek Holdings (Private) Limited, engaged in the venture capital direct investment and fund management business. He is also the Chairman of Advantec Pte Ltd, an investment holding company. From March 1995 to February 2004, Mr Lee was the President of Vertex Management Pte Ltd and executive director of VVH. He is a Director of 2 listed companies - Creative Technology Ltd and China Finance Online Co Ltd. Mr. Lee formerly served on the boards of Centillium Communications Inc, Chartered Semiconductor Manufacturing Ltd, GRIC Communications Inc., ActivCard Corp and Gemplus International S.A. Prior to joining the Singapore Technologies Group, Mr. Lee was with NatSteel group as the Manager of the Project Development Department and the Ministry of National Development where he was Deputy Director of Planning. Mr. Lee holds a Bachelor of Science degree in Mechanical Engineering (First Class Honours) from Queen’s University, Canada and a Master of Science degree in Operations Research & Systems Analysis from the U.S. Naval Postgraduate School.
NG KAI WA became a Director of Creative in 2005. He has been the Co-Founder, Chairman and Chief Executive Officer of InnoMedia Pte Ltd since 1995. InnoMedia is a leading supplier of broadband IP Telephony solutions that deliver high quality-voice and video over IP network, targeted to the broadband service providers, enterprises, consumers and OEM customers. Prior to that, he was the Co-Founder, Chief Technology Officer and Vice Chairman of the Board of Creative Technology Ltd. Mr. Ng holds an Executive Master of Business Administration Degree from the National University of Singapore and a Diploma in Electronic and Electrical Engineering from Ngee Ann Polytechnic.
LEE GWONG-YIH became a Director of Creative in 2009. He is currently Chairman of the Board of CyberTAN Technology, Inc., a leading networking company listed in Taiwan, and Chairman of ApaceWave Technologies, Inc., a broadband wireless company. From September 1999 to January 2004, Mr. Lee served as General Manager and Senior Director at Cisco Systems, Inc. In March 1998, Mr. Lee established TransMedia Communications, a communication equipment company, and served as its President and Chief Executive Officer until September 1999 when TransMedia Communications was acquired by Cisco Systems, Inc. Mr. Lee holds a Bachelor of Science degree in Control Engineering from National Chiao-Tung University in Taiwan and a Master of Science degree in Electrical Engineering from New York University.
NG KEH LONG joined the Company in April 1993 as Financial Controller and held various financial positions until May 1996, when he was appointed as Vice President, Corporate Treasurer and Acting Chief Financial Officer. In 1998 he was appointed as Chief Financial Officer. Prior to joining Creative, he was a Senior Manager with Price Waterhouse (now PricewaterhouseCoopers LLP), where he gained more than ten years’ experience in finance, accounting and auditing. Mr. Ng is a member of the Institute of Certified Public Accountants in Singapore.
AR09 pg1-64_Final.indd 4 10/2/2009 10:38:05 AM

5
CREATIVE TECHNOLOGY LTD AND ITS SUBSIDIARIES
CORPORATE GOVERNANCE– For the financial year ended 30 June 2009
Creative Technology Ltd (“Creative” or the “Company”, and together with its subsidiaries, the “Group”) is committed to maintaining good corporate governance in accordance with the principles and guidelines set out in the Code of Corporate Governance released by the Council on Corporate Disclosure and Governance in 2005 (the “Code”). Creative’s approach on corporate governance takes into consideration the principles and guidelines set out in the Code.
This report outlines the main corporate governance practices that were in place throughout the financial year, with specific references to each of the principles of the Code.
PRINCIPLE 1: THE BOARD’S CONDUCT OF ITS AFFAIRS
The principal functions of the Board of Directors of the Company (the “Board”) are to provide guidance and to decide on certain important matters, including those involving the review and approval of strategic plans, direction and policies, to review the Group’s performance, to review the adequacy and integrity of internal controls, and to approve material acquisitions and disposals of assets.
These functions are either carried out directly by the Board or through committees, namely the Audit Committee, the Nominating Committee and the Remuneration Committee, established by the Board (collectively referred to as “Board Committees”).
Matters which are specifically reserved to the full Board for decision-making include those involving the review and approval of strategic plans, direction and policies, material acquisitions and disposals of assets, corporate or financial restructuring and share issuances, dividends and other returns to shareholders.
The Articles of Association of the Company allow the Company’s Directors to participate in a Board meeting by telephone conference or video conference whereby all persons participating in the meeting are able to communicate as a group, without requiring the Directors’ physical presence at the meeting. The composition of the Board, the Audit Committee, and the frequency and attendance of the Directors in the financial year ended 30 June 2009 are disclosed below.
Name of Director Board Audit Committee
(Number of Meetings Held) (6) (7)
Sim Wong Hoo 6 –
Lee Kheng Nam 6 7
Ng Kai Wa 6 7
Tan Lip-Bu 3 – (Resigned on 30 January 2009)
Tang Chun Choy 5 5 (Resigned on 30 March 2009)
Lee Gwong-Yih – – (Appointed on 12 June 2009)
The members of the Nominating Committee and the Remuneration Committee perform their respective functions mainly via consultations and discussions with each other.
PRINCIPLE 2: BOARD COMPOSITION AND BALANCE
The Board comprises four members, one of whom is an Executive Director and three of whom are independent non-Executive Directors. Key information regarding the Directors is disclosed in Board of Directors and Executive Officers.
The Executive Director is Mr Sim Wong Hoo, the Chairman and Chief Executive Officer of the Company. He is also a substantial shareholder.
AR09 pg1-64_Final.indd 5 10/2/2009 10:38:05 AM

6
CREATIVE TECHNOLOGY LTD AND ITS SUBSIDIARIES
CORPORATE GOVERNANCE– For the financial year ended 30 June 2009
PRINCIPLE 2: BOARD COMPOSITION AND BALANCE (cont’d)
The independent non-Executive Directors are Mr Lee Kheng Nam, Mr Ng Kai Wa and Mr Lee Gwong-Yih.
The Board is of the view that the current Board, with independent non-Executive Directors making up at least one-third of the Board, provides for a strong and independent element on the Board capable of exercising objective judgement on corporate affairs of the Group. No individual or small group of individuals dominates the Board’s decision-making.
PRINCIPLE 3: CHAIRMAN AND CHIEF EXECUTIVE OFFICER
The Company has the same Chairman and Chief Executive Officer (“CEO”), Mr Sim Wong Hoo. The Company believes that the independent non-Executive Directors have demonstrated high commitment in their role as Directors and have ensured that there is a good balance of power and authority. As such, there is no need for the role of the Chairman and CEO to be separated.
Mr Sim Wong Hoo is a substantial shareholder of the Company with a shareholding of approximately 33.78%. With his substantial shareholding, his interest is aligned with the Company and that of the other shareholders.
PRINCIPLE 4: BOARD MEMBERSHIP
The Nominating Committee (the “NC”) consists of three members, two of whom are independent non-Executive Directors. The Chairman of the NC, Mr Ng Kai Wa, is an independent non-Executive Director. The other two members are Mr Sim Wong Hoo, an Executive Director, and Mr Lee Kheng Nam, an independent non-Executive Director.
The principal functions of the NC are, among other matters, to recommend all Board and Board Committee appointments, re-appointments or re-elections, to determine the independence of each Director, and to identify new Directors who have the diversity of experience and appropriate knowledge and skills to contribute effectively to the Board.
New Directors are at present appointed by way of a Board resolution, after the NC approves their appointment. The Company’s Articles of Association provides that all Directors except Executive Directors are to retire at least once every three years by rotation, if they are appointed by the Company at a general meeting, and a newly appointed Director must submit himself for re-election at the next Annual General Meeting. The retiring Director is nonetheless eligible for re-election by shareholders at every Annual General Meeting. Accordingly, Mr. Lee Kheng Nam and Mr. Lee Gwong-Yih will, on the date of the Annual General Meeting, retire as Directors. The NC recommends their re-appointments as Directors at the Annual General Meeting to be held on 29 October 2009.
PRINCIPLE 5: BOARD PERFORMANCE
A review of the Board’s performance will be undertaken collectively by the Board as a whole. The Company believes that the Board’s performance is ultimately reflected in the performance of the Group. The Board, through the delegation of its authority to the NC, ensures that the Directors appointed to the Board possess the relevant necessary background, experience, knowledge and skills so as to enable each Director to bring to the Board an independent and objective perspective to contribute to the effectiveness of the Board.
The Company believes that apart from the Directors’ fiduciary duties (i.e. acting in good faith, with due diligence and care, and in the best interests of the Company and its shareholders), the Board’s key responsibilities are to set strategic directions and to ensure that the long term objective of enhancing shareholders’ wealth is achieved.
PRINCIPLE 6: ACCESS TO INFORMATION
In order to ensure that the Board is able to fulfill its responsibilities, management provides the Board members with regular updates of the performance and financial position of the Group including quarterly updates. Management staff and the Company’s auditor, who can provide insight into the matters for discussion, are also invited from time to time to attend such meetings. The Company Secretary attends all Board meetings and ensures that all Board procedures are followed. The Company Secretary,
AR09 pg1-64_Final.indd 6 10/2/2009 10:38:05 AM

7
CREATIVE TECHNOLOGY LTD AND ITS SUBSIDIARIES
together with other management staff of the Company, also ensures that the Company complies with the applicable statutory and regulatory rules.
The Directors have separate and independent access to the Company’s senior management and the Company Secretary at all times. Should the Directors, whether as a group or individually, need independent professional advice, the Company will appoint a professional advisor selected by the group or individual, and approved by the Chairman and CEO, to render the advice. The cost of such independent professional advice will be borne by the Company.
PRINCIPLE 7: PROCEDURES FOR DEVELOPING REMUNERATION POLICIES PRINCIPLE 8: LEVEL AND MIX OF REMUNERATION PRINCIPLE 9: DISCLOSURE ON REMUNERATION
The Remuneration Committee (the “RC”) consists of three Directors, two of whom are independent non-Executive Directors. The Chairman of the RC is Mr Sim Wong Hoo, an Executive Director. The other two members are Mr Lee Kheng Nam and Mr Ng Kai Wa, both of whom are independent non-Executive Directors.
The principal functions of the RC are, among other matters, to recommend to the Board the structure of the compensation programme for each Board member and the CEO (or executive of equivalent rank) to ensure that the programme is competitive and sufficient to attract, retain and motivate each Board member and CEO of the required quality to run the Company successfully; to review each Board member’s and CEO’s compensation annually and determine appropriate adjustments where necessary; and to review any other long term incentive schemes which may be set up from time to time. The RC members are also members of the committees administering the existing Employee Share Option Plans and the new Creative Performance Share Plan.
Mr Sim Wong Hoo, the Chairman and CEO of the Company, and the Chairman of the RC, has received a nominal sum of S$1 as his annual remuneration for the financial years ended 30 June 2008 and 2009. He has also opted to be excluded from participating in the new Creative Performance Share Plan.
Taking into consideration the remuneration package of Mr Sim Wong Hoo, there is minimal risk of any potential conflict of interest, and his ability to perform the role of the Chairman of the RC is similar to that of a non-Executive Director. Accordingly, the Board is of the view that he is suitable to perform the role of the Chairman of the RC.
The Company adopts a remuneration policy for employees comprising a fixed component and a variable component. The fixed component is in the form of a base salary. The variable component is in the form of a variable bonus that is linked to the Company’s and the individual employee’s performance. Another element of the variable component is the grant of performance shares to employees under the Company’s Performance Share Plan. This seeks to align the interests of the employees with that of the shareholders. Staff appraisals are conducted twice a year.
Each non-Executive Director is paid an annual Director’s fee of S$60,000 (pro-rated where length of service is less than one year) and is subject to shareholders’ approval at the Annual General Meeting. The Director’s fee proposed to be paid to each of the Directors for the financial year ended 30 June 2009 is as follows:
Name of Director Director’s Fee*
Lee Kheng Nam S$60,000
Ng Kai Wa S$60,000
Tan Lip-Bu S$35,000 (Resigned on 30 January 2009)
Tang Chun Choy S$45,000 (Resigned on 30 March 2009)
Lee Gwong-Yih S$5,000 (Appointed on 12 June 2009)
* Executive Directors are not paid a Director’s Fee.
AR09 pg1-64_Final.indd 7 10/2/2009 10:38:05 AM

8
CREATIVE TECHNOLOGY LTD AND ITS SUBSIDIARIES
CORPORATE GOVERNANCE– For the financial year ended 30 June 2009
PRINCIPLE 7: PROCEDURES FOR DEVELOPING REMUNERATION POLICIES PRINCIPLE 8: LEVEL AND MIX OF REMUNERATION PRINCIPLE 9: DISCLOSURE ON REMUNERATION (cont’d)
The number of top five key executives of the Group (who are also not Directors) in remuneration bands is as follows:
Remuneration Bands Number of Key Executives
S$500,000 to S$749,999 2
S$250,000 to S$499,999 3
Below S$250,000 –
For confidentiality and competitive reasons, the Company is not disclosing each individual executive’s remuneration and their names.
None of the employees of the Group whose annual remuneration exceeds S$150,000 are immediate family members of the CEO or any other Director of the Company,
Details of the existing Creative Employee Share Option Plans are set out in the Notes to the Financial Statements.
PRINCIPLE 10: ACCOUNTABILITY
The Company provides shareholders with quarterly and annual financial results of the Group within the regulatory reporting periods, i.e. results for the first 3 quarters are released to shareholders within 45 days of the end of each quarter whilst the annual results are released within 60 days from the financial year end. In presenting the Group’s annual and quarterly results, the Board aims to provide shareholders with a balanced and understandable assessment of the Group’s performance and financial position with a commentary at the date of the announcement of the significant trends and competitive conditions of the industry in which it operates.
The management provides all Directors with financial updates of the Group’s performance, when required.
PRINCIPLE 11: AUDIT COMMITTEE
The Audit Committee (the “AC”) consists of three Directors, all of whom are independent non-Executive Directors. The Chairman of the AC is Mr Lee Kheng Nam. The other two members are Mr Ng Kai Wa and Mr Lee Gwong-Yih. All members of the AC have the appropriate accounting or relevant financial expertise or experience. The principal functions of the AC, among other matters, are:• to review the quarterly and full year financial statements to be issued by the Group with management and, where appropriate,
with the Company’s external auditors, before their submission to the Board;• to review the scope and results of the audit and its cost-effectiveness and the independence and objectivity of the external
auditors;• to review the effectiveness of the internal audit function; • to make recommendations to the Board on the appointment, re-appointment and/or removal of external auditors, and to
approve the remuneration and terms of engagement of the external auditors; and• to review interested person transactions.
The number of meetings convened by the AC is set out in Principle 1: The Board’s Conduct of its Affairs.
AR09 pg1-64_Final.indd 8 10/2/2009 10:38:06 AM

9
CREATIVE TECHNOLOGY LTD AND ITS SUBSIDIARIES
PRINCIPLE 12: INTERNAL CONTROLS
The Board acknowledges that it is responsible for the overall internal control framework, but recognises that no cost effective internal control system will preclude all errors and irregularities, as such a system is designed to manage rather than eliminate the risk of failure to achieve business objectives, and can provide only reasonable and not absolute assurance against material misstatement or loss.
The AC, on behalf of the Board, has reviewed the effectiveness of the internal control system put in place by the Company and is satisfied that there are adequate internal controls in the Company. The Directors regularly review the effectiveness of the internal controls, including operational controls.
The Company has in place a whistle-blowing procedure where staff of the Group can raise in confidence concerns on possible improprieties relating to accounting, financial reporting, internal controls and auditing matters. Under these procedures, arrangements are in place for independent investigation of such matters raised and for appropriate follow up action to be taken.
PRINCIPLE 13: INTERNAL AUDIT
The Internal Audit (“IA”) team is independent of the activities that it audits. The Head of IA’s primary reporting line is to the Chairman of the AC with an administrative line of reporting to the Chief Financial Officer of the Company. The AC reviews the annual IA plans and resources to ensure that the IA has the necessary resources to adequately perform its functions. The AC also reviews the IA’s reports and activities on a quarterly basis.
PRINCIPLE 14: COMMUNICATION WITH SHAREHOLDERS
The Company announces its quarterly and full year results within the regulatory period. Material and price-sensitive information is publicly released via SGXNET on a timely basis. All shareholders of the Company receive the annual report of the Company and the notice of the Annual General Meeting, for which a notice is also advertised in the press and released via SGXNET. Shareholders and investors can access information on the Company at its website at www.creative.com which provides, inter alia, corporate announcements, press releases and the latest financial results as disclosed by the Company on SGXNET. From time to time, the Company holds briefings with analysts and the media to coincide with the release of the Group’s results.
PRINCIPLE 15: GREATER SHAREHOLDER PARTICIPATION
At general meetings of the Company, shareholders are given the opportunity to communicate their views and ask the Directors and management questions regarding matters affecting the Company. The Board, external auditors and senior management are normally available at the Annual General Meeting to respond to, and to assist the Directors in responding to shareholders’ questions.
In accordance with the Articles of Association of the Company, shareholders may appoint not more than two proxies to attend and vote on their behalf. A proxy need not be a member of the Company. DEALINGS IN SECURITIES
In line with the recommended practices on dealings in securities set out in the SGX-ST Listing Rules, the Company provides internal guidance with regards to dealing in the Company’s securities by its Directors and officers. These guidelines prohibit dealing in the Company’s securities on short-term considerations and while in possession of unpublished material price-sensitive information in relation to such securities, and during the period commencing two weeks before the announcement of Group’s financial statements for each of the first three quarters of its financial year and one month before the announcement of the Group’s full year financial statements.
AR09 pg1-64_Final.indd 9 10/2/2009 10:38:06 AM

10
CREATIVE TECHNOLOGY LTD AND ITS SUBSIDIARIES
The directors present their report to the members together with the audited financial statements of the Group for the financial year ended 30 June 2009 and the balance sheet of the Company as at 30 June 2009.
1. DIRECTORS The directors of the Company in office at the date of this report are as follows:
Sim Wong Hoo Lee Kheng Nam Ng Kai Wa Lee Gwong-Yih (appointed on 12 June 2009)
2. ARRANGEMENTS TO ENABLE DIRECTORS TO ACQUIRE SHARES AND DEBENTURES Neither at the end of nor at any time during the financial year was the Company a party to any arrangement whose object
was to enable the directors of the Company to acquire benefits by means of the acquisition of shares in, or debentures of, the Company or any other body corporate, other than as disclosed under “Share options” on pages 11 and 12 of this report.
3. DIRECTORS’ INTERESTS IN SHARES OR DEBENTURES (a) According to the register of directors’ shareholdings, none of the directors holding office at the end of the financial year
had any interest in the shares or debentures of the Company or its related corporations, except as follows:
Holdings registered in the Holdings in which director name of director or nominee is deemed to have an interest
At 1.7.2008 At 1.7.2008 or date of or date of At At appointment, At At appointment, Name of director 21.7.2009 30.6.2009 if later 21.7.2009 30.6.2009 if later
Creative Technology Ltd (Number of ordinary shares)
Sim Wong Hoo 23,270,652 23,270,652 23,984,602 – – –
Lee Kheng Nam – – – 10,000 10,000 10,000
Ng Kai Wa 2,362,005 2,362,005 2,362,005 – – –
In addition, by virtue of his interest of not less than 20% in the issued share capital of Creative Technology Ltd., Sim Wong Hoo is also deemed under the Companies Act to have interests in all of the Company’s subsidiaries.
(b) According to the register of directors’ shareholdings, certain directors holding office at the end of the financial year had interests in options to subscribe for ordinary shares of the Company granted pursuant to the Creative Technology (1999) Share Option Scheme (“1999 Scheme”) as set out below and under “Share options” on pages 11 and 12 of this report.
Number of unissued ordinary shares under share option
Name of director At 30.6.2009 At 1.7.2008
Lee Kheng Nam 80,000 80,000
Ng Kai Wa 80,000 80,000
None of the directors of the Company at the end of the financial year had any interest in debentures of the Company or any related corporations.
DIRECTORS’ REPORT– For the financial year ended 30 June 2009
AR09 pg1-64_Final.indd 10 10/2/2009 10:38:06 AM
11
CREATIVE TECHNOLOGY LTD AND ITS SUBSIDIARIES
4. DIRECTORS’ CONTRACTUAL BENEFITS Since the end of the previous financial year, no director has received or become entitled to receive a benefit by reason of a
contract made by the Company or a related corporation with the director or with a firm of which he is a member or with a company in which he has a substantial financial interest, except as disclosed in the accompanying financial statements and in this report.
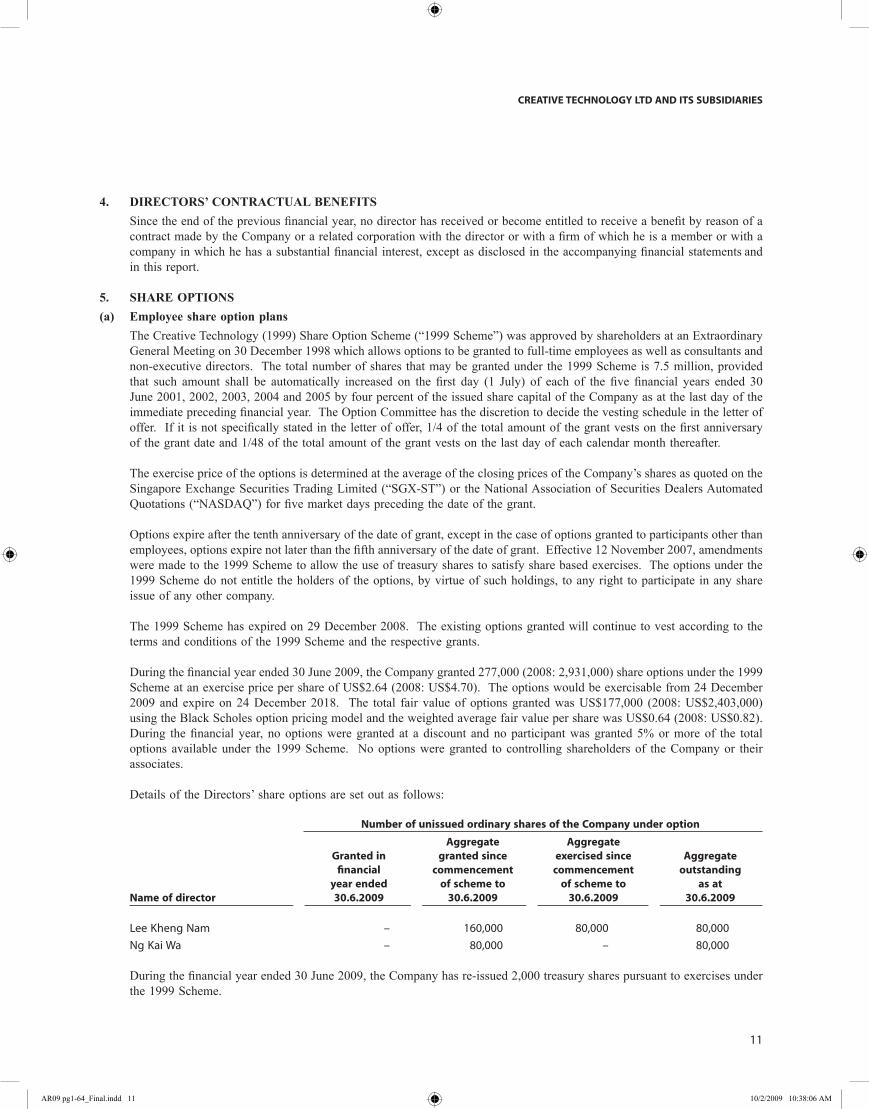
5. SHARE OPTIONS(a) Employee share option plans The Creative Technology (1999) Share Option Scheme (“1999 Scheme”) was approved by shareholders at an Extraordinary
General Meeting on 30 December 1998 which allows options to be granted to full-time employees as well as consultants and non-executive directors. The total number of shares that may be granted under the 1999 Scheme is 7.5 million, provided that such amount shall be automatically increased on the first day (1 July) of each of the five financial years ended 30 June 2001, 2002, 2003, 2004 and 2005 by four percent of the issued share capital of the Company as at the last day of the immediate preceding financial year. The Option Committee has the discretion to decide the vesting schedule in the letter of offer. If it is not specifically stated in the letter of offer, 1/4 of the total amount of the grant vests on the first anniversary of the grant date and 1/48 of the total amount of the grant vests on the last day of each calendar month thereafter.
The exercise price of the options is determined at the average of the closing prices of the Company’s shares as quoted on the Singapore Exchange Securities Trading Limited (“SGX-ST”) or the National Association of Securities Dealers Automated Quotations (“NASDAQ”) for five market days preceding the date of the grant.
Options expire after the tenth anniversary of the date of grant, except in the case of options granted to participants other than employees, options expire not later than the fifth anniversary of the date of grant. Effective 12 November 2007, amendments were made to the 1999 Scheme to allow the use of treasury shares to satisfy share based exercises. The options under the 1999 Scheme do not entitle the holders of the options, by virtue of such holdings, to any right to participate in any share issue of any other company.
The 1999 Scheme has expired on 29 December 2008. The existing options granted will continue to vest according to the terms and conditions of the 1999 Scheme and the respective grants.
During the financial year ended 30 June 2009, the Company granted 277,000 (2008: 2,931,000) share options under the 1999 Scheme at an exercise price per share of US$2.64 (2008: US$4.70). The options would be exercisable from 24 December 2009 and expire on 24 December 2018. The total fair value of options granted was US$177,000 (2008: US$2,403,000) using the Black Scholes option pricing model and the weighted average fair value per share was US$0.64 (2008: US$0.82). During the financial year, no options were granted at a discount and no participant was granted 5% or more of the total options available under the 1999 Scheme. No options were granted to controlling shareholders of the Company or their associates.
Details of the Directors’ share options are set out as follows: Number of unissued ordinary shares of the Company under option
Aggregate Aggregate Granted in granted since exercised since Aggregate financial commencement commencement outstanding year ended of scheme to of scheme to as at Name of director 30.6.2009 30.6.2009 30.6.2009 30.6.2009
Lee Kheng Nam – 160,000 80,000 80,000
Ng Kai Wa – 80,000 – 80,000
During the financial year ended 30 June 2009, the Company has re-issued 2,000 treasury shares pursuant to exercises under the 1999 Scheme.
AR09 pg1-64_Final.indd 11 10/2/2009 10:38:06 AM

12
CREATIVE TECHNOLOGY LTD AND ITS SUBSIDIARIES
5. SHARE OPTIONS (cont’d)(b) Share options outstanding The number of unissued ordinary shares of the Company under option in relation to the 1999 Scheme outstanding at the
end of the financial year was as follows:
Number of unissued ordinary shares Weighted under option at average Grant 30.6.2009 exercise price (US$) Expiry date
August 1999 1,888,866 $8.56 16 August 2009
October 1999 64,703 $8.56 28 October 2009
October 2001 1,059,530 $4.54 17 October 2011
January 2002 333,067 $7.61 2 January 2012
28 September 2009 to June 2002 225,626 $3.43
29 December 2011
October 2002 5,500 $6.41 11 October 2012
April 2003 17,500 $6.31 30 April 2013
January 2004 37,500 $10.31 5 January 2014
October 2005 2,268,000 $7.42 18 October 2015
December 2005 160,000 $8.21 12 December 2010
December 2007 2,676,354 $4.70 31 December 2017
December 2008 277,000 $2.64 24 December 2018
9,013,646
6. AUDIT COMMITTEE The Audit Committee of the Board of Directors was formed in 1992. The members of the Audit Committee at the end of
the financial year were as follows:
Lee Kheng Nam (Chairman) Ng Kai Wa Lee Gwong-Yih
All members of the Audit Committee were non-executive directors. In performing its functions, the Committee reviewed the audit plan and the overall scope of work of the Company’s independent auditor. It met with the auditor to discuss the results of its examination and its evaluation of the system of internal accounting control of the Company and its subsidiaries. The Committee also reviewed interested person transactions and the effectiveness of the internal audit function.
The Committee reviewed the balance sheet of the Company and the consolidated financial statements of the Group as well as the independent auditor’s report thereon and recommended to the Board of Directors the nomination of PricewaterhouseCoopers LLP as independent auditor of the Company at the forthcoming annual general meeting.
DIRECTORS’ REPORT– For the financial year ended 30 June 2009
AR09 pg1-64_Final.indd 12 10/2/2009 10:38:06 AM

13
CREATIVE TECHNOLOGY LTD AND ITS SUBSIDIARIES
7. INDEPENDENT AUDITOR The independent auditor, PricewaterhouseCoopers LLP, has expressed its willingness to accept re–appointment.
On behalf of the directors
Sim Wong Hoo Lee Kheng NamDirector Director
30 September 2009
AR09 pg1-64_Final.indd 13 10/2/2009 10:38:06 AM

14
CREATIVE TECHNOLOGY LTD AND ITS SUBSIDIARIES
In the opinion of the directors,
(a) the balance sheet of the Company and the consolidated financial statements of the Group as set out on pages 16 to 61 are drawn up so as to give a true and fair view of the state of affairs of the Company and of the Group as at 30 June 2009 and of the results of the business, changes in equity and cash flows of the Group for the financial year then ended; and
(b) at the date of this statement, there are reasonable grounds to believe that the Company will be able to pay its debts as and when they fall due.
On behalf of the directors
Sim Wong Hoo Lee Kheng NamDirector Director
30 September 2009
STATEMENT BY DIRECTORS– For the financial year ended 30 June 2009
AR09 pg1-64_Final.indd 14 10/2/2009 10:38:06 AM

15
CREATIVE TECHNOLOGY LTD AND ITS SUBSIDIARIES
INDEPENDENT AUDITOR’S REPORTto the members of Creative Technology Ltd.
We have audited the accompanying financial statements of Creative Technology Ltd. (the “Company”) and its subsidiaries (the “Group”) set out on pages 16 to 61, which comprise the balance sheets of the Company and of the Group as at 30 June 2009, and the consolidated income statement, the consolidated statement of changes in equity and the consolidated cash flow statement of the Group for the financial year then ended, and a summary of significant accounting policies and other explanatory notes.
Management’s Responsibility for the Financial StatementsManagement is responsible for the preparation and fair presentation of these financial statements in accordance with the provisions of the Singapore Companies Act (Cap. 50) (the “Act”) and Singapore Financial Reporting Standards. This responsibility includes:
(a) devising and maintaining a system of internal accounting control sufficient to provide a reasonable assurance that assets are safeguarded against loss from unauthorised use or disposition; and transactions are properly authorised and that they are recorded as necessary to permit the preparation of true and fair profit and loss accounts and balance sheets and to maintain accountability of assets;
(b) selecting and applying appropriate accounting policies; and
(c) making accounting estimates that are reasonable in the circumstances.
Auditor’s ResponsibilityOur responsibility is to express an opinion on these financial statements based on our audit. We conducted our audit in accordance with Singapore Standards on Auditing. Those Standards require that we comply with ethical requirements and plan and perform the audit to obtain reasonable assurance as to whether the financial statements are free from material misstatement.
An audit involves performing procedures to obtain audit evidence about the amounts and disclosures in the financial statements. The procedures selected depend on the auditor’s judgement, including the assessment of the risks of material misstatement of the financial statements, whether due to fraud or error. In making those risk assessments, the auditor considers internal control relevant to the entity’s preparation and fair presentation of the financial statements in order to design audit procedures that are appropriate in the circumstances, but not for the purpose of expressing an opinion on the effectiveness of the entity’s internal control. An audit also includes evaluating the appropriateness of accounting policies used and the reasonableness of accounting estimates made by management, as well as evaluating the overall presentation of the financial statements.
We believe that the audit evidence we have obtained is sufficient and appropriate to provide a basis for our audit opinion.
OpinionIn our opinion,
(a) the balance sheet of the Company and the consolidated financial statements of the Group are properly drawn up in accordance with the provisions of the Act and Singapore Financial Reporting Standards so as to give a true and fair view of the state of affairs of the Company and of the Group as at 30 June 2009 and the results, changes in equity and cash flows of the Group for the financial year ended on that date; and
(b) the accounting and other records required by the Act to be kept by the Company and by those subsidiaries incorporated in Singapore of which we are the auditor, have been properly kept in accordance with the provisions of the Act.
PricewaterhouseCoopers LLPPublic Accountants and Certified Public Accountants
30 September 2009
AR09 pg1-64_Final.indd 15 10/2/2009 10:38:06 AM

16
CREATIVE TECHNOLOGY LTD AND ITS SUBSIDIARIES
Group
2009 2008 Note US$’000 US$’000
Sales, net 466,074 736,848
Cost of goods sold 385,728 572,946
Gross profit 80,346 163,902
Expenses:
Selling, general and administrative (96,519) (141,148)
Research and development (61,743) (63,872)
Restructuring charges (11,168) (9,666)
Chairman’s gift of shares to employees – (3,774)
Total expenses 4 (169,430) (218,460)
Other income 6 4,277 12,370
Other (losses) gains, net 7 (50,951) 180,202
Share of loss of associated companies (2,498) (2,458)
Interest expense (135) (5,644)
(Loss) profit before income tax (138,391) 129,912
Income tax credit (expense) 8 515 (1,735)
Net (loss) profit (137,876) 128,177
Attributable to:
Equity holders of the Company (137,873) 128,178
Minority interests (3) (1)
(Loss) earnings per share for (loss) profit attributable to
equity holders of the Company 9
- Basic (US$ per share) (1.88) 1.55
- Diluted (US$ per share) (1.88) 1.55
CONSOLIDATED INCOME STATEMENT– For the financial year ended 30 June 2009
The accompanying notes form an integral part of these financial statements.
AR09 pg1-64_Final.indd 16 10/2/2009 10:38:06 AM

17
CREATIVE TECHNOLOGY LTD AND ITS SUBSIDIARIES
BALANCE SHEETS– As at 30 June 2009
Group Company
2009 2008 2009 2008 Note US$’000 US$’000 US$’000 US$’000
ASSETSCurrent assets:Cash and cash equivalents 10 250,551 408,644 218,472 276,477 Trade receivables 11 42,365 82,554 6,017 10,652 Amounts due from subsidiaries 12 – – 43,379 49,913 Inventories 13 37,600 99,788 18,104 59,283 Other current assets 14 21,448 50,153 4,934 18,357
351,964 641,139 290,906 414,682Non-current assets:Financial assets, available-for-sale 15 27,753 37,247 – 405 Other non-current receivables 16 977 10,892 – 9,192 Amounts due from subsidiaries 12 – – 186,395 185,607 Investments in associated companies 1,372 1,242 – 573 Investments in subsidiaries 17 – – 45,390 45,526 Property and equipment 18 33,944 34,243 2,060 1,724 Intangible assets 19 6,719 – – – Other non-current assets 20 31,693 46,484 768 2,726
102,458 130,108 234,613 245,753
Total assets 454,422 771,247 525,519 660,435
LIABILITIES AND EQUITYCurrent liabilities:Trade payables 21 30,296 66,507 18,608 52,821Amounts due to subsidiaries 12 – – 17,174 21,763 Accrued liabilities and provisions 22 70,014 91,704 28,852 31,233 Current income tax liabilities 2,203 5,287 2,000 3,120 Current portion of long term obligations 23 10 100,019 10 100,013
102,523 263,517 66,644 208,950 Non-current liabilities:Amounts due to subsidiaries 12 – – 20,526 2,473 Deferred income tax liabilities 24 29,510 29,746 13,800 14,044 Long term obligations 23 – 10 – 10
29,510 29,756 34,326 16,527
Total liabilities 132,033 293,273 100,970 225,477
Equity:Share capital 25 266,753 300,100 266,753 300,100 Treasury shares 25 (21,475) (32,113) (21,475) (32,113)Fair value reserve 7,151 3,377 – – Other reserves 26 60,512 59,286 33,049 31,823 Retained earnings 27 9,072 146,945 146,222 135,148
322,013 477,595 424,549 434,958 Minority interests 376 379 – –
Total equity 322,389 477,974 424,549 434,958
Total liabilities and equity 454,422 771,247 525,519 660,435
The accompanying notes form an integral part of these financial statements.
AR09 pg1-64_Final.indd 17 10/2/2009 10:38:06 AM

18
CREATIVE TECHNOLOGY LTD AND ITS SUBSIDIARIES
CONSOLIDATED STATEMENT OF CHANGES IN EQUITY– For the financial year ended 30 June 2009
Share Treasury Fair value Other Retained Minority Total capital shares reserve reserves earnings Total interests equity Note US$’000 US$’000 US$’000 US$’000 US$’000 US$’000 US$’000 US$’000 2009Balance at 1 July 2008 300,100 (32,113) 3,377 59,286 146,945 477,595 379 477,974Financial assets, available-for-sale - Fair value gain – – 3,774 – – 3,774 – 3,774Net profit recognised directly in equity 15 – – 3,774 – – 3,774 – 3,774 Net loss – – – – (137,873) (137,873) (3) (137,876)
Total recognised profit (loss) – – 3,774 – (137,873) (134,099) (3) (134,102)
Purchase of treasury shares 25 – (22,719) – – – (22,719) – (22,719)
Utilisation of treasury shares for shares issued under employee options plans 25 – 10 – (4) – 6 – 6 Cancellation of treasury shares 25 (33,347) 33,347 – – – – – –
Share option expense 26 – – – 1,230 – 1,230 – 1,230
Balance at 30 June 2009 266,753 (21,475) 7,151 60,512 9,072 322,013 376 322,389
2008Balance at 1 July 2007 300,086 – 24,240 53,949 30,295 408,570 373 408,943 Financial assets, available-for-sale - Fair value loss – – (17,965) – – (17,965) – (17,965) - Disposals – – (2,898) – – (2,898) – (2,898)Net loss recognised directly in equity 15 – – (20,863) – – (20,863) – (20,863)Net profit – – – – 128,178 128,178 (1) 128,177
Total recognised (loss) profit – – (20,863) – 128,178 107,315 (1) 107,314
Shares issued under employee options plans 25 14 – – – – 14 – 14 Chairman’s gift of shares to employees 26 – – – 3,774 – 3,774 – 3,774 Purchase of treasury shares 25 – (32,196) – – – (32,196) – (32,196)Utilisation of treasury shares for shares issued under employee options plans 25 – 83 – (5) – 78 – 78 Dividends paid 28 – – – – (11,528) (11,528) – (11,528)Currency translation differences on loan from minority shareholder – – – – – – 7 7
Share option expense 26 – – – 1,568 – 1,568 – 1,568
Balance at 30 June 2008 300,100 (32,113) 3,377 59,286 146,945 477,595 379 477,974
The accompanying notes form an integral part of these financial statements.
AR09 pg1-64_Final.indd 18 10/2/2009 10:38:07 AM

19
CREATIVE TECHNOLOGY LTD AND ITS SUBSIDIARIES
CONSOLIDATED CASH FLOW STATEMENT– For the financial year ended 30 June 2009
Group
2009 2008 Note US$’000 US$’000
Cash flows from operating activities: Net (loss) profit (137,876) 128,177 Adjustments for: Income tax (credit) expense (515) 1,735 Depreciation of property and equipment 8,260 `9,720 Amortisation of intangible assets 75 303 Employee share option expense 1,230 1,568 Share of loss of associated companies 2,498 2,458 Loss (gain) on disposal of property and equipment 231 (147,353) Impairment loss of financial assets, available-for-sale 13,374 12,136 Net impairment loss of investments in associated companies 148 3,500 Gain on disposal of financial assets, available-for-sale (305) (8,732) Gain on disposal of investments in subsidiaries (39) (8,984) Gain on disposal of investments in associated companies – (16,681) Foreign exchange loss (gain) 17,735 (7,894) Dividend income (312) (1,691) Chairman’s gift of shares to employees – 3,774 Interest income (3,965) (10,679) Interest expense 135 5,644
(99,326) (32,999)Changes in working capital, net of effects from acquisition and disposal of subsidiaries Trade receivables 32,313 74,417 Inventories 63,143 3,358 Other assets and receivables 56,436 (76,478) Trade payables (41,087) 14,650 Accrued liabilities and provisions (25,619) 359
Cash used in operations (14,140) (16,693)Interest received 3,995 10,716 Interest paid (132) (5,783)Income tax (paid) refunded (2,571) 11,945
Net cash (used in) provided by operating activities (12,848) 185
Cash flows from investing activities: Purchase of property and equipment (3,300) (12,586) Proceeds from sale of property and equipment 315 180,864 Proceeds from disposal of investments in associated companies – 14,648 Proceeds from sale of financial assets, available-for-sale 440 29,038 Cash (outflow) inflow from sale of investments in subsidiaries 17 (270) 8,894 Purchase of new subsidiaries (net of cash acquired) 17 (600) – Purchase of financial assets, available-for-sale (202) (9,528) Purchase of intangible assets (1,465) – Purchase of additional investments in associated companies – (1,832) Dividend received 312 1,691
Net cash (used in) provided by investing activities (4,770) 211,189
Cash flows from financing activities: Proceeds from exercise of ordinary share options 10 97 Purchase of treasury shares (22,719) (32,196) Repayments of borrowings (100,000) (19,794) Repayments of capital leases (22) (17) Dividends paid to equity holders of the Company – (11,528)
Net cash used in financing activities (122,731) (63,438)
Net (decrease) increase in cash and cash equivalents (140,349) 147,936 Cash and cash equivalents at beginning of financial year 10 408,644 250,480 Effects of currency translation on cash and cash equivalents (17,744) 10,228
Cash and cash equivalents at end of financial year 10 250,551 408,644
The accompanying notes form an integral part of these financial statements.
AR09 pg1-64_Final.indd 19 10/2/2009 10:38:07 AM
20
CREATIVE TECHNOLOGY LTD AND ITS SUBSIDIARIES
These notes form an integral part of and should be read in conjunction with the accompanying financial statements.
1. GENERAL INFORMATION
Creative Technology Ltd. (the “Company”) is listed on the Singapore Exchange Securities Trading Limited (“SGX-ST”) and incorporated and domiciled in Singapore. The address of its registered office is:
31 International Business Park Creative Resource Singapore 609921
The principal activities of the Company and its subsidiaries consist of the design, manufacture and distribution of digitised sound and video boards, computers and related multimedia and personal digital entertainment products.
2. SIGNIFICANT ACCOUNTING POLICIES 2.1 Basis of preparation
These financial statements have been prepared in accordance with Singapore Financial Reporting Standards (“FRS”). The financial statements have been prepared under the historical cost convention, except as disclosed in the accounting policies below.
The Group and the Company conduct a substantial portion of its business in United States dollars (“US$” or “$”). All dollar amounts included in the financial statements and in the notes herein are United States dollars unless designated as Singapore dollars (“S$”). The Group and the Company operate on a thirteen week calendar closing on the Friday closest to the natural calendar quarter. The Group’s financial year 2009 ended on 3 July 2009, the Friday nearest to 30 June 2009, while the prior financial year ended on 27 June 2008. All financial years are described by their natural calendar dates.
The financial statements of the Group and the Company had previously been prepared in accordance with accounting principles generally accepted in the United States of America (“US GAAP”). The Company’s registration of its shares and reporting obligations under the United States Securities Exchange Act of 1934 terminated on 13 May 2009. As the Company’s shares continue to be listed and traded on SGX-ST, the Group and the Company will continue to comply with the continuing listing requirements and guidelines issued by the SGX-ST and Singapore Companies Act (Cap. 50). FRS 101 “First-time Adoption of Financial Reporting Standards” has been applied in preparing these financial statements. Accordingly, the Group and the Company have prepared the financial statements in accordance with FRS and previous financial statements have also been restated to be in accordance with FRS. Please refer to Note 33 for the effect of changes in accounting framework.
The preparation of financial statements in conformity with FRS requires management to exercise its judgement in the process of applying the Group’s accounting policies. It also requires the use of certain critical accounting estimates and assumptions. Areas involving a higher degree of judgement or complexity, or areas where assumptions and estimates are significant to the financial statements, are disclosed in Note 3.
Standard early adopted by the Group FRS 108, ‘Operating segments’ has been early adopted by the Group in the current financial year. FRS 108 replaces FRS
14, ‘Segment reporting’. The new standard requires a ‘management approach’ under which segment information is presented on the same basis as that used for internal reporting purposes.
There has been no significant impact on the measurement of the assets and liabilities of the Group or the Company.
NOTES TO THE FINANCIAL STATEMENTS– For the financial year ended 30 June 2009
AR09 pg1-64_Final.indd 20 10/2/2009 10:38:07 AM

21
CREATIVE TECHNOLOGY LTD AND ITS SUBSIDIARIES
2.2 Group accounting
(a) Subsidiaries Subsidiaries are entities (including special purpose entities) over which the Group has power to govern the financial and
operating policies, generally accompanied by a shareholding giving rise to a majority of the voting rights. The existence and effect of potential voting rights that are currently exercisable or convertible are considered when assessing whether the Group controls another entity.
The purchase method of accounting is used to account for the acquisition of subsidiaries. The cost of an acquisition is measured as the fair value of the assets given, equity instruments issued or liabilities incurred or assumed at the dates of exchange, plus costs directly attributable to the acquisition. Identifiable assets acquired and liabilities and contingent liabilities assumed in a business combination are measured initially at their fair value on the date of acquisition, irrespective of the extent of minority interest. Please refer to the paragraph “Intangible assets - Goodwill on acquistions” for the accounting policy on goodwill on acquisition of subsidiaries.
Subsidiaries are consolidated from the date on which control is transferred to the Group. They are de-consolidated from the date on which control ceases.
In preparing the consolidated financial statements, transactions, balances and unrealised gains on transactions between group entities are eliminated. Unrealised losses are also eliminated but are considered an impairment indicator of the assets transferred. Accounting policies of subsidiaries have been changed where necessary to ensure consistency with the policies adopted by the Group.
Minority interests are that part of the net results of operations and of net assets of a subsidiary attributable to the interests which are not owned directly or indirectly by the Group. They are measured at the minorities’ share of fair value of the subsidiaries’ identifiable assets and liabilities at the date of acquisition by the Group and the minorities’ share of changes in equity since the date of acquisition, except when the minorities’ share of losses in a subsidiary exceeds its interests in the equity of that subsidiary. In such cases, the excess and further losses applicable to the minorities are attributed to the equity holders of the Company, unless the minorities have a binding obligation to, and are able to, make good the losses. When that subsidiary subsequently reports profits, the profits applicable to the minority interests are attributed to the equity holders of the Company until the minorities’ share of losses previously absorbed by the equity holders of the Company are fully recovered.
Please refer to the paragraph “Investments in subsidiaries and associated companies” for the accounting policy on investments in subsidiaries in the separate financial statements of the Company.
(b) Transactions with minority interests The Group applies a policy of treating transactions with minority interests as transactions with parties external to the Group.
Disposals to minority interests result in gains and losses for the Group that are recognised in the income statement. Purchases from minority interests result in goodwill, being the difference between any consideration paid and the Group’s incremental share of the carrying value of identifiable net assets of the subsidiary.
(c) Associated companies Associated companies are entities over which the Group has significant influence, but not control, and generally accompanied
by a shareholding giving rise to between and including 20% and 50% of the voting rights. Investments in associated companies are accounted for in the consolidated financial statements using the equity method of accounting less impairment losses.
Investments in associated companies are initially recognised at cost. The cost of an acquisition is measured at the fair value of the assets given, equity instruments issued or liabilities incurred or assumed at the date of exchange, plus costs directly attributable to the acquisition.
AR09 pg1-64_Final.indd 21 10/2/2009 10:38:07 AM
22
CREATIVE TECHNOLOGY LTD AND ITS SUBSIDIARIES
2. SIGNIFICANT ACCOUNTING POLICIES (cont’d)
2.2 Group accounting (cont’d)
(c) Associated companies (cont’d) In applying the equity method of accounting, the Group’s share of its associated companies’ post-acquisition profits or
losses are recognised in the income statement and its share of post-acquisition movements in reserves is recognised in equity directly. These post-acquisition movements are adjusted against the carrying amount of the investment. When the Group’s share of losses in an associated company equals or exceeds its interest in the associated company, including any other unsecured non-current receivables, the Group does not recognise further losses, unless it has obligations or has made payments on behalf of the associated company.
Unrealised gains on transactions between the Group and its associated companies are eliminated to the extent of the Group’s interest in the associated companies. Unrealised losses are also eliminated unless the transaction provides evidence of an impairment of the asset transferred. Accounting policies of associated companies have been changed where necessary to ensure consistency with the accounting policies adopted by the Group.
Dilution gains and losses arising from investments in associated companies are recognised in the income statement.
Please refer to the paragraph “Investments in subsidiaries and associated companies” for the accounting policy on investments in associated companies in the separate financial statements of the Company.
2.3 Intangible assets
(a) Goodwill on acquisitions Goodwill represents the excess of the cost of an acquisition over the fair value of the Group’s share of the identifiable assets,
liabilities and contingent liabilities of the acquired subsidiaries and associated companies at the date of acquisition.
Goodwill on subsidiaries is recognised separately as intangible assets and carried at cost less accumulated impairment losses.
Goodwill on associated companies is included in the carrying amount of the investments.
Gains and losses on the disposal of subsidiaries and associated companies include the carrying amount of goodwill relating to the entity sold.
(b) Acquired trademarks and licenses Trademarks and licenses acquired are initially recognised at cost and are subsequently carried at cost less accumulated
amortisation and accumulated impairment losses. These costs are amortised to the income statement using the straight-line method over the shorter of the contractual rights and estimated useful lives of the assets, ranging from one to ten years.
The amortisation period and amortisation method are reviewed at least at each balance sheet date. The effects of any revision are recognised in the income statement when the changes arise.
2.4 Impairment of non-financial assets
(a) Goodwill Goodwill is tested for impairment annually and whenever there is indication that the goodwill may be impaired. Goodwill
included in the carrying amount of an investment in an associated company is tested for impairment as part of the investment, rather than separately.
For the purpose of impairment testing of goodwill, goodwill is allocated to each of the Group’s cash-generating-units (“CGU”) expected to benefit from synergies arising from the business combination.
NOTES TO THE FINANCIAL STATEMENTS– For the financial year ended 30 June 2009
AR09 pg1-64_Final.indd 22 10/2/2009 10:38:07 AM

23
CREATIVE TECHNOLOGY LTD AND ITS SUBSIDIARIES
An impairment loss is recognised when the carrying amount of a CGU, including the goodwill, exceeds the recoverable amount of the CGU. The recoverable amount of a CGU is the higher of the CGU’s fair value less cost to sell and value-in-use.
The total impairment loss of a CGU is allocated first to reduce the carrying amount of goodwill allocated to the CGU and then to the other assets of the CGU pro-rata on the basis of the carrying amount of each asset in the CGU.
An impairment loss on goodwill is recognised in the income statement and is not reversed in a subsequent period.
(b) Intangible assets Property and equipment Investments in subsidiaries and associated companies Intangible assets, property and equipment and investments in subsidiaries and associated companies are tested for impairment
whenever there is any objective evidence or indication that these assets may be impaired.
For the purpose of impairment testing, the recoverable amount (i.e. the higher of the fair value less cost to sell and the value-in-use) is determined on an individual asset basis unless the asset does not generate cash flows that are largely independent of those from other assets. If this is the case, the recoverable amount is determined for the CGU to which the asset belongs.
If the recoverable amount of the asset (or CGU) is estimated to be less than its carrying amount, the carrying amount of the asset (or CGU) is reduced to its recoverable amount.
The difference between the carrying amount and recoverable amount is recognised as an impairment loss in the income statement.
An impairment loss for an asset other than goodwill is reversed if, and only if, there has been a change in the estimates used to determine the asset’s recoverable amount since the last impairment loss was recognised. The carrying amount of this asset is increased to its revised recoverable amount, provided that this amount does not exceed the carrying amount that would have been determined (net of any accumulated amortisation or depreciation) had no impairment loss been recognised for the asset in prior years.
A reversal of impairment loss for an asset other than goodwill is recognised in the income statement.
2.5 Cash and cash equivalents
Cash and cash equivalents include cash at bank and on hand and short-term bank deposits. These deposits principally comprise short-term bank deposits with various banks which are subject to an insignificant risk of change in value.
2.6 Financial assets
(a) Classification The Group classifies its financial assets in the following categories: loans and receivables and financial assets, available-for-
sale. The classification depends on the purpose for which the assets were acquired. Management determines the classification of its financial assets at initial recognition.
(i) Loans and receivables Loans and receivables are non-derivative financial assets with fixed or determinable payments that are not quoted
in an active market. They are presented as current assets, except for those maturing later than 12 months after the balance sheet date which are presented as non-current assets. Loans and receivables are presented as “cash and cash equivalents”, “trade receivables”, “amounts due from subsidiaries”, other receivables and loan within “other current assets” and “other non-current receivables” on the balance sheet.
AR09 pg1-64_Final.indd 23 10/2/2009 10:38:07 AM

24
CREATIVE TECHNOLOGY LTD AND ITS SUBSIDIARIES
NOTES TO THE FINANCIAL STATEMENTS– For the financial year ended 30 June 2009
2. SIGNIFICANT ACCOUNTING POLICIES (cont’d)
2.6 Financial assets (cont’d)
(ii) Financial assets, available-for-sale Financial assets, available-for-sale are non-derivatives that are either designated in this category or not classified in
any of the other categories. They are presented as non-current assets unless management intends to dispose of the assets within 12 months after the balance sheet date.
(b) Recognition and derecognition Regular way purchases and sales of financial assets are recognised on trade-date, the date on which the Group commits to
purchase or sell the asset.
Financial assets are derecognised when the rights to receive cash flows from the financial assets have expired or have been transferred and the Group has transferred substantially all risks and rewards of ownership. On disposal of a financial asset, the difference between the carrying amount and the sale proceeds is recognised in the income statement. Any amount in the fair value reserve relating to that asset is transferred to the income statement.
(c) Initial measurement Financial assets are initially recognised at fair value plus transaction costs.
(d) Subsequent measurement Financial assets, available-for-sale are subsequently carried at fair value. Loans and receivables are subsequently carried at
amortised cost using the effective interest method.
Interest and dividend income on financial assets, available-for-sale are recognised separately in the income statement. Changes in fair values of available-for-sale equity securities are recognised in the fair value reserve, together with the related currency translation differences.
(e) Impairment The Group assesses at each balance sheet date whether there is objective evidence that a financial asset or a group of financial
assets is impaired and recognises an allowance for impairment when such evidence exists.
(i) Loans and receivables Significant financial difficulties of the debtor, probability that the debtor will enter bankruptcy, and default or significant
delay in payments are objective evidence that these financial assets are impaired.
The carrying amount of these assets is reduced through the use of an impairment allowance account which is calculated as the difference between the carrying amount and the present value of estimated future cash flows, discounted at the original effective interest rate. When the asset becomes uncollectible, it is written off against the allowance account. Subsequent recoveries of amounts previously written off are recognised against the same line item in the income statement.
The allowance for impairment loss account is reduced through the income statement in a subsequent period when the amount of impairment loss decreases and the related decrease can be objectively measured. The carrying amount of the asset previously impaired is increased to the extent that the new carrying amount does not exceed the amortised cost, had no impairment been recognised in prior periods.
(ii) Financial assets, available-for-sale Significant or prolonged declines in the fair value of the security below its cost and the disappearance of an active
trading market for the security are objective evidence that the security is impaired.
AR09 pg1-64_Final.indd 24 10/2/2009 10:38:07 AM

25
CREATIVE TECHNOLOGY LTD AND ITS SUBSIDIARIES
The cumulative loss that was recognised in the fair value reserve is transferred to the income statement. The cumulative loss is measured as the difference between the acquisition cost (net of any principal repayments and amortisation) and the current fair value, less any impairment loss previously recognised in the income statement on debt securities. The impairment losses recognised in the income statement on equity securities are not reversed through the income statement.
2.7 Inventories
Inventory is carried at the lower of cost or net realisable value. Cost is determined using standard cost, appropriately adjusted at the balance sheet date to approximate actual cost on a weighted average basis. In the case of finished products and work-in-progress, cost includes materials, direct labour and an appropriate proportion of production overheads. Net realisable value is the estimated selling price in the ordinary course of business, less applicable variable selling expenses.
2.8 Investments in subsidiaries and associated companies
Investments in subsidiaries and associated companies are carried at cost less accumulated impairment losses in the Company’s balance sheet. On disposal of investments in subsidiaries and associated companies, the difference between disposal proceeds and the carrying amounts of the investments are recognised in the income statement.
2.9 Property and equipment
(a) Measurement Property and equipment are initially recognised at cost and subsequently carried at cost less accumulated depreciation and
accumulated impairment losses.
Cost recognised includes purchase price and any cost that is directly attributable to bringing the asset to the location and condition necessary for it to be capable of operating in the manner intended by management.
(b) Depreciation No depreciation is provided on freehold land. Depreciation is calculated using the straight-line method to allocate their
depreciable amounts over the estimated useful lives as follows:
Leasehold land and buildings - 20 to 50 years Machinery and equipment - 3 to 6 years Furniture, fixtures and office equipment - 1 to 8 years Leasehold improvements - Shorter of lease term or useful life
The residual values, estimated useful lives and depreciation methods are reviewed and adjusted as appropriate, at each balance sheet date. The effects of any revision are recognised in the income statement when the changes arise.
(c) Subsequent measurement Subsequent expenditure relating to property and equipment that has already been recognised is added to the carrying amount
of the asset only when it is probable that future economic benefits associated with the item will flow to the Group and the cost of the item can be measured reliably. All other repair and maintenance expenses are recognised in the income statement when incurred.
(d) Disposal On disposal of an item of property and equipment, the difference between the disposal proceeds and its carrying amount is
recognised in the income statement.
AR09 pg1-64_Final.indd 25 10/2/2009 10:38:07 AM
26
CREATIVE TECHNOLOGY LTD AND ITS SUBSIDIARIES
2. SIGNIFICANT ACCOUNTING POLICIES (cont’d)
2.10 Trade and other payables
Trade and other payables are initially recognised at fair value, and subsequently carried at amortised cost using the effective interest method.
2.11 Borrowings
Borrowings are presented as current liabilities unless the Group has an unconditional right to defer settlement for at least 12 months after the balance sheet date.
Borrowings are initially recognised at fair value (net of transaction costs) and subsequently carried at amortised cost. Any difference between the proceeds (net of transaction costs) and the redemption value is recognised in the income statement over the period of the borrowings using the effective interest method.
2.12 Provisions
Provisions are recognised when the Group has a present legal or constructive obligation as a result of past events, it is more likely than not that an outflow of resources will be required to settle the obligation and the amount has been reliably estimated. Changes in the estimated timing or amount of the expenditure or discount rate are recognised in the income statement when the changes arise.
(a) Warranties The warranty provision represents management’s best estimate of probable liability under its product warranties. Management
determines the warranty provision based on known product failures (if any), historical experience, and other currently available evidence.
(b) Provision for legal claims and fees Management records provisions when it is probable that a liability has been incurred and the amount of loss can be reasonably
estimated.
(c) Other provisions Other provisions are measured at the present value of the expenditure expected to be required to settle the obligation using
a pre-tax discount rate that reflects the current market assessment of the time value of money and the risks specific to the obligation. The increase in the provision due to the passage of time is recognised in the income statement.
2.13 Fair value estimation of financial assets and liabilities
The fair values of financial instruments traded in active markets are based on quoted market prices at the balance sheet date. The quoted market prices used for financial assets are the current bid prices; the appropriate quoted market prices for financial liabilities are the current asking prices.
The fair values for financial instruments that are not traded in an active market are determined by using valuation techniques. The Group uses a variety of methods and makes assumptions that are based on market conditions existing at each balance sheet date.
The fair values of current financial assets and liabilities carried at amortised cost approximate their carrying amounts.
2.14 Revenue recognition
Sales comprise the fair value of the consideration received or receivable for the sale of goods in the ordinary course of the Group’s activities. Sales are presented net of value-added tax, rebates and discounts, and after eliminating sales within the
NOTES TO THE FINANCIAL STATEMENTS– For the financial year ended 30 June 2009
AR09 pg1-64_Final.indd 26 10/2/2009 10:38:07 AM

27
CREATIVE TECHNOLOGY LTD AND ITS SUBSIDIARIES
Group. The Group recognises revenue when the amount of revenue and related cost can be reliably measured, the Group has delivered the products to the customers, the customers have accepted the products, significant risks and rewards of ownership have been transferred and when it is probable that the collectability of the related receivables is reasonably assured.
Allowances are provided for estimated returns and discounts based on historical experience, current economic trends and changes in customer demand and acceptance of its products. Such allowances are adjusted periodically to reflect actual and anticipated experience. When recognising revenue, the Group records estimated reductions to revenue for customer and distributor programs and incentive offerings, including price protection, promotions, other volume-based incentives and rebates.
2.15 Research and development costs
As the Group cannot definitively distinguish the research phase from the development phase of its internal projects to create intangible assets, the Group treats the expenditure on its internal projects as if they were incurred in the research phase only. Accordingly, all research and development costs are recognised as an expense when incurred.
2.16 Income taxes
Current income tax for current and prior periods is recognised at the amount expected to be paid to or recovered from the tax authorities, using the tax rates and tax laws that have been enacted or substantively enacted by the balance sheet date.
Deferred income tax is recognised for all temporary differences arising between the tax bases of assets and liabilities and their carrying amounts in the financial statements except when the deferred income tax arises from the initial recognition of goodwill or an asset or liability in a transaction that is not a business combination and affects neither accounting nor taxable profit or loss at the time of the transaction.
A deferred income tax liability is recognised on temporary differences arising on investments in subsidiaries and associated companies, except where the Group is able to control the timing of the reversal of the temporary difference and it is probable that the temporary difference will not reverse in the foreseeable future.
A deferred income tax is recognised to the extent that it is probable that future taxable profit will be available against which the deductible temporary differences and tax losses can be utilised.
Deferred income tax is measured:
(i) at the tax rates that are expected to apply when the related deferred income tax asset is realised or the deferred income tax liability is settled, based on tax rates and tax laws that have been enacted or substantively enacted by the balance sheet date; and
(ii) based on the tax consequence that will follow from the manner in which the Group expects, at the balance sheet date, to recover or settle the carrying amounts of its assets and liabilities.
Current and deferred income taxes are recognised as income or expense in the income statement.
2.17 Operating leases
Leases where substantially all risks and rewards incidental to ownership are retained by the lessors are classified as operating leases. Payments made under operating leases (net of any incentives received from the lessors) are recognised in the income statement on a straight-line basis over the period of the lease. When a lease is terminated before the lease period expires, any payment made (or received) by the Group as penalty is recognised as an expense (or income) when termination takes place.
AR09 pg1-64_Final.indd 27 10/2/2009 10:38:08 AM

28
CREATIVE TECHNOLOGY LTD AND ITS SUBSIDIARIES
NOTES TO THE FINANCIAL STATEMENTS– For the financial year ended 30 June 2009
2. SIGNIFICANT ACCOUNTING POLICIES (cont’d)
2.18 Employee compensation
The Group’s contributions are recognised as employee compensation expense when they are due, unless they can be capitalised as an asset.
(a) Defined contribution plans Defined contribution plans are post-employment benefit plans under which the Group pays fixed contributions into separate
entities such as the Central Provident Fund or Pension on a mandatory, contractual or voluntary basis. The Group has no further payment obligations once the contributions have been paid.
(b) Share-based compensation The Group operates an equity-settled, share-based compensation plan. The fair value of the employee services received
in exchange for the grant of options is recognised as an expense in the income statement with a corresponding increase in shareholders’ equity over the vesting period. The total amount to be recognised over the vesting period is determined by reference to the fair value of the options granted on the date of the grant. Non-market vesting conditions are included in the estimation of the number of shares under options that are expected to become exercisable on the vesting date. At each balance sheet date, the Group revises its estimates of the number of shares under options that are expected to become exercisable on the vesting date and recognises the impact of the revision of the estimates in the income statement, with a corresponding adjustment to shareholders’ equity over the remaining vesting period.
When the options are exercised, the proceeds received (net of transaction costs) and the related balance previously recognised in the share option reserve are credited to share capital account when new ordinary shares are issued, or to the “treasury shares” account when treasury shares are re-issued to the employees.
2.19 Currency translation
(a) Functional and presentation currency
Items included in the financial statements of each entity in the Group are measured using the currency of the primary economic environment in which the entity operates (“functional currency”). The functional currency of the Company is the United States Dollar (“US$”), which reflects the economic environment in which the activities of the Company are largely exposed to. The financial statements are presented in United States Dollar.
(b) Transactions and balances Transactions in a currency other than the United States Dollar (“foreign currency”) are translated into the United States
Dollar using the exchange rates at the dates of the transactions. Currency translation differences from the settlement of such transactions and from the translation of monetary assets and liabilities denominated in foreign currencies at the closing rates at the balance sheet date are recognised in the income statement.
Non-monetary items measured at fair values in foreign currencies are translated using the exchange rates prevailing at the date when the fair values are determined.
(c) Translation of Group entities’ financial statements The results and financial position of all the Group’s entities (none of which has the currency of a hyperinflationary economy)
that have a functional currency different from the presentation currency are translated into the presentation currency as follows:
(i) Assets and liabilities are translated at the closing exchange rates prevailing at the date of the balance sheet;
AR09 pg1-64_Final.indd 28 10/2/2009 10:38:08 AM
29
CREATIVE TECHNOLOGY LTD AND ITS SUBSIDIARIES
(ii) Income and expenses are translated at average exchange rates (unless the average is not a reasonable approximation of the cumulative effect of the rates prevailing on the transaction dates, in which case, income and expenses are translated using the exchange rates at the dates of the transactions); and
(iii) All resulting currency translation differences are recognised in the income statement.
Goodwill and fair value adjustments arising on the acquisition of foreign operations are treated as assets and liabilities of the foreign operations and translated at the closing rates at the date of the balance sheet.
2.20 Segment reporting
Operating segments are reported in a manner consistent with the internal reporting provided to the chief operating decision-maker.
2.21 Share capital and treasury shares
Ordinary shares are classified as equity. Incremental costs directly attributable to the issuance of new ordinary shares are deducted against the share capital account.
Where the Company’s ordinary shares are repurchased (“treasury shares”), the consideration paid, including any directly attributable incremental cost, is presented as a component within equity attributable to the Company’s equity holders, until they are cancelled, sold or reissued.
When treasury shares are subsequently cancelled, the cost of treasury shares are deducted against the share capital account if the shares are purchased out of capital of the Company, or against the retained earnings of the Company if the shares are purchased out of earnings of the Company.
When treasury shares are subsequently sold or reissued pursuant to the employee share option scheme, the cost of treasury shares is reversed from the treasury share account and the realised gain or loss on sale or reissue, net of any directly attributable incremental transaction costs and related income tax, is recognised as a change in equity of the Company.
2.22 Dividends to Company’s shareholders
Dividends to the Company’s shareholders are recognised when the dividends are approved for payment.
3. CRITICAL ACCOUNTING ESTIMATES, ASSUMPTIONS AND JUDGEMENTS
Estimates, assumptions and judgements are continually evaluated and are based on historical experience and other factors, including expectations of future events that are believed to be reasonable under the circumstances.
(a) Revenue recognition Allowances are provided for estimated returns and discounts. Management analyses historical returns, current economic
trends and changes in customer demand and acceptance of its products when evaluating the adequacy of the sales returns allowance. Such allowances are adjusted periodically to reflect actual and anticipated experience. When recognising revenue, the Group records estimated reductions to revenue for customer and distributor programs and incentive offerings, including price protection, promotions, other volume-based incentives and rebates. Significant management judgement and estimates must be used in connection with establishing these allowances in any accounting period. The Group may take action when necessary in response to market conditions to increase customer incentive offerings, possibly resulting in an incremental reduction of revenue at the time the incentive is offered. The Group’s net revenue for the financial year ended 30 June 2009 was US$466,074,000 (2008: US$736,848,000).
AR09 pg1-64_Final.indd 29 10/2/2009 10:38:08 AM

30
CREATIVE TECHNOLOGY LTD AND ITS SUBSIDIARIES
NOTES TO THE FINANCIAL STATEMENTS– For the financial year ended 30 June 2009
3. CRITICAL ACCOUNTING ESTIMATES, ASSUMPTIONS AND JUDGEMENTS (cont’d)
(b) Impairment of loans and receivables The Group assesses at each balance sheet date whether there is any objective evidence that a financial asset is impaired.
To determine whether there is objective evidence of impairment, the Group considers factors such as the probability of insolvency or significant financial difficulties of the debtor and default or significant delay in payments.
Where there is objective evidence of impairment, the amount and timing of future cash flows are estimated based on historical loss experience for assets with similar credit risk characteristics.
(c) Product warranties The warranty period for the bulk of the Group’s products typically ranges between 1 to 3 years. The product warranty
provision reflects management’s best estimate of probable liability under its product warranties. Management determines the warranty provision based on known product failures (if any), historical experience, and other currently available evidence. If actual experience of product returns or cost of repair differ from management’s estimates, revisions to the estimated warranty provision would be required and could have a material effect on the Group’s future results of operations. The Group’s warranty provision as at 30 June 2009 was US$2,899,000 (2008: US$5,815,000).
(d) Valuation of inventories The Group states inventories at the lower of cost or net realisable value. The Group records a write-down for inventories
of components and products which have become obsolete or are in excess of anticipated demand or net realisable value. Management performs a detailed assessment of inventory at each balance sheet date to establish provisions for excess and obsolete inventories. Management’s evaluation includes a review of, among other factors, historical sales, current economic trends, forecasted sales, demand requirements, product lifecycle and product development plans, quality issues, and current inventory levels. The markets for PC peripherals and personal digital entertainment products are subject to a rapid and unpredictable pace of product and component obsolescence and demand changes. If future demand or market conditions for the Group’s products are less favourable than forecasted or if unforeseen technological changes negatively impact the utility of component inventory, the Group may be required to record write-downs which would negatively affect gross margins in the period when the write-downs are recorded and its operating results and financial position could be adversely affected. The carrying amount of the Group’s inventories at 30 June 2009 was US$37,600,000 (2008: US$99,788,000).
(e) Impairment of financial assets, available-for-sale The Group’s investments are inherently risky because the markets for the technologies or products that the companies have
under development are typically in the early stages and may never develop. In the event that the carrying value of an investment exceeds its fair value and the decline in value is determined to be other-than-temporary, an impairment charge is recorded and a new cost basis for the investment is established. Fair values for listed equity securities are determined using quoted market prices. Fair values for unlisted equity securities are determined by using valuation techniques. The Group uses a variety of methods, such as asset values, and makes assumptions that are based on market conditions existing at each balance sheet date.
In order to determine whether a decline in value is other-than-temporary, the Group evaluates, among other factors: the duration and extent to which the fair value has been less than the carrying value; the financial condition of and business outlook for the company, including key operational and cash flow metrics, current market conditions and future trends in the company’s industry, and the company’s relative competitive position within the industry; and the Group’s intent and ability to retain the investment for a period of time sufficient to allow for any anticipated recovery in fair value. The carrying amount of the Group’s financial assets, available-for-sale at 30 June 2009 was US$27,753,000 (2008: US$37,247,000).
(f) Impairment of non-financial assets The Group assesses whether there are any indicators of impairment for all non-financial assets at each reporting date.
Goodwill and other intangibles are tested for impairment annually and at other times when such indicators exist. Other non-financial assets are tested for impairment when there are indicators that the carrying amounts may not be recoverable.
AR09 pg1-64_Final.indd 30 10/2/2009 10:38:08 AM

31
CREATIVE TECHNOLOGY LTD AND ITS SUBSIDIARIES
When value-in-use calculations are undertaken, management must estimate the expected future cash flows from the asset or cash-generating unit and choose a suitable discount rate in order to calculate the present value of those cash flows.
(g) Assessment of the probability of the outcome of current litigation The Group records provisions for loss contingencies when it is probable that a liability has been incurred and the amount
of loss can be reasonably estimated.
(h) Income taxes In preparing its financial statements, the Group estimates its income taxes for each of the jurisdictions in which it operates.
This involves estimating the actual current tax exposure, assessing temporary differences resulting from differing treatment of items, such as reserves and provisions for tax and accounting purposes and accounting for uncertainty in income taxes. These differences result in current and deferred income tax liabilities, which are included within the Group’s consolidated balance sheet. The Group recognises deferred income tax assets on carried forward tax losses to the extent there are sufficient estimated future taxable profits and/or taxable temporary differences against which the tax losses can be utilised. The Group’s income tax liabilities were US$2,203,000 (2008: US$5,287,000) and deferred income tax liabilities were US$29,510,000 (2008: US$29,746,000) at 30 June 2009.
4. EXPENSES BY NATURE Group
2009 2008 US$’000 US$’000
Amortisation of intangible assets (Note 19) 75 303
Depreciation of property and equipment (Note 18) 8,260 9,720
Employee compensation (Note 5) 117,950 153,323
Advertising expenses 8,399 21,439
Rental expenses on operating leases 19,025 8,875
Research and development expenses 12,780 9,211
Travel, entertainment and transportation expenses 5,094 8,187
Write-off / write-down for inventory obsolescence 4,252 8,497
Allowance for impairment of trade receivables and bad debts written off (reversal of allowance for impairment of trade receivables) 2,460 (1,171)
Restructuring expenses – other exit costs 2,665 4,261
Freight charges 19,556 35,602
Legal fees 4,635 6,156
Chairman’s gift of shares to employees – 3,774
Insurance 1,322 1,891 Warranty 6,103 18,779
The restructuring charges of US$11,168,000 in the financial year ended 30 June 2009 comprised termination benefits and costs associated with headcount reductions, primarily in the Group’s global field organisations and facilities costs from consolidation of certain international offices. Termination benefits of US$8,503,000 represented the costs of involuntary termination benefits and other exit costs of US$2,665,000 comprised mainly of lease cancellation charges imposed on non-cancellable operating leases.
The restructuring charges was US$11,668,000 in the financial year ended 30 June 2008 of which US$2,002,000 was charged to cost of goods sold and the balance of US$9,666,000 was recorded as restructuring charges in the operating expenses. Termination benefits of US$7,407,000 represented the costs of involuntary termination benefits and other exit costs of US$4,261,000 comprised mainly of lease cancellation charges imposed on non-cancellable operating leases.
A substantial portion of restructuring charges was related to the selling, general and administrative function for both financial years ended 30 June 2009 and 2008.
AR09 pg1-64_Final.indd 31 10/2/2009 10:38:08 AM

32
CREATIVE TECHNOLOGY LTD AND ITS SUBSIDIARIES
NOTES TO THE FINANCIAL STATEMENTS– For the financial year ended 30 June 2009
5. EMPLOYEE COMPENSATION Group
2009 2008 US$’000 US$’000
Wages and salaries 101,578 137,092
Employer’s contribution to defined contribution plans
including Central Provident Fund 6,639 7,256
Termination benefits (Note 4) 8,503 7,407
Share option expense (Note 26) 1,230 1,568
117,950 153,323
6. OTHER INCOME Group
2009 2008 US$’000 US$’000
Interest income 3,965 10,679
Dividend income 312 1,691
4,277 12,370
7. OTHER (LOSSES) GAINS, NET Group
2009 2008 US$’000 US$’000
Impairment loss of financial assets, available-for-sale (Note 15) (13,374) (12,136)
Net impairment loss of investments in associated companies (148) (3,500)
Gain on disposal of financial assets, available-for-sale 305 8,732 Gain on disposal of investments in subsidiaries 39 8,984
Gain on disposal of investments in associated companies – 16,681
Exchange (loss) gain (24,925) 14,550
Loss on disposal of property and equipment (231) (559)
Gain on disposal of building – 147,912
Allowance for impairment of loan to non-related party (Notes 14 and 16) (12,762) –
Other gains (losses) 145 (462)
(50,951) 180,202
Please refer to Note 18 for the gain on disposal of building in the prior financial year ended 30 June 2008.
AR09 pg1-64_Final.indd 32 10/2/2009 10:38:08 AM

33
CREATIVE TECHNOLOGY LTD AND ITS SUBSIDIARIES
8. INCOME TAXES Group
2009 2008 US$’000 US$’000
Tax (credit) expense attributable to (loss) profit is made up of:
Current income tax:
- Tax expense for current financial year 879 3,333
- Overprovision in prior financial years (1,431) (1,810)
- Withholding tax 212 53 (340) 1,576 Deferred income tax:
- Tax expense for current financial year (Note 24) 553 159
- Underprovision in prior financial years (Note 24) 52 -
- Effect of change in Singapore tax rate (Note 24) (780) -
(175) 159
(515) 1,735
The tax (credit) expense on (loss) profit differs from the amount that would arise using the Singapore standard rate of income
tax as explained below: Group
2009 2008 US$’000 US$’000
(Loss) profit before income tax (138,391) 129,912
Tax calculated at tax rate of 17% (2008: 18%) (23,526) 23,384
Effects of
- tax exempt loss (income) 18,640 (1,805)
- income not subject to tax (193) (26,624)
- expenses not deductible for tax purposes 1,900 2,166
- change in Singapore tax rate (Note 24) (780) –
- different tax rates in other countries 3,183 6,371
- deferred tax assets not recognised 3,147 –
- utilisation of tax lossess and other reserves (1,719) –
- overprovision in prior financial years (1,379) (1,810)
- withholding tax 212 53
Tax (credit) expense (515) 1,735
The Company was granted a Pioneer Certificate under the International Headquarters Award that will expire in March 2010. Under the Pioneer Certificate, profits arising from qualifying activities will be exempted from income tax in Singapore, subject to certain conditions.
AR09 pg1-64_Final.indd 33 10/2/2009 10:38:08 AM

34
CREATIVE TECHNOLOGY LTD AND ITS SUBSIDIARIES
9. EARNINGS PER SHARE
(a) Basic earnings per share Basic earnings per share is calculated by dividing the net (loss) profit attributable to equity holders of the Company by the
weighted average number of ordinary shares outstanding during the financial year. Group
2009 2008
Net (loss) profit attributable to equity holders of the Company (US$’000) (137,873) 128,178
Weighted average number of ordinary shares outstanding for basic earnings per share (‘000) 73,350 82,460
Basic (loss) earnings per share (US$ per share) (1.88) 1.55
(b) Diluted earnings per share For the purpose of calculating diluted earnings per share, (loss) profit attributable to equity holders of the Company and the
weighted average number of ordinary shares outstanding are adjusted for the effects of all dilutive potential ordinary shares. Other than the dilutive effect of share options, there are no other financial instruments that would impact the weighted average number of ordinary shares outstanding used for computing diluted earnings per share.
For share options, the weighted average number of shares on issue has been adjusted as if all dilutive share options were exercised. The number of shares that could have been issued upon the exercise of all dilutive share options less the number of shares that could have been issued at fair value (determined as the Company’s average share price for the financial year) for the same total proceeds is added to the denominator as the number of shares issued for no consideration. No adjustment is made to net (loss) profit.
Group
2009 2008
Net (loss) profit attributable to equity holders of the Company (US$’000) (137,873) 128,178
Weighted average number of ordinary shares outstanding for basic earnings per share (‘000) 73,350 82,460
Adjustment for share options (‘000) – 56
73,350 82,516
Diluted (loss) earnings per share (US$ per share) (1.88) 1.55
For the financial year ended 30 June 2009, approximately 11,000 shares were excluded from the computation of dilutive earnings per share, as the effect of including such shares would be anti-dilutive.
10. CASH AND CASH EQUIVALENTS Group Company
2009 2008 2009 2008 US$’000 US$’000 US$’000 US$’000
Cash at bank and on hand 53,711 39,543 25,457 9,398
Short-term bank deposits 196,840 369,101 193,015 267,079
250,551 408,644 218,472 276,477
NOTES TO THE FINANCIAL STATEMENTS– For the financial year ended 30 June 2009
AR09 pg1-64_Final.indd 34 10/2/2009 10:38:08 AM

35
CREATIVE TECHNOLOGY LTD AND ITS SUBSIDIARIES
11. TRADE RECEIVABLES Group Company
2009 2008 2009 2008 US$’000 US$’000 US$’000 US$’000
Trade receivables
- Associated companies 454 1,462 318 644
- Non-related parties 53,861 95,813 9,967 13,804
54,315 97,275 10,285 14,448 Less: Allowance for sales returns and
impairment of receivables - non-related parties (11,950) (14,721) (4,268) (3,796)
Trade receivables - net 42,365 82,554 6,017 10,652
12. AMOUNTS DUE FROM (TO) SUBSIDIARIES Company
2009 2008 US$’000 US$’000
Amounts due from subsidiaries - current
- Trade 67,805 75,956
- Non-trade 8,399 23,789
76,204 99,745
Less: Allowance for impairment (32,825) (49,832)
43,379 49,913 Amounts due from subsidiaries - non-current
- Trade 19,736 18,617
- Non-trade 203,679 187,003
223,415 205,620
Less: Allowance for impairment (37,020) (20,013)
186,395 185,607 Amounts due to subsidiaries - current
- Trade 6,665 18,681
- Non-trade 10,509 3,082
17,174 21,763 Amounts due to subsidiaries - non-current
- Trade 19,652 1,264
- Non-trade 874 1,209
20,526 2,473
The non-trade amounts due from and due to subsidiaries are interest-free and unsecured.
The current portions of non-trade amounts due from and due to subsidiaries are repayable on demand. There are no fixed repayment terms for the non-current portions of non-trade amounts due from and due to subsidiaries.
Management has assessed the fair values of the non-current amounts due from and due to subsidiaries and concluded that the fair values at balance sheet date approximate carrying values.
AR09 pg1-64_Final.indd 35 10/2/2009 10:38:08 AM

36
CREATIVE TECHNOLOGY LTD AND ITS SUBSIDIARIES
13. INVENTORIES Group Company
2009 2008 2009 2008 US$’000 US$’000 US$’000 US$’000
Raw materials 13,486 50,749 9,808 40,798
Work-in-progress 273 84 264 51
Finished products 23,841 48,955 8,032 18,434
37,600 99,788 18,104 59,283
14. OTHER CURRENT ASSETS Group Company
2009 2008 2009 2008 US$’000 US$’000 US$’000 US$’000
Prepaid expenses and security deposits 14,726 13,787 1,852 2,059
Prepaid non-income taxes 2,484 7,491 701 1,827
Other receivables from associated companies 886 9,854 413 7,510
Other receivables from non-related parties 3,352 12,894 1,968 834
Loan to non-related party 8,508 6,127 8,508 6,127
29,956 50,153 13,442 18,357 Less: Allowance for impairment of
loan to non-related party (Note 7) (8,508) – (8,508) –
21,448 50,153 4,934 18,357
In July 2007, the Company divested 80.1% of its interest in its then wholly owned manufacturing subsidiary in Malaysia (“ex-subsidiary”). Prior to divestment date, the Company had made loans to the ex-subsidiary for the purchase of properties, construction of factory and working capital purposes amounting to approximately US$36,900,000 (Malaysia Ringgit (“RM”) 130 million). Under the terms of the divestment agreement, this amount would be repaid in various instalments up to 1 June 2011 of which US$24,100,000 (RM85 million) had been repaid to date. Of the outstanding balance of US$12,762,000 (RM45 million), US$4,254,000 (RM15 million) was due on 1 June 2009 but the ex-subsidiary had failed to repay this amount on due date. Out of the remaining balance of US$8,508,000, US$4,254,000 was due on 1 June 2010 and US$4,254,000 was due on 1 June 2011. Subsequent to the financial year end, the Company was informed that the ex-subsidiary had decided to end all manufacturing business shortly in view of its unfavourable business and financial situation.
In view of the above, the total outstanding balance of US$12,762,000 (RM45 million) potentially may not be recoverable and the Company has considered it appropriate to provide for this amount in its financial year ended 30 June 2009.
The other receivables from associated companies and non-related parties are unsecured, interest-free and repayable on demand.
NOTES TO THE FINANCIAL STATEMENTS– For the financial year ended 30 June 2009
AR09 pg1-64_Final.indd 36 10/2/2009 10:38:09 AM

37
CREATIVE TECHNOLOGY LTD AND ITS SUBSIDIARIES
15. FINANCIAL ASSETS, AVAILABLE-FOR-SALE Group Company
2009 2008 2009 2008 US$’000 US$’000 US$’000 US$’000
Beginning of financial year 37,247 80,121 405 1
Fair value gains (losses) recognised in equity 3,774 (20,863) – –
Additions 202 9,528 – – Disposals (96) (20,305) – (1)
Reclassification of investment from subsidiary to financial assets, available-for-sale due to dilution of interest – 902 – 405
Impairment losses (Note 7) (13,374) (12,136) (405) –
End of financial year 27,753 37,247 – 405
Available-for-sale financial assets are analysed as follows:
Group Company
2009 2008 2009 2008 US$’000 US$’000 US$’000 US$’000
Listed equity securities 15,470 26,087 – –
Unlisted equity securities 12,283 11,160 – 405
27,753 37,247 – 405
The Group has recognised impairment loss of US$13,374,000 (2008: US$12,136,000) against securities whose fair values had been below cost during the financial year.
16. OTHER NON-CURRENT RECEIVABLES Group Company
2009 2008 2009 2008 US$’000 US$’000 US$’000 US$’000
Loan to non-related party (Note 14) 4,254 9,192 4,254 9,192
Loan to associated company 977 1,700 – –
5,231 10,892 4,254 9,192
Less: Allowance for impairment of loan to non-related party (Note 7) (4,254) – (4,254) –
977 10,892 – 9,192
The loan to an associated company is unsecured and interest free with no fixed repayment terms.
Management has assessed the fair values of other non-current receivables and concluded that the fair values as at balance sheet date approximate carrying values.
AR09 pg1-64_Final.indd 37 10/2/2009 10:38:09 AM
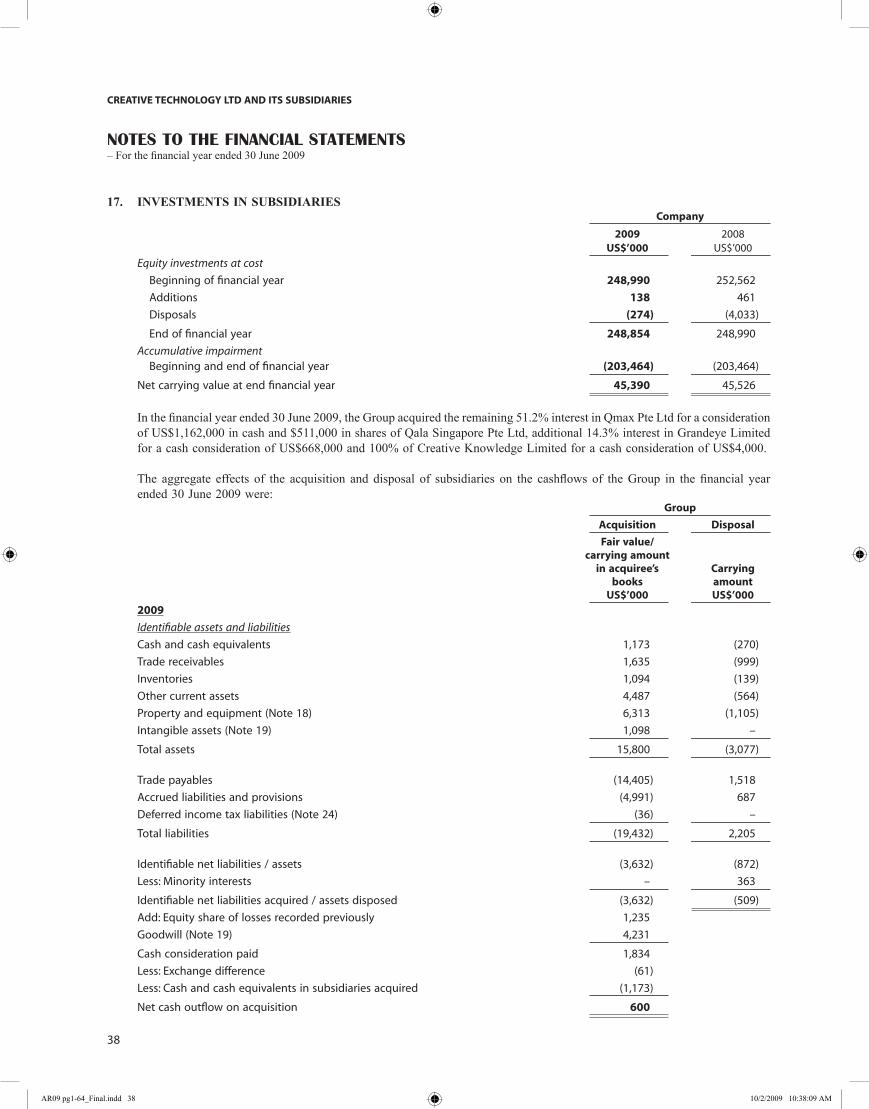
38
CREATIVE TECHNOLOGY LTD AND ITS SUBSIDIARIES
NOTES TO THE FINANCIAL STATEMENTS– For the financial year ended 30 June 2009
17. INVESTMENTS IN SUBSIDIARIES Company
2009 2008 US$’000 US$’000
Equity investments at cost
Beginning of financial year 248,990 252,562
Additions 138 461
Disposals (274) (4,033)
End of financial year 248,854 248,990
Accumulative impairment Beginning and end of financial year (203,464) (203,464)
Net carrying value at end financial year 45,390 45,526
In the financial year ended 30 June 2009, the Group acquired the remaining 51.2% interest in Qmax Pte Ltd for a consideration of US$1,162,000 in cash and $511,000 in shares of Qala Singapore Pte Ltd, additional 14.3% interest in Grandeye Limited for a cash consideration of US$668,000 and 100% of Creative Knowledge Limited for a cash consideration of US$4,000.
The aggregate effects of the acquisition and disposal of subsidiaries on the cashflows of the Group in the financial year
ended 30 June 2009 were: Group
Acquisition Disposal
Fair value/ carrying amount in acquiree’s Carrying books amount US$’000 US$’000
2009
Identifiable assets and liabilities
Cash and cash equivalents 1,173 (270)
Trade receivables 1,635 (999)
Inventories 1,094 (139)
Other current assets 4,487 (564)
Property and equipment (Note 18) 6,313 (1,105)
Intangible assets (Note 19) 1,098 –
Total assets 15,800 (3,077) Trade payables (14,405) 1,518
Accrued liabilities and provisions (4,991) 687
Deferred income tax liabilities (Note 24) (36) –
Total liabilities (19,432) 2,205 Identifiable net liabilities / assets (3,632) (872)
Less: Minority interests – 363
Identifiable net liabilities acquired / assets disposed (3,632) (509)
Add: Equity share of losses recorded previously 1,235
Goodwill (Note 19) 4,231
Cash consideration paid 1,834
Less: Exchange difference (61)
Less: Cash and cash equivalents in subsidiaries acquired (1,173)
Net cash outflow on acquisition 600
AR09 pg1-64_Final.indd 38 10/2/2009 10:38:09 AM

39
CREATIVE TECHNOLOGY LTD AND ITS SUBSIDIARIES
The aggregate cash outflows arising from the disposal of Qala Singapore Pte Ltd in 2009 were: Group
US$’000 Identifiable net assets disposed (as above) 509
Gain on disposal 39
Exchange difference (37)
Shares received in-lieu of cash (511) – Less: Cash and cash equivalents in subsidiary disposed (270)
Net cash outflow on disposal (270)
In the financial year ended 30 June 2008, the Group disposed of its 80.1% interest in Cubic Electronics Sdn Bhd for a cash consideration of US$10,580,000, 100% interest in Creative Future Computer Co., Ltd for a cash consideration of US$1,757,000, 50.1% interest in Creative Knowledge Limited for a cash consideration of US$1,712,000 and 51.2% interest in IDC Pte Ltd for a consideration of 7,500 ordinary shares in Qmax Pte Ltd, valued at S$2.00 per ordinary share.
The aggregate effects of the disposal of subsidiaries on the cashflows of the Group in the financial year ended 30 June 2008 were:
Group
Disposal
Carrying amount US$’000
2008 Identifiable assets and liabilities Cash and cash equivalents 5,155
Trade receivables 1,711
Inventories 31,761
Other current assets 1,660
Property and equipment (Note 18) 32,812
Total assets 73,099
Trade and other payables 63,059
Current income tax liabilities 968
Accrued liabilities and provisions 1,414
Deferred income tax liabilities (Note 24) 1,668
Total liabilities 67,109
Identifiable net assets 5,990
Minority interests (914)
Identifiable net assets disposed 5,076
Gain on disposal 8,984
Shares received in-lieu of cash (11)
Cash consideration received 14,049
Less: Cash and cash equivalents in subsidiaries disposed (5,155)
Net cash inflow on disposal 8,894
Details of significant subsidiaries are included in Note 36.
AR09 pg1-64_Final.indd 39 10/2/2009 10:38:09 AM

40
CREATIVE TECHNOLOGY LTD AND ITS SUBSIDIARIES
18. PROPERTY AND EQUIPMENT
Furniture, Machinery fixtures Freehold Leasehold Leasehold and and office land land improvements Building equipment equipment Total US$’000 US$’000 US$’000 US$’000 US$’000 US$’000 US$’000 Group 2009 Cost
Beginning of financial year 2,625 430 10,933 25,432 34,323 68,708 142,451
Acquisition of subsidiaries (Note 17) – – – – 6,082 231 6,313
Additions – – 1,083 – 890 1,327 3,300
Disposal of subsidiary (Note 17) – – – – (2,063) (286) (2,349)
Disposals – – (606) – (5,223) (8,841) (14,670)
End of financial year 2,625 430 11,410 25,432 34,009 61,139 135,045
Accumulated depreciation
Beginning of financial year – 46 8,361 7,319 29,078 63,404 108,208
Depreciation charge – 9 963 934 3,461 2,893 8,260
Disposal of subsidiary (Note 17) – – – – (1,018) (226) (1,244)
Disposals – – (581) – (4,984) (8,558) (14,123)
End of financial year – 55 8,743 8,253 26,537 57,513 101,101
Net book value End of financial year 2,625 375 2,667 17,179 7,472 3,626 33,944
Group 2008 Cost
Beginning of financial year 2,625 3,663 11,823 101,080 57,990 82,029 259,210
Additions – – 2,318 6,100 926 3,242 12,586
Disposal of subsidiaries (Note 17) – (3,233) (1,008) (24,696) (20,600) (3,821) (53,358)
Disposals – – (2,200) (57,052) (3,993) (12,742) (75,987)
End of financial year 2,625 430 10,933 25,432 34,323 68,708 142,451
Accumulated depreciation
Beginning of financial year – 242 10,657 32,063 43,659 74,893 161,514
Depreciation charge – 9 607 3,256 2,163 3,685 9,720
Disposal of subsidiaries (Note 17) – (205) (684) (3,751) (13,176) (2,730) (20,546)
Disposals – – (2,219) (24,249) (3,568) (12,444) (42,480)
End of financial year – 46 8,361 7,319 29,078 63,404 108,208 Net book value End of financial year 2,625 384 2,572 18,113 5,245 5,304 34,243
In June 2008, the Group sold its headquarters office building to an unrelated third party at a sales price of US$181,447,000 which was derived on an arms length basis, supported by a valuation of the property carried out by an independent assessor. Under the terms of the sale and purchase agreement, the Group also agreed to leaseback the property for a period of five years with an option for additional periods of three and two years.
NOTES TO THE FINANCIAL STATEMENTS– For the financial year ended 30 June 2009
AR09 pg1-64_Final.indd 40 10/2/2009 10:38:09 AM
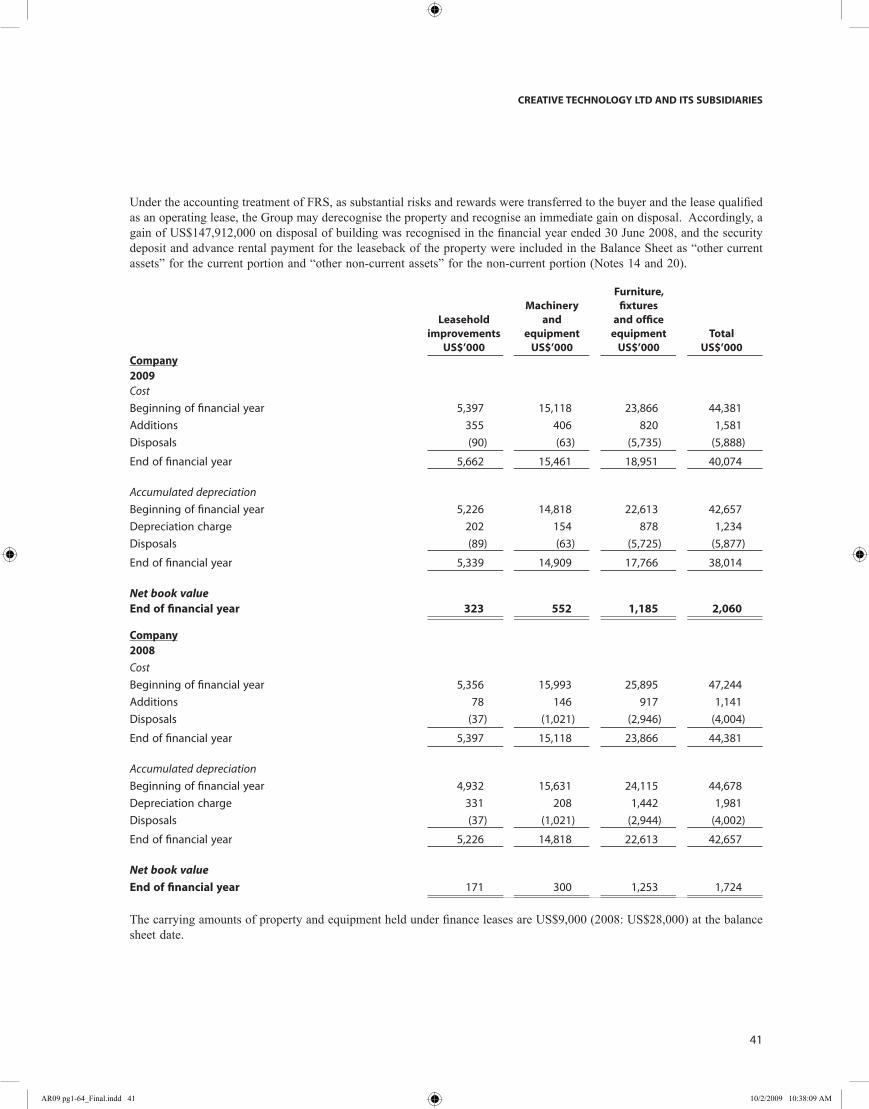
41
CREATIVE TECHNOLOGY LTD AND ITS SUBSIDIARIES
Under the accounting treatment of FRS, as substantial risks and rewards were transferred to the buyer and the lease qualified as an operating lease, the Group may derecognise the property and recognise an immediate gain on disposal. Accordingly, a gain of US$147,912,000 on disposal of building was recognised in the financial year ended 30 June 2008, and the security deposit and advance rental payment for the leaseback of the property were included in the Balance Sheet as “other current assets” for the current portion and “other non-current assets” for the non-current portion (Notes 14 and 20).
Furniture, Machinery fixtures Leasehold and and office improvements equipment equipment Total US$’000 US$’000 US$’000 US$’000 Company 2009 Cost
Beginning of financial year 5,397 15,118 23,866 44,381
Additions 355 406 820 1,581
Disposals (90) (63) (5,735) (5,888)
End of financial year 5,662 15,461 18,951 40,074 Accumulated depreciation
Beginning of financial year 5,226 14,818 22,613 42,657
Depreciation charge 202 154 878 1,234
Disposals (89) (63) (5,725) (5,877)
End of financial year 5,339 14,909 17,766 38,014
Net book value End of financial year 323 552 1,185 2,060
Company 2008
Cost
Beginning of financial year 5,356 15,993 25,895 47,244
Additions 78 146 917 1,141
Disposals (37) (1,021) (2,946) (4,004)
End of financial year 5,397 15,118 23,866 44,381
Accumulated depreciation
Beginning of financial year 4,932 15,631 24,115 44,678
Depreciation charge 331 208 1,442 1,981
Disposals (37) (1,021) (2,944) (4,002)
End of financial year 5,226 14,818 22,613 42,657
Net book value
End of financial year 171 300 1,253 1,724
The carrying amounts of property and equipment held under finance leases are US$9,000 (2008: US$28,000) at the balance sheet date.
AR09 pg1-64_Final.indd 41 10/2/2009 10:38:09 AM

42
CREATIVE TECHNOLOGY LTD AND ITS SUBSIDIARIES
19. INTANGIBLE ASSETS Group Company
2009 2008 2009 2008 US$’000 US$’000 US$’000 US$’000
Composition:
Goodwill arising on consolidation (Note (a)) 4,231 – – –
Trademarks and licences (Note (b)) 2,488 – – –
6,719 – – –
(a) Goodwill arising on consolidation
Group
2009 2008 US$’000 US$’000
Cost
Beginning of financial year – –
Acquisition of subsidiaries (Note 17) 4,231 –
End of financial year 4,231 –
Goodwill of US$4,231,000 arose from the acquisitions of Qmax Pte Ltd and Grandeye Limited (Note 17). Management has assessed that there is no impairment to goodwill as at 30 June 2009.
(b) Trademarks and licences Group Company
2009 2008 2009 2008 US$’000 US$’000 US$’000 US$’000
Cost
Beginning of financial year 33,390 33,390 16,533 16,533
Acquisition of subsidiaries (Note 17) 1,098 – – –
Additions 1,465 – – –
End of financial year 35,953 33,390 16,533 16,533
Accumulated amortisation
Beginning of financial year 33,390 33,087 16,533 16,230
Amortisation charge 75 303 – 303
End of financial year 33,465 33,390 16,533 16,533
Net book value 2,488 – – –
(c) Amortisation expense included in the income statement is analysed as follows: Group
2009 2008 US$’000 US$’000
Cost of sales (Note 4) 75 303
NOTES TO THE FINANCIAL STATEMENTS– For the financial year ended 30 June 2009
AR09 pg1-64_Final.indd 42 10/2/2009 10:38:09 AM
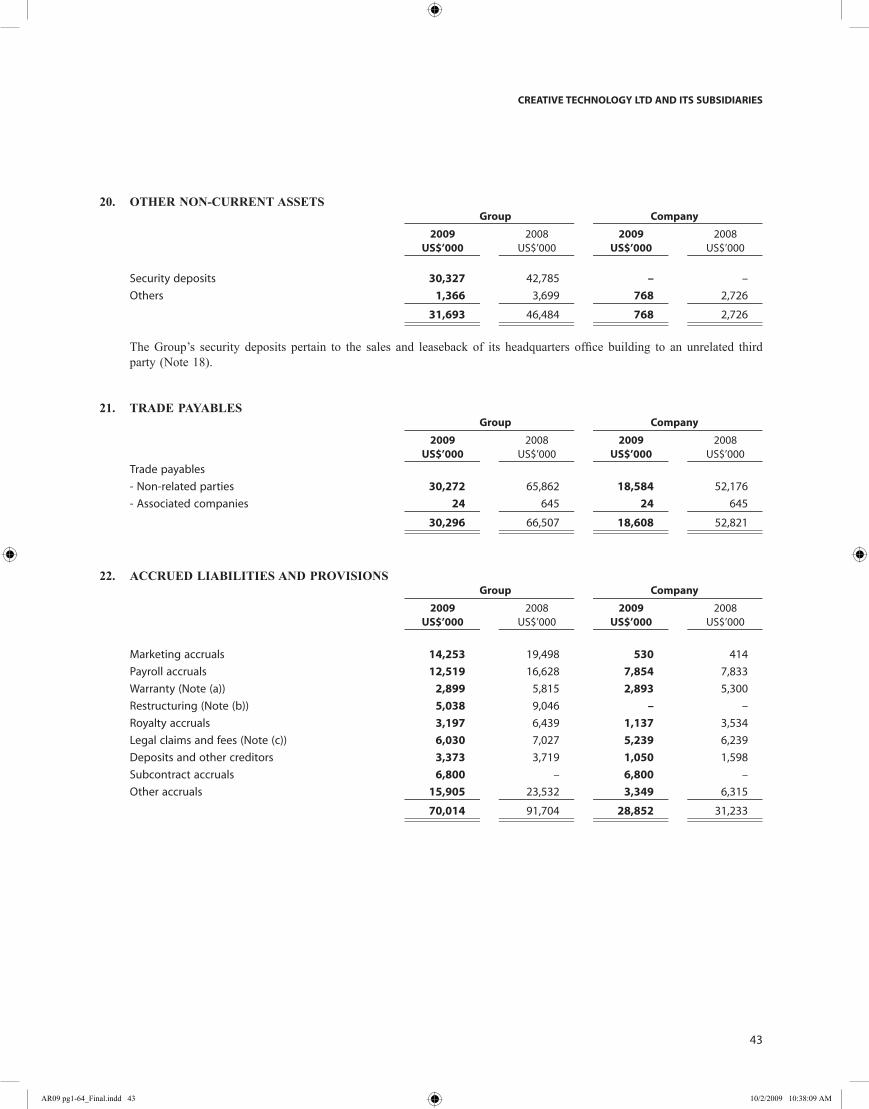
43
CREATIVE TECHNOLOGY LTD AND ITS SUBSIDIARIES
20. OTHER NON-CURRENT ASSETS Group Company
2009 2008 2009 2008 US$’000 US$’000 US$’000 US$’000
Security deposits 30,327 42,785 – –
Others 1,366 3,699 768 2,726
31,693 46,484 768 2,726
The Group’s security deposits pertain to the sales and leaseback of its headquarters office building to an unrelated third party (Note 18).
21. TRADE PAYABLES Group Company
2009 2008 2009 2008 US$’000 US$’000 US$’000 US$’000
Trade payables
- Non-related parties 30,272 65,862 18,584 52,176
- Associated companies 24 645 24 645
30,296 66,507 18,608 52,821
22. ACCRUED LIABILITIES AND PROVISIONS Group Company
2009 2008 2009 2008 US$’000 US$’000 US$’000 US$’000
Marketing accruals 14,253 19,498 530 414
Payroll accruals 12,519 16,628 7,854 7,833
Warranty (Note (a)) 2,899 5,815 2,893 5,300
Restructuring (Note (b)) 5,038 9,046 – –
Royalty accruals 3,197 6,439 1,137 3,534
Legal claims and fees (Note (c)) 6,030 7,027 5,239 6,239
Deposits and other creditors 3,373 3,719 1,050 1,598
Subcontract accruals 6,800 – 6,800 –
Other accruals 15,905 23,532 3,349 6,315
70,014 91,704 28,852 31,233
AR09 pg1-64_Final.indd 43 10/2/2009 10:38:09 AM

44
CREATIVE TECHNOLOGY LTD AND ITS SUBSIDIARIES
22. ACCRUED LIABILITIES AND PROVISIONS (cont’d)
(a) Warranty The warranty period for the bulk of the products typically ranges between 1 to 3 years. The product warranty provision
reflects management’s best estimate of probable liability under its product warranties. Management determines the warranty provision based on known product failures (if any), historical experience, and other currently available evidence.
Movements in provision for warranty are as follows:
Group Company
2009 2008 2009 2008 US$’000 US$’000 US$’000 US$’000
Beginning of financial year 5,815 6,499 5,300 5,878
Provision made 6,103 18,779 5,954 17,559
Provision utilised (9,019) (19,463) (8,361) (18,137)
End of financial year 2,899 5,815 2,893 5,300
(b) Restructuring Please refer to Note 4 for the nature of restructuring provision.
Movements in provision for restructuring are as follows:
Group Company
2009 2008 2009 2008 US$’000 US$’000 US$’000 US$’000
Beginning of financial year 9,046 – – –
Provision made 11,168 11,668 527 –
Provision utilised (15,176) (2,622) (527) –
End of financial year 5,038 9,046 – –
(c) Legal claims and fees The provision for legal claims is in respect of certain legal claims brought against the Group. In the opinion of management,
after taking appropriate legal advice, the outcomes of these legal claims are not expected to give rise to any significant loss beyond the amounts provided at 30 June 2009. Management considers that disclosure of further details of these claims will seriously prejudice the Group’s negotiating position and accordingly, further information on the nature of the obligation has not been provided.
NOTES TO THE FINANCIAL STATEMENTS– For the financial year ended 30 June 2009
AR09 pg1-64_Final.indd 44 10/2/2009 10:38:09 AM
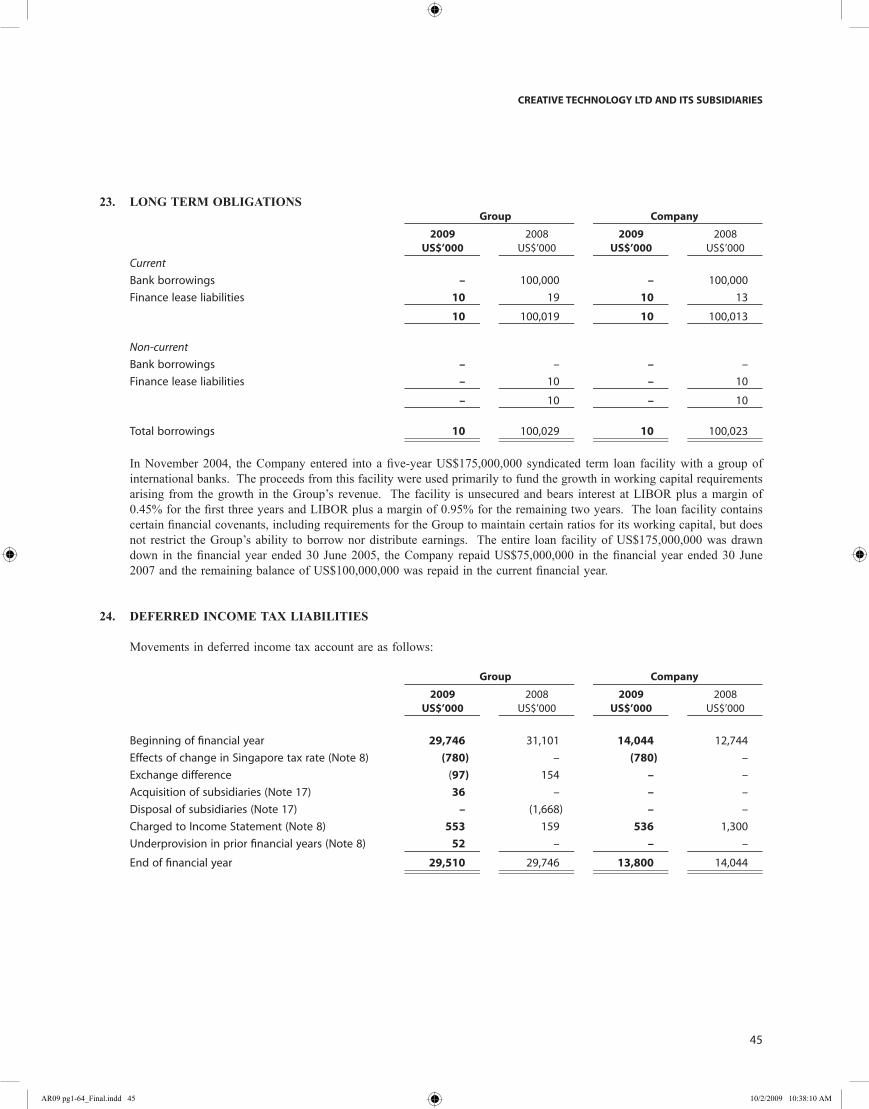
45
CREATIVE TECHNOLOGY LTD AND ITS SUBSIDIARIES
23. LONG TERM OBLIGATIONS Group Company
2009 2008 2009 2008 US$’000 US$’000 US$’000 US$’000
Current
Bank borrowings – 100,000 – 100,000
Finance lease liabilities 10 19 10 13
10 100,019 10 100,013
Non-current
Bank borrowings – – – –
Finance lease liabilities – 10 – 10
– 10 – 10
Total borrowings 10 100,029 10 100,023
In November 2004, the Company entered into a five-year US$175,000,000 syndicated term loan facility with a group of international banks. The proceeds from this facility were used primarily to fund the growth in working capital requirements arising from the growth in the Group’s revenue. The facility is unsecured and bears interest at LIBOR plus a margin of 0.45% for the first three years and LIBOR plus a margin of 0.95% for the remaining two years. The loan facility contains certain financial covenants, including requirements for the Group to maintain certain ratios for its working capital, but does not restrict the Group’s ability to borrow nor distribute earnings. The entire loan facility of US$175,000,000 was drawn down in the financial year ended 30 June 2005, the Company repaid US$75,000,000 in the financial year ended 30 June 2007 and the remaining balance of US$100,000,000 was repaid in the current financial year.
24. DEFERRED INCOME TAX LIABILITIES
Movements in deferred income tax account are as follows:
Group Company
2009 2008 2009 2008 US$’000 US$’000 US$’000 US$’000
Beginning of financial year 29,746 31,101 14,044 12,744
Effects of change in Singapore tax rate (Note 8) (780) – (780) –
Exchange difference (97) 154 – –
Acquisition of subsidiaries (Note 17) 36 – – –
Disposal of subsidiaries (Note 17) – (1,668) – –
Charged to Income Statement (Note 8) 553 159 536 1,300
Underprovision in prior financial years (Note 8) 52 – – –
End of financial year 29,510 29,746 13,800 14,044
AR09 pg1-64_Final.indd 45 10/2/2009 10:38:10 AM

46
CREATIVE TECHNOLOGY LTD AND ITS SUBSIDIARIES
24. DEFERRED INCOME TAX LIABILITIES (cont’d)
Deferred tax liabilities consisted of the following: Group Company
2009 2008 2009 2008 US$’000 US$’000 US$’000 US$’000
Unremitted offshore interest income 7,388 7,745 7,388 7,745
Undistributed profits of certain foreign subsidiaries 6,412 6,299 6,412 6,299
Transfer pricing and withholding tax payments 11,702 11,702 – –
Others 4,008 4,000 – –
29,510 29,746 13,800 14,044
The deferred income tax liabilities are expected to be settled after one year.
Deferred income tax assets are recognised for tax losses and other reserves carried forward to the extent that realisation of the related tax benefits through future taxable profits is probable. The Group has unrecognised tax losses of approximately US$272,305,000 (2008: US$194,654,000) at the balance sheet date which can be carried forward and used to offset against future taxable income subject to meeting certain statutory requirements by those companies with unrecognised tax losses in their respective countries of incorporation. A substantial portion of the tax losses expire between 2010 and 2029. The Group also has United States tax deductions not included in unrecognised tax losses of approximately US$60,870,000 (2008: US$60,870,000) as a result of the exercise of employee share options of which the tax benefit has not been realised. The tax benefit of the deductions, when realised will be accounted for as a credit to other reserves rather than a reduction of the income tax expense.
25. SHARE CAPITAL AND TREASURY SHARES Number of ordinary shares Amount Issued share Treasury Share Treasury
capital shares capital shares ’000 ’000 US$’000 US$’000 Group and Company
2009
Beginning of financial year 83,626 (6,981) 300,100 (32,113)
Purchase of treasury shares – (7,756) – (22,719)
Utilisation of treasury shares for shares issued under employee options plans – 2 – 10
Cancellation of treasury shares (8,626) 8,626 (33,347) 33,347
End of financial year 75,000 (6,109) 266,753 (21,475)
2008
Beginning of financial year 83,622 - 300,086 -
Shares issued under employee options plans 4 - 14 -
Purchase of treasury shares - (7,000) - (32,196)
Utilisation of treasury shares for shares issued under employee options plans - 19 - 83
End of financial year 83,626 (6,981) 300,100 (32,113)
All issued ordinary shares are fully paid. There is no par value for these ordinary shares.
NOTES TO THE FINANCIAL STATEMENTS– For the financial year ended 30 June 2009
AR09 pg1-64_Final.indd 46 10/2/2009 10:38:10 AM

47
CREATIVE TECHNOLOGY LTD AND ITS SUBSIDIARIES
(a) Treasury shares The Company acquired 7,756,000 (2008: 7,000,000) shares in the Company through purchases on the SGX-ST during the
financial year. The total amount paid to acquire the shares was US$22,719,000 (2008: US$32,196,000) and this was presented as a component within shareholders’ equity.
The Company re-issued 2,000 (2008: 19,000) treasury shares during the financial year pursuant to the Creative Technology (1999) Share Option Scheme (“1999 Scheme”) at the exercise price of US$2.92 (2008: US$4.50) each, for a total cash consideration of US$10,000 (2008: US$83,000).
(b) Share options The Creative Technology (1999) Share Option Scheme (“1999 Scheme”) was approved by shareholders at an Extraordinary
General Meeting on 30 December 1998 which allows options to be granted to full-time employees as well as consultants and non-executive directors. The total number of shares that may be granted under the 1999 Scheme is 7.5 million, provided that such amount shall be automatically increased on the first day (1 July) of each of the five financial years ended 30 June 2001, 2002, 2003, 2004 and 2005 by four percent of the issued share capital of the Company as at the last day of the immediate preceding financial year. The Option Committee has the discretion to decide the vesting schedule in the letter of offer. If it is not specifically stated in the letter of offer, 1/4 of the total amount of the grant vests on the first anniversary of the grant date and 1/48 of the total amount of the grant vests on the last day of each calendar month thereafter.
The exercise price of the options is determined at the average of the closing prices of the Company’s shares as quoted on the SGX-ST or the National Association of Securities Dealers Automated Quotations (“NASDAQ”) for five market days preceding the date of the grant.
Options expire after the tenth anniversary of the date of grant, except in the case of options granted to participants other than employees, options expire not later than the fifth anniversary of the date of grant. Effective 12 November 2007, amendments were made to the 1999 Scheme to allow the use of treasury shares to satisfy share based exercises. The options under the 1999 Scheme do not entitle the holders of the options, by virtue of such holdings, to any right to participate in any share issue of any other company.
The 1999 Scheme has expired on 29 December 2008. The existing options granted will continue to vest according to the terms and conditions of the 1999 Scheme and the respective grants.
During the financial year ended 30 June 2009, the Company granted 277,000 (2008: 2,931,000) share options under the 1999 Scheme at an exercise price per share of US$2.64 (2008: US$4.70). The options would be exercisable from 24 December 2009 and expire on 24 December 2018. The total fair value of options granted was US$177,000 (2008: US$2,403,000) using the Black Scholes option-pricing model and the weighted average fair value per share value was US$0.64 (2008: US$0.82).
The fair value of each share option granted is determined at the date of grant using the Black Scholes option-pricing model. This model requires the input of highly subjective assumptions, including the option’s expected life, risk-free interest rates, dividend yield and the price volatility of the underlying share. The expected life of the options represents the period of time the options are expected to be outstanding and is based on historical trends. The expected share price volatility assumption is determined using the historical volatility of the Company’s shares. The following table presents the weighted average assumptions used in the Black Scholes option-pricing model for the share option grants.
2009 2008
Exercise price US$2.64 US$4.70
Expected volatility 40% 35%
Risk-free interest rates 0.90% to 1.48% 1.82% to 2.33%
Dividend yield 2.6% 3.0%
Expected life of options (in years) 0.93 years after vest date 0.93 years after vest date
AR09 pg1-64_Final.indd 47 10/2/2009 10:38:10 AM

48
CREATIVE TECHNOLOGY LTD AND ITS SUBSIDIARIES
25. SHARE CAPITAL AND TREASURY SHARES (cont’d)
(b) Share options (cont’d) Movements in the number of unissued ordinary shares under option and their exercise prices were as follows:
Number of Weighted average options exercise price (’000) (US$)
Outstanding at 30 June 2007 7,817 7.34
Granted 2,931 4.70
Exercised (23) 4.37
Cancelled/Forfeited/Expired (523) 6.51
Outstanding at 30 June 2008 10,202 6.63
Granted 277 2.64
Exercised (2) 2.92
Cancelled/Forfeited/Expired (1,463) 7.89 Outstanding at 30 June 2009 9,014 6.31
Exercisable at 30 June 2009 6,856 6.81
Options exercised in the financial year ended 30 June 2009 resulted in 2,000 treasury shares (2008: 19,000) being re-issued at the exercise price of US$2.92 (2008: US$4.50) each. The weighted average share price at the date of exercise was US$4.42 (2008: US$4.81) per share.
The options outstanding as at 30 June 2009 and 30 June 2008 were in the following exercise price ranges:
2009 2008
Weighted Weighted average average Number of remaining Number of remaining shares contractual shares contractual Range of outstanding term outstanding term Exercise Prices (‘000) (in years) (‘000) (in years)
US$1.00 to US$2.99 350 7.81 76 2.50
US$3.00 to US$4.99 3,869 6.59 4,268 7.45
US$5.00 to US$6.99 43 2.47 80 3.57
US$7.00 to US$10.99 4,752 3.31 5,774 3.97 US$11.00 to US$18.99 – – 4 1.67
9,014 4.89 10,202 5.41
NOTES TO THE FINANCIAL STATEMENTS– For the financial year ended 30 June 2009
AR09 pg1-64_Final.indd 48 10/2/2009 10:38:10 AM

49
CREATIVE TECHNOLOGY LTD AND ITS SUBSIDIARIES
26. OTHER RESERVES Group Company
2009 2008 2009 2008 US$’000 US$’000 US$’000 US$’000
(a) Composition:
Capital reserves 19,932 19,932 6,951 6,951
Share-based compensation reserves (Note (b)(i)) 40,589 39,359 26,107 24,877
Treasury shares reserve (Note (b)(ii)) (9) (5) (9) (5)
60,512 59,286 33,049 31,823
Other reserves are non-distributable.
Capital reserves arose from changes of interests in the group companies in prior financial years. Share-based compensation reserves comprised mainly of compensation expense for share options, tax benefits relating to exercise of non qualified share options by US employees and Chairman’s gift of shares to employees.
Group Company
2009 2008 2009 2008 US$’000 US$’000 US$’000 US$’000
(b) Movements:
(i) Share-based compensation reserves
Beginning of financial year 39,359 34,017 24,877 19,535
Chairman’s gift of shares to employees – 3,774 – 3,774
Amortisation of deferred share compensation 1,230 1,568 1,230 1,568
End of financial year 40,589 39,359 26,107 24,877
(ii) Treasury shares reserve
Beginning of financial year (5) – (5) –
Utilisation of shares issued under employee share option plans (4) (5) (4) (5)
End of financial year (9) (5) (9) (5)
27. RETAINED EARNINGS
Movements in retained earnings for the Company are as follows: Company
2009 2008 US$’000 US$’000
Beginning of financial year 135,148 141,444
Net profit 11,074 5,232
Dividends paid (Note 28) – (11,528)
End of financial year 146,222 135,148
AR09 pg1-64_Final.indd 49 10/2/2009 10:38:10 AM

50
CREATIVE TECHNOLOGY LTD AND ITS SUBSIDIARIES
28. DIVIDENDS Group and Company
2009 2008 US$’000 US$’000
Ordinary dividends paid
Final exempt dividend paid in respect of the previous financial year of $Nil (2008: US$0.14) per share (Note 27) – 11,528
At the Annual General Meeting to be held on 29 October 2009, a final exempt dividend of S$0.10 per share amounting to a total of US$4,744,000 will be recommended. These financial statements do not reflect this dividend, which will be accounted for in shareholders’ equity as an appropriation of retained earnings in the financial year ending 30 June 2010.
29. COMMITMENTS
(a) Capital and other commitments Capital and other expenditures contracted for at the balance sheet date but not recognised in the financial statements are as
follows:
Group Company
2009 2008 2009 2008 US$’000 US$’000 US$’000 US$’000
Property and equipment 145 180 145 180
Other purchase obligations 15,118 34,994 12,848 31,814
15,263 35,174 12,993 31,994
(b) Operating lease commitments – where the Group is a lessee The Group leases land and certain of its facilities and equipment from non-related parties under non-cancellable operating
lease agreements. The leases have varying terms, escalation clauses and renewal rights. The future minimum lease payables under non-cancellable operating leases contracted for at the balance sheet date but not
recognised as liabilities, are as follows: Group
2009 2008 US$’000 US$’000
Not later than one year 3,988 6,875
Between one and five years 5,733 14,926
Later than five years 1,075 2,038
10,796 23,839
NOTES TO THE FINANCIAL STATEMENTS– For the financial year ended 30 June 2009
AR09 pg1-64_Final.indd 50 10/2/2009 10:38:10 AM

51
CREATIVE TECHNOLOGY LTD AND ITS SUBSIDIARIES
(c) Operating lease commitments – where the Group is a lessor The Group leases out office space to non-related parties under non-cancellable operating leases.
The future minimum lease receivables under non-cancellable operating leases contracted for at the balance sheet date but not recognised as receivables, are as follows:
Group
2009 2008 US$’000 US$’000
Not later than one year 145 12
Between one and five years 537 363
Later than five years – –
682 375
30. FINANCIAL RISK MANAGEMENT
The Group is exposed to financial risks arising from its operations and the use of financial instruments. The Group’s principal financial instruments, other than foreign exchange contracts, comprise bank loans, investments, cash at bank and short-term bank deposits. All financial transactions with the banks are governed by banking facilities duly accepted with Board of Directors’ resolutions, with banking mandates, which define the permitted financial instruments and facility limits, approved by the Board of Directors. The Group has various other financial assets and liabilities such as trade receivables and trade payables, which arise directly from its operations.
It is the Group’s policy not to engage in foreign exchange and/or derivatives speculation or trading or enters into any complex foreign exchange or derivatives transactions. It is not in the interest of the Group to speculate or trade in treasury instruments. From time to time, the Group enters into forward exchange contracts to reduce its exposure to foreign exchange translation gains and losses.
The main financial risks arising from the Group’s operations and the use of financial instruments are market risk (including price risk, interest rate risk and currency risk), credit risk and liquidity risk. Management does not view the Company on a standalone basis and therefore all risks relevant to the Group are considered and managed at the Group level. The policies for managing each of these risks at the Group level are summarised below.
(a) Market risk(i) Price risk As part of its long-term business strategy, from time to time, the Group makes strategic equity investments in companies
that can provide the Group with technologies or products that management believes will give the Group a competitive advantage in the markets in which the Group competes. The Group has strategic investments in quoted equity shares. The Group manages the risk of unfavourable changes by cautious review of the investments before investing and continuous monitoring of the performance of investments held and assessing market risk relevant to which the investments operate. The market value of these investments will fluctuate with market conditions. The table below summarises the impact to the Group’s fair value reserve in equity arising as a result of a 10% increase/decrease in prices of quoted equity securities. This analysis assumes that all other variables remain constant.
AR09 pg1-64_Final.indd 51 10/2/2009 10:38:10 AM

52
CREATIVE TECHNOLOGY LTD AND ITS SUBSIDIARIES
NOTES TO THE FINANCIAL STATEMENTS– For the financial year ended 30 June 2009
30. FINANCIAL RISK MANAGEMENT (cont’d)
(a) Market risk (cont’d)(i) Price risk (cont’d) Equity
10% increase 10% decrease US$’000 US$’000
Group 2009 Quoted equity securities 1,547 (1,547)
2008 Quoted equity securities 2,609 (2,609)
(ii) Interest rate risk The Group has balances placed with reputable banks and financial institutions. The Group manages its interest rate risks
on its interest income by placing the cash balances in varying maturities and interest rate terms.
Bank borrowings were fully repaid during the current financial year.
A change of 100 basis points (“bp”) in interest rate at balance sheet date would increase/decrease equity and profit or loss by the amounts shown below. This analysis assumes that all other variables remain constant.
Profit and Loss
100bp 100bp increase decrease US$’000 US$’000
Group 2009 Short-term bank deposits 1,968 (1,968)
2008 Short-term bank deposits 3,691 (3,691)
Bank borrowings (1,000) 1,000
2,691 (2,691)
AR09 pg1-64_Final.indd 52 10/2/2009 10:38:10 AM

53
CREATIVE TECHNOLOGY LTD AND ITS SUBSIDIARIES
(iii) Currency risk The functional currency of the Company is predominantly the US dollar and accordingly, gains and losses resulting from
the translation of monetary assets and liabilities denominated in currencies other than the US dollar are reflected in the determination of net (loss) profit. From time to time, the Group enters into forward exchange contracts to reduce its exposure to foreign translation gains and losses. Forward exchange contracts are marked to market each period and the resulting gains and losses are included in the determination of net (loss) profit. No forward exchange contracts were outstanding as at 30 June 2009 and 30 June 2008. The monetary assets and liabilities, prepaid expenses and security deposits, prepaid non-income taxes and current income tax liabilities of the Group are denominated in the following currencies:
US$’000 balance denominated in:
US$ S$ EURO GBP Others Total Group
2009
Cash and cash equivalents 64,392 56,120 70,579 30,212 29,248 250,551
Trade receivables 19,148 1,070 9,254 5,214 7,679 42,365
Other current assets 5,209 12,039 1,625 636 1,939 21,448
Other non-current receivables 977 – – – – 977
Total current liabilities (57,217) (18,121) (16,677) (3,355) (7,153) (102,523)
32,509 51,108 64,781 32,707 31,713 212,818 2008
Cash and cash equivalents 195,898 104,196 55,080 29,715 23,755 408,644
Trade receivables 43,584 1,252 25,451 6,607 5,660 82,554
Other current assets 11,257 28,492 5,417 736 4,251 50,153
Other non-current receivables 1,700 9,192 – – – 10,892
Total current liabilities (216,542) (16,888) (17,382) (4,939) (7,766) (263,517)
35,897 126,244 68,566 32,119 25,900 288,726
A change of 10% in foreign currency exchange rates relative to US$ at the reporting date would increase/decrease equity and profit or loss by the amounts shown below. This analysis assumes that all other variables remain constant.
Profit and Loss
10% 10% strengthened weakened US$’000 US$’000
Group 2009
S$ against US$ 5,111 (5,111)
Euro against US$ 6,478 (6,478)
GBP against US$ 3,271 (3,271)
Others against US$ 3,171 (3,171) 2008 S$ against US$ 12,624 (12,624)
Euro against US$ 6,857 (6,857)
GBP against US$ 3,212 (3,212)
Others against US$ 2,590 (2,590)
AR09 pg1-64_Final.indd 53 10/2/2009 10:38:11 AM

54
CREATIVE TECHNOLOGY LTD AND ITS SUBSIDIARIES
NOTES TO THE FINANCIAL STATEMENTS– For the financial year ended 30 June 2009
30. FINANCIAL RISK MANAGEMENT (cont’d)
(b) Credit risk Credit risk refers to the risk that a counterparty will default on its contractual obligations resulting in financial loss to the
Group. Financial instruments that potentially subject the Group to significant concentrations of credit risk consist principally of cash and cash equivalents and trade receivables. The Group deals only with financial institutions with high credit ratings and limits the amount of credit exposure to any one financial institution. The Group sells its products to original equipment manufacturers, distributors and key retailers. The Group believes that the concentration of credit risk in its trade receivables is substantially mitigated due to performance of ongoing credit evaluations of its customers’ financial condition, use of short collection terms, use of letters of credit in certain circumstances, procurement of credit insurance coverage and the geographical dispersion of sales. The Group establishes allowances for doubtful accounts, returns and discounts for specifically identified doubtful accounts, returns and discounts based on credit profiles of its customers, current economic trends, contractual terms and conditions and historical payment, returns and discount experience.
The maximum exposure to credit risk for each class of financial instruments is the carrying amount of that class of financial instruments presented on the balance sheet.
As at 30 June 2009, there were no significant concentrations of credit risk and no customer (2008: Nil) individually accounted for 10% or more of net accounts receivable.
Bank deposits that are neither past due nor impaired are mainly deposits with banks with high credit-ratings assigned by international credit-rating agencies. Trade receivables that are neither past due nor impaired are substantially companies with a good collection track record with the Group.
The age analysis of trade receivables is as follows: Group
2009 2008 US$’000 US$’000
Past due 1 to 60 days 7,996 9,384
Past due 61 to 120 days 3,741 2,453
Past due over 120 days 10,925 9,055
22,662 20,892
Less: Allowance for impairment (5,379) (4,513)
17,283 16,379
(c) Liquidity risk To manage liquidity risk, the Group monitors its net operating cash flows and maintains an adequate level of cash and cash
equivalents and secured committed funding facilities from financial institutions. In assessing the adequacy of these funding facilities, management reviews its working capital requirements regularly.
The bank borrowings were fully repaid during the current financial year. As at 30 June 2009, the entire Group’s financial liabilities mature in less than 1 year’s time. As at 30 June 2008, substantially all the Group’s financial liabilities mature in less than 1 year’s time, except its finance lease liabilities maturing between 1 to 5 years’ time.
AR09 pg1-64_Final.indd 54 10/2/2009 10:38:11 AM

55
CREATIVE TECHNOLOGY LTD AND ITS SUBSIDIARIES
(d) Capital risk The Group’s objectives when managing capital are to ensure that the Group is adequately capitalised and to maintain an
optimal capital structure. In order to maintain or achieve an optimal capital structure, the Group may adjust the amount of dividend payment, return capital to shareholders, issue new shares, buy back issued shares or obtain new borrowings.
As at 30 June 2009, the Group does not have any outstanding bank borrowings and the Group is not subject to any externally imposed capital requirements.
31. RELATED PARTY TRANSACTIONS
In addition to the information disclosed elsewhere in the financial statements, the following transactions took place between the Group and related parties at terms agreed between the parties:
(a) Sales and purchases of goods and services Group
2009 2008 US$’000 US$’000
Sales of goods and/or services to associated companies 1,736 956
Purchases of goods and/or services from associated companies 744 419
Outstanding balances at 30 June 2009, arising from sale/purchase of goods and services, are set out in Notes 11 and 21
respectively.
(b) Key management personnel compensation Key management personnel compensation is as follows: Group
2009 2008 US$’000 US$’000
Short-term employees benefits 2,634 2,941
Share-based expense 614 829
3,248 3,770
Included in the above is total compensation to the Chairman and Chief Executive Officer of the Company amounting to S$1 (2008: S$1).
32. SEGMENT INFORMATION
Management determines the operating segments based on the reports reviewed and used by the chief operating decision-maker (“CODM”) to make strategic decisions.
The CODM considers the business from a geographic segment perspective. Geographically, management considers the performance of the business of the sale of advanced multimedia solutions for personal computers and personal digital entertainment products in Asia Pacific, Europe and The Americas.
The reportable operating segments derive their revenue primarily from the sale of advanced multimedia solutions for personal computers and personal digital entertainment products. In addition, services within Asia Pacific include investment holding and this is included within the reportable operating segment as it is included in the reports provided to the CODM.
AR09 pg1-64_Final.indd 55 10/2/2009 10:38:11 AM

56
CREATIVE TECHNOLOGY LTD AND ITS SUBSIDIARIES
NOTES TO THE FINANCIAL STATEMENTS– For the financial year ended 30 June 2009
32. SEGMENT INFORMATION (cont’d)
The segment information provided to the CODM for the reportable segments is as follows:
Asia Pacific The Americas Europe Total US$’000 US$’000 US$’000 US$’000
Group 2009
Sales 159,051 125,040 181,983 466,074
(Loss) profit after total expenses (74,764) 3,637 (17,957) (89,084)
Other income 4,149 30 98 4,277
Other (losses) gains, net (46,748) 279 (4,482) (50,951)
Share of loss of associated companies (2,498) – – (2,498)
Interest expense (76) (1) (58) (135)
(Loss) profit before income tax (119,937) 3,945 (22,399) (138,391)
Income tax credit (expense) 497 91 (73) 515
Net (loss) profit (119,440) 4,036 (22,472) (137,876)
Other segment items
Additions to
- property and equipment 3,168 47 85 3,300
- intangible assets 5,696 – – 5,696
Depreciation 6,530 946 784 8,260
Amortisation 75 – – 75
Impairment of financial assets, available-for sale 13,374 – – 13,374
Segment assets 368,987 27,270 58,165 454,422
Segment liabilities 90,265 21,692 20,076 132,033
AR09 pg1-64_Final.indd 56 10/2/2009 10:38:11 AM

57
CREATIVE TECHNOLOGY LTD AND ITS SUBSIDIARIES
Asia Pacific The Americas Europe Total US$’000 US$’000 US$’000 US$’000
Group 2008
Sales 167,128 200,268 369,452 736,848
(Loss) profit after total expenses (59,548) 2,923 2,067 (54,558)
Other income 11,928 152 290 12,370
Other gains (losses), net 176,141 (378) 4,439 180,202
Share of loss of associated companies (2,458) – – (2,458)
Interest expense (5,639) (5) – (5,644)
Profit before income tax 120,424 2,692 6,796 129,912
Income tax (expense) credit (1,473) 699 (961) (1,735) Net profit 118,951 3,391 5,835 128,177
Other segment items
Additions to
- property and equipment 5,769 6,512 305 12,586
Depreciation 7,392 1,405 923 9,720
Amortisation 303 – – 303
Impairment of financial assets, available-for sale 12,136 – – 12,136
Segment assets 623,999 59,127 88,121 771,247
Segment liabilities 226,531 30,934 35,808 293,273 The revenue reported to the CODM excludes sales between segments. The revenue from external parties reported to the
CODM is measured in a manner consistent with that in the income statement.
The CODM assesses the performance of the operating segments based on net profit or loss. This is the measure reported to the CODM for the purposes of resource allocation and assessment of segment performance.
The amounts provided to the CODM with respect to total assets are measured in a manner consistent with that of the financial statements. For the purposes of monitoring segment performance and allocating resources between segments, the CODM monitors the total assets attributable to each segment. All assets are allocated to reportable segments.
The amounts provided to the CODM with respect to total liabilities are measured in a manner consistent with that of the financial statements. These liabilities are allocated based on the operations of the segment. All liabilities are allocated to reportable segments.
AR09 pg1-64_Final.indd 57 10/2/2009 10:38:11 AM

58
CREATIVE TECHNOLOGY LTD AND ITS SUBSIDIARIES
NOTES TO THE FINANCIAL STATEMENTS– For the financial year ended 30 June 2009
32. SEGMENT INFORMATION (cont’d)
Summary of net sales by product category: Group
2009 2008 US$’000 US$’000
Personal Digital Entertainment 202,078 386,884
Audio 66,531 99,791
Speakers and Headphones 122,829 190,097
All Other Products 74,636 60,076
466,074 736,848
There was no customer who accounted for 10% or more of net revenues for the current and prior financial years.
33. EFFECT OF CHANGES IN ACCOUNTING FRAMEWORK
A summary of the effect of the transition from US GAAP to FRS is set out below, showing the differences between US GAAP and FRS for the items in the financial statements affected by this transition.
(a) The Group’s profit (loss) for the financial year ended 30 June 2008 Effect of
transition US GAAP to FRS FRS US$’000 US$’000 US$’000
2008 (Loss) profit before income tax (18,000) 147,912 129,912
Net (loss) profit (19,735) 147,912 128,177
(Loss) earnings per share for (loss) profit attributable to equity holders of the Company
- Basic (US$ per share) (0.24) 1.79 1.55
- Diluted (US$ per share) (0.24) 1.79 1.55
(b) The Group’s affected Balance Sheet items as at 30 June 2008 Effect of
transition US GAAP to FRS FRS US$’000 US$’000 US$’000
As at 30 June 2008 Other current assets 39,441 10,712 50,153
Property and equipment 67,043 (32,800) 34,243
Other non-current assets 3,385 43,099 46,484 Accrued liabilities and provisions 91,042 662 91,704
Advance payments from sale of building 127,563 (127,563) –
Retained earnings (967) 147,912 146,945
Total equity 330,062 147,912 477,974
AR09 pg1-64_Final.indd 58 10/2/2009 10:38:11 AM

59
CREATIVE TECHNOLOGY LTD AND ITS SUBSIDIARIES
In June 2008, the Group sold its headquarters office building to an unrelated third party at a sales price of US$181,447,000 which was derived on an arms length basis, supported by a valuation of the property carried out by an independent assessor. Under the terms of the sale and purchase agreement, the Group also agreed to leaseback the property for a period of five years with an option for additional periods of three and two years. The Group also placed a security deposit of US$52,935,000 and paid an advance rental of US$938,000 to the purchaser.
The sale was completed in June 2008, legal title was transferred to the buyer and sale proceeds were received. However, under US GAAP, the transaction did not meet certain criteria of sale-leaseback accounting. Accordingly, under US GAAP accounting, the building remained recorded as property and equipment and the sale proceeds received, net of security deposit and rental prepayment, was presented as “Advance payments from sale of building”. The gain on the sale equalled to the difference between the net book value of the building and the balance of the “Advance payments from sale of building” will be recognised at the end of the initial five year lease term.
Under the accounting treatment of FRS, as substantial risks and rewards were transferred to the buyer and the lease qualified as an operating lease, the Group may derecognise the property and recognise an immediate gain on disposal. Accordingly, under FRS, a gain of US$147,912,000 on disposal of building was recognised in the financial year ended 30 June 2008, and the security deposit and advance payment were included in the Balance Sheet as “other current assets” for the current portion and “other non-current assets” for the non-current portion.
There is no significant impact on beginning retained earnings as at 1 July 2007 as a result of transition to FRS. However, there was a reclassification of US$15,702,000 from current income tax liabilities to deferred income tax liabilities at 1 July 2007.
(c) The Company’s affected Balance Sheet items as at 30 June 2008 Effect of
transition US GAAP to FRS FRS US$’000 US$’000 US$’000
As at 30 June 2008 Amounts due from subsidiaries - current 95,818 (45,905) 49,913
Amounts due from subsidiaries - non-current – 185,607 185,607
Investments in subsidiaries 79,851 (34,325) 45,526
Amounts due to subsidiaries - current 21,661 102 21,763
Fair value reserve 3,377 (3,377) –
Retained earnings 26,496 108,652 135,148
Total equity 329,683 105,275 434,958
As at 1 July 2007
Retained earnings 57,759 83,685 141,444
Under US GAAP, the Company equity accounted for the results of its subsidiaries. With the transition to FRS, the non-
financial assets of the Company, including its investments in subsidiaries are reviewed and adjusted for any impairment in value. The difference between the carrying and recoverable amount of the non-financial assets is recognised as an impairment loss in the income statement and the amount is adjusted retrospectively to the financial year in which these assets may be impaired.
AR09 pg1-64_Final.indd 59 10/2/2009 10:38:11 AM

60
CREATIVE TECHNOLOGY LTD AND ITS SUBSIDIARIES
34. NEW OR REVISED ACCOUNTING STANDARDS AND INTERPRETATIONS
Certain new standards, amendments and interpretations to existing standards have been published and are mandatory for the Group’s accounting periods beginning on or after 1 July 2009 or later periods and which the Group has not early adopted. The Group’s assessment of the impact of adopting those standards, amendments and interpretations that are relevant to the Group is set out below:
(a) FRS 1(R) Presentation of Financial Statements (effective for annual periods beginning on or after 1 January 2009)
The revised standard requires: • All changes in equity arising from transactions with owners in their capacity as owners to be presented separately from
components of comprehensive income; • Components of comprehensive income not to be included in statement of changes in equity; • Items of income and expenses and components of other comprehensive income to be presented either in a single statement
of comprehensive income with subtotals, or in two separate statements (a separate statement of profit and loss followed by a statement of comprehensive income);
• Presentation of restated balance sheet as at the beginning of the comparative period when entities make restatements or reclassifications of comparative information.
The revisions also include changes in the titles of some of the financial statements primary statements.
The Group will apply the revised standard from 1 July 2009 and provide comparative information that conforms to the requirements of the revised standard. The key impact of the application of the revised standard is the presentation of an additional primary statement, that is, the statement of comprehensive income.
(b) Amendment to FRS 107 Improving Disclosures about Financial Statements (effective for annual periods beginning on or after 1 January 2009)
The amendment requires enhanced disclosures about fair value measurement and liquidity risk. In particular, the amendment requires disclosure of fair value measurements by level of a fair value measurement hierarchy. The adoption of the amendment results in additional disclosures but does not have an impact on the accounting policies and measurement bases adopted by the Group.
35. AUTHORISATION OF FINANCIAL STATEMENTS
These financial statements were authorised for issue in accordance with a resolution of the Board of Directors of CREATIVE TECHNOLOGY LTD. on 30 September 2009.
NOTES TO THE FINANCIAL STATEMENTS– For the financial year ended 30 June 2009
AR09 pg1-64_Final.indd 60 10/2/2009 10:38:11 AM

61
CREATIVE TECHNOLOGY LTD AND ITS SUBSIDIARIES
36. LISTING OF SIGNIFICANT COMPANIES IN THE GROUP
Country of business/ Name of companies Principal activities incorporation Equity holding
2009 2008 % %
Significant subsidiaries held by the Group
(a) Creative Labs, Inc. Distribution of digitised United States 100 100 sound and video boards, of America computers and related multimedia products
(b) Creative Labs (Ireland) Ltd Distribution of digitised Republic of 100 100 sound and video boards, Ireland computers and related multimedia products
(b) Creative Technology Centre Pte Ltd Property investment holding Singapore 100 100
(b) Qmax Pte Ltd Provision of data Singapore 100 49 and subsidiary companies communications, telecommunications, wireless broadband and related services
(c) (d) Creative Technology (Qingdao) Ltd Design, development People’s Republic 100 100 and manufacture of of China communication and related multimedia products
(a) CTI Limited Investment holding Bermuda 100 100
(a) CTI II Limited Investment holding Bermuda 100 100
(a) Not required to be audited under the laws of the country of incorporation(b) Audited by PricewaterhouseCoopers LLP, Singapore(c) Audited by Zhenqing Certified Public Accountants(d) This subsidiary has a financial year end of 31 December by law in its country of incorporation
All the Singapore-incorporated subsidiaries were audited by the Company’s auditor, PricewaterhouseCoopers LLP, Singapore.
AR09 pg1-64_Final.indd 61 10/2/2009 10:38:11 AM

62
CREATIVE TECHNOLOGY LTD AND ITS SUBSIDIARIES
SGX-ST LISTING MANUAL REQUIREMENTS– For the financial year ended 30 June 2009
Additional Requirements of SGX-ST Listing Manual
DIRECTORS’ REMUNERATION
The following information relates to remuneration of directors of the Company during the financial year:
2009 2008
Number of directors of the Company in remuneration bands: - above S$500,000 – –
- S$250,000 to below S$500,000 – –
- below S$250,000 6 5
Total 6 5
The Company proposed to pay Director’s fees of S$205,000 in the current financial year (2008: paid S$240,000) to all its non-executive directors on its Board of Directors.
The Company paid a total remuneration of S$1 (2008: S$1) to its Chairman and Chief Executive Officer.
AUDITOR’S REMUNERATION
The following information relates to other fees of the auditors during the financial year:
2009 2008 US$’000 US$’000
Other fees paid/payable to:
- Auditor of the Company 144 89
- Other auditors * 226 183
* Include PricewaterhouseCoopers member firms outside Singapore
The Audit Committee has reviewed all non-audit services provided by the auditor of the Company and in the Audit Committee’s opinion, the non-audit services provided, will not affect the independence of the auditors.
PROPERTIES OF THE GROUP
The net book values of the leasehold and freehold properties held by the Group are as follows:
2009 2008 US$’000 US$’000
Leasehold land and buildings 4,800 5,078
Freehold land and buildings 15,379 16,044
20,179 21,122
MATERIAL CONTRACTS
There are no material contracts entered into by the Company or any of its subsidiaries involving the interest of the chief executive officer, any director or controlling shareholder, either still subsisting at the end of the financial year or entered into since the end of the previous financial year.
AR09 pg1-64_Final.indd 62 10/2/2009 10:38:12 AM

63
CREATIVE TECHNOLOGY LTD AND ITS SUBSIDIARIES
STATISTICS OF SHAREHOLDING AS AT 9 SEPTEMBER 2009
Number of Issued Shares : 75,000,000
Number of Issued Shares (excluding Treasury Shares) : 68,891,468
Number / Percentage of Treasury Shares : 6,108,532 (8.87%)
Class of Shares : Ordinary shares
Voting Rights (excluding Treasury Shares) : 1 vote per share
Based on the information available to the Company as at 9 September 2009, 62.78% of the issued ordinary shares of the Company is held by the public and therefore, Rule 723 of the Listing Manual issued by SGX-ST is complied with.
Number of Percentage of Number of Percentage of Size of shareholdings shareholders shareholders (%) shares shares (%)
1 - 999 6,912 49.66 1,936,558 2.81 1,000 - 10,000 6,695 48.10 15,394,578 22.35
10,001 - 1,000,000 307 2.20 14,457,088 20.98
1,000,001 and above 5 0.04 37,103,244 53.86
Total 13,919 100.00 68,891,468 100.00
TWENTY LARGEST SHAREHOLDERS
Name of shareholder Number of shares Percentage (%)
1 Sim Wong Hoo 23,270,652 33.78
2 Citibank Nominees Singapore Pte Ltd 6,174,286 8.96
3 Raffles Nominees (Pte) Ltd 3,383,542 4.91
4 DBS Nominees Pte Ltd 2,956,222 4.29
5 United Overseas Bank Nominees Pte Ltd 1,318,542 1.91
6 Ng Keh Long 923,000 1.34
7 OCBC Nominees Singapore Pte Ltd 822,750 1.19
8 HSBC (Singapore) Nominees Pte Ltd 714,900 1.04
9 Merrill Lynch (Singapore) Pte Ltd 601,278 0.87
10 DBSN Services Pte Ltd 578,917 0.84
11 UOB Kay Hian Pte Ltd 555,650 0.81
12 Sim Guan Huat 342,175 0.50
13 Chan Siew Kim Alice 300,000 0.44
14 Etrade Clearing LLC 271,085 0.39
15 Craig Lawrence Mc Hugh 270,000 0.39
16 Phillip Securities Pte Ltd 257,900 0.37
17 Western Properties Pte Ltd 257,000 0.37
18 Kim Eng Securities Pte Ltd 253,280 0.37
19 DB Nominees (S) Pte Ltd 240,113 0.35
20 Teng Cheng Sin 230,100 0.33
Total 43,721,392 63.45
Number of ordinary sharesSubstantial shareholder Direct interest Deemed interest
Sim Wong Hoo 23,270,652 –
AR09 pg1-64_Final.indd 63 10/2/2009 10:38:12 AM

64
CREATIVE TECHNOLOGY LTD AND ITS SUBSIDIARIES
CORPORATE INFORMATION
Board of Directors Sim Wong Hoo, Chairman Lee Kheng Nam, Director Ng Kai Wa, Director Lee Gwong-Yih, Director
Company Secretary Ng Keh Long
Registered Office 31 International Business Park Creative Resource Singapore 609921 Tel: 65-6895-4000 Email: [email protected]
Share Registrar Boardroom Corporate & Advisory Services Pte. Ltd. 3 Church Street #08-01 Samsung Hub Singapore 049483
Corporate Counsel Arfat Selvam Alliance LLC 55 Market Street #08-01 Singapore 048941
Independent Auditor PricewaterhouseCoopers LLP 8 Cross Street #17-00 PWC Building Singapore 048424 Audit Partner: Choo Eng Beng Year of appointment: 2008
AR09 pg1-64_Final.indd 64 10/2/2009 10:38:12 AM