ar2011
TRANSCRIPT

(Incorporated in Bermuda with limited liability)Stock Code: 494
ANNUAL REPORT 2011
LI & FUNG LIMITED

CONTENTS2 Corporate Information
3 Key Financial Highlights
6 Chairman’s Statement
12 Management Discussion and Analysis
24 Corporate Governance
40 Sustainability
46 Directors and Senior Management
52 Information for Investors
53 Report of the Directors
64 Independent Auditor’s Report
66 Statement of Accounts
160 Ten-Year Financial Summary
CORPORATE INFORMATION
2 LI & FUNG LIMITED | ANNUAL REPORT 2011
EXECUTIVE DIRECTORSWilliam FUNG Kwok Lun, Deputy Chairman
Bruce Philip ROCKOWITZ, Group President & Chief Executive Officer
Spencer Theodore FUNG
PRINCIPAL BANKERSThe Hongkong and Shanghai Banking Corporation Limited
Citibank, N.A.
JPMorgan Chase Bank, N.A.
Standard Chartered Bank (Hong Kong) Limited
AUDITORPricewaterhouseCoopers
Certified Public Accountants
22nd Floor, Prince’s Building, Central
Hong Kong
NON-EXECUTIVE DIRECTORSVictor FUNG Kwok King, Chairman
Paul Edward SELWAY-SWIFT*
Allan WONG Chi Yun*
Franklin Warren McFARLAN*
Martin TANG Yue Nien*
Benedict CHANG Yew Teck
FU Yuning*
* Independent Non-executive Directors
GROUP CHIEF COMPLIANCE OFFICERSrinivasan PARTHASARATHY
COMPANY SECRETARYTerry WAN Mei Chow
LEGAL ADVISORSMayer Brown JSM
16th-19th Floors, Prince’s Building
10 Chater Road, Central, Hong Kong
REGISTERED OFFICECanon’s Court, 22 Victoria Street
Hamilton HM 12, Bermuda
HONG KONG OFFICE11th Floor, LiFung Tower
888 Cheung Sha Wan Road
Kowloon, Hong Kong

KEY FINANCIAL HIGHLIGHTS
3LI & FUNG LIMITED | ANNUAL REPORT 2011 3LI & FUNG LIMITED | ANNUAL REPORT 2011
3-YEAR PLAN
1st Year
TURNOVERTOTAL MARGIN*
CORE OPERATING PROFITS MARGIN
US$ million
11100908
14,19513,395
15,912
20,030
0
3,000
6,000
9,000
12,000
15,000
18,000
21,000
%
10 11
14.115.3
4.6 4.4
0
2
4
6
8
10
12
14
16
Core Operating Profit Margin
* Gross Profit plus other income, as percentage of turnover
Total Margin
(US$’000) 2011 2010 Change Turnover 20,030,271 15,912,201 +26%
Total Margin 3,074,204 2,238,289 +37%As percentage of Turnover 15.3% 14.1%
Core Operating Profit 882,056 725,138 +22%As percentage of Turnover 4.4% 4.6%
Cash Earnings# 849,585 679,631 +25%As percentage of Turnover 4.2% 4.3%
Profit attributable to shareholders of the Company 681,229 548,491 +24%As percentage of Turnover 3.4% 3.4%
Earnings per Share – Basic 8.43 US cents 7.17 US cents* +18%
Dividend per Share– Final 34 HK cents 26 HK cents* +31%– Full year 53 HK cents 45 HK cents* +18%
Shareholders’ Funds 3,933,793 3,626,029
Net Assets per Share US$0.49 US$0.45
# Profit for the year before non-cash interest, depreciation of property, plant and equipment, amortization of intangible assets other than brand licenses, share option expenses and share of profit from associated companies
* Adjusted for the effect of Share Subdivision in May 2011

4 LI & FUNG LIMITED | ANNUAL REPORT 20114 LI & FUNG LIMITED | ANNUAL REPORT 2011
THE AMERICASGuatemala CityLimaManaguaMexico CityPuebla
Sao PauloSan Pedro SulaSanto DomingoLos AngelesNew York City
SOUTHERN AFRICAAntananarivo
Durban
EUROPEAmman
Bucharest
Cairo
Casablanca
Istanbul
Izmir
Milan
Oporto
Sofia
Vilnius
Sheffield
Bremerhaven
Den Bosch
Hamburg
Leicester
Sheffield
Washington
Barcelona
Bremerhaven
Den Bosch
Hamburg
Huddersfield
Keighley
London
Lucca
Manchester
Manno
Milan
Monheim
Paris
Tel Aviv
Trowbridge
Vienna
Washington
OrlandoSecaucus WythevilleCarlstadtFar RockawayLos AngelesOrlandoRedlandsSecaucusBentonville
Trading Offices
Logistics Offices
Distribution Centers
Distribution Offices
Moka
GaffneyGreat NeckGreensboroLos AngelesNew York CityPlanoProvidenceTampa
5LI & FUNG LIMITED | ANNUAL REPORT 2011
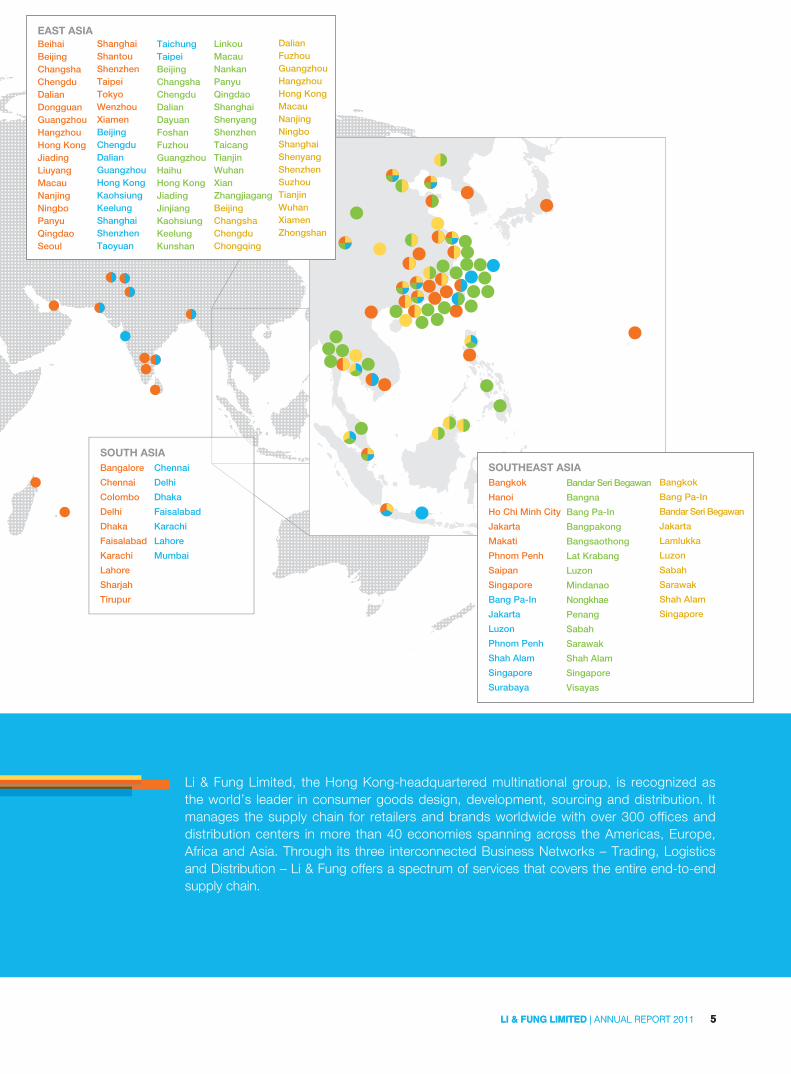
Li & Fung Limited, the Hong Kong-headquartered multinational group, is recognized as the world’s leader in consumer goods design, development, sourcing and distribution. It manages the supply chain for retailers and brands worldwide with over 300 offices and distribution centers in more than 40 economies spanning across the Americas, Europe, Africa and Asia. Through its three interconnected Business Networks – Trading, Logistics and Distribution – Li & Fung offers a spectrum of services that covers the entire end-to-end supply chain.
5LI & FUNG LIMITED | ANNUAL REPORT 2011
SOUTH ASIABangalore
Chennai
Colombo
Delhi
Dhaka
Faisalabad
Karachi
Lahore
Sharjah
Tirupur
Chennai
Delhi
Dhaka
Faisalabad
Karachi
Lahore
Mumbai
SOUTHEAST ASIABangkok
Hanoi
Ho Chi Minh City
Jakarta
Makati
Phnom Penh
Saipan
Singapore
Bang Pa-In
Jakarta
Luzon
Phnom Penh
Shah Alam
Singapore
Surabaya
Bandar Seri Begawan
Bangna
Bang Pa-In
Bangpakong
Bangsaothong
Lat Krabang
Luzon
Mindanao
Nongkhae
Penang
Sabah
Sarawak
Shah Alam
Singapore
Visayas
Bangkok
Bang Pa-In
Bandar Seri Begawan
Jakarta
Lamlukka
Luzon
Sabah
Sarawak
Shah Alam
Singapore
EAST ASIABeihaiBeijingChangshaChengduDalianDongguanGuangzhouHangzhouHong KongJiadingLiuyangMacauNanjingNingboPanyuQingdaoSeoul
LinkouMacauNankanPanyuQingdaoShanghaiShenyangShenzhenTaicangTianjinWuhanXianZhangjiagangBeijingChangshaChengduChongqing
DalianFuzhouGuangzhouHangzhouHong KongMacauNanjingNingboShanghaiShenyangShenzhenSuzhouTianjinWuhanXiamenZhongshan
ShanghaiShantouShenzhenTaipeiTokyoWenzhouXiamenBeijingChengduDalianGuangzhouHong KongKaohsiungKeelungShanghaiShenzhenTaoyuan
TaichungTaipeiBeijingChangshaChengduDalianDayuanFoshanFuzhouGuangzhouHaihuHong KongJiadingJinjiangKaohsiungKeelungKunshan
CHAIRMAN’S STATEMENT
6 LI & FUNG LIMITED | ANNUAL REPORT 2011
At Li & Fung, 2011 was the start of a new era of growth, marked by a series of remarkable transitions and efforts designed to ensure the Group’s future leadership of a rapidly changing global supply chain.
The establishment of three business Networks – Trading, Logistics and Distribution – opens the door to significant growth opportunities. It enables us to sell across these distinct yet interconnected areas. It also provides us with yet another way to serve our customers through expanded scope and capabilities. In these times of global economic uncertainty, this proposition will be especially important as we work toward a new era of growth.
Undoubtedly, the market environment will remain challenging. While the US is expected to grow modestly, the Eurozone’s GDP may contract as the debt crisis continues to create drag on its economic recovery. Nevertheless, the Group has committed significant effort and resources to ensuring that its three Networks are equipped to grow. Our growth in the immediate future will focus on cross-selling and increasing our market share, which will enable us to grow faster than the overall growth in our markets.
Victor FungChairman
7LI & FUNG LIMITED | ANNUAL REPORT 2011
CHAIRMAN’S STATEMENT (CONTINUED)
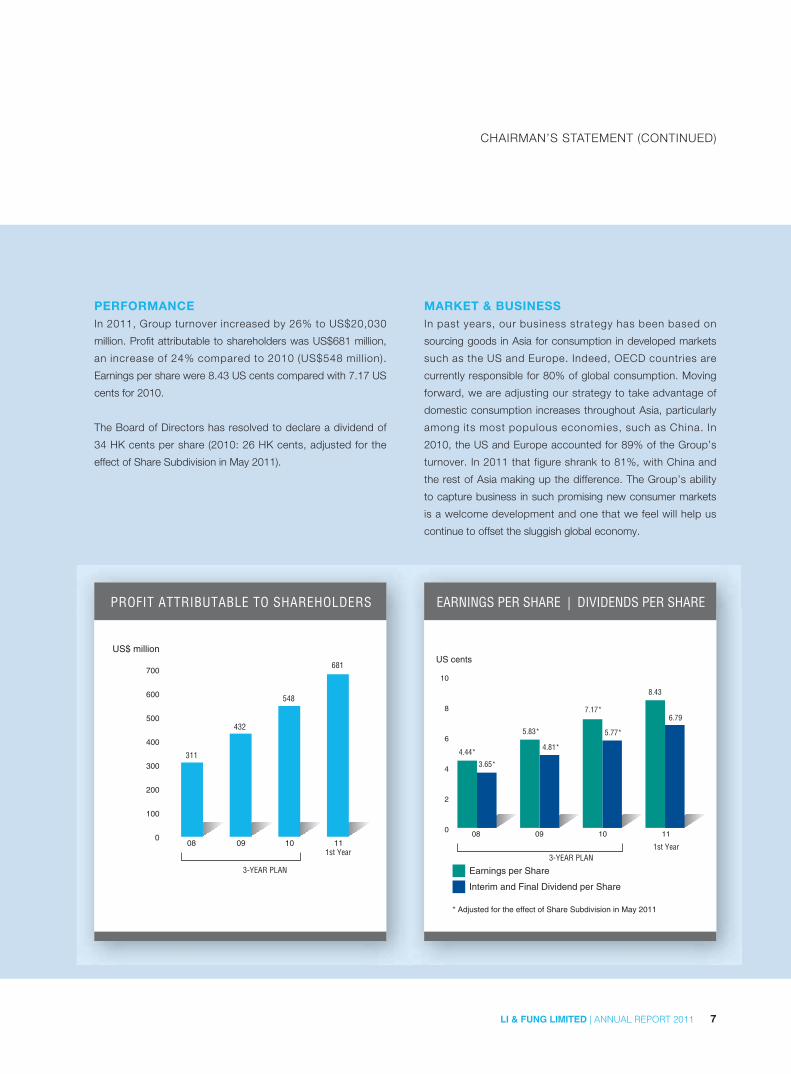
PERFORMANCEIn 2011, Group turnover increased by 26% to US$20,030
million. Profit attributable to shareholders was US$681 million,
an increase of 24% compared to 2010 (US$548 mill ion).
Earnings per share were 8.43 US cents compared with 7.17 US
cents for 2010.
The Board of Directors has resolved to declare a dividend of
34 HK cents per share (2010: 26 HK cents, adjusted for the
effect of Share Subdivision in May 2011).
MARKET & BUSINESSIn past years, our business strategy has been based on
sourcing goods in Asia for consumption in developed markets
such as the US and Europe. Indeed, OECD countries are
currently responsible for 80% of global consumption. Moving
forward, we are adjusting our strategy to take advantage of
domestic consumption increases throughout Asia, particularly
among its most populous economies, such as China. In
2010, the US and Europe accounted for 89% of the Group’s
turnover. In 2011 that figure shrank to 81%, with China and
the rest of Asia making up the difference. The Group’s ability
to capture business in such promising new consumer markets
is a welcome development and one that we feel will help us
continue to offset the sluggish global economy.
PROFIT ATTRIBUTABLE TO SHAREHOLDERS EARNINGS PER SHARE | DIVIDENDS PER SHARE
US$ million
11100908
311
432
548
681
0
100
200
300
400
500
600
700
08 09 10 11
4.44*
3.65*
5.83*
4.81*
7.17*
5.77*
8.43
6.79
US cents
0
2
4
6
8
10
Earnings per Share
* Adjusted for the effect of Share Subdivision in May 2011
Interim and Final Dividend per Share
3-YEAR PLAN3-YEAR PLAN
1st Year1st Year

8 LI & FUNG LIMITED | ANNUAL REPORT 2011
CHAIRMAN’S STATEMENT (CONTINUED)
On the production side, it is estimated that Asia will account for
over half of the world’s output by 2050. China has long been
the world’s manufacturing powerhouse, and it remains the
biggest sourcing market for the Group. However, with wages in
the Pearl River Delta rising by 30% in recent times, this region
is no longer the low-cost center of years past. Regions such as
Bangladesh, Vietnam and Cambodia as well as western and
northern China are gaining preference among cost-sensitive
customers.
Operationally, this past year was significant because it marked
the reorganization of the Group structure along three lines:
Trading, Logistics and Distribution. During the year we worked
tirelessly to strengthen these Networks through organic growth
and acquisition while also streamlining operations. Acquisitions
included several large deals and smaller roll-up deals that
bolstered even more our range of products and services.
With these investments, we are even better equipped to grow
organically as future growth opportunities rise with the global
economic recovery.
One particular advantage of having these three Networks is that
by offering an unparalleled suite of global supply chain solutions
for our customers, we will also generate new revenue streams
and drive organic growth through substantial cross-selling
opportunities.
Since the founding of Li & Fung in 1906, we have continually
questioned and strengthened our business and management
methods to adapt to an ever-changing world. In this context,
we have made sustainabi l i ty a key pi l lar of our current
Three-Year Plan for 2011–2013, and in 2011 we continued to
expand the implementation of our Sustainability Strategy. This
strategy provides a foundation for our global operations to
integrate sustainability into our business and with our supply
chain partners. Our goal is to implement programs that bring
tangible benefits to the Group and to the world. Within our four
walls, we continued our efforts to reduce our environmental
footprint through reductions in carbon emissions and energy,
water and paper consumption; to engage our colleagues to live
and work sustainably; and to support our communities around
the world. This year also marks a significant milestone as we
developed and prepared for the 2012 launch of our revised
Code of Conduct for Suppliers and new Supplier Compliance
Manual. We look forward to continuing to work with our
partners to build capacity in our supply chain to improve
working conditions and environmental performance and provide
sustainable sourcing options.
With approximately 15,000 manufacturers in over 40 economies
worldwide, Li & Fung remains in a very advantageous position to
prosper in the coming years. However, it will also be critical for
us to continue working closely with our partners and customers
to help raise the quality of supply and manufacturing throughout
the network.
included several large deals and smaller roll-up deals that
DIVIDEND PAYOUT
%
11100908
84 84 83 81
0
20
40
60
80
100
3-YEAR PLAN
1st Year
9LI & FUNG LIMITED | ANNUAL REPORT 2011
CHAIRMAN’S STATEMENT (CONTINUED)
PROSPECTSThe year 2011 was one of transition and investment, and we
believe we have set in motion a business plan that will be borne
out by the future success of our Group and our customers.
The road ahead will not be entirely smooth. The state of the
global economy remains uncertain, and the weakness of the
US dollar continues to hamper trade. We are also seeing a
proliferation of bilateral agreements in response to the global
economic downturn and political uncertainty around the world.
This will only serve to undermine the power of the global supply
chain while also affecting the ability of SMEs to compete in
an increasingly complicated environment. We remain firm in
our belief that a multilateral trading system is the best way to
achieve economic recovery and growth, and we will continue to
strongly encourage the world’s leaders to negotiate sustainable
agreements that can help achieve these goals, for developed
and developing nations alike.
It should be noted that this year’s report marks my last as
Chairman of Li & Fung Limited. I will continue to serve as
Non-executive Director of the Company and also as Chairman
of its Risk Management and Sustainability Committee. I will also
remain closely engaged in my other publicly listed and private
holdings as well as our family’s charitable foundations, the
Victor and William Fung Foundation and the Li & Fung (1906)
Foundation.
I would like to take the opportunity of this platform one last time
to congratulate my colleagues around the world for helping
make Li & Fung the world’s leading supply chain company.
Under the expert guidance of Dr. William Fung, who will assume
the role of Chairman in May 2012, and Mr. Bruce Rockowitz,
our Group President and CEO, I strongly believe the Group has
begun a new era of prosperity, growth and leadership.
Victor FUNG Kwok King
Chairman
Hong Kong, 22 March 2012
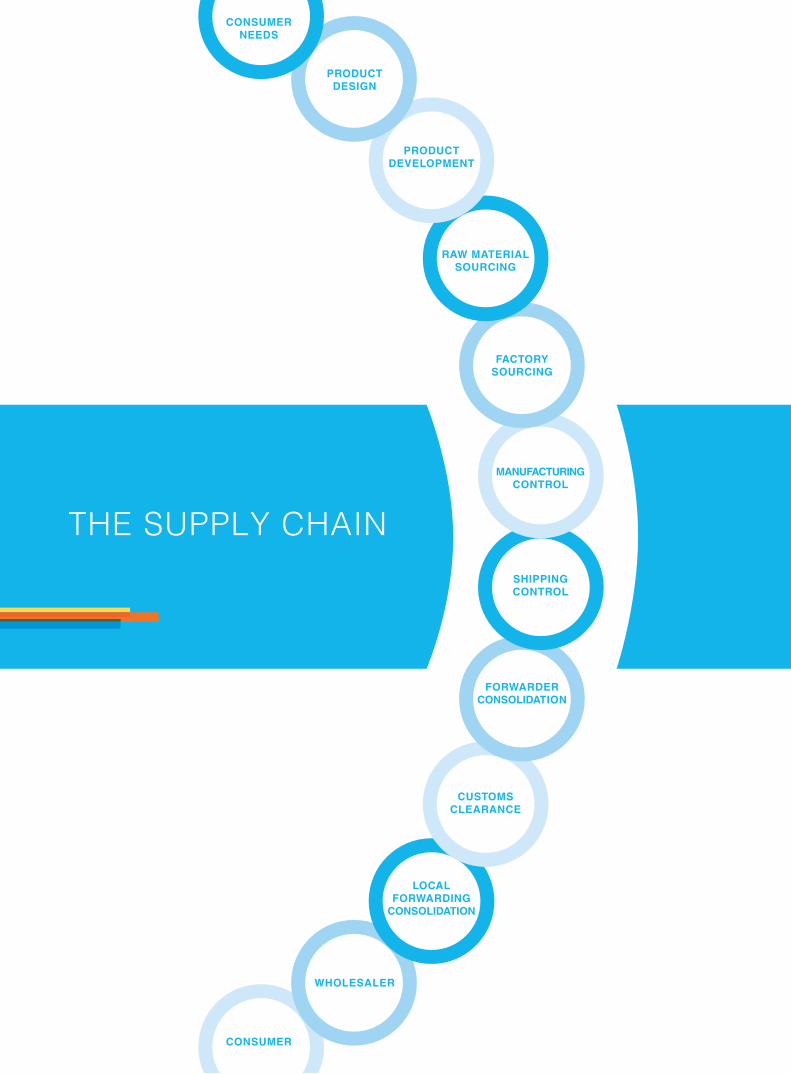
THE SUPPLY CHAINSHIPPINGCONTROL
FORWARDERCONSOLIDATION
MANUFACTURINGCONTROL
FACTORYSOURCING
LOCAL FORWARDING
CONSOLIDATION
CONSUMERNEEDS
PRODUCTDEVELOPMENT
CONSUMER
CUSTOMSCLEARANCE
WHOLESALER
RAW MATERIALSOURCING
PRODUCTDESIGN

We manage all aspects ofthe Global Supply Chain with
our extensive network covering over300 offices and distribution centers in
more than 40 economies
MANAGEMENT DISCUSSION & ANALYSIS
12 LI & FUNG LIMITED | ANNUAL REPORT 2011
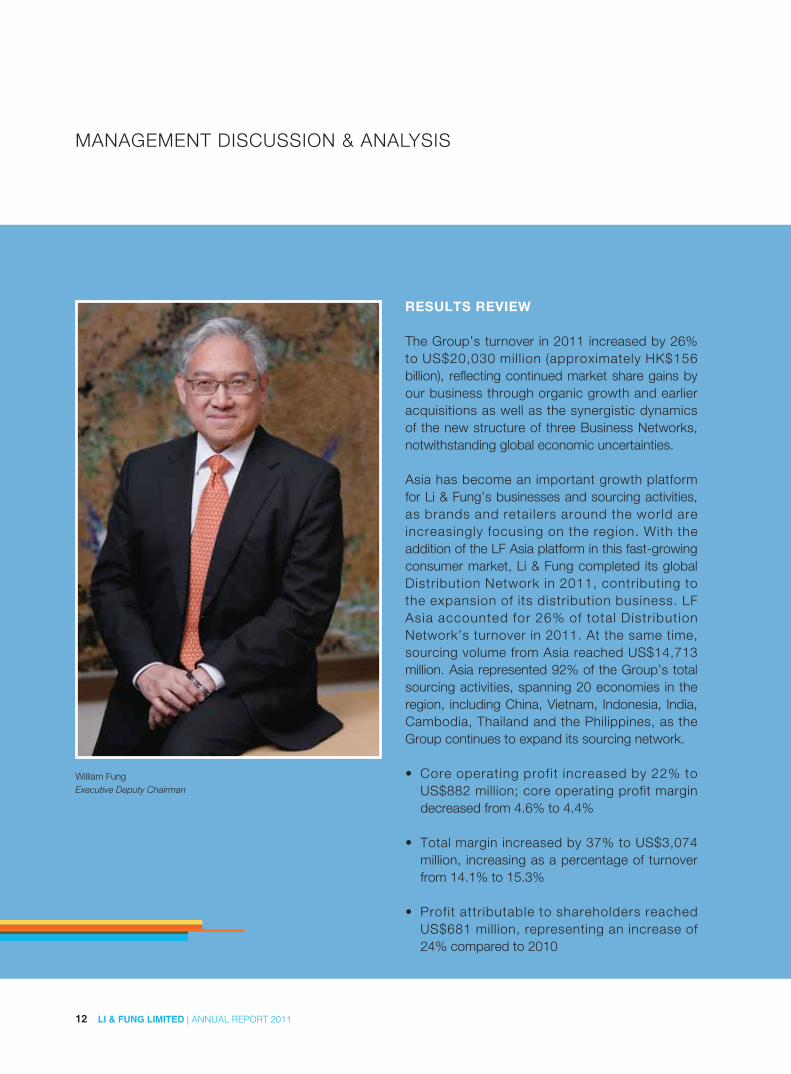
RESULTS REVIEW
The Group’s turnover in 2011 increased by 26% to US$20,030 mill ion (approximately HK$156 billion), reflecting continued market share gains by our business through organic growth and earlier acquisitions as well as the synergistic dynamics of the new structure of three Business Networks, notwithstanding global economic uncertainties. Asia has become an important growth platform for Li & Fung’s businesses and sourcing activities, as brands and retai lers around the world are increasingly focusing on the region. With the addition of the LF Asia platform in this fast-growing consumer market, Li & Fung completed its global Distribution Network in 2011, contributing to the expansion of its distribution business. LF Asia accounted for 26% of total Distr ibution Network’s turnover in 2011. At the same time, sourcing volume from Asia reached US$14,713 million. Asia represented 92% of the Group’s total sourcing activities, spanning 20 economies in the region, including China, Vietnam, Indonesia, India, Cambodia, Thailand and the Philippines, as the Group continues to expand its sourcing network.
• Core operating profit increased by 22% to US$882 million; core operating profit margin decreased from 4.6% to 4.4%
• Total margin increased by 37% to US$3,074 million, increasing as a percentage of turnover from 14.1% to 15.3%
• Profit attributable to shareholders reached US$681 million, representing an increase of 24% compared to 2010
William FungExecutive Deputy Chairman
13LI & FUNG LIMITED | ANNUAL REPORT 2011
MANAGEMENT DISCUSSION & ANALYSIS (CONTINUED)
Core operating profit increased due to positive contributions from all three Business Networks, namely Trading, Logistics and Distribution. Recent acquisitions and investment in the new Three-Year Plan continued to contribute to high operating expenses for the year.
Cash earnings increased by 25% to US$850 million. Cash earnings is defined as profit for the year before non-cash interest, depreciation of property, plant and equipment, amortization of intangible assets other than brand licenses, share option expenses and share profit from associated companies.
Li & Fung has grown from one global business network to three, and the Group has started to see encouraging results from cross-selling amongst them, boosting confidence that cross-selling will be a key growth driver going forward.
SEGMENTAL ANALYSIS
THREE NETWORKS SEGMENTATIONThe period under review marked the first year that we reported by the three Business Networks: Trading, Logistics and Distribution.
The Trading Network represented 70% of total turnover, up 16% from the same period last year. This was attributed largely to continuous market share gains throughout the year despite an uncertain economic environment. The trading business delivered significant positive operating leverage as core operating profit grew 31% from last year.
Bruce RockowitzGroup President & Chief Executive Officer

14 LI & FUNG LIMITED | ANNUAL REPORT 2011
MANAGEMENT DISCUSSION & ANALYSIS (CONTINUED)
experienced a good start in 2011 with the LF Asia – Food,
Health, Beauty & Cosmetics business delivering steady growth,
while LF Asia – Hard & Soft Goods made a debut acquisition in
2011 as well as good progress in building an important platform
for branded consumer products in Asia.
SOFTGOODS & HARDGOODS SEGMENTATION
In 2011, softgoods and hardgoods accounted for 64%
and 34% of turnover respectively. Logistics represented
approximately 2%. Softgoods turnover grew 17%, which was
largely due to the organic growth of some existing customers,
together with contributions from acquisitions such as Oxford
Apparel and Loyaltex Apparel.
The Logistics Network accounted for 2% of total turnover.
As the logistics business is a newly acquired business from
the Integrated Distribution Services Group Limited (“IDS”)
acquisit ion, there is no direct year-on-year comparison
regarding growth of turnover and core operating profit.
The Distribution Network represented 28% of total turnover,
and it grew 61% compared to the same period last year. The
growth was mainly due to contributions from acquisitions
including IDS and Oxford Apparel. Core operating profit grew
by only 2% from last year, mainly due to higher operating costs
in the LF USA business, for which steps have been taken
to reduce costs through measures including job offshoring.
On the other hand, the LF Europe business delivered a solid
contribution in 2011 despite difficult market conditions. LF Asia
TURNOVER BY NETWORK
17,7
27*
22,6
32*
US$ million
1110
1%
22%
77%
28%
2%
70%
* Turnover before elimination of inter-segment transactions
Trading
Logistics
Distribution
TURNOVER BY PRODUCT
14,1
95
13,3
95
15,9
12
20,0
30US$ million
11100908
34%
66%
30%
70%
1%
2%
34%
64%
30%
69%
Softgoods
Hardgoods
Logistics
3-YEAR PLAN1st Year
15LI & FUNG LIMITED | ANNUAL REPORT 2011
MANAGEMENT DISCUSSION & ANALYSIS (CONTINUED)
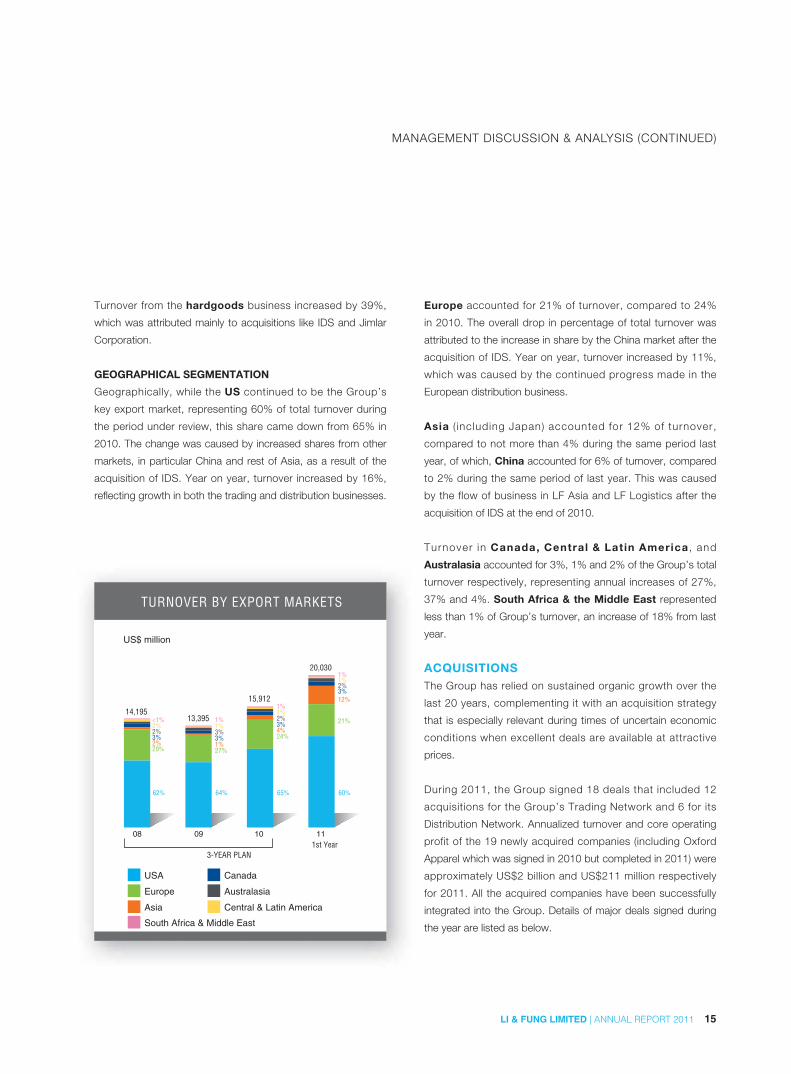
Europe accounted for 21% of turnover, compared to 24%
in 2010. The overall drop in percentage of total turnover was
attributed to the increase in share by the China market after the
acquisition of IDS. Year on year, turnover increased by 11%,
which was caused by the continued progress made in the
European distribution business.
Asia ( including Japan) accounted for 12% of turnover,
compared to not more than 4% during the same period last
year, of which, China accounted for 6% of turnover, compared
to 2% during the same period of last year. This was caused
by the flow of business in LF Asia and LF Logistics after the
acquisition of IDS at the end of 2010.
Turnover in Canada, Central & Lat in America , and
Australasia accounted for 3%, 1% and 2% of the Group’s total
turnover respectively, representing annual increases of 27%,
37% and 4%. South Africa & the Middle East represented
less than 1% of Group’s turnover, an increase of 18% from last
year.
ACQUISITIONSThe Group has relied on sustained organic growth over the
last 20 years, complementing it with an acquisition strategy
that is especially relevant during times of uncertain economic
conditions when excellent deals are available at attractive
prices.
During 2011, the Group signed 18 deals that included 12
acquisitions for the Group’s Trading Network and 6 for its
Distribution Network. Annualized turnover and core operating
profit of the 19 newly acquired companies (including Oxford
Apparel which was signed in 2010 but completed in 2011) were
approximately US$2 billion and US$211 million respectively
for 2011. All the acquired companies have been successfully
integrated into the Group. Details of major deals signed during
the year are listed as below.
Turnover from the hardgoods business increased by 39%,
which was attributed mainly to acquisitions like IDS and Jimlar
Corporation.
GEOGRAPHICAL SEGMENTATION
Geographically, while the US continued to be the Group’s
key export market, representing 60% of total turnover during
the period under review, this share came down from 65% in
2010. The change was caused by increased shares from other
markets, in particular China and rest of Asia, as a result of the
acquisition of IDS. Year on year, turnover increased by 16%,
reflecting growth in both the trading and distribution businesses.
TURNOVER BY EXPORT MARKETS
USA
Europe
Asia
Canada
Australasia
Central & Latin America
South Africa & Middle East
US$ million
11100908
14,19513,395
15,912
20,030
2%
<1%2%2%3%
29%
62%
1%
1%1%3%3%
27%
64%
4%
1%1%2%3%
24%
65%
12%
1%1%2%3%
21%
60%
3-YEAR PLAN1st Year

16 LI & FUNG LIMITED | ANNUAL REPORT 2011
MANAGEMENT DISCUSSION & ANALYSIS (CONTINUED)
In the same month, Li & Fung acquired Stone Sapphire/
Gemstone Printing, a company specializing in the supply
of printed paper products and technical packaging. The
acquisit ion provides Li & Fung with a platform to source
specialty paper products and complex packaging solutions for
our customers, and it further complements our expertise in the
“Stationery and Supplies” category.
In May, Li & Fung acquired Loyaltex Apparel Ltd. Loyaltex is
a sourcing and development company specialized in knits,
woven/denim and sweater. This acquisition will add a new
portfolio of customers including Aeropostale, which sells
casual clothing to 14-to-17-year-olds through over 900 stores
in the United States, Canada and Puerto Rico; Sanmar, a
major supplier of apparel to screen printers, embroiderers
and promotional product distributors; and Alfred Dunner, the
leading manufacturer of moderately priced ladies coordinated
sportswear in the United States and Canada. This will further
strengthen the Group’s capabilities in global sourcing, as well as
create significant synergies with its existing business.
TRADING NETWORK
The new additions to Li & Fung’s Trading Network include
the acquisitions of Modium, Celissa, Techno Source, Stone
Sapphire/Gemstone Printing, Loyaltex Apparel, Collection 2000,
Exim Designs, Union Rich, Lloyd Textile and True Innovations.
Modium was acquired in January and is a virtual manufacturer
of ladies’ and men’s woven apparel based in Istanbul,
Turkey. Key competencies are its strong product development
skills and short leadtimes.
Celissa was acquired in March and is a trading company based
in Istanbul, Turkey, supplying wovens and knits to customers in
Europe. Key competencies are short leadtimes and access to
key customers.
In March, Li & Fung also acquired Techno Source USA, Inc.,
one of the fastest-growing toy companies and a toy innovator
with a track record of successfully introducing electronic and
non-electronic games. This acquisition provides a platform
for Li & Fung to continue to build and expand its toy business
globally.
17LI & FUNG LIMITED | ANNUAL REPORT 2011
MANAGEMENT DISCUSSION & ANALYSIS (CONTINUED)
DISTRIBUTION NETWORK
In addition, the Group has acquired Beyond Productions,
TVMania, Hampshire Designers, Fishman & Tobin, Crimzon
Rose and Midway Enterpr ises/Wonderfu l Wor ld for i ts
Distribution Network.
In January, Li & Fung acquired Beyond Productions, LLC, a
leading designer and licensor of women’s fashion apparel and
accessories. The deal broadens the Group’s range of offerings
for the retail channel and further strengthens its position as an
innovative, design-driven company.
In May, Li & Fung acquired TVMania, the leading Pan-European
supplier of character licensed and branded merchandize
with the most comprehensive set of licenses across Europe.
Its portfolio of character licenses include Hello Kitty, Mickey
Mouse, Cars, Batman, Ben 10, Bakugan, Star Wars,
Barbie, Pokémon, Bob the Builder, Sponge Bob, Spiderman
Movies, Smurf, Dora the Explorer as well as the surf brand
Gotcha. Major licensors include Sanrio, Disney, Marvel, MTV/
Nickelodeon, Hit, Cartoon Network, Lucas Films and Mattel.
The company’s main product categories are casual, nightwear
and underwear. This acquisition will help to further expand the
Group’s licensed apparel business alongside its private label
apparel business across Europe. The acquisition of TVMania
underlines the Group’s strategy of creating synergies between
its US and European distribution businesses. Together with
Kids Headquarters, a US deal which was acquired in 2009, this
acquisition will allow the Group to become the largest global
player in licensed apparel trading, and hence a stronger and
even more valuable partner to licensors and retailers.
During the same month, Li & Fung acquired Collection 2000. It
specializes in fashion color cosmetics products for the beauty
industry in the UK, with a range of products available in the
majority of the country’s leading mass color cosmetics retailers.
This acquisition is expected to further category and customer
base expansion in Li & Fung’s Health, Beauty, and Cosmetics
(“HBC”) business in the UK.
In June, L i & Fung acquired Exim Designs Co., Ltd., a
Thai-based furniture trading company that specializes in
ready-to-assemble, flat-pack furniture. This acquisition will help
strengthen Li & Fung’s capabilities in the furniture business with
mass-market and traditional furniture retailers and the Group
expects additional synergies to be created with its existing
customers in this product category.
In July 2011, the Group acquired Union Rich USA, LLC., a
leading product development company specializing in storage
and organization products for home and travel. This acquisition
further expands our reach to specialty home improvement
retailers and further improves our knowledge of the home
improvement industry.
Li & Fung also acquired a design company Lloyd Textile Fashion
Company Limited in July. The acquisition strengthens the
Group’s in-house design functions. The key managers from the
acquisition will bring with them well-established relationships
with customers and expert knowledge of men’s product
categories and markets which are important to the Group.
In September, Li & Fung acquired True Innovations, LLC, one of
the leading office and entertainment furniture trading companies
servicing mass retailers. It designs, markets and distributes
office chairs, desks and entertainment units under its proprietary
brands, licensed brands as well as retailers’ private labels. This
acquisition further expands Li & Fung’s customer base in this
product category as well as its licensing portfolio with well-
known US furniture brands.

18 LI & FUNG LIMITED | ANNUAL REPORT 2011
MANAGEMENT DISCUSSION & ANALYSIS (CONTINUED)
LICENSING DEALIn December, the Group signed master license agreement with
USPA – U.S. Polo Association. According to the agreement,
LF Asia will take over the management of the USPA brand in
China, Hong Kong and Macau including all hardgoods and
softgoods for the trademark of USPA.
DISPOSAL OF PROPERTIES AND MEDICAL EQUIPMENT BUSINESSES (CONNECTED TRANSACTIONS)In June, the Group announced the disposal of IDS Group’s
medical equipment businesses to Li & Fung Distribution Limited,
a wholly owned subsidiary of Li & Fung (1937) Limited, which is
a substantial shareholder of the Group. The reason for disposal
was that the medical equipment businesses, which involved the
distribution of durable medical equipment and required provision
of long-term maintenance services, were not consistent with
the Group’s overall consumer goods business strategy. This
disposal generated a gain of approximately US$45 million for
the Group.
At the same time, the Group also announced the sale of two
properties in Turkey and Taiwan as well as a property company
in China, and a leaseback of the property in Turkey. The Group
believes the disposal and leaseback allow the Group to achieve
its asset light strategy while obtaining a long lease for the
Group’s use. The disposal resulted in a gain of approximately
US$14 million.
In May, Li & Fung acquired Hampshire Designers, Inc., the
women’s division of Hampshire Group Limited in the US. The
acquisition includes Designers Originals, Mercer Street Studio
and Hampshire Studio, and it is expected to further expand the
Group’s women’s knitwear and woven product offerings and
capabilities.
In August, Li & Fung acquired Fishman & Tobin, a children’s
apparel company and a key supplier to the boy’s dresswear
market, special ized in boy’s dresswear, boys and gir ls
school uniforms, boys sportswear and men’s dresswear.
This acquisition is a significant step in expanding the Group’s
licensed brands portfolio to dressier boys’ and girls’ apparel.
Crimzon Rose International was also acquired in August and is
one of the leading companies that designs, sources, markets
and distributes costume jewelry and accessories under its own
brands or licenses. Major brands include Crimzon, Erica Lyons,
Daisy Fuentes, Elements, Lolita and Pure Expressions. This
acquisition will add a jewelry platform to Li & Fung’s Distribution
business in the U.S. while strengthening its sourcing capability
in this product category.
In September, L i & Fung acquired Midway Enterpr ises
(Guangzhou) Ltd., Wonderful World (HK) Ltd. and Wonderful
World Overseas Limited from The Roly Group. They operate
chi ldren apparel and toys businesses in Greater China.
This marks Li & Fung’s first acquisition for LF Asia since the
expansion of its Distribution business to Asia in 2011. The
acquisition dramatically strengthens LF Asia’s brands and
licensing portfolio and enables LF Asia to expand its business
into new markets and product categories, including the
children’s marketplace in China.

19LI & FUNG LIMITED | ANNUAL REPORT 2011
MANAGEMENT DISCUSSION & ANALYSIS (CONTINUED)
EMPLOYEE ENGAGEMENT
In September 2011, we launched our f i rs t Employee
Engagement Survey with the objective of assessing our
engagement with our employees and their customer orientation,
and finding out more about our strengths and opportunities
for improvement across our business units and countries. The
survey, which was web-based and implemented through a
third-party to safeguard the anonymity of the respondents,
consisted of 56, close-ended questions and one, open-ended
question.
Out of the 14,490 employees who received the survey request,
11,237 completed the survey, representing a response rate
of 78%. The survey helped management to understand the
views of employees and to receive useful feedback. We have
formed a Corporate Engagement Team in conjunction with
business executives to communicate the survey results across
the company and to identify follow-up actions. In addition,
our business executives will champion improvement initiatives
that focus on the three themes of Communication, Career and
People Care.
WELL-BEING, OCCUPATIONAL HEALTH AND SAFETY
AND HUMAN RIGHTS
We aim to provide a safe, healthy and respectful workplace by
adhering to our policies and codes, raising awareness, sharing
tips and experiences, and providing training for our employees.
The health and well-being of all of our people globally is at the
top of our agenda. Our Useful Tips on health and well-being
play a vital role in sharing knowledge to our employees through
daily email messages and our internal e-platform. The tips cover
issues relevant to occupational health (e.g. desk ergonomics,
heavy-lifting postures and precautions, stretching exercises)
and well-being (e.g. ways to stay positive, quick stress relievers
at workplace).
THE NEW THREE-YEAR PLAN 2011–2013The period under review was the first year of the current
Three-Year Plan (2011–2013). The targets of th is new
Three-Year Plan 2011–2013 are to achieve Core Operating
Profit of US$1.5 billion by 2013, with Trading, Logistics and
Distribution expected to contribute US$0.7 billion, US$0.1 billion
and US$0.7 billion respectively. Our long-established market
position across the supply chain network puts us in an unique
position to optimize opportunities for remarkable growth in the
future.
Li & Fung will also continue to monitor market conditions to
ensure the continuing strength of its franchise, and to meet
its responsibilities to all stakeholders, including customers,
employees, vendors and shareholders.
Li & Fung has maintained strong credit ratings from Moody’s
and Standard & Poor’s, at A3 (stable ) and A- (stable )
respectively. The Group continues to enjoy healthy cash flow
and has strong credit ratios. For details, please refer to the
following “Financial Position and Liquidity” section.
PEOPLEAs of the end of 2011, the Group had a total workforce of
29,624, of whom 4,518 were based in Hong Kong and 25,106
were located overseas and in mainland China.
At Li & Fung we recognized that our asset base resides in the
talent, enterprise and creativity of our people. We believe that
investing in our people is about investing in the future and our
goal is to inspire people and build a culture and environment in
which they can grow and succeed.
20 LI & FUNG LIMITED | ANNUAL REPORT 2011
MANAGEMENT DISCUSSION & ANALYSIS (CONTINUED)
and Hong Kong and to helping a community conserve water in
Guatemala. In 2011, over 6,000 of our employees volunteered
over 3,800 hours to support over 100 environmental and
social initiatives around the world. Our global employees also
raised over US$1.7 million to support communities, with the
LF Foundation providing over US$1.4 million to further support
some of these projects.
Going forward, we will continue to expand our activities in our
communities around the world and develop an approach for
assessing the impacts of our engagement.
Total manpower costs for 2011 were US$1,227 mil l ion,
compared with US$793 million for 2010.
CHANGE IN FUNCTIONAL AND PRESENTATION CURRENCIESIn prior years, the Company regarded Hong Kong dollar (“HK
dollar”) as its functional currency. However, as a result of the
Group’s continuous overseas acquisitions in recent years, the
Company and most of its major operating subsidiaries’ business
transactions in terms of operating, investing and financing
activities have increasingly placed greater reliance on US dollar.
As such, effective from 1 January 2011, the Company and
certain subsidiaries have changed their functional currency from
HK dollar to US dollar. US dollar has also been adopted as the
presentation currency of the Group’s annual financial report.
The Group’s businesses as well as interests of its stakeholders
are becoming more globalized and the change in presentation
currency to US dol lar wi l l result in a more appropr iate
presentation of the Group’s financial position and performance.
The comparative figures in this announcement are translated
accordingly. The changes in functional and presentation
currencies have no significant impact on the financial positions
of the Group as at 1 January 2010, 31 December 2010 and
2011, or the results and cash flows of the Group for years
ended 31 December 2010 and 2011.
To support the ongoing promotion of health and safety in our
workplaces, we launched a series of Environmental, Health and
Safety (EHS) initiatives in our distribution centers worldwide. We
also provide training to our employees globally and regularly
conduct internal EHS audits to ensure compliance in our
operations and to strive for continual improvement.
In November 2011, we launched our human rights statement
on our website and implemented an internal awareness-raising
program. The statement reinforces that since the founding of Li
& Fung, respect for human rights has always been at the core
of our beliefs and embedded in the way we do business. We
have formalized these principles into group policies and codes
that foster a respect for human rights amongst our employees
and business partners.
LEARNING AND DEVELOPMENT
Our learning and development programs aim to strengthen core
functional and management capabilities of our people through
a variety of structured training programs, peer-to-peer learning,
mentoring, on-the-job training, e-learning modules, and others.
In 2011, we had a record of over 36,000 employee visits to
access our online learning tools and over 19,025 participants
attended formal learning classes or took part in e-learning.
Learning initiatives focused on strengthening core functional
and management capabilities of our people. Additional talent
development programs focused on key transition points in the
careers of our employees.
COMMUNITY ENGAGEMENT
Contributing to our communities is important to our employees
around the wor ld. This year we supported a var iety of
initiatives, ranging from: donations to assist victims of the
tsunami in Japan, flooding in Bangkok and India, typhoons in
the Philippines, and cold weather in Bangladesh and India; to
supporting children and elderly in need globally; and to cleaning
beaches and/or planting trees in the Philippines, Cambodia

21LI & FUNG LIMITED | ANNUAL REPORT 2011
MANAGEMENT DISCUSSION & ANALYSIS (CONTINUED)
At balance sheet date, the Group’s gearing ratio was 21%,
calculated as net debt divided by total capital. Net debt of
US$1,047 million was calculated as total borrowings (i.e. the
aggregate of long-term bonds and bank loans of US$1,473
million) less cash and cash equivalents of US$426 million. Total
capital was calculated as total equity of US$3,939 million plus
net debt. The current ratio was 1.1, based on current assets of
US$3,952 million and current liabilities of US$3,665 million.
FINANCIAL POSITION AND LIQUIDITYThe Group continued to be in a strong financial position
for the year under review with cash and cash equivalents
amounting to US$426 million as of the end of December 2011.
Normal trading operations were well supported by more than
US$2.5 billion in bank trading facilities. In addition, the Group
had available bank loans and overdraft facilities of US$1,182
million, out of which US$484 million were committed facilities.
As of 31 December 2011, only US$218 million of the Group’s
bank loan and overdraft facilities was drawn down, out of which
utilization of committed facilities was US$145 million.
OPERATING CASH INFLOW
US$ million
11100908
459
866
745
947
0
200
400
600
800
1,000
3-YEAR PLAN
1st Year
CURRENT RATIO
11100908
1.2 1.2 1.21.1
0.0
0.2
0.4
0.6
0.8
1.0
1.2
3-YEAR PLAN
1st Year

22 LI & FUNG LIMITED | ANNUAL REPORT 2011
MANAGEMENT DISCUSSION & ANALYSIS (CONTINUED)
CAPITAL COMMITMENTS AND CONTINGENT LIABILITIESAs of the date of this annual report, the Group has disputes
with Hong Kong Inland Revenue (“HKIR”) involving additional tax
assessments amounting to approximately US$247 million on
both the non-taxable claim of certain non-Hong Kong sourced
income (“Offshore Claim”) and the deduction claim of marketing
expenses (“Deduction Claim”) for the years of assessment
from1992/1993 to 2010/2011.
The Commissioner of the HKIR issued a determination on
14 June 2004 to one of our subsidiaries, Li & Fung (Trading)
Limited (“LFT”), confirming additional tax assessments totalling
US$43 million relating to the years of assessment from 1992/93
to 2001/02. Based upon professional advice then obtained, the
directors believed that the Group had meritorious defence to
appeal against the Commissioner’s determination. Accordingly,
LFT lodged a notice of appeal to the Board of Review on
13 July 2004. The appeal was heard before the Board of
Review in January 2006.
The Board of Review issued its decision on 12 June 2009 (“the
Board of Review Decision”) and held partially in favour of LFT.
It agreed that the Offshore Claim for the years of assessment
from 1992/93 to 2001/02 is valid. In other words, the relevant
assessments in respect of such Offshore Claim should be
annulled. On the other hand, the Board of Review disagreed
with the Deduction Claim for the years of assessment from
1992/93 to 2001/02. Therefore, the relevant assessments in
respect of such Deduction Claim should be confirmed.
The Group considered the reasoning of the Board of Review
Decision and, having obtained professional advice, decided
to lodge an appeal against the Board of Review Decision in
respect of the Deduction Claim.
On the other hand, the HKIR also lodged an appeal against the
Board of Review Decision in respect of the Offshore Claim.
CREDIT RISK MANAGEMENTCredit risk mainly arises from trade and other receivables.
The Group has stringent policies in place to manage its credit
risk with trade and other receivables, which include but are not
limited to the measures set out below:
(i) A significant portion of business is secured by back-to-back
payment arrangement with vendors or covered by letters of
credit, customers’ standby letters of credit, bank guarantees
or credit insurance;
(ii) Certain trade receivable balances on open account term are
factored to external financial institutions without recourse;
(iii) The Group’s credit control team makes an ongoing
assessment of each counter party and determines the
credit limits based on, among other factors, their trading
and settlement history as well as their respective financial
background.
FOREIGN EXCHANGE RISK MANAGEMENTMost of the Group’s cash balances were deposits in HK$ and
US$ with major global financial institutions, and most of the
Group’s assets, liabilities, revenues and payments were held
in either HK$ or US$. Therefore, we consider that the risk
exposure to foreign exchange rate fluctuations is minimal.
Foreign exchange risks arising from sales and purchases
transacted in different currencies are managed by the Group
treasury through the use of foreign exchange forward contracts.
Pursuant to the Group policy in place, foreign exchange forward
contracts, or any other financial derivatives, are entered into by
the Group for hedging purposes. The Group has not entered
into any financial derivatives for speculation.

23LI & FUNG LIMITED | ANNUAL REPORT 2011
MANAGEMENT DISCUSSION & ANALYSIS (CONTINUED)
case before the Board of Review and now the Court of Appeal
only applies to the additional tax assessments in respect of
LFT for the years of assessment from 1992/93 to 2001/02. The
Group’s dispute with the HKIR regarding the remaining additional
tax assessments in respect of certain other subsidiaries for the
years of assessment from 1992/93 to 2001/02, and in respect
of the Group for the period after the 2001/02 assessment years,
is ongoing and has not yet been determined. It is therefore not
yet before the Board of Review, and no hearing is currently
scheduled.
Based on the assessment of the Group’s legal counsel on
the merits of LFT’s further appeal in respect of the Deduction
Claim and the HKIR’s further appeal in respect of the Offshore
Claim (which has now been dismissed by the Court of Appeal),
and having taken into account the impact and ramification that
the Board of Review Decision has on the tax affairs of LFT,
the directors consider that no material tax liabilities will finally
crystallize and sufficient tax provision has been made in the
accounts in this regard.
On 11 June 2010, the Group also applied for a judicial review
of the decision of the Commissioner of the HKIR rejecting
LFT’s application for an unconditional holdover of tax for the
year of assessment 2008/09 pending the determination of the
objection lodged with the HKIR. The Group purchased tax
reserve certificates in respect of LFT for the year of assessment
2008/09 as directed by the Commissioner of the HKIR pending
the decision of the judicial review application. As of the date
of this annual report, the hearing date for the judicial review
application is yet to be fixed.
Other than the above, there are no material capital commitments,
contingent liabilities or off-balance sheet obligations.
On 19 March 2010, the Board of Review stated a case on
questions of law in respect of both LFT’s appeal on the
Deduction Claim, and the HKIR’s appeal on the Offshore Claim.
On 1 April 2010, both LFT and the HKIR transmitted the stated
case to the High Court for determination.
The appeal by the HKIR in respect of the Board of Review
Decision on the Offshore Claim was dismissed by the Court
of First Instance on 18 April 2011, which upheld the Board of
Review Decision. LFT was also awarded costs of the appeal.
On 16 May 2011, the HKIR lodged an appeal against the
judgment of the Court of First Instance to the Court of Appeal,
which appeal was heard by the Court of Appeal on 14 and 15
February 2012. On 19 March 2012, the Court of Appeal has
delivered its judgment. It has upheld the judgment of the Court
of First Instance, and dismissed the HKIR’s appeal. Any appeal
against the judgment of the Court of Appeal to the Court of
Final Appeal will require permission of the Court of Appeal or
the Court of Final Appeal. The HKIR has until 16 April 2012 to
apply for such permission to appeal.
As regards LFT’s appeal on the Deduction Claim, upon the
consent of the parties, the Court of First Instance has remitted
the case stated to the Board of Review and directed it to make
further findings of fact and to determine certain issues. As of the
date of this annual report, further directions/decisions from the
Board of Review are awaited.
The Group has also filed objections with the HKIR against the
remaining additional tax assessments of US$204 million. The

CORPORATE GOVERNANCE
24 LI & FUNG LIMITED | ANNUAL REPORT 2011
THEBOARD
NOMINATIONCOMMITTEE
REMUNERATIONCOMMITTEE
MANAGEMENT
CORPORATEGOVERNANCE &
COMPLIANCE
AUDITCOMMITTEE
RISKMANAGEMENT AND
COMMITTEE
SHAREHOLDERS
Independent Non-executive Directors
Non-executive Director
Executive Directors
BOARD COMPOSITION
2009 40%50% 10%
SUBSTAINABILITY
2010 33%56% 11%
2011 30%50% 20%
Non-executive Directors and one Non-executive Director. The
Board considers this composition to be more balanced and to
reinforce a stronger independent review and monitoring function
on overall management practices. Directors’ biographical details
and relevant relationships are set out in the Directors and Senior
Management section on pages 46 to 51.
The Board of Directors and management are committed to
principles of good corporate governance consistent with
prudent management and enhancement of shareholder value.
These principles emphasize transparency, accountability and
independence. Set out below are those principles of corporate
governance as adopted by the Company.
THE BOARD
BOARD COMPOSITION
Following the retirement of an Independent Non-executive
Director at 2011 Annual General Meeting, the appointment of
a Non-executive Director and an Independent Non-executive
Director in February 2011 and November 2011 respectively,
the Board is currently composed of the Group Non-executive
Chairman, Executive Deputy Chairman, Group President and
Chief Executive Officer, one Executive Director, five Independent

25LI & FUNG LIMITED | ANNUAL REPORT 2011
CORPORATE GOVERNANCE (CONTINUED)
GROUP CHAIRMAN AND EXECUTIVE DEPUTY CHAIRMAN
The role of the Group Chairman is separate from that of the
Group Managing Director who was designated as Executive
Deputy Chairman on 18 May 2011. This is to enhance their
respective independence, accountability and responsibility. Their
respective responsibilities are clearly established and defined in
writing by the Board.
Group Chairman • responsible for ensuring that the Board is
functioning properly, with good corporate
governance practices and procedures.
Executive Deputy
Chairman
• responsible for managing the Group’s
business, including the implementation of
major strategies and initiatives adopted
by the Board with the support f rom
other Executive Directors and Senior
Management, and within those authorities
delegated by the Board.
ROLES AND RESPONSIBILITIES OF THE BOARD
The Board is responsible for setting up the overall strategy as
well as reviewing the operation and financial performance of
the Group. The Board reserved for its decision or consideration
matters covering overall Group strategy, major acquisitions
and disposals, annual budgets, annual and interim results,
recommendations on Directors’ appointment or reappointment,
approval of major capital transactions and other significant
operational and financial matters.
The Non-execu t i ve D i rec to rs (ma jo r i t y o f whom a re
independent), who combine to offer diverse industry expertise,
serve the important function of advising the management on
strategy and ensuring that the Board maintains high standards
of financial and other mandatory reporting requirements as well
as providing adequate checks and balances for safeguarding
the interests of shareholders and the Company as a whole.
DELEGATION TO MANAGEMENT
Day-to-day operational responsibilities are specifically delegated
by the Board to management. Major matters include:
• the preparation of annual and interim accounts for Board
approval before public reporting;
• execution of business strategies and initiatives adopted by
the Board;
• monitoring of operating budgets adopted by the Board;
• implementation of adequate systems of risk management
and internal control procedures; and
• compliance with relevant statutory requirements, rules and
regulations.
BOARD AND COMMITTEE MEETINGS
Board meetings are scheduled one year in advance to facilitate
maximum attendance by Directors. The meeting agenda is
set by the Group Non-executive Chairman in consultation with
members of the Board. Senior Management is usually invited
to join Board meetings to enhance the Board and management
communication. External auditor attended the Company’s 2011
Annual General Meeting to answer any questions from the
shareholders on the audit of the Company.

26 LI & FUNG LIMITED | ANNUAL REPORT 2011
CORPORATE GOVERNANCE (CONTINUED)
In 2011, the Board held four physical meetings and six phone conferences (with an average attendance rate of 90%). A summary of
Board and Committee meetings in 2011 is set out in the following table:
BOARD AND COMMITTEE MEETINGS FOR YEAR 2011
BoardNominationCommittee
AuditCommittee
RiskManagement
and Sustainability
CommitteeRemuneration
Committee
AnnualGeneralMeeting
Non-executive DirectorsDr Victor FUNG Kwok King1
Mr Benedict CHANG Yew Teck – appointed on 1 February 2011
Independent Non-executive DirectorsMr Paul Edward SELWAY-SWIFT2
Mr Allan WONG Chi Yun3
Professor Franklin Warren McFARLANMr Makoto YASUDA
– retired on 18 May 2011Mr Martin TANG Yue NienDr FU Yuning
– appointed on 1 November 2011
Executive DirectorsDr William FUNG Kwok Lun4
Mr Bruce Philip ROCKOWITZ5
Mr Spencer Theodore FUNG Group Chief Compliance OfficerMr James SIU Kai Lau
– retired on 1 October 2011 6 6 6 6
Mr Srinivasan PARTHASARATHY – appointed on 1 October 2011
6 6 6
Dates of meeting 11/01/2011 7 18/05/2011 24/03/2011 17/02/2011 24/03/2011 18/05/2011
24/03/2011 10/08/2011 18/05/2011 13/04/2011 18/05/201111/04/2011 7 10/08/2011 01/08/2011 21/11/201118/05/2011 21/11/2011 07/11/201129/06/2011 7
14/07/2011 7
11/08/201122/09/2011 7
21/11/201122/12/2011 7
1: Chairman of the Board, and Chairman of Risk Management and Sustainability Committee. Retired as Chairman of Nomination Committee on 11 August 2011 and remains as Committee member
2: Chairman of Audit Committee, and appointed as Chairman of Nomination Committee on 11 August 20113: Chairman of Remuneration Committee4: Became Executive Deputy Chairman on 18 May 20115: Appointed as Group President and Chief Executive Officer on 18 May 20116: Invited to attend Board and Committee meetings as a non-member7: Held by phone conference
MEETINGS ATTENDED MEETINGS UNATTENDED

27LI & FUNG LIMITED | ANNUAL REPORT 2011
CORPORATE GOVERNANCE (CONTINUED)
INDEPENDENCE OF NON-EXECUTIVE DIRECTORS
The Board has received from each Independent Non-executive
Director a written annual confirmation of their independence
and satisfied that independence up to the approval date of this
report. The assessment of the independence of Independent
Non-executive Director, which is on no less exacting terms than
those set out in Chapter 3 of the Listing Rules of the Exchange, is
delegated by the Board to the Nomination Committee.
Each Independent Non-executive Director is required to inform
the Company as soon as practicable if there is any change that
may affect his independence.
APPOINTMENT AND RE-ELECTION OF THE DIRECTORS
The appointment of a new director must be approved by the
Board. The Board has delegated to the Nomination Committee
to select and recommend candidates for directorship including
the consideration of referrals and engagement of external
recruitment professionals when necessary. The Nomination
Committee has established certain guidelines to assess
the candidates. These guidelines emphasize appropriate
professional knowledge and industry experience, personal
ethics, integr i ty and personal ski l ls, and possible t ime
commitments to the Board and the Company.
Under the Company’s bye-laws, one-third of the Directors, who
have served longest on the Board, must retire, thus becoming
eligible for re-election at each Annual General Meeting. As such,
no Director has a term of appointment longer than three years.
To further reinforce accountability, any further reappointment
of an Independent Non-executive Director who has served the
Company’s Board for more than nine years will be subject to
separate resolution to be approved by shareholders.
INDUCTION, INFORMATION AND ONGOING
DEVELOPMENT
All Directors were kept informed on a timely basis of major
changes that may have affected the Group’s businesses,
including relevant rules and regulations. In addition, the Group
has implemented a continuing programme since 2003 to update
the Directors (in particular Independent Non-executive Directors)
on the macro economics and business environment relevant
to the Group’s major operations. Overseas Board Meetings
coupled with office briefings and a tour by the management of
our overseas offices had been regularly conducted since 2004.
In addition to the above, each newly-appointed Director
received a tailored induction programme, which covers briefing
on the Company’s overview by the Group Chairman, meeting
with management and meeting with the Company’s external
legal adviser on directors’ legal role and responsibilities.
To further maximize the contribution from non-management
Directors, a separate meeting between the Group Chairman
and Independent Non-execut ive Directors was held in
May 2011 to address business and related issues. Written
procedures are also in place for Directors to seek independent
professional advice in performing their Directors’ duties at the
Company’s expense. No request was made by any Director for
such independent professional advice in 2011.
INDEPENDENT REPORTING OF CORPORATE
GOVERNANCE MATTERS
The Board recognizes the importance of independent reporting
of the corporate governance matters of the Company. The
Group Chief Compliance Officer, as appointed by the Board,
was invited to attend Board and committee meetings in
2011 to advise on corporate governance matters covering
risk management and relevant compliance issues relating to
business operations, mergers and acquisitions, accounting and
financial reporting.
28 LI & FUNG LIMITED | ANNUAL REPORT 2011
CORPORATE GOVERNANCE (CONTINUED)
LIABILITY INSURANCE FOR THE DIRECTORS
The Company has arranged for appropriate liability insurance
since 2002 to indemnify its Directors for their liabilities arising
out of corporate management activities. The insurance coverage
is reviewed with advice from external consultant on an annual
basis.
BOARD COMMITTEESThe Board has established the following committees (all chaired
by Independent Non-executive Director or Non-executive
Director) with defined terms of reference, which are on no less
exacting terms than those set out in the Code on Corporate
Governance Practices of the Listing Rules:
• Nomination Committee
• Audit Committee
• Risk Management and Sustainability Committee
• Remuneration Committee
Each Committee has authority to engage outside consultants or
experts as it considers necessary to discharge the Committee’s
responsibil it ies. Minutes of al l committees meetings are
c i rcu lated to a l l Board members. To fur ther re in force
independence and effectiveness, all Audit Committee members
are Independent Non-executive Directors, and the Nomination
and Remuneration Committees have been structured with a
majority of Independent Non-executive Directors as members
since 2003. Details and reports of the Committees are set out
below.
NOMINATION COMMITTEEThe Nomination Committee was established in August 2001.
To further reinforce independence, the Committee was
restructured to be chaired by an Independent Non-executive
Director since August 2011. Its written terms of reference
cover recommendations to the Board on the appointment of
Directors, evaluation of board composition, assessment of the
independence of Independent Non-executive Directors and the
management of board succession.
The Committee met twice in 2011 (with a 100% attendance
rate) to review the board composition, the nomination of
directors to fill board vacancies in 2011 and the retirement of
directors by rotation.
AUDIT COMMITTEEThe Audit Committee was established in 1998 to review the
Group’s financial reporting, internal controls and corporate
governance issues and make relevant recommendations to the
Board. The Committee has been chaired by an Independent
Non-executive Director since 2003 and all Committee members
are Independent Non-executive Directors. All Committee
members possess appropriate professional qualifications,
accounting or related financial management expertise as
required under the Listing Rules.
The Audi t Commit tee met four t imes in 2011 (wi th a
100% attendance rate) to review with management and
the Company’s internal and external auditors, the Group’s
significant internal controls and financial matters as set out in
the Committee’s written terms of reference and make relevant
recommendations to the Board.
In 2011, the Committee’s review covers the audit plans and
findings of internal and external auditors, external auditor’s
independence and performance, the Group’s accounting
principles and practices, goodwill assessment, listing rules and
statutory compliance, connected transactions, internal controls,
risk management, treasury, financial reporting matters (including
the interim and annual financial reports for the Board’s approval)
and the adequacy of resources, qualifications and experience
of staff of the Company’s accounting and financial reporting
function as well as their training programmes and budget.

29LI & FUNG LIMITED | ANNUAL REPORT 2011
CORPORATE GOVERNANCE (CONTINUED)
A policy on provision of non-audit services by the
external auditor has been established since 2004. Under
this policy, certain specified non-audit services are prohibited.
Other non-audit services require prior approval of the Audit
Committee if the fee exceeds certain pre-set thresholds. These
permitted non-audit services may be engaged only if they are
more effective or economical than those available from other
service providers and will not constitute adverse impact on
the independence of the external auditor. In 2011, the external
auditor provided permitted non-audit services mainly in due
diligence review on acquisitions and tax compliance services.
The nature and ratio of annual fees to external auditor for
non-audit services and for audit services in 2011 have been
scrutinized by the Audit Committee (refer to details of fees to
auditor in Note 4 to the accounts on page 97).
In addition, the external audit engagement partner is
subject to periodical rotation of not more than 7 years.
Also, the Company has enforced a policy restricting
the employment of employees or former employees
of external auditor , within 12 months preceding their
employment by the external auditors, as senior executive and at
senior internal audit or financial positions with the Group.
Prior to the commencement of the audit of 2011 accounts of
the Company, the Committee received written confirmation
from the external auditor on its independence and
objectivity as required by the Hong Kong Institute of Certified
Public Accountants.
Members of the Committee have been satisfied with the findings
of their review of the audit fees, process and effectiveness,
independence and objectivity of PricewaterhouseCoopers (PwC)
as the Company’s external auditor, and the Committee has
recommended to the Board the reappointment of PwC in 2012
as the Company’s external auditor at the forthcoming Annual
General Meeting.
Fol lowing international best practices, the Committee
conducted a self-review of its effectiveness in 2011
by going through a detailed audit committee best practices
checklist as against the Committee’s current practices. Similar
self-assessment exercises were conducted every two years
since 2005. Based on the results of these assessments, the
Committee believes it is functioning effectively but further
enhancements and changes in practice are to be made.
The Committee also ensures that proper whistle-blowing
arrangements are in place by which employees can report
any concerns, including misconduct, impropriety or fraud
in financial reporting matters and accounting practices, in
confidence and without fear of recrimination for fair and
independent investigation of such matters and for appropriate
follow-up action. Under the Group’s Policy on Reporting of
Concerns, employees can report these concerns to either
Senior Management or the Audit Committee through the Group
Chief Compliance Officer. Any shareholders or stakeholders
can also report similar concerns by writing in confidence
to our Group Chief Compliance Officer at the Company’s
business address in Hong Kong. In 2011, no incident of fraud
or misconduct was reported from employees, shareholders
or stakeholders that have a material effect on the Company’s
accounts and overall operations.
EXTERNAL AUDITOR’S INDEPENDENCE
In order to further enhance independent reporting by the
external auditor, part of our Audit Committee meetings were
attended only by the Committee and external auditor. The
Committee also has unrestricted access to external auditor as
necessary.

30 LI & FUNG LIMITED | ANNUAL REPORT 2011
CORPORATE GOVERNANCE (CONTINUED)
REMUNERATION POLICY FOR EXECUTIVE DIRECTORS AND SENIOR MANAGEMENTThe primary goal of the remuneration policy on executive
remuneration packages is to enable Li & Fung to motivate
Executive Directors and Senior Management by linking their
compensation to performance with reference to corporate and
operating groups’ objectives. Under the policy, a Director or a
member of Senior Management is not allowed to approve his
own remuneration.
The principal elements of Li & Fung’s executive remuneration
package include:
• basic salary;
• discretionary bonus without capping; and
• share options granted under a shareholders’ approved
option scheme.
In determining guidelines for each compensation element, Li &
Fung refers to remuneration surveys conducted by independent
external consultants on companies operating in similar industry
and scale.
BASIC SALARY
All Executive Directors’ and Senior Management’s remuneration
packages including their basic salary were approved by
Remuneration Committee at the beginning of the Group’s
Three-Year Plan 2011–2013. Under the service contracts
between the Group and Executive Deputy Chairman as
disclosed under Directors’ Service Contracts section on page
59, Executive Deputy Chairman is entitled to a fixed basic salary
which is subject to review by the Committee.
RISK MANAGEMENT AND SUSTAINABILITY COMMITTEEThe Risk Management Committee was re-named as the Risk
Management and Sustainability Committee on 24 March 2011.
It was established in August 2001 and is chaired by the Group
Non-executive Chairman. Its written terms of reference include
offering recommendations to the Board on the Group’s risk
management and internal control systems, and had been
further updated in 2011 to authorize the Committee to review
the Group’s practices and strategies on corporate responsibility
and sustainability. The Committee reports to the Board in
conjunction with the Audit Committee.
The Risk Management and Sustainability Committee met four
times in 2011 (with an average attendance rate of 89%) to
review risk management procedures pertinent to the Group’s
significant investments and operations. The scope of review
covers receivables management, credit risk management,
inventory management, goodwill assessment, tax compliance
issues, litigation exposures, acquisitions and integration, other
operational and financial risk management as well as corporate
responsibility and sustainability.
REMUNERATION COMMITTEEThe Compensa t ion Commi t tee was renamed as the
Remuneration Committee on 22 March 2012. It was formed in
1993 and is chaired by an Independent Non-executive Director.
The Committee’s responsibilities as set out in its written terms
of reference include approving the remuneration policy for all
Directors and senior executives, and the grant of share options
to employees under the Company’s Share Option Scheme. It
annually reviews the Group’s remuneration policy.
The Committee met three times in 2011 (with a 100%
attendance rate) to review and approve all Executive Directors’
and Senior Management’s remuneration packages and the
grant of share options under the Three-Year Plan 2011–2013.
Details of Directors’ and Senior Management’s emoluments of
the Company are set out in Note 11 to the accounts on pages
101 to 104.
31LI & FUNG LIMITED | ANNUAL REPORT 2011
CORPORATE GOVERNANCE (CONTINUED)
Reimbursement is allowed for out-of-pocket expenses incurred
in connection with the performance of their duties including
attendance at Company meetings.
RISK MANAGEMENT AND INTERNAL CONTROLThe Board is responsible for maintaining a sound and effective
system of risk management and internal controls in Li & Fung
and for reviewing its effectiveness. Such system is designed
to manage the risk of failure to achieve corporate objectives. It
aims to provide reasonable but not absolute assurance against
material misstatement, loss or fraud.
The Board has delegated to executive management the design,
implementation and ongoing assessment of such systems of
internal controls, while the Board through its Audit Committee
oversees and reviews the adequacy and effectiveness of
relevant financial, operational and compliance controls and risk
management procedures that have been in place. Qualified
personnel throughout the Group maintain and monitor these
systems of controls on an ongoing basis. Set out below are the
main characteristics of our risk management and internal control
framework.
DISCRETIONARY BONUS
Li & Fung implements a performance-based discretionary
bonus scheme for each Executive Director (excluding
Executive Deputy Chairman) and Senior Management. Under
this scheme, the computation of discretionary bonus (without
capping) is based on measurable performance contributions of
operating groups headed by the respective Executive Directors
and Senior Management. Executive Deputy Chairman is entitled
to a profit share of the Company’s consolidated results after
adjustment of interest, tax and minority interests under the
above service contracts between the Group and Executive
Deputy Chairman.
SHARE OPTIONS
The Remuneration Committee approves all grants of share
options under the shareholders’ approved share option scheme
to Executive Directors and Senior Management, with regard
to their individual performances and achievement of business
targets in accordance with the Company’s objectives of
maximizing long-term shareholder value.
REMUNERATION POLICY FOR NON-EXECUTIVE DIRECTORSThe remuneration, comprising Directors’ fees, of Non-executive
Directors is subject to annual assessment with reference to
remuneration surveys conducted by independent external
consultants and a recommendation by the Remuneration
Committee for shareholders’ approval at the Annual General
Meeting.
32 LI & FUNG LIMITED | ANNUAL REPORT 2011
CORPORATE GOVERNANCE (CONTINUED)
and management reporting, human resources functions and
computer systems. All these controls are supplemented with
written policies and Key Operating Guidelines (KOG) tailored to
the need of respective operating groups in the countries where
the Group operates. These policies and KOG cover key risk
management and control standards for the Group’s operation
worldwide.
FINANCIAL AND CAPITAL RISK MANAGEMENT
The Board approves the Group’s Three-Year financial budgets
2011–2013 and reviews the Group’s operating and financial
performance and key performance indicators against the
budget on a semi-annual basis. Executive management
closely monitors actual financial performance at the Group and
operating group levels on a quarterly and monthly basis.
CONTROL ENVIRONMENT
The Group operates within an established control environment,
which is consistent with the principles outlined in Internal
Control and Risk Management – A Basic Framework issued by
the Hong Kong Institute of Certified Public Accountants. The
scope of internal control for the Group relates to three major
areas: effectiveness and efficiency of operations; reliability of
financial reporting; and compliance with applicable laws and
regulations.
The Group maintains a tailored governance structure with
defined lines of responsibility and appropriate delegation
of authority. This is characterized by the establishment of
an Operation Support Group centralizing the function and
control exercised over global treasury activities, financial
CO
RPO
RATE INITIATIVES & SUSTAINABLE GRO
WTH
PERFORMANCE & COMPLIANCE
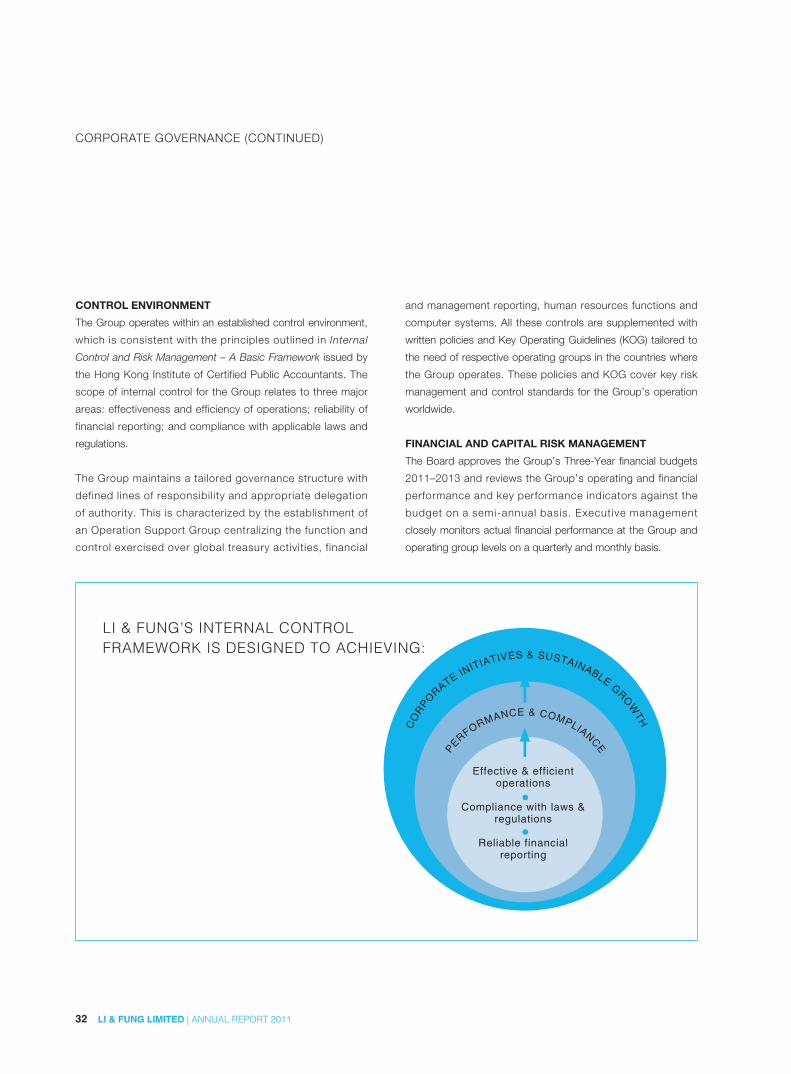
LI & FUNG’S INTERNAL CONTROL FRAMEWORK IS DESIGNED TO ACHIEVING:
Effective & efficient operations
Compliance with laws & regulations
Reliable financial reporting
33LI & FUNG LIMITED | ANNUAL REPORT 2011
CORPORATE GOVERNANCE (CONTINUED)
Group-wide insurance, human resources, contingency
and disaster recovery, IT governance structure, corporate
responsibility and sustainability.
INTERNAL AND EXTERNAL AUDIT
Internal Audit
The Group’s Internal Audit team within the Corporate
Governance Division (CGD), under the supervision of the
Group Chief Compliance Officer, independently reviews the
internal controls and evaluates their adequacy, effectiveness
and compliance. Our Group Chief Compliance Officer reports
all major findings and recommendations to the Audit
Committee on a regular basis.
The three-year Internal Audit Plan 2011–2013 of CGD is
strategically linked to the Group’s Three-Year Plan and was
reviewed and endorsed by the Audit committee. The principal
features of the tasks of CGD include:
• Interna l Audi t p lan as prepared under a r isk based
assessment methodology that covers the Group’s significant
operations over a three-year cycle period;
• An audit scope which covers significant controls including
financial, operational and compliance controls, and risk
management policies and procedures;
• Unrestricted access to all the information needed for review
of all operations, controls and compliance with KOG and
corporate policies, rules and regulations;
• Review on the special areas of concerns or risks as raised
by Audit Committee, Risk Management and Sustainability
Committee or Senior Management.
Major audit findings and recommendations from CGD, and
management response to their findings and recommendations
are presented at the Audi t Commit tee meet ings. The
implementation of al l recommendations as agreed with
management is being followed up on a three-month basis and
reported to the Audit Committee at each Committee meeting.
The Group adopts a principle of minimizing financial and
capital risks. Details of the Group’s financial and capital risk
management covering market risk (including foreign exchange
risk, price risk, cash flow and fair value interest rate risk), credit
risk and liquidity risk are set out in Notes 36 and 37 to the
accounts on pages 143 to 146.
INVESTMENT MANAGEMENT
The Group Investment Committee (comprising the Group
Non-executive Chairman, Executive Directors and Senior
Management) develops investment control procedures, monitor
and approve the Group’s major investments and acquisitions.
Significant investments and acquisitions (with consideration
above a threshold as pre-set by the Board) also require Board’s
approval.
Management also monitors the integration process of the newly
acquired companies through a structured post-acquisition
integration program focusing on the alignment of operational
and financial controls with the Group’s standards and practices.
Any significant integration issues have to be reported to Risk
Management and Sustainability Committee.
REGULATORY COMPLIANCE CONTROL MANAGEMENT
The Corporate Compliance Group (comprising Corporate
Governance Division and Corporate Secretarial Division),
under the supervision of the Group Chief Compliance Officer,
in conjunction with our designated internal and external legal
advisors regularly reviews our adherence to relevant laws
and regulations, listing rules compliance, public disclosure
requirements and our standards of compliance practices.
RISK MANAGEMENT MONITORING
The Risk Management and Sustainabi l i ty Committee in
conjunction with the Audit Committee monitors and updates
the Group’s risk profile and exposure on a regular basis and
reviews the effectiveness of the Group’s system of internal
control in mitigating risks. Key risk areas covered by the
Committees include reputation, business credit, financial and
operational risks of our supply chain operations, investment and
acquisitions, taxation, inventory and receivable management,

34 LI & FUNG LIMITED | ANNUAL REPORT 2011
CORPORATE GOVERNANCE (CONTINUED)
CODE OF CONDUCT AND BUSINESS ETHICSThe Group’s reputation capital is built on its long-established
standards of ethics in conducting business. Guidelines of
the Group’s core business ethical practices as endorsed by
the Board are set out in the Company’s Code of Conduct
and Business Ethics for all Directors and staff. All the
newly-joined staff are briefed and requested to acknowledge
the understanding of the Code. For ease of reference and
as a constant reminder, a copy of the Code is posted in the
Company’s internal electronic portal for reference by all staff.
MARKET RECOGNITIONThe Group’s continuous commitment to excellence and high
standards in corporate governance practices continued
to earn market recognition from stakeholders including
bankers, analysts and institutional investors during our last
Three-Year Plan 2008–2010 and in 2011 in the current Three-
Year Plan 2011–2013. Details of our awards are set out on
page 38 to 39.
DIRECTORS’ AND RELEVANT EMPLOYEES’ SECURITIES TRANSACTIONSThe Group has adopted stringent procedures governing
Directors’ securities transactions in compliance with the Model
Code as set out in Appendix 10 of the Listing Rules. Specific
confirmation has been obtained from each Director to confirm
compliance with the Model Code for 2011. Relevant employees
who are likely to be in possession of unpublished price-sensitive
information of the Group are also subject to compliance with
written guidelines on no less exacting terms than the Model
Code. No incident of non-compliance by Directors was noted
by the Company in 2011.
As part of the annual review of the effect iveness of the
Group’s internal control and r isk management systems
for 2011, management had conducted an Internal Control
Self-Assessment for the business operations and relevant
accounting functions. The Group’s CGD has independently
performed post-assessment review on the findings noted in the
self-assessment programs and considered that sound internal
control practices were in place.
External Audit
Our external auditor, PricewaterhouseCoopers, performs
independent statutory audits on the Group’s accounts. As
part of its audit engagement, our external auditor also reports
to the Audit Committee any significant weaknesses in the
Group’s internal control system which might come to its notice
during the course of audit. PricewaterhouseCoopers noted no
significant internal control weaknesses in its audit for 2011.
OVERALL ASSESSMENT
Based on the respective assessments made by management
and the Group’s CGD and also taking into account the results
of the works conducted by the external auditor for the purpose
of their audit, the Audit Committee considered that for 2011:
• the internal controls and accounting systems of the Group
were in place and functioning effectively and were designed
to provide reasonable assurance that material assets
were protected, business risks attributable to the Group
were identified and monitored, material transactions were
executed in accordance with management’s authorization
and the accounts were reliable for publication.
• there was an ongoing process in place for identifying,
evaluating and managing the significant risks faced by the
Group.
• the resources, qua l i f icat ions, exper ience, t ra in ing
programmes and budget of the staff of the Group’s
accounting and reporting function were adequate.
35LI & FUNG LIMITED | ANNUAL REPORT 2011
CORPORATE GOVERNANCE (CONTINUED)
Specific enquiries by shareholders requiring the Board’s
attention can be sent in writ ing to our Group Company
Secretary at the Company’s business address in Hong Kong.
Other general enquiries can be directed to the Company
through our Group’s Head of Corporate Communications and
Investor Relations, whose contact information is detailed on
page 52.
INVESTOR RELATIONS AND COMMUNICATIONSLi & Fung has a proactive policy for promoting investor relations
and communications by maintaining regular dialogue and fair
disclosure with institutional shareholders, fund managers,
analysts and the media. Management attends investor meetings
on a regular basis and has participated in a number of major
investor conferences in Asia and North America. The Group
is followed by a large number of analysts, and many of them
publish reports on it regularly.
Li & Fung’s corporate website (www.li fung.com ) , which
features a dedicated Investor Relations section, facilitates
effective communication with shareholders, investors and other
stakeholders, making corporate information and other relevant
financial and non-financial information available electronically
and on a timely basis. This includes extensive information about
the Group’s performance and activities via the Annual Report,
Interim Report, press releases and announcements. Webcasts
of presentations for interim and annual results briefings as
well as presentations given by senior management at investor
conferences are also been made available on the corporate
website.
In order to promote better communications with stakeholders,
the Group revamped its corporate website in 2011. With a fresh
look and feel, as well as a host of new, interactive functions, the
website provides easy access to information about Li & Fung. In
June 2011, Li & Fung also conducted an Analyst Day in Hong
Kong, facilitating discussion between analysts and investors and
the Group’s senior management team, including the Executive
Deputy Chairman, the Group’s President and CEO, and nine
Presidents of the major business units. A webcast of the event
was also made available on Li & Fung’s corporate website.
DIRECTORS’ AND SENIOR MANAGEMENT INTERESTSDetails of Directors’ interests in the shares of the Company are
set out in the Report of the Directors section on pages 60 to 62.
The shares held by each member of Senior Management are
less than 2% of the issued share capital of the Company for the
year ended 31 December 2011.
DIRECTORS’ RESPONSIBILITY FOR ACCOUNTS AND AUDITOR’S RESPONSIBILITYThe Directors’ responsibility for preparing the accounts is set
out on page 63, and the auditor’s reporting responsibility is set
out on page 64.
COMPLIANCE WITH THE CODE ON CORPORATE GOVERNANCE PRACTICESThe Board has reviewed the Company’s corporate governance
practices and is satisfied that the Company has been in full
compliance with all of the code provisions set out in the Code
on Corporate Governance Practices contained in Appendix 14
of the Listing Rules throughout the year ended 31 December
2011.
SHAREHOLDERS’ RIGHTSUnder the Company’s bye-laws, in addition to regular Board
meetings, the Board, on the requisition of shareholders of the
Company holding not less than 10% of the paid-up capital
of the Company, can convene a special general meeting to
address specific issues of the Company within 21 days from the
date of deposit of written notice to the registered office of the
Company. The same procedure also applies to any proposal
to be tabled at shareholders’ meetings for adoption. To further
enhance minority shareholders’ rights, the Company has since
2003 adopted the policy of voting by poll for all resolutions
put forward at Annual General Meeting and Special General
Meeting.

36 LI & FUNG LIMITED | ANNUAL REPORT 2011
CORPORATE GOVERNANCE (CONTINUED)
The Group has received widespread acclaim from international
business and financial magazines, which reflects the efforts
it places on effective communications. In 2011, Li & Fung
received a number of recognitions from the wider business
community, including being selected as one of Forbes’ “Global
2000: The World’s Biggest Public Companies” and the Financial
Times’ “FT Global 500”. The Group was also named as having
“Best Investor Relations by an Asia-Pacific company in the US
market” in IR Magazine’s US Awards 2011 as well as “Best
Investor Relations by Hong Kong Company” by Corporate
Governance Asia’s Asian Excellence Recognition Awards 2011,
and it received “The Asset Corporate Platinum Award 2011”
from The Asset magazine.
The Group values feedback from shareholders on its efforts
to promote transparency and foster investor relationships.
Comments and suggestions are welcome, and they can be
addressed to the Group Corporate Communications and
Investor Relations Department by mail or by email to the Group
INFORMATION TECHNOLOGYThe Company continued to demonstrate its commitment to
investments in Information Technology through 2011, with
strategic focus on platforms driving core operations, process
efficiency and information transparency.
SUPPLY CHAIN COLLABORATION
The Vendor Portal remains a key strategic platform and
during 2011 was extended to carriers, freight and banking
processes, as well as integrating the current quality control and
compliance platforms. Leveraging the transactional data from
the Vendor Portal, Vendor Search was rolled out to provide a
comprehensive search tool to assist in the identification and
leverage of the vendor network.
The Group’s Annual General Meeting (AGM) provides another
principal channel for Directors to meet and communicate with
shareholders, who are likewise encouraged to participate.
All shareholders are provided at least 20 clear business
days’ notice to attend the AGM, during which Directors and
Committee Chairmen or members are available to answer
questions. The results of the voting by poll are published on the
Group’s website together with details of the meeting, including
the time, venue and major resolutions.
Li & Fung is aware of its obligations under the Listing Rules,
including the overriding principle that information which is
expected to be price-sensitive should be announced promptly.
Therefore, the Group conducts the handling and dissemination
of such information in accordance with the “Guide on disclosure
of price-sensitive information” issued by Hong Kong Exchanges
and Clearing Limited in 2002. Members of senior management
are identified and authorized to act as spokespersons and
respond to related external enquiries.
The Group’s position in the Hong Kong market as a blue chip
stock with sizeable market capitalization and a high degree of
liquidity is affirmed through the continued inclusion of our stock
in some of the most important benchmark indices. The stock
is a constituent member of the Hang Seng Index, MSCI Index
Series, FTSE4Good Index Series, Dow Jones Sustainability Asia
Pacific Index and Hang Seng Corporate Sustainability Index
Series.
In 2011, the Board confirmed that there were no significant
changes made to Li & Fung’s bye-laws affecting its operations
and reporting practices. Details of the last shareholders’
meeting, key calendar events for shareholders’ attention as well
as share information, including market capitalization as of 31
December 2011, are set out in the “Information for Investors”
section on page 52 and on our corporate website.
37LI & FUNG LIMITED | ANNUAL REPORT 2011
CORPORATE GOVERNANCE (CONTINUED)
Decision Support Systems in the form of the internal dashboard
were enhanced, converting transactional data into relevant,
accurate and timely information accessible online at any
time. During the balance of the Three-Year Plan 2011–2013,
further upgrade and enhancements will be made to support
the growing information needs of the Company’s internal and
external customers.
While the use of IP enabled voice and video platforms continued
to show year on year growth, incremental investments in fixed
network infrastructure were made. The integration of desktop
video with more formal video conference facilities brings the
expanding network of offices into a connected community that
can selectively chose on line technology as opposed to travel.
SERVICE AND INFRASTRUCTURE IMPROVEMENTS
The IT Division of Li & Fung (Trading) Limited was reaccredited
in ISO 9001:2000 certification for quality management, achieved
continuously since 2001.
As part of our cont inuous improvement and End User
Experience Programs, investments were made in areas of
Big Data, Storage, end point management and mobile device
integration, specifically to enable users working out of multiple
offices or on the road seamless and integrated access to the
Company’s systems.
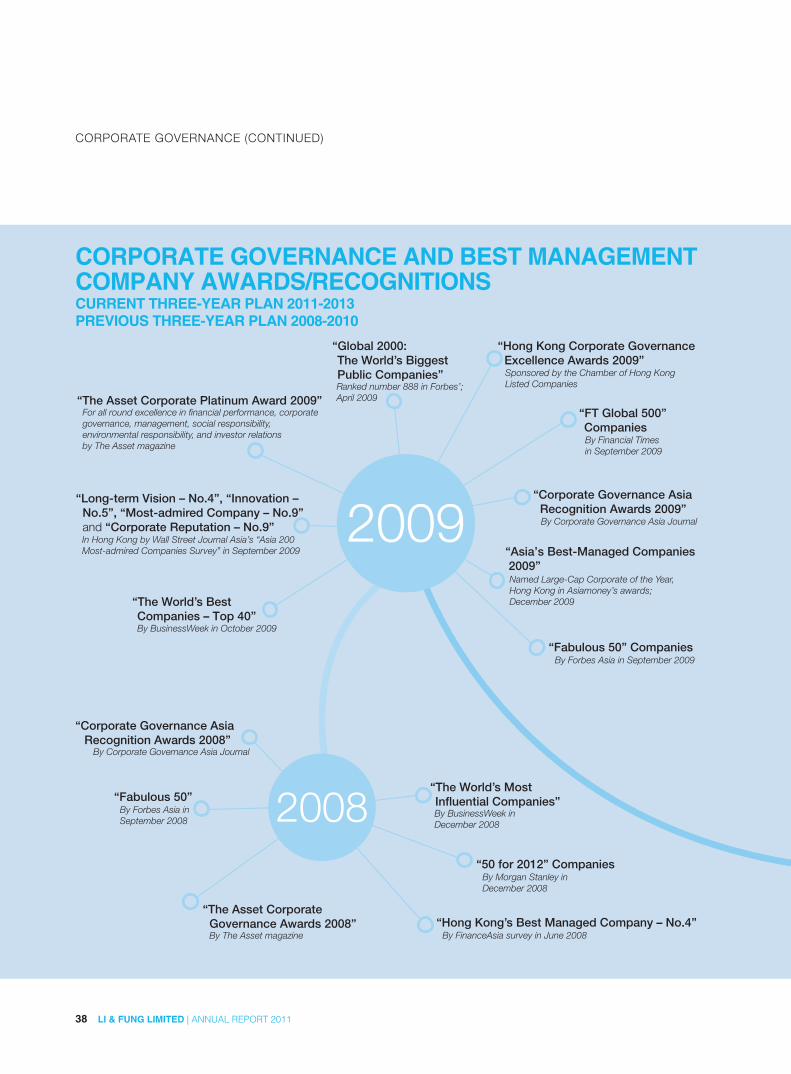
38 LI & FUNG LIMITED | ANNUAL REPORT 2011
CORPORATE GOVERNANCE (CONTINUED)
2008“Fabulous 50”By Forbes Asia inSeptember 2008
“Corporate Governance Asia Recognition Awards 2008”
By Corporate Governance Asia Journal
“The Asset Corporate Governance Awards 2008”
By The Asset magazine“Hong Kong’s Best Managed Company – No.4”
By FinanceAsia survey in June 2008
“The World’s Most Influential Companies”By BusinessWeek in December 2008
“50 for 2012” CompaniesBy Morgan Stanley in December 2008
By Forbes Asia in September 2009
By BusinessWeek in October 2009
For all round excellence in financial performance, corporate governance, management, social responsibility, environmental responsibility, and investor relations by The Asset magazine
“The Asset Corporate Platinum Award 2009”
Sponsored by the Chamber of Hong KongListed Companies
“Hong Kong Corporate Governance Excellence Awards 2009”
In Hong Kong by Wall Street Journal Asia’s “Asia 200 Most-admired Companies Survey” in September 2009
“Long-term Vision – No.4”, “Innovation – No.5”, “Most-admired Company – No.9” and “Corporate Reputation – No.9”
Named Large-Cap Corporate of the Year, Hong Kong in Asiamoney’s awards; December 2009
“Asia’s Best-Managed Companies 2009”
By Corporate Governance Asia Journal
“Corporate Governance Asia Recognition Awards 2009”
“Fabulous 50” Companies
“The World’s Best Companies – Top 40”
By Financial Times in September 2009
“FT Global 500” Companies
Ranked number 888 in Forbes’; April 2009
“Global 2000: The World’s Biggest Public Companies”
2009
CORPORATE GOVERNANCE AND BEST MANAGEMENTCOMPANY AWARDS/RECOGNITIONSCURRENT THREE-YEAR PLAN 2011-2013PREVIOUS THREE-YEAR PLAN 2008-2010

39LI & FUNG LIMITED | ANNUAL REPORT 2011
CORPORATE GOVERNANCE (CONTINUED)
Named Large-Cap Corporate of the Year, Hong Kong in Asiamoney’s awards in December 2010
“Hong Kong Best Managed Company – No. 2” and “Hong Kong Best Corporate Governance – No. 4” By FinanceAsia magazine’s poll
“Asia’s Best-Managed Companies 2010”
By Corporate Governance Asia Journal in 2010
“Corporate Governance Asia Recognition Awards 2010” and “1st Asian Corporate Director Recognition Awards 2010” to Dr. Victor Fung
By Forbes Asia in December 2010 “Fabulous 50” Companies
For all round excellence in financial performance, corporate governance, management, social responsibility, environmental responsibility, and investor relations by The Asset magazine in December 2010
“The Asset Corporate Platinum Award 2010”
By Euromoney’s “Asia best-managed companies” poll in January 2010
“Most convincing and coherent strategy – No. 3” and “Best corporate governance – No. 5” in Hong Kong
Ranked No. 2 in Asia (ex-Japan) and Hong Kong large caps companies in corporate governance ranking surveyed by CLSA and ACGA in September 2010
By Financial Times in 2011“FT Global 500” Companies
Ranked No. 808 in Forbes in 2011“Global 2000” Companies
By Corporate Governance Asia Journal in April 2011
“Corporate Governance Asia Recognition Awards 2011”
For attaining rigorous standards in financial performance, management acumen, corporate governance, social responsibility, environmental responsibility and investor relations by The Asset magazine in December 2011
“The Asset Corporate Platinum Award 2011”
2010
2011
SUSTAINABILITY
40 LI & FUNG LIMITED | ANNUAL REPORT 2011
OVERVIEWIn 2011, we cont inued to bui ld a strong foundation for
sustainability, within our own operations and our supply chain.
Since 2009, we have been implementing our Sustainability
Strategy, which engages our employees, customers, suppliers,
industry partners and communities to address our common
environmental and social challenges. These challenges include:
the risks posed by climate change and resource scarcity on
the environmental side; and on the social side, our aspiration
to support and catalyze economic development and social
progress in the areas in which we operate.
Our people are core to our success and the implementation
of our strategy. To support our people, we have policies,
programs and partnerships, as well as a system to track and
deliver results that are meaningful to our business. As we
reported in 2010, our strategy integrates actions that aim to
improve the sustainability of our own operations and facilities
and of our global supply chain. These actions range from
social and environmental risk assessment and due diligence
during the investment/acquisition process as we expand our
business, to implementing management systems and checking
and reporting on our performance, and to working with our
customers, suppliers and industry partners to continually
upgrade the sustainability of our supply chain.
In 2011, we updated our standards by revising our Code of
Conduct for Suppliers and our Supplier Compliance Manual.
The launch of these standards establishes our new approach
towards sustainable compliance by providing a transparent
framework for us to work with our customers and suppliers to
improve working conditions and environmental performance,
and to provide more sustainable sourcing options.
We also reinforced our commitment to human rights both
publicly on our website, as well as internally through employee
education and training on our Code of Conduct on Business
Ethics. This effort will continue into 2012 with specific initiatives
to enhance our sustainability programs and our management of
risks.
We recognize that there will continue to be sustainability
challenges and opportunities going forward, and progress
to be made. Building a solid foundation and supporting our
employees, customers and suppliers to be more sustainable
is critical to our continued efforts to make a difference in our
communities around the world.
Highlights of our sustainability initiatives and achievements in
2011 are shared below.
ENVIRONMENT
ENERGY AND CARBON
We appreciate the risk that climate change poses to our
business and the world. For our business, primary risks relate
to the availability and increased cost of resources and the
disruptive impacts that unpredictable and severe weather
events could have on our supply chain. Addressing these risks
is therefore an important part of our Sustainability Strategy.
In addition to making our own operations more energy- and
carbon-efficient, we are expanding our initiatives to support our
suppliers to do the same in their facilities.
2011 marked the first full year of implementing the energy-
saving initiatives recommended by the Investment Grade Audit
(IGA) of our headquarters in Hong Kong and of the global

41LI & FUNG LIMITED | ANNUAL REPORT 2011
SUSTAINABILITY (CONTINUED)
campaign for our employees to adopt a range of behavioral
changes. Our network of off ices around the world also
retrofitted existing lighting, where feasible, with more efficient
LED, CFL and/or T5 fixtures in 2011. All of these efforts resulted
in our global offices reducing our carbon footprint by 18% per
m2 and electricity consumption by 13% per m2, compared
with 2010. In addition to the environmental benefits of reduced
energy consumption, these measures enabled us to save
approximately US$490,000 per year in energy costs.
Overall in 2011, our total global electricity consumption was
163,461 GJ (45,405,947 KWh) compared with 171,016 GJ
(47,504,4891 KWh) in 2010, and our Scope 1 and 2 greenhouse
gas emissions were 32,120 tons of CO2 equivalent, compared
with 35,630 of the same unit the previous year. This data
comprises part of our disclosure through the Carbon Disclosure
Project. For the third consecutive year, we were awarded the
Energywi$e Excellent rating for our Hong Kong offices and
the “Class of Good” Energywi$e Label under the Hong Kong
Awards for Environmental Excellence program of the Hong
Kong government.
Going forward, we will continue to adopt energy-efficient
technologies, to conserve energy and to support our supply
chain partners to improve their energy efficiency and carbon
intensity.
WATER AND WASTE
Water scarcity is a significant global challenge and particularly
acute across many key producer economies of Asia. As
noted above, being resource efficient is critical as we expand
our business. In 2011, we consumed 124,064 cubic meters
of water, compared with 105,310 of the same unit in 2010.
Absolute consumption in our off ices increased in 2011,
reflecting the expansion of our business operations. However,
our efficiency and conservation efforts resulted in our water
consumption per headcount reducing by 2.8% in the same
year. This was achieved through the use of water-efficient
technology recommended by the IGA and the efforts of our
employees globally to conserve water.
In 2011, our waste reduction campaign again focused on paper,
a significant portion of our offices’ waste stream. As above with
water, our absolute A4 paper consumption increased in 2011
reflecting the expansion of our business operations. However,
we reduced our consumption per person by 10% as a result of
our continued conservation efforts. Our total paper consumption
in 2011 was 149,072 reams compared with 136,6782 reams
in 2010. We also again maintained our “Class of Excellent”
Wastewi$e Label in Hong Kong. We will continue to seek
opportunities to reduce paper, minimize waste, purchase items
with sustainability features and enhance recycling.
1 Total electricity consumption and carbon emissions data reported
for 2010 and 2011 covers our office-based activities as these
offices have been involved in our targeted reduction campaigns
and retrofitting projects. The data reported in this report for the year
2010 have been adjusted downward, from what was reported in
our 2010 Annual Report. This adjustment is a result of a revision to
our internal reporting system to both enhance the robustness of the
data and bring the system in line with our financial reporting. The
reporting scope for the next Annual Report will include LF offices and
other facilities, which are captured in our new SAP Carbon Impact
reporting system that we are rolling out in 2012.
2 For the same reasons noted in footnote #1, our paper data reported
in this report for the year 2010 have been adjusted downward from
what was reported in our 2010 Annual Report.
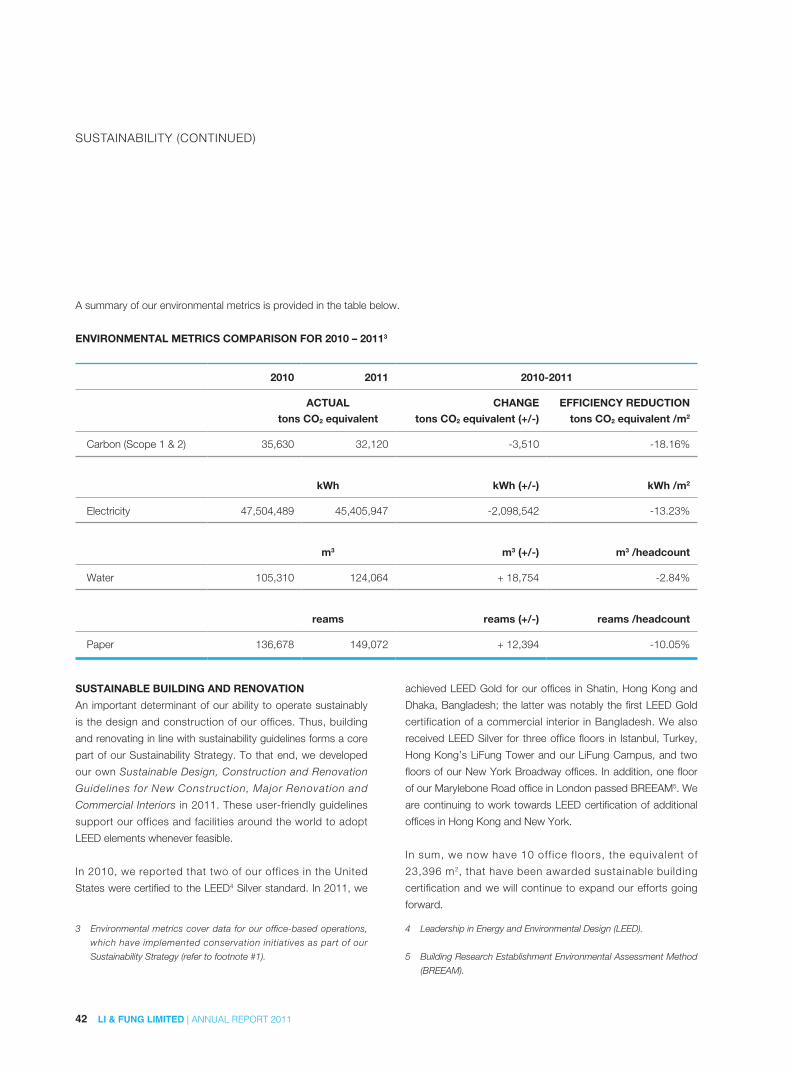
42 LI & FUNG LIMITED | ANNUAL REPORT 2011
SUSTAINABILITY (CONTINUED)
A summary of our environmental metrics is provided in the table below.
ENVIRONMENTAL METRICS COMPARISON FOR 2010 – 20113
2010 2011 2010-2011
ACTUAL CHANGE EFFICIENCY REDUCTION
tons CO2 equivalent tons CO2 equivalent (+/-) tons CO2 equivalent /m2
Carbon (Scope 1 & 2) 35,630 32,120 -3,510 -18.16%
kWh kWh (+/-) kWh /m2
Electricity 47,504,489 45,405,947 -2,098,542 -13.23%
m3 m3 (+/-) m3 /headcount
Water 105,310 124,064 + 18,754 -2.84%
reams reams (+/-) reams /headcount
Paper 136,678 149,072 + 12,394 -10.05%
SUSTAINABLE BUILDING AND RENOVATION
An important determinant of our ability to operate sustainably
is the design and construction of our offices. Thus, building
and renovating in line with sustainability guidelines forms a core
part of our Sustainability Strategy. To that end, we developed
our own Sustainable Design, Construction and Renovation
Guidelines for New Construction, Major Renovation and
Commercial Interiors in 2011. These user-friendly guidelines
support our offices and facilities around the world to adopt
LEED elements whenever feasible.
In 2010, we reported that two of our offices in the United
States were certified to the LEED4 Silver standard. In 2011, we
achieved LEED Gold for our offices in Shatin, Hong Kong and
Dhaka, Bangladesh; the latter was notably the first LEED Gold
certification of a commercial interior in Bangladesh. We also
received LEED Silver for three office floors in Istanbul, Turkey,
Hong Kong’s LiFung Tower and our LiFung Campus, and two
floors of our New York Broadway offices. In addition, one floor
of our Marylebone Road office in London passed BREEAM5. We
are continuing to work towards LEED certification of additional
offices in Hong Kong and New York.
In sum, we now have 10 off ice f loors, the equivalent of
23,396 m2, that have been awarded sustainable building
certification and we will continue to expand our efforts going
forward.
3 Environmental metrics cover data for our office-based operations,
which have implemented conservation initiatives as part of our
Sustainability Strategy (refer to footnote #1).
4 Leadership in Energy and Environmental Design (LEED).
5 Building Research Establishment Environmental Assessment Method
(BREEAM).
43LI & FUNG LIMITED | ANNUAL REPORT 2011
SUSTAINABILITY (CONTINUED)
SUPPLY CHAIN RESPONSIBILITYOur commitment to being a responsible and sustainable
business goes beyond our four walls to encompass how we
manage our supply chains in over 40 economies around the
world. In 2011, our vendor compliance team, comprising
140 employees worldwide, continued to regularly monitor
compliance and work with our suppliers to meet our Code
of Conduct, as well as industry- and customer-specific audit
standards, protocols and methodologies. This year, over 9,800
audits of our suppliers were conducted.
To further sustainability in our supply chain, we are developing
tools and programs, and working with our partners, to improve
working conditions and environmental performance, and also
provide sustainable sourcing options.
Over the course of 2011, we focused on enhancing our
compliance tools to support our suppliers to improve their
social and environmental sustainability. Our updated Code of
Conduct for Suppliers and Supplier Compliance Manual set out
our baseline expectations of all suppliers with which we work.
The Code requires compliance with local and international
regulations, including the International Labor Organization’s core
conventions. Key revisions include expanded ethical conduct
requirements, enhanced disclosure of suppliers’ performance
information and the issue of human trafficking, in support of the
California Transparency in Supply Chains Act.
The Manual outlines how to meet the Code and is the first
step in building competency for sustainable compliance. In
parallel, we also launched a new assessment tool for suppliers
to identify gaps in meeting Code requirements. This information
enables our employees to follow-up, identify opportunities for
improvement as needed, and support suppliers with training,
education and tools to build management systems that support
ongoing compliance. Suppliers identified as having compliance
issues will have access to capacity-building resources and be
required to resolve the issue(s) to continue business with us.
Our aim is that through improved visibi l ity, tracking and
performance, impacts and risks will be better managed in
the supply chain. Sustainability and business resilience also
drive innovation, which is critical for creating products with
sustainability attributes that are made in better-managed
factories. We will continue to work with our customers, suppliers
and industry partners to improve our collective knowledge
and capabilities around sustainable sourcing, products and
packaging.
OUR PEOPLEA strong and sustainable organizat ion has an engaged
workforce that is aligned with its strategic goals. As of the
end of 2011, the Company had a total workforce of 29,624,
of whom 4,518 were based in Hong Kong and 25,106 were
located overseas.
EMPLOYEE ENGAGEMENT
In September 2011, we launched our first Employee Engagement
Survey with the objective of assessing engagement with our
employees and their customer orientation, and finding out more
about our strengths and opportunities for improvement across
our business units and countries. The survey, which was web-
based and implemented through a third-party to safeguard the
anonymity of the respondents, consisted of 56, close-ended
questions and one, open-ended question.
Out of the 14,490 employees who received the survey request,
11,237 completed the survey, representing a response rate
of 78%. The survey helped management to understand the
views of employees and to receive useful feedback. We have
formed a Corporate Engagement Team in conjunction with
business executives to communicate the survey results across
the Company and to identify follow-up actions. In addition,
our business executives will champion improvement initiatives
that focus on the three themes of Communication, Career and
People Care.
44 LI & FUNG LIMITED | ANNUAL REPORT 2011
SUSTAINABILITY (CONTINUED)
WELL-BEING, OCCUPATIONAL HEALTH AND SAFETY
AND HUMAN RIGHTS
We aim to provide a safe, healthy and respectful workplace by
adhering to our policies and codes, raising awareness, sharing
tips and experiences, and providing training for our employees.
The health and well-being of all of our people globally is at the
top of our agenda. Our Useful Tips on health and well-being
play a vital role in sharing knowledge to our employees through
daily email messages and our internal e-platform. The tips cover
issues relevant to occupational health (e.g. desk ergonomics,
heavy-lifting postures and precautions, stretching exercises) and
well-being (e.g. ways to stay positive, quick stress relievers).
To support the ongoing promotion of health and safety in our
workplaces, we launched a series of Environmental, Health and
Safety (EHS) initiatives in our distribution centers worldwide. We
also provide training to our employees globally and regularly
conduct internal EHS audits to ensure compliance in our
operations and to strive for continual improvement.
In November 2011, we launched our human rights statement
on our website and implemented an internal awareness-raising
program. The statement reinforces that since the founding of Li
& Fung, respect for human rights has always been at the core
of our beliefs and embedded in the way we do business. We
have formalized these principles into group policies and codes
that foster a respect for human rights amongst our employees
and business partners. The statement further affirms our
commitment to support the:
• In ternat iona l Labor Organ izat ion’s Declarat ion on
Fundamental Principles and Rights at Work, including
freedom of association and the effective recognition of
the right to collective bargaining, the elimination of forced
or compulsory labor, the abolition of child labor and the
elimination of discrimination in respect of employment and
occupation;
• ten principles of the UN Global Compact, covering human
rights, labor, environment and anti-corruption, throughout
our operations; and
• UN Declaration of Human Rights as a necessary foundation
for social development and economic progress.
LEARNING AND DEVELOPMENT
Our learning and development programs aim to strengthen core
functional and management capabilities of our people through
a variety of structured training programs, peer-to-peer learning,
mentoring, on-the-job training, e-learning modules, and others.
In 2011, we had a record of over 36,000 employee visits to
access our online learning tools and over 19,025 participants
attended formal learning classes or took part in e-learning.
Learning initiatives focusing on strengthening core functional
and management capabil i t ies of our people include, for
example:
• The Merchandising Skills Foundation Program aims to equip
merchandisers with practical, job-related skills. In 2011,
over 3,700 employees in 16 locations participated and this
program was then extended to a broader group through
e-learning with over 3,200 employees in 33 locations
participating.
• Our expanded Merchandising Development Program
focuses on enhancing the technical expertise as well as
individuals’ confidence in serving our customers. The
curriculum covers over 46 topics on product and production
knowledge, productivity improvement, processes and
practices, and performance enhancement skills. Over 618
in-house learning sessions were organized in 33 offices, with
18,200 participants joining through 15,000 learning hours.
45LI & FUNG LIMITED | ANNUAL REPORT 2011
SUSTAINABILITY (CONTINUED)
Additional talent development programs focus on key transition
points in the careers of our employees, including:
• a new General Manager Transition Program;
• our high-impact Leadership Program, now in its third year,
which was delivered through the MIT Sloan School of
Management and The University of Hong Kong, with 53 of
our senior managers attending the 2-term seminars and
workshops;
• the involvement of 100 of our senior executives as “Learning
Champions” to dr ive knowledge-sharing and career
development within our operations; and
• our Program for Management Development, which focuses
on attracting and developing talent for future business
leadership positions, has successfully completed its second
year. A total of 23 Management Associates, representing
10 nationalities, participated in this structured development
program that includes corporate orientation and training,
rotational assignments in the Company’s core businesses,
and business education programs.
COMMUNITY ENGAGEMENT
Contributing to our communities is important to our employees
around the wor ld. This year we supported a var iety of
initiatives, ranging from: donations to assist victims of the
tsunami in Japan, flooding in Bangkok and India, typhoons in
the Philippines, and cold weather in Bangladesh and India; to
supporting children and elderly in need globally; to cleaning
beaches and/or planting trees in the Philippines, Cambodia
and Hong Kong, and to helping a community conserve water in
Guatemala. In 2011, over 6,000 of our employees volunteered
over 3,800 hours to support over 100 environmental and
social initiatives around the world. Our global employees also
raised over US$1.7 million to support communities, with the
LF Foundation providing over US$1.4 million to further support
some of these projects.
Going forward, we will continue to expand our activities in our
communities around the world and develop an approach for
assessing the impacts of our engagement.
OUR PARTNERSHIPSI n 2011, we rev iewed our engagement w i th ex te rna l
stakeholders – including customers, suppliers, industry
associations and non-governmental organizations – to look
for strategic opportunities where we could focus our efforts
for impact, and support our priority of building capacity in our
supply chain. As a result and for example, we are expanding
our engagement with the following organizations:
• International Labor Organization and its Better Work
program for improving labor conditions in factories;
• Business for Social Responsibility and its programs in
factories for energy efficiency and water management;
• Sustainable Apparel Coalition and its Apparel Sustainability
Index tool, which will improve our ability to measure and
manage the environmental impact of products in our supply
chain; and
• Global Social Compliance Program and its efforts to improve
working and environmental conditions in the global supply
chain.
The learning and tools from these programs support and
enhance our ongoing efforts to build a sustainable supply chain
that benefits diverse communities around the world.
RECOGNITIONWe have been a signatory to UN Global Compact since 2001
and, in recognition of our corporate-wide efforts to improve our
sustainability performance, we continue to be included in the
Dow Jones Sustainability Index, the FTSE4Good and the Hang
Seng Corporate Sustainability Index. We are also recognized
as a Caring Company under the Hong Kong Council of Social
Service’s recognition scheme.
DIRECTORS AND SENIOR MANAGEMENT
46 LI & FUNG LIMITED | ANNUAL REPORT 2011
DIRECTORS
Victor FUNG Kwok KingGroup Non-executive ChairmanChairman of Risk Management and Sustainability Committee
Aged 66. Brother of Dr William Fung Kwok Lun and father of Mr Spencer Theodore Fung. Group Chairman of Li & Fung group companies including the Company and the publicly listed Convenience Retail Asia Limited and Trinity Limited. A director of King Lun Holdings Limited and its wholly owned subsidiary, Li & Fung (1937) Limited, substantial shareholders of the Company. Joined the Group in 1973 as Manager and became Managing Director of the Group’s export trading business in 1977. Became Group Managing Director in 1981 and Group Chairman in 1989. Holds Bachelor and Master Degrees in Electrical Engineering from the Massachusetts Institute of Technology, and a Doctorate in Business Economics from Harvard University. An independent non-executive director of BOC Hong Kong (Holdings) Limited in Hong Kong and Baosteel Group Corporation in the People’s Republic of China and Koc Holding A.S. in Turkey. An independent non-executive director of Chow Tai Fook Jewellery Group Limited in Hong Kong since November 2011. Founding Chairman of the Fung Global Institute launched in August 2011, an independent and non-profit think-tank that generates and disseminates innovative thinking and business-relevant research on global issues from Asian perspectives. Honorary Chairman of International Chamber of Commerce. A member of Chinese People’s Political Consultative Conference. A vice chairman of China Centre for International Economic Exchanges. A member of the Commission on Strategic Development of the Hong Kong Government. Chairman of the Greater Pearl River Delta Business Council. Chairman of the Hong Kong Trade Development Council (1991–2000). Hong Kong representative on the APEC Business Advisory Council (1996–2003). Chairman of the Hong Kong Airport Authority (1999–2008). Chairman of The Council of The University of Hong Kong (2001–2009). Chairman of the International Chamber of Commerce (2008–2010). Chairman of the Hong Kong – Japan Business Co-operation Committee (2004–2010). Awarded the Gold Bauhinia Star in 2003 and Grand Bauhinia Medal in 2010 for distinguished service to the community.
William FUNG Kwok LunExecutive Deputy Chairman
Aged 63. Brother of Dr Victor Fung Kwok King and uncle of
Mr Spencer Theodore Fung. Executive Deputy Chairman since
2011 and before that, Group Managing Director from 1986
to 2011. Joined the Group in 1972 and became a Director
of the Group’s export trading business in 1976. Graduated
from Princeton University with a Bachelor of Science degree
in Engineering. Holds an MBA degree from the Harvard
Graduate School of Business. Degrees of Doctor of Business
Administration, honoris causa, were conferred by the Hong
Kong University of Science & Technology and by the Hong
Kong Polytechnic University. An independent non-executive
director of VTech Holdings Limited, Shui On Land Limited,
Sun Hung Kai Properties Limited and The Hongkong and
Shanghai Hotels, Limited. An independent director of Singapore
Airlines Limited. A non-executive director of various companies
within the Li & Fung Group including Convenience Retail Asia
Limited and Trinity Limited. A director of King Lun Holdings
Limited and its wholly owned subsidiary, Li & Fung (1937)
Limited, substantial shareholders of the Company. A director
of the Fung Global Institute, an independent and non-profit
think-tank that generates and disseminates innovative thinking
and business-relevant research on global issues from Asian
perspectives. Past Chairman of the Hong Kong General
Chamber of Commerce, the Hong Kong Exporters’ Association
and the Pacific Economic Cooperation Committee. Awarded the
Silver Bauhinia Star by the Hong Kong Special Administrative
Region Government in 2008.
47LI & FUNG LIMITED | ANNUAL REPORT 2011
DIRECTORS AND SENIOR MANAGEMENT (CONTINUED)
Bruce Philip ROCKOWITZGroup President and Chief Executive Officer
Aged 53. Group President and Chief Executive Officer since
May 2011. An Executive Director since 2001 and in 2004,
took over day to day oversight of the Group’s operations as
President. In 1981, co-founded Colby International Limited, a
large Hong Kong buying agent, and was the Chief Executive
Officer until 2000 when Colby was acquired by Li & Fung.
Member of the Advisory Board for the Wharton School’s Jay
H Baker Retailing Initiative, an industry research center for
retail at the University of Pennsylvania. Board member of the
Educational Foundation for the Fashion Industries, the private
fund-raising arm of the Fashion Institute of Technology. In
December 2008, ranked first by Institutional Investor for the
Asia’s Best CEOs in the consumer category. In the years
2010 and 2011, ranked as one of the world’s 30 best CEOs
by Barron’s. In 2011, received the 2011 Alumni Achievement
Award from the University of Vermont. Non-Executive Chairman
of the Pure Group, a lifestyle, fitness and yoga group operating
in Hong Kong, Singapore and Taiwan. An independent
non-executive director of Wynn Macau, Limited.
Spencer Theodore FUNGExecutive Director
Aged 38. An Executive Director since 2008. President of
LF Europe, managing the Group’s European distribution
business. Joined the Group in 2001. Holds a Bachelor of
Arts degree from Harvard College and Master of Science in
Accounting and Master in Business Administration degrees from
Northeastern University. A U.S. Certified Public Accountant.
The son of Dr Victor Fung Kwok King, Group Chairman, and
nephew of Dr William Fung Kwok Lun, Deputy Chairman.
Paul Edward SELWAY-SWIFTIndependent Non-executive Director
Chairman of Audit Committee and Nomination Committee
Aged 67. An Independent Non-executive Director since
1992. Chairman of Pure Circle Ltd, a producer of natural food
ingredients, which is quoted on the London Stock Exchange.
Also, Chairman of Atlantis Investment Management (Ireland)
Ltd. A director of several other companies including Temenos
Group AG. Formerly, Deputy Chairman of HSBC Investment
Bank PLC, a director of The Hongkong and Shanghai Banking
Corporation Limited in Hong Kong and Harvard International
PLC, Chairman of Singer & Friedlander Group PLC, a banking
and investment management group, and Novae Group PLC, a
specialist insurance group.
Allan WONG Chi YunIndependent Non-executive Director
Chairman of Remuneration Committee
Aged 61. An Independent Non-executive Director since 1999.
Chairman and Group Chief Executive Officer of VTech Holdings
Limited. Co-founded VTech Group in 1976. Holds a Bachelor
of Science degree in Electrical Engineering from The University
of Hong Kong, a Master of Science degree in Electrical and
Computer Engineering from the University of Wisconsin and
an Honorary Doctorate of Technology from the Hong Kong
Polytechnic University. A board member of the Airport Authority
Hong Kong. Deputy Chairman and independent non-executive
director of The Bank of East Asia, Limited. An independent
non-executive director of China-Hongkong Photo Products
Holdings Limited. Awarded the Silver Bauhinia Star and the
Gold Bauhinia Star in 2003 and 2008 respectively.
48 LI & FUNG LIMITED | ANNUAL REPORT 2011
DIRECTORS AND SENIOR MANAGEMENT (CONTINUED)
DIRECTORS (CONTINUED)
Franklin Warren McFARLANIndependent Non-executive Director
Aged 74. An Independent Non-executive Director since
1999. Professor Emeritus of Business Administration at
Harvard University. Guest Professor and Co-Director of the
China Business Case Center at Tsinghua University-SEM.
A Professor at the Harvard Graduate School of Business
Administration since 1973. Formerly, Faculty Chairman of
Advanced Management Program and Chairman of Executive
Education Programs. Graduated from the Harvard Business
School with a doctorate. Senior Associate Dean from 1990
to 2004. An independent non-executive director of Computer
Sciences Corporation. An independent non-executive director
of thinkorswim Group Inc from 2004 to 2009.
Martin TANG Yue NienIndependent Non-executive Director
Aged 62. An Independent Non-executive Director since 2009.
Former Chairman, Asia of Spencer Stuart & Associates, a global
executive search consulting firm. An independent non-executive
director of the publicly-listed CEI Contract Manufacturing Ltd
and China NT Pharma Group Limited. Holds a Bachelor of
Science degree in Electrical Engineering from Cornell University
and Master of Science in Management from the Massachusetts
Institute of Technology.
Benedict CHANG Yew TeckNon-executive Director
Aged 58. A Non-executive Director since February 2011.
Previously, group managing director of Integrated Distribution
Services Group Limited (“IDS”) which was privatized on
29 October 2010. A director of IDS from 2003 to April 2011. A
director of Li & Fung (1937) Limited, a substantial shareholder
of the Company. Graduated from the University of Surrey,
United Kingdom, with a Bachelor of Science Degree (First
Class Honours) in Marine Engineering. Chairman of the
Advisory Committee of the Li & Fung Institute of Supply Chain
Management and Logistics of The Chinese University of Hong
Kong. A member of the Advisory Board of the School of
Information Systems, Singapore Management University.
FU YuningIndependent Non-executive Director
Aged 55. An Independent Non-executive Director since
1 November 2011. Chairman of China Merchants Group
Limited, China Merchants Holdings (International) Company
Limited and China Merchants Bank Co., Ltd. An independent
non-executive director of CapitaLand Limited. Graduated
from Dalian Institute of Technology in the PRC with a Bachelor
Degree in Port and Waterway Engineering. Holds a Doctorate
Degree in Mechanical Engineering from Brunel University, United
Kingdom where he also worked as a Post-Doctorate research
fellow briefly. Formerly, Chairman of China Merchants Energy
Shipping Co., Ltd. and China International Marine Containers
(Group) Co., Ltd., and also an independent non-executive
director of Sino Land Company Limited and Integrated
Distribution Services Group Limited.

49LI & FUNG LIMITED | ANNUAL REPORT 2011
DIRECTORS AND SENIOR MANAGEMENT (CONTINUED)
GROUP CHIEF COMPLIANCE OFFICER
Srinivasan PARTHASARATHY
Aged 54. Group Chief Compliance Officer of the Company
since October 2011. Also, the Group Chief Compliance Officer
of Li & Fung (1937) Limited, a substantial shareholder of the
Company and of the Li & Fung Group of companies including
Convenience Retail Asia Limited and Trinity Limited of which
he is also their respective Group Chief Compliance Officer.
With 30 years of experience and held various financial and
commercial positions within the Li & Fung Group since 1999,
and the Inchcape Group before that, in Hong Kong, Singapore,
the UK and the Middle East. A Commerce Graduate of Bombay
University and qualified as a Chartered Accountant in India,
securing fourth position in the All India Merit Rankings. A Fellow
Member of the Chartered Institute of Management Accountants,
UK.
SENIOR MANAGEMENT
Henry CHANPresident of LF Products
Aged 61. President of LF Products managing the Group’s
hardlines principal business globally. Joined the Group in 1972.
An Executive Director of the Company from 1992 to May 2009.
Graduated from The University of Hong Kong with a Bachelor of
Social Science degree. Holds an MBA degree from The Chinese
University of Hong Kong. A member of The Hong Kong Institute
of Directors and also a member of the advisory Board of the
MBA Programmes of the Faculty of Business Administration,
The Chinese University of Hong Kong.
Annabella LEUNG Wai PingPresident of LF Fashion
Aged 59. President of LF Fashion managing the Group’s
apparel and fashion accessories principal business globally.
Formerly, the Regional Director of North Asia Apparel for
Inchcape, a global sourcing network acquired by the Company
in 1995. An Executive Director of the Company from 2000 to
May 2010. Holds a Master of Science degree in Biology from
Northeastern University. Served on various advisory boards
in the Hong Kong Exporters’ Association, Hong Kong Trade
Development Council, Clothing Industry Training Authority, and
Hong Kong Export Credit Insurance Corporation. Now serving
as Chairman of the Vetting Committee for the Professional
Services Development Assistance Scheme of Commerce and
Economic Development Bureau.
Richard Nixon DARLINGPresident of LF USA
Aged 58. President of LF USA overseeing the Group’s
distribution model in the U.S. which has built a unique portfolio
of well-known consumer and fashion brands, licensed and
private label products. The founder of The Millwork Trading
Co., Ltd (now known as “LF USA Inc.”), a joint venture with Li &
Fung that became a wholly owned subsidiary in 1999. Serves
as Chairman of the Board of Directors of the American Apparel
and Footwear Association and as a board member for “Fashion
Delivers” and Board of Governors for the Parson’s School of
Design.
50 LI & FUNG LIMITED | ANNUAL REPORT 2011
DIRECTORS AND SENIOR MANAGEMENT (CONTINUED)
SENIOR MANAGEMENT (CONTINUED)
Marc Robert COMPAGNONPresident of LF Sourcing
Aged 53. President of LF Sourcing overseeing the Group’s
global agency business for apparel and hard goods as well
as the sourcing for the Group’s distribution business. Joined
the Group in 2000 at the time of the acquisition of Colby
International Limited where he was Chief Merchandising Officer
for 17 years and was responsible for establishing Colby’s global
sourcing network and sales and marketing strategies. Holds
a Bachelor of Science degree from the University of Vermont.
Founding member of Cotton’s Revolutions, and the Global
Apparel, Footwear and Textile Initiative (GAFTI). Non-Executive
Chairman of Cebu Dream Realized, INC, a hotel and restaurant
group.
Dow Peter FAMULAKPresident of DSG & LF Beauty
Aged 51. President of the DSG group of companies, a dedicated
sourcing group servicing Wal-Mart globally. Also President of
LF Beauty, the Group’s health, beauty and cosmetic business.
Previously, Chief Executive Officer of LF Europe, managing the
Group’s European distribution business. Joined the Group in
2000 at the time of the acquisition of Colby International Limited
where he was an Executive Vice President. Former partner in
the law firm of Baker & McKenzie, Hong Kong office where he
worked from 1992 until he joined Colby. Graduated from the
University of British Columbia with a BA Economics (Honours)
and from law school at the University of Saskatchewan. A
member of The Law Society of Hong Kong, The Law Society
of England and Wales and The Law Society of British Columbia
(Canada).
Emily MAK MOK Oi WaiChief Operating Officer of DSG & President of LF USA Sourcing
Aged 50. Chief Operat ing Off icer of the DSG group of
companies, a dedicated sourcing group servicing Wal-Mart
globally, and President of LF USA Sourcing, managing all of the
Asia sourcing business units of LF USA. Previously managing
the Group’s department store, mass market, supermarket and
specialty store apparel business in the Americas, as well as the
Southern Hemisphere and Japan. Joined the Group in 2000
with the acquisition of Colby International Limited where Emily
was the Chief Operating Officer and directly responsible for
the operational and merchandising matters for Colby’s apparel
business worldwide. Graduated from The University of Hong
Kong with a Bachelor of Social Sciences degree. A Member
of the Garment Advisory Committee of the Hong Kong Trade
Development Council.
Joseph Chua PHIPresident of LF Logistics
Aged 49. President of LF Logistics managing the Group’s
logistics, freight services, and supply chain management. An
Executive Director of Integrated Distribution Services Group
Limited from 2004 to April 2011. Joined the Group in 1999.
Graduated magna cum laude from the University of The
Philippines with a Bachelor of Science degree in Industrial
Engineering and attained an MBA degree with top honors
from the same university. Member of Phi Kappa Phi and
Pi Gamma Mu international honor societies. Co-convener
of the Li & Fung China Advisory Council. Chairman of GS1
Hong Kong. Director of GS1 Management Board. Member
of the Advisory Committee, Centre for Marketing and Supply
Chain Management at Hong Kong University of Science
and Technology (HKUST). Member of Supply Chain 50, an
association of the top supply chain professionals in the world.
51LI & FUNG LIMITED | ANNUAL REPORT 2011
DIRECTORS AND SENIOR MANAGEMENT (CONTINUED)
Gerard Jan RAYMONDPresident of LF Asia – Food, Health, Beauty & Cosmetics
Aged 55. President of LF Asia managing the Group’s food,
health, beauty and cosmetics distribution business in Asia.
Previously, an Executive Vice President, Distribution and
Regional Managing Director of Integrated Distribution Services
Group Limited. Joined the Group in 2003. Educated in Australia
with a Bachelor’s degree in Business. A Fellow of the Australian
Marketing Institute.
Jason Andrew RABINPresident of LF Asia – Hard & Soft Goods
Aged 42. President of LF Asia managing the Group’s hard
and soft goods distribution business in Asia. The founder
of Kids Headquarters, children’s and young men’s apparel
manufacturer, which he began in 1994. Joined the Group in
2009 when Kids Headquarters was acquired by Li & Fung.
Graduated from the University of Miami in 1992. Received
awards from the children’s clothing industry, such as SPARC,
Ernie Awards & LIMA.
Lale KESEBIExecutive Director of Li & Fung (Trading) Limited
Aged 43. Executive Director of Li & Fung (Trading) Limited.
Responsible for the Group’s corporate operations teams
including legal, vendor compliance, human resources, corporate
services and internal corporate communications. Joined the
Group in 2003. Holds a Bachelor of Science (Honours) degree
and a Bachelor of Law degree from Dalhousie University. Past
member of The Law Society of British Columbia (Canada).
Formerly, Chair of the Canadian Chamber’s Business Policy
& Government Relations committee and the Debenture and
Scholarship committee of the Canadian International School in
Hong Kong. Chair of the Corporate Sustainability Committee of
the Company.

INFORMATION FOR INVESTORS
52 LI & FUNG LIMITED | ANNUAL REPORT 2011
SHARE INFORMATIONBoard lot size: 2,000 shares
Shares outstanding as at 31 December 2011 8,104,154,706 shares
Market Capitalization as at 31 December 2011 HK$116,537,744,672
Earnings per share for 2011Interim 2.92 US centsFull year 8.43 US cents
Dividend per share for 2011Interim 19 HK centsFinal 34 HK centsFull year 53 HK cents
INVESTOR RELATIONS CONTACTMs Mable ChanExecutive Vice President – Corporate Communications and Investor Relations
Telephone: (852) 2300 2300Fax: (852) 2300 2020e-mail: [email protected]
Li & Fung Limited11th Floor, LiFung Tower888 Cheung Sha Wan RoadKowloon, Hong Kong
WEBSITEwww.lifung.comwww.irasia.com/listco/hk/lifung
REGISTRAR & TRANSFER OFFICESPRINCIPALHSBC Securities Services (Bermuda) Limited6 Front Street, Hamilton HM 11, Bermuda
HONG KONG BRANCHTricor Abacus Limited26th Floor, Tesbury Centre28 Queen’s Road East,Wanchai, Hong KongTelephone: (852) 2980 1333e-mail: [email protected]
LISTING INFORMATIONListing: Hong Kong ExchangeStock code: 494Ticker Symbol
Reuters: 0494.HKBloomberg: 494 HK Equity
INDEX CONSTITUENTHang Seng IndexMSCI Index SeriesFTSE4Good Index SeriesDow Jones Sustainability Asia Pacific IndexHang Seng Corporate Sustainability Index Series
KEY DATES11 August 2011 Announcement of 2011 Interim Results
7 September 2011 Payment of 2011 Interim Dividend
22 March 2012 Announcement of 2011 Final Results
11 May 2012 Record Date for 2012 Annual General Meeting
14 May 2012 Annual General Meeting
16 May 2012 Dividend Ex-entitlement for Shares
18 May 2012 to 21 May 2012 (both days inclusive) Closure of Register of Shareholders
25 May 2012 Proposed Payment of 2012 Final Dividend
A Chinese version of this Annual Report can be downloaded from the Company’s website and can be obtained from the Company’s Hong Kong branch
share registrar, Tricor Abacus Limited.
本年報中文版可從本公司網站下載,及向本公司於香港之股份過戶登記處卓佳雅柏勤有限公司索取。
REPORT OF THE DIRECTORS
53LI & FUNG LIMITED | ANNUAL REPORT 2011
Under the Companies Act 1981 of Bermuda (as amended), the
contributed surplus shall not be distributed to the shareholders
if there are reasonable grounds for believing that:
(i) the Company is, or would after the payment be, unable to
pay its liabilities as they become due; or
(ii) the realizable value of the Company’s assets would thereby
be less than the aggregate of its liabilities and its issued
share capital and share premium account.
DONATIONSCharitable and other donations made by the Group during the
year amounted to US$1,437,000.
PROPERTY, PLANT AND EQUIPMENTDetails of the movements in property, plant and equipment of
the Group are set out in Note 13 to the accounts.
TEN-YEAR FINANCIAL SUMMARYA summary of the results for the year ended and of the assets
and liabilities of the Group as at 31 December 2011 and for
the previous nine financial years are set out in the Ten-Year
Financial Summary section on page 160.
PRE-EMPTIVE RIGHTSThere are no provisions for pre-emptive rights under the
Company’s bye-laws though there are no restrictions against
such rights under the laws of Bermuda.
PURCHASE, SALE OR REDEMPTION OF THE COMPANY’S LISTED SECURITIESThe Company has not redeemed any of its listed securities
during the year. Neither the Company nor any of its subsidiaries
has purchased or sold any of the Company’s listed securities
during the year.
The directors submit their report together with the audited
accounts for the year ended 31 December 2011.
PRINCIPAL ACTIVITIES AND ANALYSIS OF OPERATIONSThe principal activity of the Company is investment holding. The
activities of its principal subsidiaries are set out in Note 41 to
the accounts.
Details of the analysis of the Group’s turnover and contribution
to operating profit for the year by segments are set out in
Note 3 to the accounts.
SHARE CAPITALDetails of the movements in share capital of the Company are
set out in Note 25 to the accounts.
RESULTS AND APPROPRIATIONSThe results of the Group for the year are set out in the
consolidated profit and loss account on page 67.
The directors declared an interim dividend of US$0.024
per ord inary share (equ iva lent to HK$0.19) , to ta l l ing
US$197,360,000 which was paid on 7 September 2011.
The directors recommend the payment of a final dividend of
US$0.044 per ordinary share (equivalent to HK$0.34), totalling
US$354,611,000.
RESERVESMovements in the reserves of the Group and the Company
during the year are set out in statement of changes in equity
and Note 26 to the accounts.
DISTRIBUTABLE RESERVESAt 31 December 2011, the reserves of the Company available
for distribution as dividends amounted to US$764,004,000,
compris ing retained earnings of US$499,815,000 and
contributed surplus arising from the exchange of shares for
the acquisition of Li & Fung (B.V.I.) Limited and the issuance
of shares for the acquis i t ion of Colby Group Holdings
Limited, as set out in Note 26 to the accounts, amounting to
US$264,189,000.
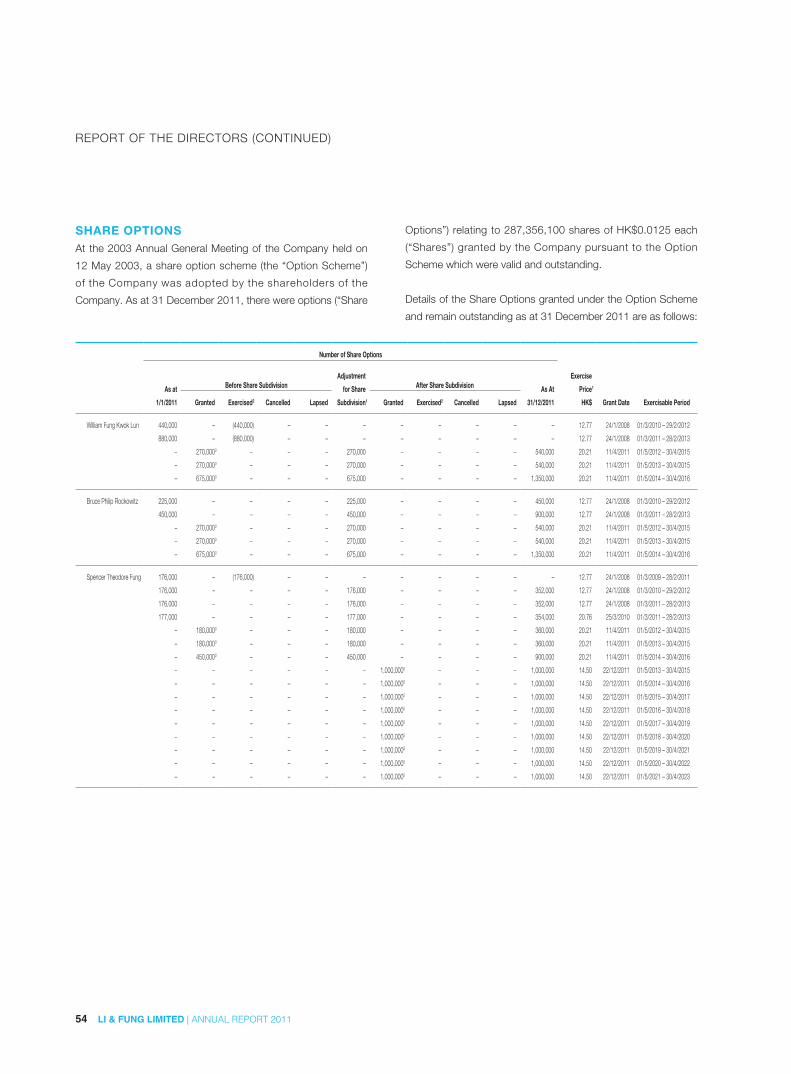
54 LI & FUNG LIMITED | ANNUAL REPORT 2011
REPORT OF THE DIRECTORS (CONTINUED)
Options”) relating to 287,356,100 shares of HK$0.0125 each
(“Shares”) granted by the Company pursuant to the Option
Scheme which were valid and outstanding.
Details of the Share Options granted under the Option Scheme
and remain outstanding as at 31 December 2011 are as follows:
SHARE OPTIONSAt the 2003 Annual General Meeting of the Company held on
12 May 2003, a share option scheme (the “Option Scheme”)
of the Company was adopted by the shareholders of the
Company. As at 31 December 2011, there were options (“Share
Number of Share Options
Adjustment Exercise
As at Before Share Subdivision for Share After Share Subdivision As At Price1
1/1/2011 Granted Exercised2 Cancelled Lapsed Subdivision1 Granted Exercised2 Cancelled Lapsed 31/12/2011 HK$ Grant Date Exercisable Period
William Fung Kwok Lun 440,000 – (440,000) – – – – – – – – 12.77 24/1/2008 01/3/2010 – 29/2/2012
880,000 – (880,000) – – – – – – – – 12.77 24/1/2008 01/3/2011 – 28/2/2013
– 270,0003 – – – 270,000 – – – – 540,000 20.21 11/4/2011 01/5/2012 – 30/4/2015
– 270,0003 – – – 270,000 – – – – 540,000 20.21 11/4/2011 01/5/2013 – 30/4/2015
– 675,0003 – – – 675,000 – – – – 1,350,000 20.21 11/4/2011 01/5/2014 – 30/4/2016
Bruce Philip Rockowitz 225,000 – – – – 225,000 – – – – 450,000 12.77 24/1/2008 01/3/2010 – 29/2/2012
450,000 – – – – 450,000 – – – – 900,000 12.77 24/1/2008 01/3/2011 – 28/2/2013
– 270,0003 – – – 270,000 – – – – 540,000 20.21 11/4/2011 01/5/2012 – 30/4/2015
– 270,0003 – – – 270,000 – – – – 540,000 20.21 11/4/2011 01/5/2013 – 30/4/2015
– 675,0003 – – – 675,000 – – – – 1,350,000 20.21 11/4/2011 01/5/2014 – 30/4/2016
Spencer Theodore Fung 176,000 – (176,000) – – – – – – – – 12.77 24/1/2008 01/3/2009 – 28/2/2011
176,000 – – – – 176,000 – – – – 352,000 12.77 24/1/2008 01/3/2010 – 29/2/2012
176,000 – – – – 176,000 – – – – 352,000 12.77 24/1/2008 01/3/2011 – 28/2/2013
177,000 – – – – 177,000 – – – – 354,000 20.76 25/3/2010 01/3/2011 – 28/2/2013
– 180,0003 – – – 180,000 – – – – 360,000 20.21 11/4/2011 01/5/2012 – 30/4/2015
– 180,0003 – – – 180,000 – – – – 360,000 20.21 11/4/2011 01/5/2013 – 30/4/2015
– 450,0003 – – – 450,000 – – – – 900,000 20.21 11/4/2011 01/5/2014 – 30/4/2016
– – – – – – 1,000,0005 – – – 1,000,000 14.50 22/12/2011 01/5/2013 – 30/4/2015
– – – – – – 1,000,0005 – – – 1,000,000 14.50 22/12/2011 01/5/2014 – 30/4/2016
– – – – – – 1,000,0005 – – – 1,000,000 14.50 22/12/2011 01/5/2015 – 30/4/2017
– – – – – – 1,000,0005 – – – 1,000,000 14.50 22/12/2011 01/5/2016 – 30/4/2018
– – – – – – 1,000,0005 – – – 1,000,000 14.50 22/12/2011 01/5/2017 – 30/4/2019
– – – – – – 1,000,0005 – – – 1,000,000 14.50 22/12/2011 01/5/2018 – 30/4/2020
– – – – – – 1,000,0005 – – – 1,000,000 14.50 22/12/2011 01/5/2019 – 30/4/2021
– – – – – – 1,000,0005 – – – 1,000,000 14.50 22/12/2011 01/5/2020 – 30/4/2022
– – – – – – 1,000,0005 – – – 1,000,000 14.50 22/12/2011 01/5/2021 – 30/4/2023
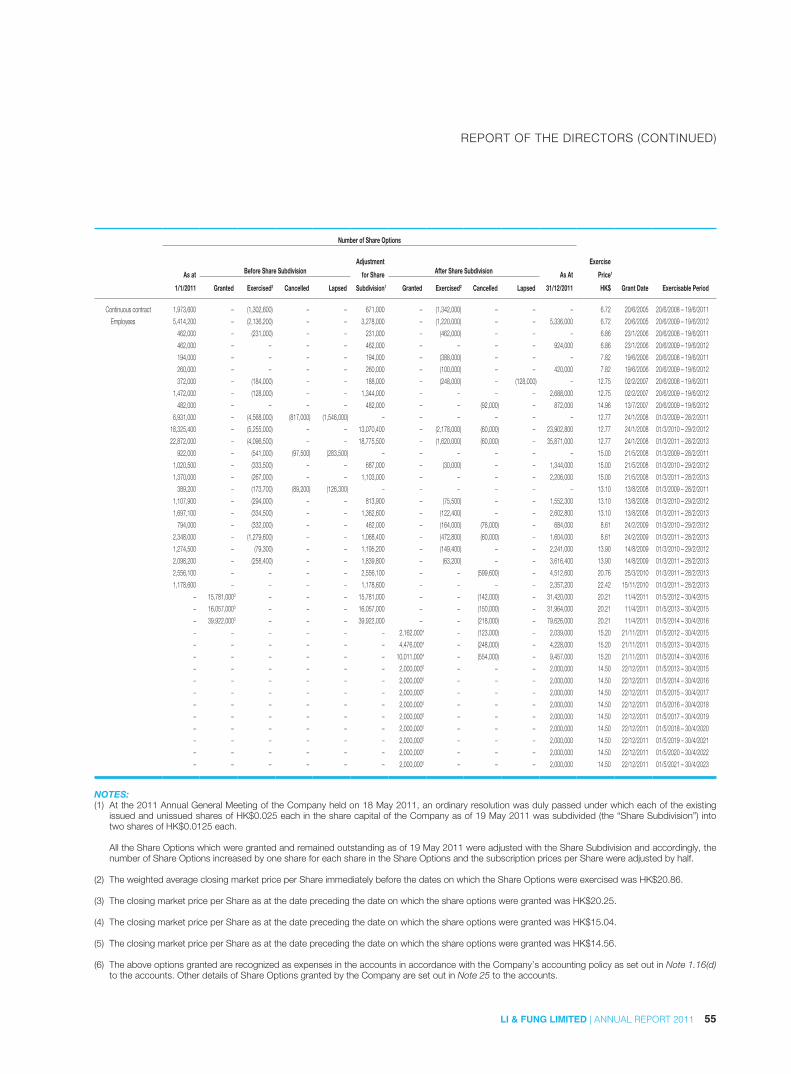
55LI & FUNG LIMITED | ANNUAL REPORT 2011
REPORT OF THE DIRECTORS (CONTINUED)
Number of Share Options
Adjustment Exercise
As at Before Share Subdivision for Share After Share Subdivision As At Price1
1/1/2011 Granted Exercised2 Cancelled Lapsed Subdivision1 Granted Exercised2 Cancelled Lapsed 31/12/2011 HK$ Grant Date Exercisable Period
Continuous contract 1,973,600 – (1,302,600) – – 671,000 – (1,342,000) – – – 6.72 20/6/2005 20/6/2008 – 19/6/2011
Employees 5,414,200 – (2,136,200) – – 3,278,000 – (1,220,000) – – 5,336,000 6.72 20/6/2005 20/6/2009 – 19/6/2012
462,000 – (231,000) – – 231,000 – (462,000) – – – 6.86 23/1/2006 20/6/2008 – 19/6/2011
462,000 – – – – 462,000 – – – – 924,000 6.86 23/1/2006 20/6/2009 – 19/6/2012
194,000 – – – – 194,000 – (388,000) – – – 7.82 19/6/2006 20/6/2008 – 19/6/2011
260,000 – – – – 260,000 – (100,000) – – 420,000 7.82 19/6/2006 20/6/2009 – 19/6/2012
372,000 – (184,000) – – 188,000 – (248,000) – (128,000) – 12.75 02/2/2007 20/6/2008 – 19/6/2011
1,472,000 – (128,000) – – 1,344,000 – – – – 2,688,000 12.75 02/2/2007 20/6/2009 – 19/6/2012
482,000 – – – – 482,000 – – (92,000) – 872,000 14.96 13/7/2007 20/6/2009 – 19/6/2012
6,931,000 – (4,568,000) (817,000) (1,546,000) – – – – – – 12.77 24/1/2008 01/3/2009 – 28/2/2011
18,325,400 – (5,255,000) – – 13,070,400 – (2,178,000) (60,000) – 23,902,800 12.77 24/1/2008 01/3/2010 – 29/2/2012
22,872,000 – (4,096,500) – – 18,775,500 – (1,620,000) (60,000) – 35,871,000 12.77 24/1/2008 01/3/2011 – 28/2/2013
922,000 – (541,000) (97,500) (283,500) – – – – – – 15.00 21/5/2008 01/3/2009 – 28/2/2011
1,020,500 – (333,500) – – 687,000 – (30,000) – – 1,344,000 15.00 21/5/2008 01/3/2010 – 29/2/2012
1,370,000 – (267,000) – – 1,103,000 – – – – 2,206,000 15.00 21/5/2008 01/3/2011 – 28/2/2013
389,200 – (173,700) (89,200) (126,300) – – – – – – 13.10 13/8/2008 01/3/2009 – 28/2/2011
1,107,900 – (294,000) – – 813,900 – (75,500) – – 1,552,300 13.10 13/8/2008 01/3/2010 – 29/2/2012
1,697,100 – (334,500) – – 1,362,600 – (122,400) – – 2,602,800 13.10 13/8/2008 01/3/2011 – 28/2/2013
794,000 – (332,000) – – 462,000 – (164,000) (76,000) – 684,000 8.61 24/2/2009 01/3/2010 – 29/2/2012
2,348,000 – (1,279,600) – – 1,068,400 – (472,800) (60,000) – 1,604,000 8.61 24/2/2009 01/3/2011 – 28/2/2013
1,274,500 – (79,300) – – 1,195,200 – (149,400) – – 2,241,000 13.90 14/8/2009 01/3/2010 – 29/2/2012
2,098,200 – (258,400) – – 1,839,800 – (63,200) – – 3,616,400 13.90 14/8/2009 01/3/2011 – 28/2/2013
2,556,100 – – – – 2,556,100 – – (599,600) – 4,512,600 20.76 25/3/2010 01/3/2011 – 28/2/2013
1,178,600 – – – – 1,178,600 – – – – 2,357,200 22.42 15/11/2010 01/3/2011 – 28/2/2013
– 15,781,0003 – – – 15,781,000 – – (142,000) – 31,420,000 20.21 11/4/2011 01/5/2012 – 30/4/2015
– 16,057,0003 – – – 16,057,000 – – (150,000) – 31,964,000 20.21 11/4/2011 01/5/2013 – 30/4/2015
– 39,922,0003 – – – 39,922,000 – – (218,000) – 79,626,000 20.21 11/4/2011 01/5/2014 – 30/4/2016
– – – – – – 2,162,0004 – (123,000) – 2,039,000 15.20 21/11/2011 01/5/2012 – 30/4/2015
– – – – – – 4,476,0004 – (248,000) – 4,228,000 15.20 21/11/2011 01/5/2013 – 30/4/2015
– – – – – – 10,011,0004 – (554,000) – 9,457,000 15.20 21/11/2011 01/5/2014 – 30/4/2016
– – – – – – 2,000,0005 – – – 2,000,000 14.50 22/12/2011 01/5/2013 – 30/4/2015
– – – – – – 2,000,0005 – – – 2,000,000 14.50 22/12/2011 01/5/2014 – 30/4/2016
– – – – – – 2,000,0005 – – – 2,000,000 14.50 22/12/2011 01/5/2015 – 30/4/2017
– – – – – – 2,000,0005 – – – 2,000,000 14.50 22/12/2011 01/5/2016 – 30/4/2018
– – – – – – 2,000,0005 – – – 2,000,000 14.50 22/12/2011 01/5/2017 – 30/4/2019
– – – – – – 2,000,0005 – – – 2,000,000 14.50 22/12/2011 01/5/2018 – 30/4/2020
– – – – – – 2,000,0005 – – – 2,000,000 14.50 22/12/2011 01/5/2019 – 30/4/2021
– – – – – – 2,000,0005 – – – 2,000,000 14.50 22/12/2011 01/5/2020 – 30/4/2022
– – – – – – 2,000,0005 – – – 2,000,000 14.50 22/12/2011 01/5/2021 – 30/4/2023
NOTES:(1) At the 2011 Annual General Meeting of the Company held on 18 May 2011, an ordinary resolution was duly passed under which each of the existing
issued and unissued shares of HK$0.025 each in the share capital of the Company as of 19 May 2011 was subdivided (the “Share Subdivision”) into two shares of HK$0.0125 each.
All the Share Options which were granted and remained outstanding as of 19 May 2011 were adjusted with the Share Subdivision and accordingly, the number of Share Options increased by one share for each share in the Share Options and the subscription prices per Share were adjusted by half.
(2) The weighted average closing market price per Share immediately before the dates on which the Share Options were exercised was HK$20.86.
(3) The closing market price per Share as at the date preceding the date on which the share options were granted was HK$20.25.
(4) The closing market price per Share as at the date preceding the date on which the share options were granted was HK$15.04.
(5) The closing market price per Share as at the date preceding the date on which the share options were granted was HK$14.56.
(6) The above options granted are recognized as expenses in the accounts in accordance with the Company’s accounting policy as set out in Note 1.16(d) to the accounts. Other details of Share Options granted by the Company are set out in Note 25 to the accounts.

56 LI & FUNG LIMITED | ANNUAL REPORT 2011
REPORT OF THE DIRECTORS (CONTINUED)
(iv) Limit for each participant
The total number of Shares of the Company issued and to
be issued upon exercise of options (whether exercised or
outstanding) granted in any 12-month period to each participant
must not exceed 1% of the Shares of the Company in issue.
(v) Option period
The period within which the Shares must be taken up an option
shall be determined by the Board in its absolute discretion at
the time of grant, but such period must not exceed 10 years
from the date of grant of the relevant option.
The Board has the authority to determine the minimum period
for which an option must be held before it can vest. The Option
Scheme itself does not specify any minimum holding period.
(vi) Acceptance and payment on acceptance
An offer of the grant of an option shal l remain open for
acceptance for a period of 28 days from the date of offer (or
such longer period as the Board may specify in writing).
HK$1.00 is payable by the grantee to the Company on
acceptance of the offer.
(vii) Subscription price
The exercise price must be at least the higher of (i) the closing
price of the Shares as stated in the Stock Exchange’s daily
quotations sheet of The Stock Exchange of Hong Kong Limited
(“Stock Exchange”) on the date of grant; ( i i ) the average
closing prices of the Shares as stated in the Stock Exchange’s
daily quotation sheets for the five business days immediately
preceding the date of grant; and (iii) the nominal value of a
share.
(viii) Remaining life of the Option Scheme
The Board is entitled at any time within 10 years between
12 May 2003 and 11 May 2013 to offer the grant of an option
to any qualifying participants.
Details of the Option Scheme are as follows:
(i) Purpose
The purpose of the Option Scheme is to attract and retain the
best quality personnel for the development of the Company’s
businesses; to provide additional incentive to the employees
including any execut ive or non-execut ive director and
officer of the Company or any affiliate, consultants, agents,
representatives, advisers, customers, contractors, business
allies and joint venture partners; and to promote the long term
financial success of the Company by aligning the interests of
the option holders to the shareholders of the Company.
(ii) Qualifying participants
Any employee including any executive or non-executive
director of the Company or any affiliate, any consultant, agent,
representative, adviser, customer, contractor, business ally or
joint venture partner of the Company or any affiliate.
(iii) Maximum number of shares
The total number of shares which may be issued upon exercise
of all options to be granted under the Option Scheme must
not in aggregate exceed 10% of the issued share capital of the
Company at the date of approval of the Option Scheme or 30%
of the issued share capital of the Company from time to time.
By an ordinary resolution passed at the 2010 Annual General
Meeting of the Company held on 18 May 2010 relating to the
refreshing of the scheme limit on grant of options under the
Option Scheme and any other share option scheme(s) of the
Company, the scheme limit on grant of options was refreshed.
As a result, the number of Shares available for issue in respect
thereof is 565,658,886 Shares representing 6.97% of the
issued shares of the Company as at the date of this Report.
Notwithstanding the foregoing, the maximum number of shares
which may be issued upon exercise of all outstanding options
granted and yet to be exercised under the Option Scheme and
any other share option scheme(s) of the Company must not, in
aggregate, exceed 30% of the total number of issued shares of
the Company from time to time.
57LI & FUNG LIMITED | ANNUAL REPORT 2011
REPORT OF THE DIRECTORS (CONTINUED)
During the year, the Group also engaged in certain continuing
connected transactions as set out below:
(i) Pursuant to the master agreement for leasing of properties
that the Company entered into with LF 1937 on 13 January
2011, the Group leased certain properties from LF 1937
and its associates for the period from 1 January 2011 to
31 December 2013. As LF 1937 is a substantial shareholder
of the Company, LF 1937 and its associates are connected
persons of the Company and the transactions contemplated
under the master leasing agreement constitute continuing
connected transactions of the Company under the Main
Board Listing Rules. In such respect, the Group paid
rental expenses of US$23,913,000 for the year ended
31 December 2011.
(ii) Integrated Distribution Services Group Limited (“IDS Group”)
became a wholly owned subsidiary of the Company effective
on 29 October 2010. As a result, continuing connected
transactions of IDS Group, such as (a) distribution of
products to; (b) purchase of various products from; and
(c) provision of various logistics services to, LF 1937 and
its associates may become non-fully exempt continuing
connected transactions of the Company. For the year ended
31 December 2011, the applicable percentage ratios of the
Company in respect of each category of these transactions
were less than 0.1%.
Non-exempt continuing connected transactions of the Company
have been reviewed by the Independent Non-executive
Directors of the Company. The Independent Non-executive
Directors confirmed that the aforesaid non-exempt continuing
connected transactions were entered into (a) in the ordinary
and usual course of business of the Group; (b) either on normal
commercial terms or on terms no less favourable to the Group
than terms available to or from independent third parties; and
(c) in accordance with the relevant agreements governing them
on terms that are fair and reasonable and in the interests of the
shareholders of the Company as a whole.
SUBSIDIARIESDetails of the Company’s principal subsidiaries at 31 December
2011 are set out in Note 41 to the accounts.
ASSOCIATED COMPANIESDetails of the Company’s principal associated companies at
31 December 2011 are set out in Note 41 to the accounts.
MAJOR CUSTOMERS AND SUPPLIERSDuring 2011, the Group purchased less than 30% of its goods
and services from its five largest suppliers. The percentage
of sales attributable to the Group’s five largest customers
combined was also less than 30% of its total sales.
During 2010, the Group purchased less than 30% of its goods
and services from its five largest suppliers. The percentage
of sales attributable to the Group’s largest customer and the
five largest customers combined were 14.5% and 32.5%
respectively.
CONNECTED TRANSACTION AND CONTINUING CONNECTED TRANSACTIONSDuring the year, the Group entered into the following connected
transactions which were subject to reporting and announcement
requirements but exempt from the independent shareholders’
approval requirement.
(i) On 30 June 2011, the Group entered into agreements to
dispose of properties in Turkey and Taiwan and the entire
registered capital of a subsidiary incorporated in the PRC to
entities indirectly wholly owned by Dr. William Fung Kwok
Lun and a trust established for the family of Dr. Victor Fung
Kwok King at an aggregate consideration of approximately
US$26,720,000. The considerations for the properties were
determined by reference to valuations of certain independent
professional valuers.
(ii) On the same date, the Group entered into an agreement
to dispose of the Group’s medical equipment businesses
in East Malaysia, Indonesia, Singapore and West Malaysia
to subsidiaries of Li & Fung (Distribution) Limited at an
aggregate consideration of approximately US$57,700,000.
Li & Fung (Distribution) Limited is a wholly owned subsidiary
of LF 1937, which is a substantial shareholder of the
Company.

58 LI & FUNG LIMITED | ANNUAL REPORT 2011
REPORT OF THE DIRECTORS (CONTINUED)
The Company’s auditor was engaged to report on the Group’s
continuing connected transactions in accordance with Hong
Kong Standard on Assurance Engagements 3000 “Assurance
Engagements Other Than Audits or Reviews of Historical
Financial Information” and with reference to Practice Note
740 “Auditor’s Letter on Continuing Connected Transactions
under the Hong Kong Listing Rules” issued by the Hong Kong
Institute of Certified Public Accountants. The auditor has issued
his unqualified letter containing his findings and conclusions in
respect of the continuing connected transactions in accordance
with the Main Board List ing Rule 14A.38. A copy of the
auditor’s letter has been provided by the Company to The
Stock Exchange of Hong Kong Limited.
PENSION SCHEME ARRANGEMENTSWith effect from 1 December 2000, the mandatory provident
fund (the “MPF Scheme”) was set up by the Mandatory
Provident Fund Authority of Hong Kong. The MPF Scheme
is a defined contribution retirement benefit scheme and
administered by independent trustees. Both the employer and
the employees have to contribute an amount equal to 5% of
the relevant income of such employee to the MPF Scheme.
Contributions from the employer are 100% vested in the
employees as soon as they are paid to the MPF Scheme and
subject to certain conditions being met, all benefits derived
from the mandatory contributions must be preserved until the
employee either reaches the normal retirement age of 65 or
meets certain specified conditions whichever is earlier.
In Taiwan, the Group operates a defined contribution provident
scheme for its employees with the contributions set at 6%
of the employees’ basic salaries. In addition, the Group also
participates in a retirement benefit plan in accordance with local
statutory requirements. Under this plan, the Group recognized
pension cost monthly at 3% of the employees’ salaries, which is
contributed monthly to an independent fund.
In the United Kingdom, the Group participates in a defined
benefit scheme for its employees. The Group and its employees
make monthly contributions to the scheme based on 15.7%
and 5% of the employees’ salary respectively.
In Korea, the Group and each of its employees are required
to contribute 4.5% of the employee’s monthly salary to a
government established pension corporation pursuant to the
statutory requirement. Upon retirement, an employee is entitled
to receive a lump sum payment.
In Indonesia and Thailand, the Group participates in a defined
contribution provident scheme for its empolyees with the
contribution set at 3.7% and 7% of the employees’ basic
salaries respectively. In addition, the Group also participates in
a defined benefit retirement scheme in accordance with local
statutory requirement.
The provident fund schemes for staff of the Group in other
regions follow the local requirements.
The Group’s pension scheme contributions charged/(credited) to the consolidated profit and loss account for the year are as follows:
US$’000
Contributions to the MPF Scheme 4,870
Contributions forfeited by employees (1,142)
Contributions to the defined contribution provident scheme and defined benefits plan in Taiwan 2,120
Contributions to the defined benefits scheme in the United Kingdom 178
Contributions pursuant to the statutory requirements in Korea 1,152
Contributions to the defined contribution provident scheme and defined benefits plan in Indonesia and Thailand 2,701
Contributions pursuant to local requirements in other overseas regions 40,304
50,183
59LI & FUNG LIMITED | ANNUAL REPORT 2011
REPORT OF THE DIRECTORS (CONTINUED)
Al l d i rectors o f the Company, inc lud ing independent
non-executive directors, are subject to retirement by rotation at
annual general meetings in accordance with bye-law 110(A) of
the Company’s bye-laws.
Mr Spencer Theodore Fung, Professor Frankl in Warren
McFarlan and Mr Martin Tang Yue Nien will retire by rotation at
the forthcoming Annual General Meeting. They, being eligible,
will offer themselves for re-election.
I n acco rdance w i t h bye - l aw 101 o f t he Company ’ s
bye-laws, Dr Fu Yuning who was appointed by the directors
during the year, will retire and, being eligible, offer himself for
re-election.
The biographical details of the directors as at the date of this
Report are set out in the Directors and Senior Management
section on pages 46 to 51.
DIRECTORS’ SERVICE CONTRACTSUnder a service contract dated 2 June 1992 between the
Company and Dr William Fung Kwok Lun and a service contract
dated 2 June 1992 between Li & Fung (B.V.I.) Limited and
Dr William Fung Kwok Lun, Dr William Fung Kwok Lun has been
appointed to act as Managing Director of the Company, Li &
Fung (Trading) Limited, Li & Fung (Properties) Limited and Li
& Fung (B.V.I.) Limited, in each case for an initial period of five
years from 1 April 1992 and thereafter unless terminated by not
less than 12 calendar months’ notice in writing expiring at the
end of such initial period or any subsequent month.
Apart from the above, none of the directors who are proposed
for re-election at the forthcoming Annual General Meeting has a
service contract with the Group which is not determinable within
one year without payment of compensation other than statutory
compensation.
DIRECTORS’ INTERESTS IN CONTRACTSNo contracts of significance in relation to the Group’s business
to which the Company or its subsidiaries was a party and
in which a director of the Company had a material interest,
whether directly or indirectly, subsisted at the end of the year or
at any time during the year.
DIRECTORSThe directors during the year were:
Non-Executive Directors: Executive Directors:
Victor Fung Kwok King, Chairman William Fung Kwok Lun, Deputy Chairman
Paul Edward Selway-Swift* Bruce Philip Rockowitz, Group President &
Chief Executive OfficerAllan Wong Chi Yun*
Franklin Warren McFarlan* Spencer Theodore Fung
Makoto Yasuda* (retired on 18 May 2011)
Martin Tang Yue Nien*
Benedict Chang Yew Teck (appointed on 1 February 2011)
Fu Yuning* (appointed on 1 November 2011)
* Independent Non-executive Directors
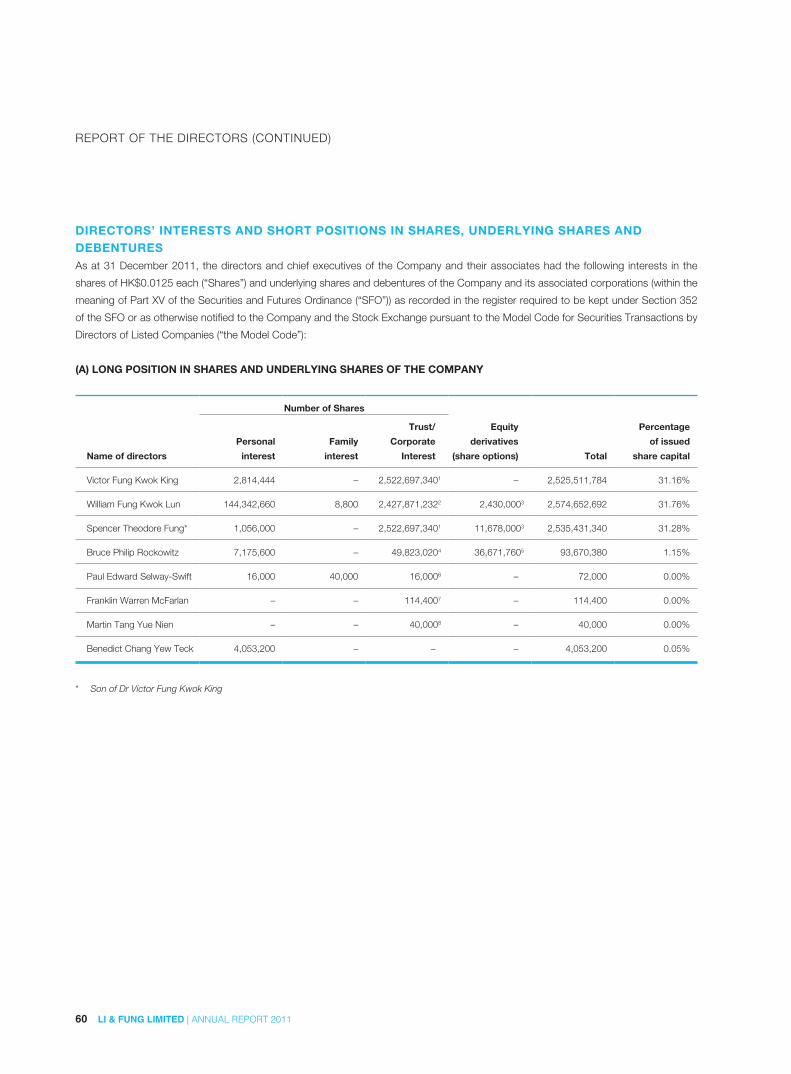
60 LI & FUNG LIMITED | ANNUAL REPORT 2011
REPORT OF THE DIRECTORS (CONTINUED)
DIRECTORS’ INTERESTS AND SHORT POSITIONS IN SHARES, UNDERLYING SHARES AND DEBENTURESAs at 31 December 2011, the directors and chief executives of the Company and their associates had the following interests in the
shares of HK$0.0125 each (“Shares”) and underlying shares and debentures of the Company and its associated corporations (within the
meaning of Part XV of the Securities and Futures Ordinance (“SFO”)) as recorded in the register required to be kept under Section 352
of the SFO or as otherwise notified to the Company and the Stock Exchange pursuant to the Model Code for Securities Transactions by
Directors of Listed Companies (“the Model Code”):
(A) LONG POSITION IN SHARES AND UNDERLYING SHARES OF THE COMPANY
Number of Shares
Name of directors
Personal
interest
Family
interest
Trust/
Corporate
Interest
Equity
derivatives
(share options) Total
Percentage
of issued
share capital
Victor Fung Kwok King 2,814,444 – 2,522,697,3401 – 2,525,511,784 31.16%
William Fung Kwok Lun 144,342,660 8,800 2,427,871,2322 2,430,0003 2,574,652,692 31.76%
Spencer Theodore Fung* 1,056,000 – 2,522,697,3401 11,678,0003 2,535,431,340 31.28%
Bruce Philip Rockowitz 7,175,600 – 49,823,0204 36,671,7605 93,670,380 1.15%
Paul Edward Selway-Swift 16,000 40,000 16,0006 – 72,000 0.00%
Franklin Warren McFarlan – – 114,4007 – 114,400 0.00%
Martin Tang Yue Nien – – 40,0008 – 40,000 0.00%
Benedict Chang Yew Teck 4,053,200 – – – 4,053,200 0.05%
* Son of Dr Victor Fung Kwok King

61LI & FUNG LIMITED | ANNUAL REPORT 2011
REPORT OF THE DIRECTORS (CONTINUED)
The following simplified chart illustrates the interests of Dr Victor Fung Kwok King and Mr Spencer Theodore Fung under note (1) below
and the interest of Dr William Fung Kwok Lun under note (2) below:
28.99%
100%
0.40%
1.73%
50%
2.37%
50%
LI & FUNG LIMITED(33.49%)
KING LUN HOLDINGS LIMITED
(NOTE 1(b))
LI & FUNG (1937) LIMITED
(NOTE 1(c))
WILLIAM FUNG KWOK LUN(NOTE 2)
HSBC TRUSTEE (C.I.) LIMITED(NOTE 1)
NOTES:
As at 31 December 2011,
(1) each of Dr Victor Fung Kwok King and Mr Spencer Theodore Fung
was deemed to have interests in 2,522,697,340 Shares held in the
following manner:
(a) 111,650,000 Shares were directly held by HSBC Trustee (C.I.)
Limited (“HSBC Trustee”) as trustee of a trust established for
the benefit of the family members of Dr Victor Fung Kwok King
(the “Trust”), and 29,201,708 Shares were indirectly held by
HSBC Trustee through its wholly owned subsidiary, First Island
Developments Limited (“First Island”). With effect from 19 January
2012, HSBC Trustee has transferred 111,650,000 Shares to First
Island;
(b) 32,891,760 Shares were directly held by King Lun Holdings
Limited (“King Lun”), a private company incorporated in the British
Virgin Islands owned as to 50% by HSBC Trustee as trustee of
the Trust and 50% by Dr William Fung Kwok Lun; and
(c) 2,195,727,908 Shares were directly held by Li & Fung (1937)
Limited (“LF (1937)”), a wholly owned subsidiary of King Lun, and
153,225,964 Shares were indirectly held by LF (1937) through its
wholly owned subsidiary, Li & Fung (Distribution) Limited (“LFD”).
(2) Out of 2,427,871,232 Shares, 26,114,400 Shares and 19,911,200
Shares were held by Golden Step Limited and Step Dragon
Enterprise Limited, both companies were beneficially owned by
Dr William Fung Kwok Lun. The balance of 2,381,845,632 Shares
were directly and indirectly held by King Lun as mentioned in Note (1)
(b) and (c) above.
(3) these interests represented the interests in underlying shares in
respect of share options granted by the Company to these directors
as beneficial owners, the details of which are set out in the Share
Options section stated below.
(4) 49,823,020 Shares in the Company were held by Hurr icane
Millennium Holdings Limited (“HMHL”), a company beneficially owned
by a trust which had been set up for the benefit of family members of
Mr Bruce Philip Rockowitz.
(5) these interests represented:
(a) the beneficial interest of Mr Bruce Philip Rockowitz in 3,780,000
underlying shares in respect of share options granted by the
Company to Mr Bruce Philip Rockowitz, the details of which are
set out in the Share Options section stated below; and
(b) the deemed interest of Mr Bruce Philip Rockowitz in 32,891,760
underlying shares in the Company in respect of options granted
by King Lun to HMHL to purchase such shares in the Company
in three tranches during the period from 25 December 2011 to
24 December 2019 with each tranche having an exercisable
period of six years pursuant to an agreement made between King
Lun and HMHL.
(6) 16,000 Shares in the Company were held by a trust of which
Mr. Paul Edward Selway-Swift is a beneficiary.
(7) 114,400 Shares in the Company were held by a trust established for
the benefit of Professor Franklin Warren McFarlan.
(8) 40,000 Shares in the Company were held by a trust of which
Mr Martin Tang Yue Nien was a beneficiary.
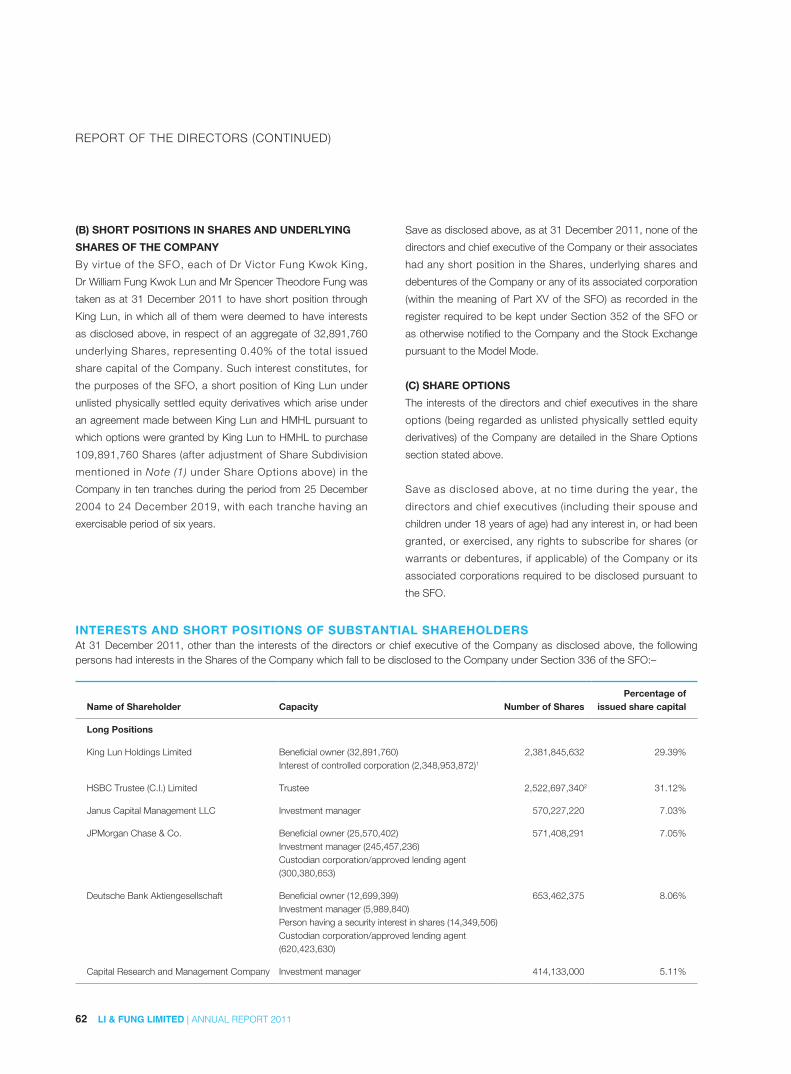
62 LI & FUNG LIMITED | ANNUAL REPORT 2011
REPORT OF THE DIRECTORS (CONTINUED)
INTERESTS AND SHORT POSITIONS OF SUBSTANTIAL SHAREHOLDERSAt 31 December 2011, other than the interests of the directors or chief executive of the Company as disclosed above, the following persons had interests in the Shares of the Company which fall to be disclosed to the Company under Section 336 of the SFO:–
Name of Shareholder Capacity Number of SharesPercentage of
issued share capital
Long Positions
King Lun Holdings Limited Beneficial owner (32,891,760) 2,381,845,632 29.39%Interest of controlled corporation (2,348,953,872)1
HSBC Trustee (C.I.) Limited Trustee 2,522,697,3402 31.12%
Janus Capital Management LLC Investment manager 570,227,220 7.03%
JPMorgan Chase & Co. Beneficial owner (25,570,402) 571,408,291 7.05%Investment manager (245,457,236)Custodian corporation/approved lending agent (300,380,653)
Deutsche Bank Aktiengesellschaft Beneficial owner (12,699,399) 653,462,375 8.06%Investment manager (5,989,840)Person having a security interest in shares (14,349,506)Custodian corporation/approved lending agent (620,423,630)
Capital Research and Management Company Investment manager 414,133,000 5.11%
(B) SHORT POSITIONS IN SHARES AND UNDERLYING
SHARES OF THE COMPANY
By virtue of the SFO, each of Dr Victor Fung Kwok King,
Dr William Fung Kwok Lun and Mr Spencer Theodore Fung was
taken as at 31 December 2011 to have short position through
King Lun, in which all of them were deemed to have interests
as disclosed above, in respect of an aggregate of 32,891,760
underlying Shares, representing 0.40% of the total issued
share capital of the Company. Such interest constitutes, for
the purposes of the SFO, a short position of King Lun under
unlisted physically settled equity derivatives which arise under
an agreement made between King Lun and HMHL pursuant to
which options were granted by King Lun to HMHL to purchase
109,891,760 Shares (after adjustment of Share Subdivision
mentioned in Note (1) under Share Options above) in the
Company in ten tranches during the period from 25 December
2004 to 24 December 2019, with each tranche having an
exercisable period of six years.
Save as disclosed above, as at 31 December 2011, none of the
directors and chief executive of the Company or their associates
had any short position in the Shares, underlying shares and
debentures of the Company or any of its associated corporation
(within the meaning of Part XV of the SFO) as recorded in the
register required to be kept under Section 352 of the SFO or
as otherwise notified to the Company and the Stock Exchange
pursuant to the Model Mode.
(C) SHARE OPTIONS
The interests of the directors and chief executives in the share
options (being regarded as unlisted physically settled equity
derivatives) of the Company are detailed in the Share Options
section stated above.
Save as disclosed above, at no time during the year, the
directors and chief executives (including their spouse and
children under 18 years of age) had any interest in, or had been
granted, or exercised, any rights to subscribe for shares (or
warrants or debentures, if applicable) of the Company or its
associated corporations required to be disclosed pursuant to
the SFO.

63LI & FUNG LIMITED | ANNUAL REPORT 2011
REPORT OF THE DIRECTORS (CONTINUED)
MANAGEMENT CONTRACTSNo contracts concerning the management and administration of the whole or any substantial part of the business of the Company were entered into or existed during the year.
CORPORATE GOVERNANCEPrincipal corporate governance practices as adopted by the Company are set out in the Corporate Governance section on pages 24 to 39.
DIRECTORS’ RESPONSIBILITIES FOR THE ACCOUNTSThe Directors are responsible for the preparation of accounts for each financial period which give a true and fair view of the state of affairs of the Group and of the results and cash flows for that period. In preparing these accounts for the year ended31 December 2011 the Directors have selected suitable accounting policies and applied them consistently; made judgments and estimates that are prudent and reasonable; and have prepared the accounts on the going concern basis. The Directors are responsible for keeping proper accounting records which disclose with reasonable accuracy at any time the financial position of the Group.
AUDITORThe accounts have been audited by PricewaterhouseCoopers who ret i re and, being el ig ible, of fer themselves for re-appointment.
On behalf of the BoardVictor FUNG Kwok KingChairman
Hong Kong, 22 March 2012
Name of Shareholder Capacity Number of SharesPercentage of
issued share capital
Short Positions
King Lun Holdings Limited Beneficial owner 32,891,7603 0.40%
HSBC Trustee (C.I.) Limited Trustee 32,891,7604 0.40%
JPMorgan Chase & Co. Beneficial owner 7,531,101 0.09%
Deutsche Bank Aktiengesellschaft Beneficial owner (5,529,993) 16,752,199 0.20%Person having a security interest in shares (11,222,206)
Lending Pool
JPMorgan Chase & Co. Custodian corporation/approved lending agent 300,380,653 3.70%
Deutsche Bank Aktiengesellschaft Custodian corporation/approved lending agent 620,423,630 7.65%
NOTES:As at 31 December 2011,
(1) 2,195,727,908 Shares were directly held by LF (1937) which also through its wholly owned subsidiary, LFD, indirectly held 153,225,964 Shares. LF (1937) was a wholly owned subsidiary of King Lun. Both of Dr Victor Fung Kwok King and Dr William Fung Kwok Lun were directors of King Lun, LF (1937) and LFD.
(2) Please refer to Note (1) under the Directors’ Interests and Short Positions in Shares, Underlying Shares and Debentures section stated above.
(3) This short posit ion represented King Lun’s short posit ion in 32,891,760 underlying shares which constitutes unlisted physically settled equity derivatives pursuant to arrangement as described in the Directors’ Interests and Short Positions in Shares, Underlying Shares and Debentures section stated above.
(4) HSBC Trustee was taken to have short posit ion in the same underlying shares held by King Lun.
Save as disclosed above, the Company had not been notified of any short positions being held by any substantial shareholder in the Shares or underlying shares of the Company as at 31 December 2011.
PUBLIC FLOATBased on the information that is publicly available to the Company and within the knowledge of the Directors of the Company, as at the date of this report, there is sufficient public float of more than 25% of the Company’s issued shares as required under the Listing Rules.
SENIOR MANAGEMENTThe biographical details of the senior management as at the date of this Report are set out in the Directors and Senior Management section on pages 46 to 51.

INDEPENDENT AUDITOR’S REPORT
64 LI & FUNG LIMITED | ANNUAL REPORT 2011
TO THE SHAREHOLDERS OF LI & FUNG LIMITED
(incorporated in Bermuda with limited liability)
We have audited the consolidated accounts of Li & Fung Limited (the “Company”) and its subsidiaries (together, the “Group”) set out
on pages 67 to 159, which comprise the consolidated and company balance sheets as at 31 December 2011, and the consolidated
profit and loss account, the consolidated statement of comprehensive income, the consolidated statement of changes in equity and
the consolidated cash flow statement for the year then ended, and a summary of significant accounting policies and other explanatory
information.
DIRECTORS’ RESPONSIBILITY FOR THE CONSOLIDATED ACCOUNTSThe directors of the Company are responsible for the preparation of consolidated accounts that give a true and fair view in accordance
with Hong Kong Financial Reporting Standards issued by the Hong Kong Institute of Certified Public Accountants and the disclosure
requirements of the Hong Kong Companies Ordinance, and for such internal control as the directors determine is necessary to enable
the preparation of consolidated accounts that are free from material misstatement, whether due to fraud or error.
AUDITOR’S RESPONSIBILITYOur responsibility is to express an opinion on these consolidated accounts based on our audit and to report our opinion solely to
you, as a body, in accordance with Section 90 of the Companies Act 1981 of Bermuda and for no other purpose. We do not assume
responsibility towards or accept liability to any other person for the contents of this report.
We conducted our audit in accordance with Hong Kong Standards on Auditing issued by the Hong Kong Institute of Certified Public
Accountants. Those standards require that we comply with ethical requirements and plan and perform the audit to obtain reasonable
assurance about whether the consolidated accounts are free from material misstatement.
An audit involves performing procedures to obtain audit evidence about the amounts and disclosures in the consolidated accounts.
The procedures selected depend on the auditor’s judgment, including the assessment of the risks of material misstatement of the
consolidated accounts, whether due to fraud or error. In making those risk assessments, the auditor considers internal control relevant
to the entity’s preparation of consolidated accounts that give a true and fair view in order to design audit procedures that are appropriate
in the circumstances, but not for the purpose of expressing an opinion on the effectiveness of the entity’s internal control. An audit also
includes evaluating the appropriateness of accounting policies used and the reasonableness of accounting estimates made by the
directors, as well as evaluating the overall presentation of the consolidated accounts.
We believe that the audit evidence we have obtained is sufficient and appropriate to provide a basis for our audit opinion.

65LI & FUNG LIMITED | ANNUAL REPORT 2011
INDEPENDENT AUDITOR’S REPORT (CONTINUED)
OPINIONIn our opinion, the consolidated accounts give a true and fair view of the state of affairs of the Company and of the Group as at 31
December 2011, and of the Group’s profit and cash flows for the year then ended in accordance with Hong Kong Financial Reporting
Standards and have been properly prepared in accordance with the disclosure requirements of the Hong Kong Companies Ordinance.
PricewaterhouseCoopers
Certified Public Accountants
Hong Kong, 22 March 2012
66 LI & FUNG LIMITED | ANNUAL REPORT 2011
STATEMENT OF ACCOUNTS
67 Consolidated Profit and Loss Account
68 Consolidated Statement of Comprehensive Income
69 Consolidated Balance Sheet
71 Balance Sheet
72 Consolidated Statement of Changes in Equity
74 Consolidated Cash Flow Statement
Notes to the Accounts
75 1 Basis of Preparation and Principal Accounting Policies
91 2 Critical Accounting Estimates and Judgments
92 3 Segment Information
96 4 Operating Profit
97 5 Interest Expenses
98 6 Taxation
100 7 Profit Attributable to Shareholders of the Company
100 8 Earnings per Share
100 9 Dividends
101 10 Staff Costs Including Directors’ Emoluments
101 11 Directors’ and Senior Management’s Emoluments
105 12 Intangible Assets
108 13 Property, Plant and Equipment
109 14 Prepaid Premium for Land Leases
110 15 Interests in Subsidiaries
110 16 Associated Companies
111 17 Available-for-sale Financial Assets
112 18 Inventories
113 19 Due from/(to) Related Companies
113 20 Derivative Financial Instruments
114 21 Trade and Other Receivables
117 22 Cash and Cash Equivalents
117 23 Trade and Other Payables
118 24 Bank Borrowings
120 25 Share Capital and Options
123 26 Reserves
127 27 Long-term Liabilities
129 28 Post-employment Benefit Obligations
132 29 Deferred Taxation
135 30 Notes to the Consolidated Cash Flow Statement
138 31 Business Combinations
141 32 Contingent Liabilities
141 33 Commitments
142 34 Charges on Assets
142 35 Related Party Transactions
143 36 Financial Risk Management
146 37 Capital Risk Management
147 38 Fair Value Estimation
148 39 Events after Balance Sheet Date
148 40 Approval of Accounts
149 41 Principal Subsidiaries and Associated Companies
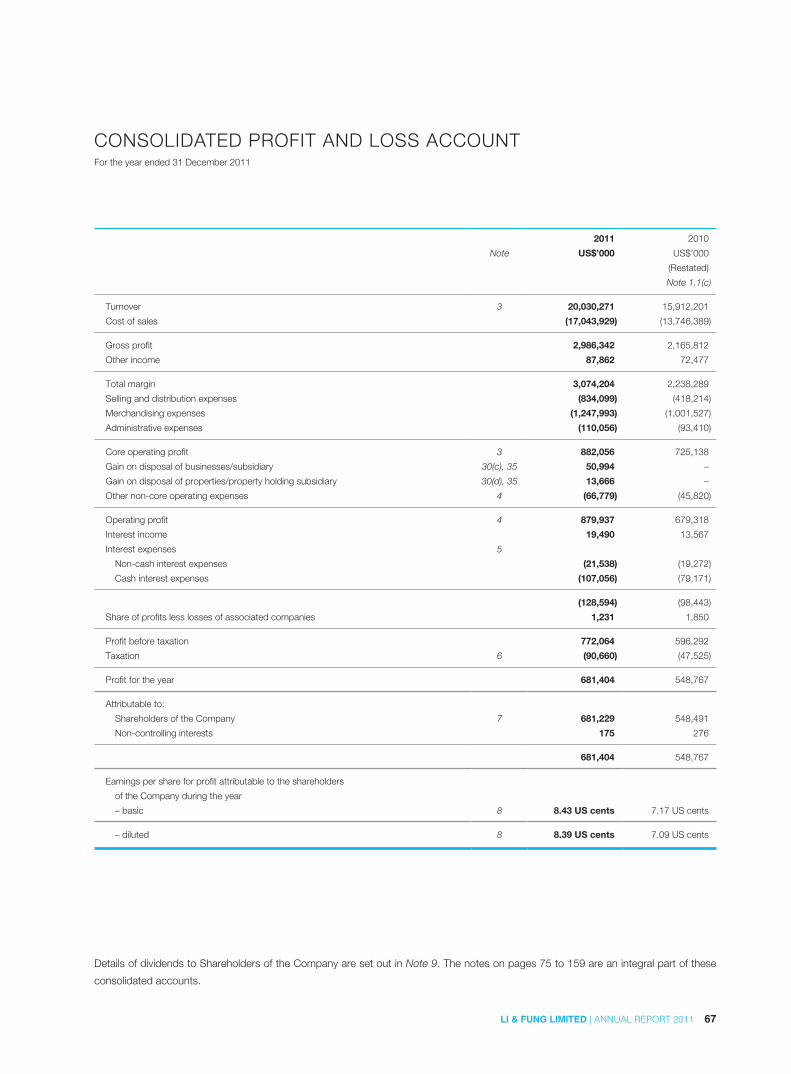
CONSOLIDATED PROFIT AND LOSS ACCOUNTFor the year ended 31 December 2011
67LI & FUNG LIMITED | ANNUAL REPORT 2011
2011 2010
Note US$’000 US$’000
(Restated)
Note 1.1(c)
Turnover 3 20,030,271 15,912,201
Cost of sales (17,043,929) (13,746,389)
Gross profit 2,986,342 2,165,812
Other income 87,862 72,477
Total margin 3,074,204 2,238,289
Selling and distribution expenses (834,099) (418,214)
Merchandising expenses (1,247,993) (1,001,527)
Administrative expenses (110,056) (93,410)
Core operating profit 3 882,056 725,138
Gain on disposal of businesses/subsidiary 30(c), 35 50,994 –
Gain on disposal of properties/property holding subsidiary 30(d), 35 13,666 –
Other non-core operating expenses 4 (66,779) (45,820)
Operating profit 4 879,937 679,318
Interest income 19,490 13,567
Interest expenses 5
Non-cash interest expenses (21,538) (19,272)
Cash interest expenses (107,056) (79,171)
(128,594) (98,443)
Share of profits less losses of associated companies 1,231 1,850
Profit before taxation 772,064 596,292
Taxation 6 (90,660) (47,525)
Profit for the year 681,404 548,767
Attributable to:
Shareholders of the Company 7 681,229 548,491
Non-controlling interests 175 276
681,404 548,767
Earnings per share for profit attributable to the shareholders
of the Company during the year
– basic 8 8.43 US cents 7.17 US cents
– diluted 8 8.39 US cents 7.09 US cents
Details of dividends to Shareholders of the Company are set out in Note 9. The notes on pages 75 to 159 are an integral part of these
consolidated accounts.
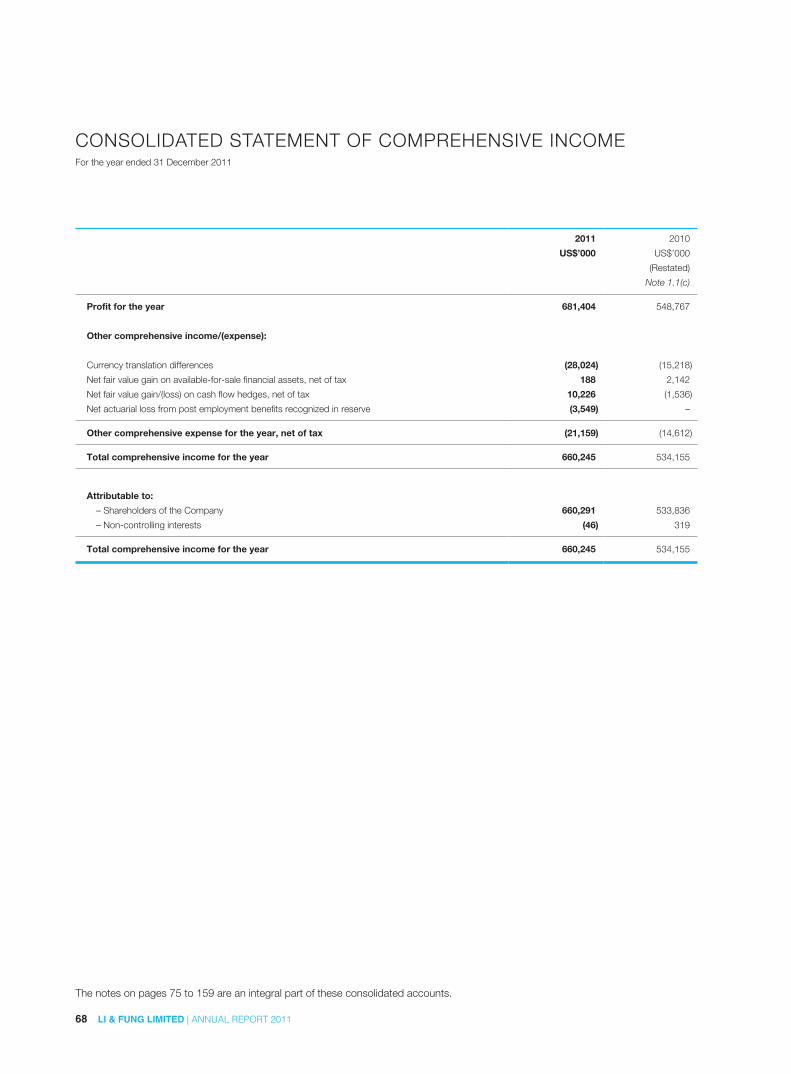
68 LI & FUNG LIMITED | ANNUAL REPORT 2011
CONSOLIDATED STATEMENT OF COMPREHENSIVE INCOMEFor the year ended 31 December 2011
2011 2010
US$’000 US$’000
(Restated)
Note 1.1(c)
Profit for the year 681,404 548,767
Other comprehensive income/(expense):
Currency translation differences (28,024) (15,218)
Net fair value gain on available-for-sale financial assets, net of tax 188 2,142
Net fair value gain/(loss) on cash flow hedges, net of tax 10,226 (1,536)
Net actuarial loss from post employment benefits recognized in reserve (3,549) –
Other comprehensive expense for the year, net of tax (21,159) (14,612)
Total comprehensive income for the year 660,245 534,155
Attributable to:
– Shareholders of the Company 660,291 533,836
– Non-controlling interests (46) 319
Total comprehensive income for the year 660,245 534,155
The notes on pages 75 to 159 are an integral part of these consolidated accounts.

69LI & FUNG LIMITED | ANNUAL REPORT 2011
CONSOLIDATED BALANCE SHEETAs at 31 December 2011
As at 31 December As at 1 January
2011 2010 2010
Note US$’000 US$’000 US$’000
(Restated) (Restated)
Note 1.1(c) Note 1.1(c)
Non-current assets
Intangible assets 12 6,525,999 4,882,166 2,333,657
Property, plant and equipment 13 325,432 309,186 160,988
Prepaid premium for land leases 14 3,144 3,814 311
Associated companies 16 7,015 6,140 3,622
Available-for-sale financial assets 17 70,574 84,330 92,331
Deposits 21 12,537 10,200 8,633
Deferred tax assets 29 24,148 20,195 7,459
6,968,849 5,316,031 2,607,001
Current assets
Inventories 18 1,035,788 768,687 305,466
Due from related companies 19 16,948 13,163 12,655
Trade and bills receivable 21 2,004,542 2,079,012 1,610,433
Other receivables, prepayments and deposits 21 454,310 348,396 290,321
Derivative financial instruments 20 13,743 – 336
Cash and bank balances 22 426,240 968,530 538,752
3,951,571 4,177,788 2,757,963
Current liabilities
Due to related companies 19 12,675 6,531 –
Trade and bills payable 23 2,336,991 2,208,404 1,539,117
Accrued charges and sundry payables 23 734,213 581,980 389,732
Balance of purchase consideration payable for acquisitions
to be settled by cash 27 323,712 248,314 145,983
Balance of purchase consideration payable for acquisitions
to be settled by shares issued and held by escrow agent 27 1,764 16,646 41,500
Taxation 103,006 94,238 66,791
Derivative financial instruments 20 – 1,892 –
Bank advances for discounted bills 21 40,298 41,905 38,734
Short-term bank loans 24 111,936 89,154 –
Bank overdrafts 22, 24 225 28,298 6,066
3,664,820 3,317,362 2,227,923
Net current assets 286,751 860,426 530,040
Total assets less current liabilities 7,255,600 6,176,457 3,137,041
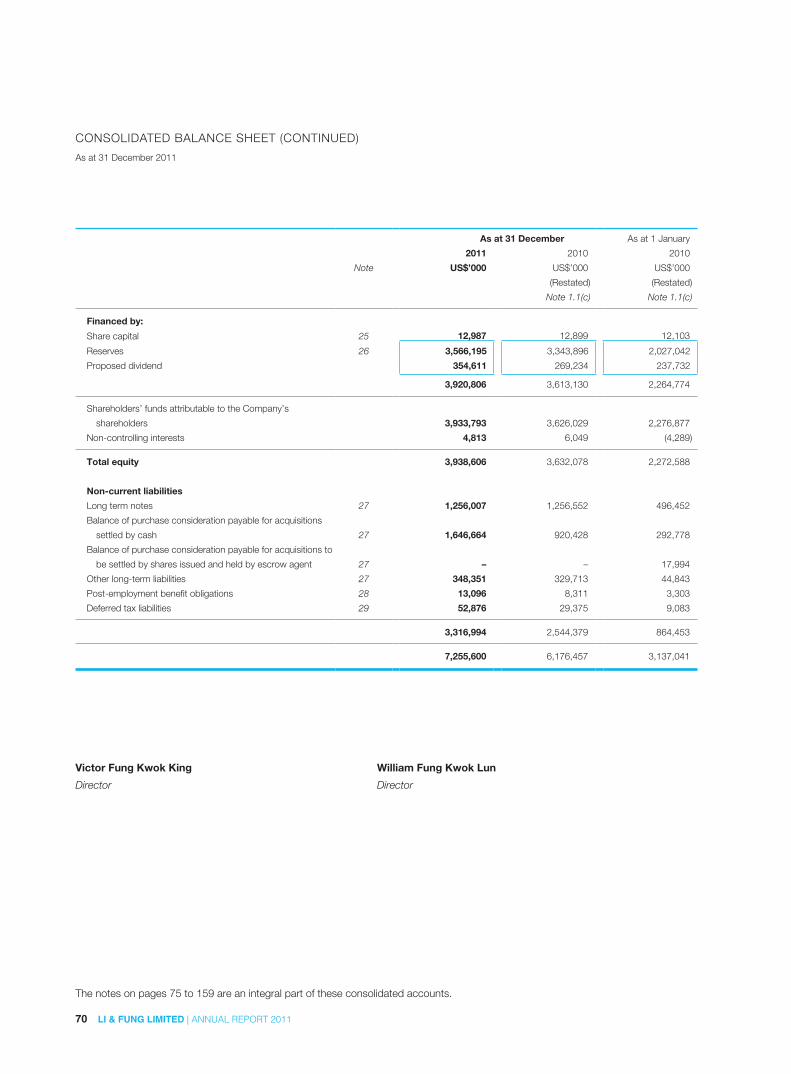
70 LI & FUNG LIMITED | ANNUAL REPORT 2011
CONSOLIDATED BALANCE SHEET (CONTINUED)
As at 31 December 2011
As at 31 December As at 1 January
2011 2010 2010
Note US$’000 US$’000 US$’000
(Restated) (Restated)
Note 1.1(c) Note 1.1(c)
Financed by:
Share capital 25 12,987 12,899 12,103
Reserves 26 3,566,195 3,343,896 2,027,042
Proposed dividend 354,611 269,234 237,732
3,920,806 3,613,130 2,264,774
Shareholders’ funds attributable to the Company’s
shareholders 3,933,793 3,626,029 2,276,877
Non-controlling interests 4,813 6,049 (4,289)
Total equity 3,938,606 3,632,078 2,272,588
Non-current liabilities
Long term notes 27 1,256,007 1,256,552 496,452
Balance of purchase consideration payable for acquisitions
settled by cash 27 1,646,664 920,428 292,778
Balance of purchase consideration payable for acquisitions to
be settled by shares issued and held by escrow agent 27 – – 17,994
Other long-term liabilities 27 348,351 329,713 44,843
Post-employment benefit obligations 28 13,096 8,311 3,303
Deferred tax liabilities 29 52,876 29,375 9,083
3,316,994 2,544,379 864,453
7,255,600 6,176,457 3,137,041
Victor Fung Kwok King William Fung Kwok Lun
Director Director
The notes on pages 75 to 159 are an integral part of these consolidated accounts.
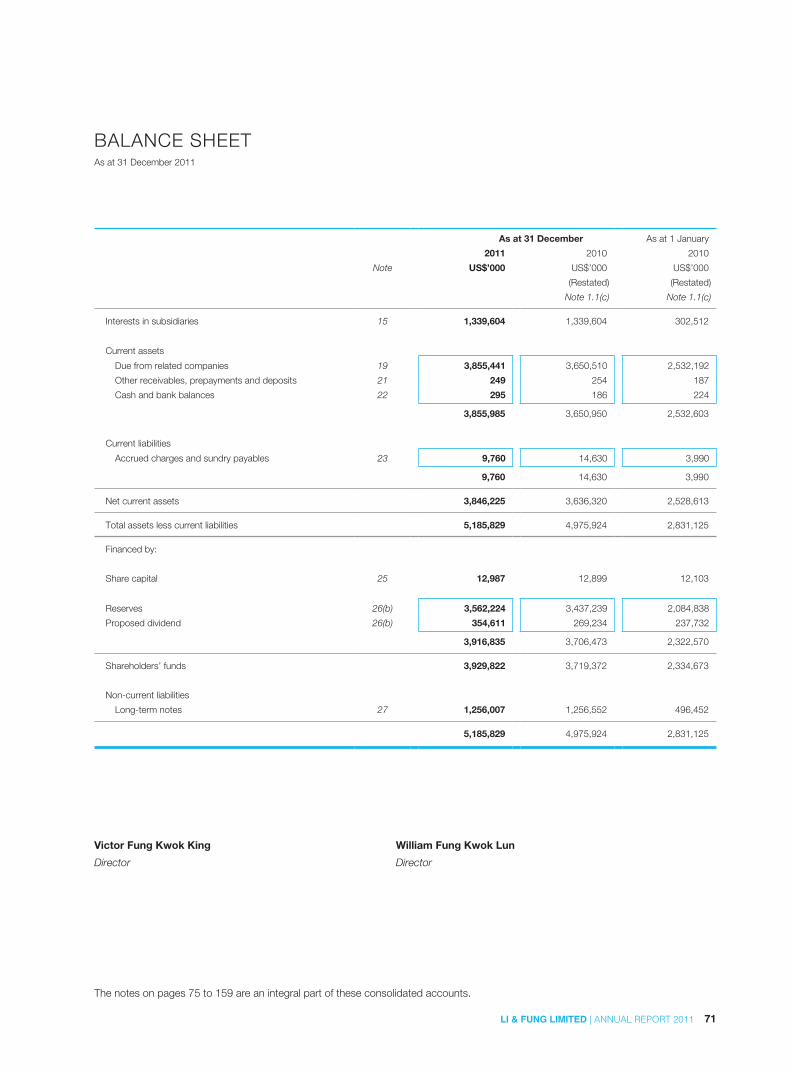
71LI & FUNG LIMITED | ANNUAL REPORT 2011
BALANCE SHEETAs at 31 December 2011
As at 31 December As at 1 January
2011 2010 2010
Note US$’000 US$’000 US$’000
(Restated) (Restated)
Note 1.1(c) Note 1.1(c)
Interests in subsidiaries 15 1,339,604 1,339,604 302,512
Current assets
Due from related companies 19 3,855,441 3,650,510 2,532,192
Other receivables, prepayments and deposits 21 249 254 187
Cash and bank balances 22 295 186 224
3,855,985 3,650,950 2,532,603
Current liabilities
Accrued charges and sundry payables 23 9,760 14,630 3,990
9,760 14,630 3,990
Net current assets 3,846,225 3,636,320 2,528,613
Total assets less current liabilities 5,185,829 4,975,924 2,831,125
Financed by:
Share capital 25 12,987 12,899 12,103
Reserves 26(b) 3,562,224 3,437,239 2,084,838
Proposed dividend 26(b) 354,611 269,234 237,732
3,916,835 3,706,473 2,322,570
Shareholders’ funds 3,929,822 3,719,372 2,334,673
Non-current liabilities
Long-term notes 27 1,256,007 1,256,552 496,452
5,185,829 4,975,924 2,831,125
Victor Fung Kwok King William Fung Kwok Lun
Director Director
The notes on pages 75 to 159 are an integral part of these consolidated accounts.
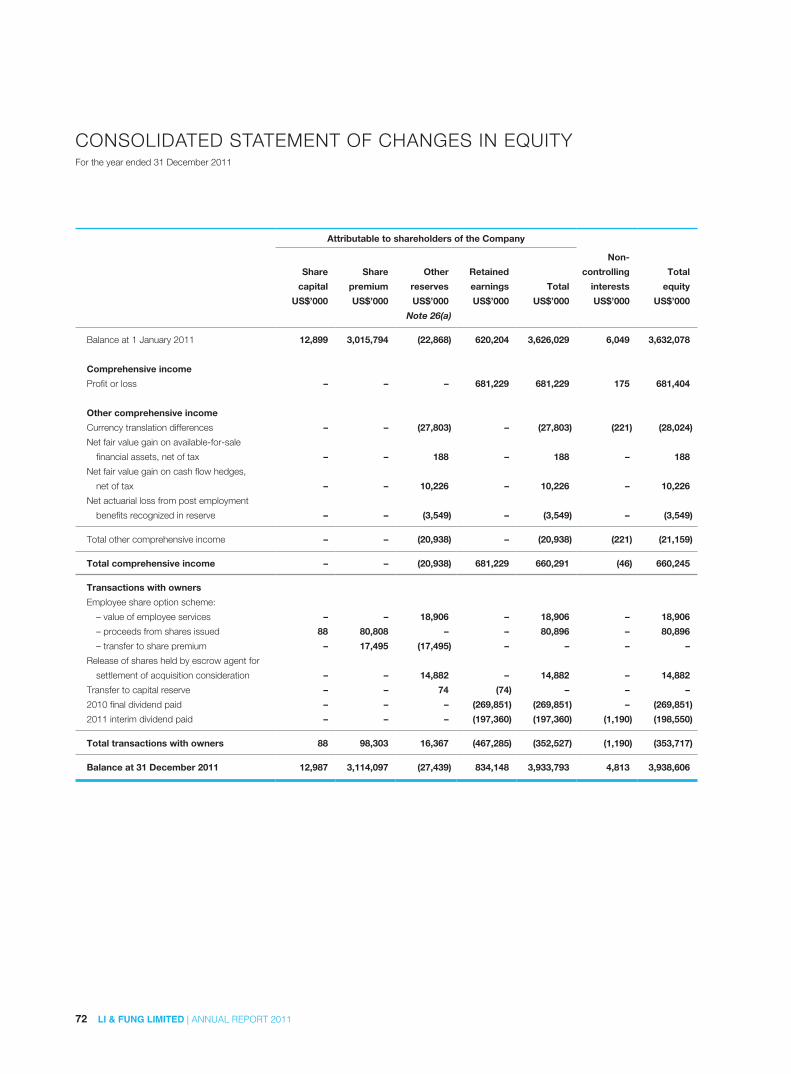
72 LI & FUNG LIMITED | ANNUAL REPORT 2011
CONSOLIDATED STATEMENT OF CHANGES IN EQUITYFor the year ended 31 December 2011
Attributable to shareholders of the Company
Share
capital
Share
premium
Other
reserves
Retained
earnings Total
Non-
controlling
interests
Total
equity
US$’000 US$’000 US$’000 US$’000 US$’000 US$’000 US$’000
Note 26(a)
Balance at 1 January 2011 12,899 3,015,794 (22,868) 620,204 3,626,029 6,049 3,632,078
Comprehensive income
Profit or loss – – – 681,229 681,229 175 681,404
Other comprehensive income
Currency translation differences – – (27,803) – (27,803) (221) (28,024)
Net fair value gain on available-for-sale
financial assets, net of tax – – 188 – 188 – 188
Net fair value gain on cash flow hedges,
net of tax – – 10,226 – 10,226 – 10,226
Net actuarial loss from post employment
benefits recognized in reserve – – (3,549) – (3,549) – (3,549)
Total other comprehensive income – – (20,938) – (20,938) (221) (21,159)
Total comprehensive income – – (20,938) 681,229 660,291 (46) 660,245
Transactions with owners
Employee share option scheme:
– value of employee services – – 18,906 – 18,906 – 18,906
– proceeds from shares issued 88 80,808 – – 80,896 – 80,896
– transfer to share premium – 17,495 (17,495) – – – –
Release of shares held by escrow agent for
settlement of acquisition consideration – – 14,882 – 14,882 – 14,882
Transfer to capital reserve – – 74 (74) – – –
2010 final dividend paid – – – (269,851) (269,851) – (269,851)
2011 interim dividend paid – – – (197,360) (197,360) (1,190) (198,550)
Total transactions with owners 88 98,303 16,367 (467,285) (352,527) (1,190) (353,717)
Balance at 31 December 2011 12,987 3,114,097 (27,439) 834,148 3,933,793 4,813 3,938,606

73LI & FUNG LIMITED | ANNUAL REPORT 2011
CONSOLIDATED STATEMENT OF CHANGES IN EQUITY (CONTINUED)
For the year ended 31 December 2011
Attributable to shareholders of the Company
Share
capital
Share
premium
Other
reserves
Retained
earnings Total
Non-
controlling
interests
Total
equity
US$’000 US$’000 US$’000 US$’000 US$’000 US$’000 US$’000
Note 26(a)
Balance at 1 January 2010 –
Restated (Note 1.1(c)) 12,103 1,818,277 (50,335) 496,832 2,276,877 (4,289) 2,272,588
Comprehensive income
Profit or loss – – – 548,491 548,491 276 548,767
Other comprehensive income
Currency translation differences – – (15,261) – (15,261) 43 (15,218)
Net fair value gain on available-for-sale
financial assets, net of tax – – 2,142 – 2,142 – 2,142
Net fair value loss on cash flow hedges,
net of tax – – (1,536) – (1,536) – (1,536)
Total other comprehensive income – – (14,655) – (14,655) 43 (14,612)
Total comprehensive income – – (14,655) 548,491 533,836 319 534,155
Transactions with owners
Employee share option scheme:
– value of employee services – – 33,281 – 33,281 – 33,281
– proceeds from share issued 169 143,287 – – 143,456 – 143,456
– transfer to share premium – 27,330 (27,330) – – – –
Release of shares held by escrow agent for
settlement of acquisition consideration – – 36,109 – 36,109 – 36,109
Transfer to capital reserve – – 62 (62) – – –
2009 final dividend paid – – – (239,241) (239,241) (559) (239,800)
2010 interim dividend paid – – – (185,816) (185,816) – (185,816)
Issue of shares for privatization of IDS 627 1,026,900 – – 1,027,527 – 1,027,527
Acquisition of businesses/subsidiaries – – – – – 10,578 10,578
Total transactions with owners 796 1,197,517 42,122 (425,119) 815,316 10,019 825,335
Balance at 31 December 2010 –
Restated (Note 1.1(c)) 12,899 3,015,794 (22,868) 620,204 3,626,029 6,049 3,632,078
The notes on pages 75 to 159 are an integral part of these consolidated accounts.
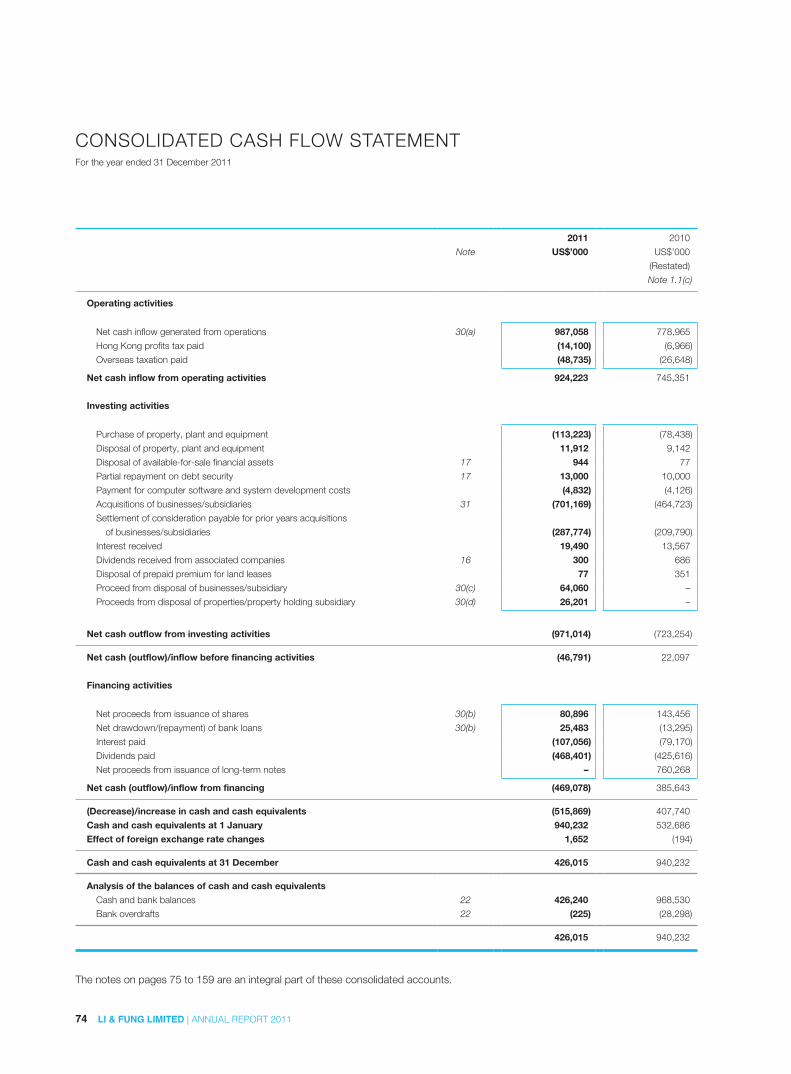
CONSOLIDATED CASH FLOW STATEMENTFor the year ended 31 December 2011
74 LI & FUNG LIMITED | ANNUAL REPORT 2011
2011 2010
Note US$’000 US$’000
(Restated)
Note 1.1(c)
Operating activities
Net cash inflow generated from operations 30(a) 987,058 778,965
Hong Kong profits tax paid (14,100) (6,966)
Overseas taxation paid (48,735) (26,648)
Net cash inflow from operating activities 924,223 745,351
Investing activities
Purchase of property, plant and equipment (113,223) (78,438)
Disposal of property, plant and equipment 11,912 9,142
Disposal of available-for-sale financial assets 17 944 77
Partial repayment on debt security 17 13,000 10,000
Payment for computer software and system development costs (4,832) (4,126)
Acquisitions of businesses/subsidiaries 31 (701,169) (464,723)
Settlement of consideration payable for prior years acquisitions
of businesses/subsidiaries (287,774) (209,790)
Interest received 19,490 13,567
Dividends received from associated companies 16 300 686
Disposal of prepaid premium for land leases 77 351
Proceed from disposal of businesses/subsidiary 30(c) 64,060 –
Proceeds from disposal of properties/property holding subsidiary 30(d) 26,201 –
Net cash outflow from investing activities (971,014) (723,254)
Net cash (outflow)/inflow before financing activities (46,791) 22,097
Financing activities
Net proceeds from issuance of shares 30(b) 80,896 143,456
Net drawdown/(repayment) of bank loans 30(b) 25,483 (13,295)
Interest paid (107,056) (79,170)
Dividends paid (468,401) (425,616)
Net proceeds from issuance of long-term notes – 760,268
Net cash (outflow)/inflow from financing (469,078) 385,643
(Decrease)/increase in cash and cash equivalents (515,869) 407,740
Cash and cash equivalents at 1 January 940,232 532,686
Effect of foreign exchange rate changes 1,652 (194)
Cash and cash equivalents at 31 December 426,015 940,232
Analysis of the balances of cash and cash equivalents
Cash and bank balances 22 426,240 968,530
Bank overdrafts 22 (225) (28,298)
426,015 940,232
The notes on pages 75 to 159 are an integral part of these consolidated accounts.

NOTES TO THE ACCOUNTS
75LI & FUNG LIMITED | ANNUAL REPORT 2011
1 BASIS OF PREPARATION AND PRINCIPAL ACCOUNTING POLICIESThe basis of preparation and principal accounting policies applied in the preparation of these consolidated accounts are set out below.
These policies have been consistently applied to all the years presented, unless otherwise stated.
1.1 BASIS OF PREPARATION
The consolidated accounts of Li & Fung Limited have been prepared in accordance with Hong Kong Financial Reporting Standards
(“HKFRSs”). They have been prepared under the historical cost convention, as modified by the inclusion of available-for-sale financial
assets, and financial assets and financial liabilities (including derivative instruments) at fair value through profit or loss.
The preparation of accounts in conformity with HKFRSs requires the use of certain critical accounting estimates. It also requires
management to exercise their judgment in the process of applying the Group’s accounting policies. The areas involving a higher degree
of judgment or complexity, or areas where assumptions and estimates are significant to the consolidated accounts, are disclosed in
Note 2.
(a) Revised and amended standards and interpretations adopted by the Group
The following revised and amended standards and interpretations of HKFRSs are mandatory for accounting periods beginning on or
after 1 January 2011 but they are not relevant to the Group’s operations:
HKAS 24 (revised) Related party disclosures
HKAS 32 (amendment) Classification of rights issues
HKFRS 1 (amendment) Limited exemption from comparative HKFRS 7 disclosures for first-time adopters
HK(IFRIC) – Int 14 (amendment) Prepayments of a minimum funding requirement
HK(IFRIC) – Int 19 Extinguishing financial liabilities with equity instruments
Third annual improvements project (2010) Improvements to HKFRS published in May 2010
(b) Standards and amendments to existing standards that have been issued but are not yet effective and have not been early adopted
by the Group
The following new standards and amendments to existing standards have been issued and are mandatory for the Group’s accounting
periods beginning on or after 1 January 2012 or later periods, but the Group has not early adopted them:
HKAS 1 (amendment) Presentation of financial statements3
HKAS 12 (amendment) Deferred tax: recovery of underlying assets2
HKAS 19 (amendment) Employee benefits4
HKFRS 1 (amendment) Severe hyperinflation and removal of fixed dates of first-time adopters1
HKFRS 7 (amendment) Disclosures – Transfers of financial assets1
HKFRS 9 Financial instruments4
HKFRS 10 and HKAS 27 (2011) Consolidated financial statements and Separate financial statements4
HKFRS 11 and HKAS 28 (2011) Joint arrangements and Associates and joint ventures4
HKFRS 12 Disclosure of interests in other entities4
HKFRS 13 Fair value measurements4
HK(IFRIC) – Int 20 Stripping costs in the production phase of a surface mine4
NOTES:1 Effective for annual periods beginning on or after 1 July 2011
2 Effective for annual periods beginning on or after 1 January 2012
3 Effective for annual periods beginning on or after 1 July 2012
4 Effective for annual periods beginning on or after 1 January 2013

76 LI & FUNG LIMITED | ANNUAL REPORT 2011
NOTES TO THE ACCOUNTS (CONTINUED)
1 BASIS OF PREPARATION AND PRINCIPAL ACCOUNTING POLICIES (CONTINUED)
1.1 BASIS OF PREPARATION (CONTINUED)
(b) Standards and amendments to existing standards that have been issued but are not yet effective and have not been early adopted
by the Group (continued)
The Group is in the process of making an assessment of the impact of these standards and amendments to existing standards upon
initial application. So far, it has concluded that these new standards and amendments to existing standards are unlikely to have a
significant impact on the Group’s results of operations and financial position.
(c) Changes in functional and presentation currencies
Items included in the accounts of each of the Group’s entities are measured using the currency of the primary economic environment in
which the entity operates (the “functional currency”).
In prior years, the Company regarded Hong Kong dollar (“HK dollar”) as its functional currency. However, as a result of the Group’s
continuous acquisitions in recent years, the Company and most of its major operating subsidiaries’ business transactions in terms of
operating, investing and financing activities have increasingly placed greater reliance on US dollar. As such, effective from 1 January
2011, the Company and certain of its subsidiaries have changed their functional currencies from HK dollar to US dollar. US dollar has
also been adopted as the presentation currency of the Group’s consolidated accounts.
The change in functional currency of the Company was applied prospectively from date of change in accordance with HKAS 21 “The
Effect of Changes in Foreign Exchange Rate”. On the date of the change of functional currency, all assets, liabilities, issued capital and
other components of equity and profit and loss account items were translated into US dollar at the exchange rate on that date.
The change in presentation currency of the Group has been applied retrospectively in accordance with HKAS 8 “Accounting Policies,
Changes in Accounting Estimates and Errors”, and the comparative figures as at 1 January 2010 and 31 December 2010 and for the
year ended 31 December 2010 have also been restated to US dollar accordingly.
The changes in functional and presentation currencies have no significant impact on the financial positions of the Group as at 1 January
2010, 31 December 2010 and 2011, or the results and cash flows of the Group for the years ended 31 December 2010 and 2011.
77LI & FUNG LIMITED | ANNUAL REPORT 2011
NOTES TO THE ACCOUNTS (CONTINUED)
1 BASIS OF PREPARATION AND PRINCIPAL ACCOUNTING POLICIES (CONTINUED)
1.2 CONSOLIDATION
The consolidated accounts include the accounts of the Company and all its subsidiaries made up to 31 December 2011.
(a) Subsidiaries
Subsidiaries are all entities over which the Group has the power to govern the financial and operating policies generally accompanying a
shareholding of more than one half of the voting rights. The existence and effect of potential voting rights that are currently exercisable or
convertible are considered when assessing whether the Group controls another entity. Subsidiaries are fully consolidated from the date
on which control is transferred to the Group. They are de-consolidated from the date that control ceases.
The Group uses the acquisition method of accounting to account for business combinations. The consideration transferred for the
acquisition of a subsidiary is the fair values of the assets transferred, the liabilities incurred and the equity interests issued by the Group.
The consideration transferred includes the fair value of any asset or liability resulting from a contingent consideration arrangement.
Business acquisition-related costs are expensed as incurred. Identifiable assets acquired and liabilities and contingent liabilities assumed
in a business combination are measured initially at their fair values at the acquisition date. On an acquisition-by-acquisition basis, the
Group recognises any non-controlling interest in the acquiree either at fair value or at the non-controlling interest’s proportionate share
of the acquiree’s net assets.
The excess of the consideration transferred, the amount of any non-controlling interest in the acquiree and the acquisition-date fair value
of any previous equity interest in the acquiree over the fair value of the identifiable net assets acquired is recorded as goodwill. If this is
less than the fair value of the net assets of the subsidiary acquired in the case of a bargain purchase, the difference is recognised directly
in the statement of comprehensive income (Note 1.6).
Inter-company transactions, balances and unrealized gains on transactions between group companies are eliminated. Unrealized losses
are also eliminated unless the transaction provides evidence of an impairment of the asset transferred. Accounting policies and financial
information of subsidiaries have been changed where necessary to ensure consistency with the policies adopted by the Group.
Investments in subsidiaries are accounted for at cost less impairment. Cost is adjusted to reflect changes in consideration arising from
contingent consideration amendments. Cost also includes direct attributable costs of investment.
In the Company’s balance sheet the investments in subsidiaries are stated at cost less provision for impairment losses (Note 1.7). The
results of subsidiaries are accounted for by the Company on the basis of dividend received and receivable.
(b) Transactions with non-controlling interests
The Group treats transactions with non-controlling interests that do not result in loss of control as transactions with equity owners of the
Group. For purchases from non-controlling interests, the difference between any consideration paid and the relevant share acquired of
the carrying value of net assets of the subsidiary is recorded in equity. Gains or losses on disposals to non-controlling interests are also
recorded in equity.

78 LI & FUNG LIMITED | ANNUAL REPORT 2011
NOTES TO THE ACCOUNTS (CONTINUED)
1 BASIS OF PREPARATION AND PRINCIPAL ACCOUNTING POLICIES (CONTINUED)
1.2 CONSOLIDATION (CONTINUED)
(c) Associated companies
Associated companies are all entities over which the Group has significant influence but not control, generally accompanying a
shareholding of between 20% and 50% of the voting rights. Investments in associated companies are accounted for using the equity
method of accounting and are initially recognized at cost, and the carrying amount is increased or decreased to recognize the investor’s
share of the profit or loss of the investee after the date of acquisition. The Group’s investment in associated companies includes goodwill
(net of any accumulated impairment loss) identified on acquisition (Note 1.6).
The Group’s share of its associated companies’ post-acquisition profits or losses is recognized in the consolidated profit and loss
account, and its share of post-acquisition movements in other comprehensive income is recognized in other comprehensive income.
The cumulative post-acquisition movements are adjusted against the carrying amount of the investment.
When the group’s share of losses in an associate equals or exceeds its interest in the associate, including any other unsecured
receivables, the Group does not recognise further losses, unless it has incurred legal or constructive obligations or made payments on
behalf of the associate.
The group determines at each reporting date whether there is any objective evidence that the investment in the associate is impaired. If
this is the case, the Group calculates the amount of impairment as the difference between the recoverable amount of the associate and
its carrying value and recognises the amount adjacent to “share of profits less losses of an associated companies” in the consolidated
profit and loss account.
Unrealized gains on transactions between the Group and its associated companies are eliminated to the extent of the Group’s interest
in the associated companies. Unrealized losses are also eliminated unless the transaction provides evidence of an impairment of the
asset transferred. The financial information of associated companies has been changed where necessary to ensure consistency with the
policies adopted by the Group.
Dilution gains and losses in associates are recognized in the consolidated profit and loss account.
1.3 SEGMENT REPORTING
Operating segments are reported in a manner consistent with the internal reporting provided to the chief operating decision-maker.
The chief operating decision-maker, who is responsible for allocating resources, assessing performance of the operating segments and
making strategic decisions.
1.4 FOREIGN CURRENCY TRANSLATION
(a) Functional and presentation currency
Items included in the accounts of each of the Group’s entities are measured using the currency of the primary economic environment
in which the entity operates (“the functional currency”). The consolidated accounts are presented in US dollar, which is the Company’s
functional and presentation currency (Note 1.1(c)).
79LI & FUNG LIMITED | ANNUAL REPORT 2011
NOTES TO THE ACCOUNTS (CONTINUED)
1 BASIS OF PREPARATION AND PRINCIPAL ACCOUNTING POLICIES (CONTINUED)
1.4 FOREIGN CURRENCY TRANSLATION (CONTINUED)
(b) Transactions and balances
Foreign currency transactions are translated into the functional currency using the exchange rates prevailing at the dates of the
transactions or revaluation where items are re-measured. Foreign exchange gains and losses resulting from the settlement of such
transactions and from the translation at year-end exchange rates of monetary assets and liabilities denominated in foreign currencies are
recognized in the consolidated profit and loss account, except when deferred in equity as qualifying cash flow hedges or qualifying net
investment hedges.
Changes in the fair value of monetary securities denominated in foreign currency classified as available-for-sale are analyzed between
translation differences resulting from changes in the amortized cost of the security and other changes in the carrying amount of the
security. Translation differences related to changes in the amortized cost are recognized in profit or loss, and other changes in the
carrying amount are recognized in other comprehensive income.
Translation differences on non-monetary financial assets and liabilities such as equities held at fair value through profit or loss are
recognized in profit or loss as part of the fair value gain or loss. Translation differences on non-monetary financial assets such as equities
classified as available-for-sale are included in the available-for-sale reserve in other comprehensive income.
(c) Group companies
The results and financial position of all the Group entities (none of which has the currency of a hyperinflationary economy) that have a
functional currency different from the presentation currency are translated into the presentation currency as follows:
(i) assets and liabilities for each balance sheet presented are translated at the closing rate at the date of that balance sheet;
(ii) income and expenses for each profit and loss account are translated at average exchange rates (unless this average is not a
reasonable approximation of the cumulative effect of the rates prevailing on the transaction dates, in which case income and
expenses are translated at the dates of the transactions); and
(iii) all resulting exchange differences are recognized in other comprehensive income.
On consolidation, exchange differences arising from the translation of the net investment in foreign operations, and of borrowings and
other currency instruments designated as hedges of such investments, are taken to other comprehensive income.
On the disposal of a foreign operation (that is, a disposal of the group’s entire interest in a foreign operation, or a disposal involving loss
of control over a subsidiary that includes a foreign operation, a disposal involving loss of joint control over a jointly controlled entity that
includes a foreign operation, or a disposal involving loss of significant influence over an associate that includes a foreign operation), all
of the exchange differences accumulated in equity in respect of that operation attributable to the equity holders of the Company are
reclassified to profit or loss.

80 LI & FUNG LIMITED | ANNUAL REPORT 2011
NOTES TO THE ACCOUNTS (CONTINUED)
1 BASIS OF PREPARATION AND PRINCIPAL ACCOUNTING POLICIES (CONTINUED)
1.4 FOREIGN CURRENCY TRANSLATION (CONTINUED)
(c) Group companies (continued)
In the case of a partial disposal that does not result in the group losing control over a subsidiary that includes a foreign operation, the
proportionate share of accumulated exchange differences are re-attributed to non-controlling interests and are not recognised in profit
or loss. For all other partial disposals (that is, reductions in the group’s ownership interest in associates or jointly controlled entities that
do not result in the group losing significant influence or joint control) the proportionate share of the accumulated exchange difference is
reclassified to profit or loss.
Goodwill and fair value adjustments arising on the acquisition of a foreign entity are treated as assets and liabilities of the foreign entity
and translated at the closing rate. Exchange differences arising are recognised in equity.
1.5 PROPERTY, PLANT AND EQUIPMENT
(a) Land and buildings
Freehold land is stated at cost less impairment.
Buildings are stated at cost less accumulated depreciation and accumulated impairment losses.
(b) Other property, plant and equipment
Other property, plant and equipment, comprising leasehold improvements, furniture, fixtures and equipment, plant and machinery,
motor vehicles and company boat, are stated at cost less accumulated depreciation and accumulated impairment losses.
(c) Depreciation and impairment
Freehold land is not depreciated. Other classes of property, plant and equipment are depreciated at rates sufficient to allocate their
costs less accumulated impairment losses to their residual values over their estimated useful lives on a straight-line basis. The principal
annual rates are as follows:
Buildings and leasehold improvements 2% – 20%
Furniture, fixtures and equipment 62/3% – 331/3%
Plant and machinery 10% – 15%
Motor vehicles and company boat 15% – 20%
The assets’ residual values and useful lives are reviewed, and adjusted if appropriate, at the end of each reporting period. An asset’s
carrying amount is written down immediately to its recoverable amount if the asset’s carrying amount is greater than its estimated
recoverable amount (Note 1.7). Subsequent costs are included in the asset’s carrying amount or recognized as a separate asset, as
appropriate, only when it is probable that future economic benefits associated with the item will flow to the Group and the cost of the
item can be measured reliably. The carrying amount of the replaced part is derecognized. All other repair and maintenance costs are
expensed in the consolidated profit and loss account during the financial period in which they are incurred.
(d) Gain or loss on disposal
The gain or loss on disposal of property, plant and equipment is the difference between the net sales proceeds and the carrying amount
of the relevant item, and is recognized in the consolidated profit and loss account.

81LI & FUNG LIMITED | ANNUAL REPORT 2011
NOTES TO THE ACCOUNTS (CONTINUED)
1 BASIS OF PREPARATION AND PRINCIPAL ACCOUNTING POLICIES (CONTINUED)
1.6 INTANGIBLE ASSETS
(a) Goodwill
Goodwill represents the excess of the considerations transferred over the net fair value of the Group’s share of the net identifiable
assets/liabilities and contingent liabilities of the acquired business/subsidiary/associated company at the date of acquisition. Goodwill
on acquisitions of subsidiaries is included in intangible assets. Goodwill on acquisitions of associated companies is included in interests
in associated companies and is tested annually for impairment as part of the overall balance. Separately recognized goodwill is tested
annually for impairment and carried at cost less accumulated impairment losses. Impairment losses on goodwill are not reversed. Gains
and losses on the disposal of an entity include the carrying amount of goodwill relating to the entity sold.
Goodwill is allocated to cash-generating units for the purpose of impairment testing. The allocation is made to those cash-generating
units or groups of cash-generating units that are expected to benefit from the business combination in which the goodwill arose
identified according to operating segment. Each unit of groups of units to which the goodwill is allocated represent the lowest level
within the entity at which the goodwill is monitored for internal management purpose.
Goodwill impairment reviews are undertaken annually or more frequently if events or changes in circumstances indicate a potential
impairment. The carrying value of goodwill is compared to the recoverable amount, which is the higher of value in use and the fair value
less costs to sell. Any impairment is recognised immediately as an expense and is not subsequently reversed.
(b) Computer software and system development costs
Acquired computer software licences are capitalized on the basis of the costs incurred to acquire and bring to use the specific software.
These costs are amortized over the estimated useful lives of 3 to 10 years.
Costs associated with developing or maintaining computer software programmes are recognized as an expense as incurred. Costs that
are directly associated with the development of identifiable and unique software products controlled by the Group, and that will probably
generate economic benefits exceeding costs beyond one year, are recognized as intangible assets. Costs include the employee costs
incurred as a result of developing software and an appropriate portion of relevant overheads.
System development costs recognized as assets are amortized over their estimated useful lives of 3 to 10 years.
(c) Other intangible assets arising from business combinations
Intangible assets, other than goodwill, identified on business combinations are capitalized at their fair values. They represent mainly
trademarks, brandnames, buying agency and license agreements secured, relationships with customers and licensors. Intangible assets
arising from business combinations with definite useful lives are amortized on a straight-line basis from the date of acquisition over their
estimated useful lives ranging from 5 to 20 years.
(d) Brand licenses
Brand licenses are license contracts entered into with the brand-holders by the Group in the capacity as licensee. Brand licenses are
capitalized based on the upfront costs incurred and the present value of guaranteed royalty payments to be made subsequent to the
inception of the license contracts. Brand licenses are amortized based on expected usage from the date of first commercial usage over
the remaining licence periods ranging from approximately 1 to 10 years.

82 LI & FUNG LIMITED | ANNUAL REPORT 2011
NOTES TO THE ACCOUNTS (CONTINUED)
1 BASIS OF PREPARATION AND PRINCIPAL ACCOUNTING POLICIES (CONTINUED)
1.7 IMPAIRMENT OF INVESTMENTS IN SUBSIDIARIES, ASSOCIATED COMPANIES AND NON-FINANCIAL ASSETS
Assets that have an indefinite useful life, for example goodwill, are not subject to amortization and are tested annually for impairment.
Assets are reviewed for impairment whenever events or changes in circumstances indicate that the carrying amount may not be
recoverable. An impairment loss is recognized for the amount by which the asset’s carrying amount exceeds its recoverable amount.
The recoverable amount is the higher of an asset’s fair value less costs to sell and value in use. For the purposes of assessing
impairment, assets are grouped at the lowest levels for which there are separately identifiable cash flows (cash-generating units). Non-
financial assets other than goodwill that suffered an impairment are reviewed for possible reversal of the impairment at each reporting
date.
Impairment testing of the investments in subsidiaries or associates is required upon receiving dividends from these investments if the
dividend exceeds the total comprehensive income of the subsidiary or associate in the period the dividend is declared or if the carrying
amount of the investment in the separate financial statements exceeds the carrying amount in the consolidated financial statements of
the investee’s net assets including goodwill.
1.8 FINANCIAL ASSETS
Classification
The Group classifies its financial assets as either loans and receivables or available-for-sale. The classification depends on the purpose
for which the financial assets were acquired. Management determines the classification of its financial assets at initial recognition.
(a) Loans and receivables
Loans and receivables are non-derivative financial assets with fixed or determinable payments that are not quoted in an active market.
They are included in current assets, except for maturities greater than 12 months after the balance sheet date. These are classified
as non-current assets. The Group’s loans and receivables comprise “trade and bills receivable”, “other receivables, prepayments and
deposits”, “cash and bank balances” and “amount due from related companies” in the balance sheet (Note 1.11).
(b) Available-for-sale financial assets
Available-for-sale financial assets are non-derivatives that are either designated in this category or not classified in any other category.
They are included in non-current assets unless management intends to dispose of the investment within 12 months of the balance sheet
date.
Recognition and measurement
Regular purchases and sales of financial assets are recognized on the trade-date – the date on which the Group commits to purchase
or sell the asset. Investments are initially recognized at fair value plus transaction costs for all financial assets not carried at fair value
through profit or loss. Financial assets are derecognized when the rights to receive cash flows from the investments have expired or
have been transferred and the Group has transferred substantially all risks and rewards of ownership. Available-for-sale financial assets
are subsequently carried at fair value. Loans and receivables are subsequently carried at amortized cost using the effective interest
method.
Changes in the fair value of monetary securities denominated in a foreign currency and classified as available-for-sale are analyzed
between translation differences resulting from changes in amortized cost of the security and other changes in the carrying amount of the
security. The translation differences on monetary securities are recognized in consolidated profit or loss; translation differences on non-
monetary securities are recognized in other comprehensive income. Changes in the fair values of monetary and non-monetary securities
classified as available-for-sale are recognized in other comprehensive income.
83LI & FUNG LIMITED | ANNUAL REPORT 2011
NOTES TO THE ACCOUNTS (CONTINUED)
1 BASIS OF PREPARATION AND PRINCIPAL ACCOUNTING POLICIES (CONTINUED)
1.8 FINANCIAL ASSETS (CONTINUED)
Recognition and measurement (continued)
When securities classified as available-for-sale are sold or impaired, the accumulated fair value adjustments recognized in equity are
included in the consolidated profit and loss account as net investment loss.
Interest on available-for-sale securities calculated using the effective interest method is recognized in the consolidated profit and loss
account as part of interest income. Dividends on available-for-sale equity instruments are recognized in the consolidated profit and loss
account as part of other revenues when the Group’s right to receive payments is established.
1.9 IMPAIRMENT OF FINANCIAL ASSETS
(a) Assets carried at amortized cost
The Group assesses at the end of each reporting period whether there is objective evidence that a financial asset or group of financial
assets is impaired. A financial asset or a group of financial assets is impaired and impairment losses are incurred only if there is objective
evidence of impairment as a result of one or more events that occurred after the initial recognition of the asset (a ‘loss event’) and that
loss event (or events) has an impact on the estimated future cash flows of the financial asset or group of financial assets that can be
reliably estimated.
The criteria that the Group uses to determine that there is objective evidence of an impairment loss include:
• Significant financial difficulty of the issuer or obligor;
• A breach of contract, such as a default or delinquency in interest or principal payments;
• The Group, for economic or legal reasons relating to the borrower’s financial difficulty, granting to the borrower a concession that the
lender would not otherwise consider;
• It becomes probable that the borrower will enter bankruptcy or other financial reorganization;
• The disappearance of an active market for that financial asset because of financial difficulties; or
• Observable data indicating that there is a measurable decrease in the estimated future cash flows from a portfolio of financial assets
since the initial recognition of those assets, although the decrease cannot yet be identified with the individual financial assets in the
portfolio, including:
(i) adverse changes in the payment status of borrowers in the portfolio;
(ii) national or local economic conditions that correlate with defaults on the assets in the portfolio.
The Group first assesses whether objective evidence of impairment exists.

84 LI & FUNG LIMITED | ANNUAL REPORT 2011
NOTES TO THE ACCOUNTS (CONTINUED)
1 BASIS OF PREPARATION AND PRINCIPAL ACCOUNTING POLICIES (CONTINUED)
1.9 IMPAIRMENT OF FINANCIAL ASSETS (CONTINUED)
(a) Assets carried at amortized cost (continued)
The amount of the loss is measured as the difference between the asset’s carrying amount and the present value of estimated future
cash flows (excluding future credit losses that have not been incurred) discounted at the financial asset’s original effective interest rate.
The asset’s carrying amount is reduced and the amount of the loss is recognized in the consolidated profit and loss account. If a loan
has a variable interest rate, the discount rate for measuring any impairment loss is the current effective interest rate determined under
the contract. As a practical expedient, the Group may measure impairment on the basis of an instrument’s fair value using an observable
market price.
If, in a subsequent period, the amount of the impairment loss decreases and the decrease can be related objectively to an event
occurring after the impairment was recognized (such as an improvement in the debtor’s credit rating), the reversal of the previously
recognized impairment loss is recognized in the consolidated profit and loss account.
(b) Assets classified as available-for-sale
The Group assesses at the end of each reporting period whether there is objective evidence that a financial asset or a group of financial
assets is impaired. For debt securities, the Group uses the criteria refer to (a) above. In the case of equity investments classified as
available-for-sale, a significant or prolonged decline in the fair value of the security below its cost is also evidence that the assets are
impaired. If any such evidence exists for available-for-sale financial assets, the cumulative loss – measured as the difference between
the acquisition cost and the current fair value, less any impairment loss on that financial asset previously recognized in profit or loss – is
removed from equity and recognized in the consolidated profit and loss account. Impairment losses recognized in the consolidated profit
and loss account on equity instruments are not reversed through the consolidated profit and loss account. If, in a subsequent period,
the fair value of a debt instrument classified as available-for-sale increases and the increase can be objectively related to an event
occurring after the impairment loss was recognized in profit or loss, the impairment loss is reversed through the separate consolidated
profit and loss account.
1.10 INVENTORIES
Inventories comprise raw materials and finished goods and are stated at the lower of cost and net realisable value. Cost, calculated on a
first-in, first-out (FIFO) basis, comprises purchase prices of inventories and direct costs (based on normal operating capacity). It excludes
borrowing costs. Net realisable value is the estimated selling price in the ordinary course of business less applicable variable selling
expenses.
1.11 TRADE AND OTHER RECEIVABLES
Trade and other receivables are recognized initially at fair value and subsequently measured at amortized cost using the effective
interest method, less provision for impairment. If collection of trade and other receivables is expected in one year or less (or in the
normal operating cycle of the business if longer), they are classified as current asset. If not, they are presented as non-current assets.
A provision for impairment of trade and other receivables is established when there is objective evidence that the Group will not be able
to collect all amounts due according to the original terms of the receivables. Significant financial difficulties of the debtor, probability that
the debtor will enter bankruptcy or financial reorganisation, and default or delinquency in payments (more than 30 days overdue) are
considered indicators that the trade receivable is impaired. The amount of the provision is the difference between the asset’s carrying
amount and the present value of estimated future cash flows, discounted at the original effective interest rate. The carrying amount of
the assets is reduced through the use of an allowance account, and the amount of the loss is recognized in the consolidated profit and
loss account within selling expenses. When a trade receivable is uncollectible, it is written off against the allowance account for trade
receivables. Subsequent recoveries of amounts previously written off are credited against selling expenses in the consolidated profit and
loss account.

85LI & FUNG LIMITED | ANNUAL REPORT 2011
NOTES TO THE ACCOUNTS (CONTINUED)
1 BASIS OF PREPARATION AND PRINCIPAL ACCOUNTING POLICIES (CONTINUED)
1.12 SHARE CAPITAL
Ordinary shares are classified as equity.
Incremental costs directly attributable to the issue of new shares or options are shown in equity as a deduction, net of tax, from the
proceeds.
1.13 CASH AND CASH EQUIVALENTS
Cash and cash equivalents include cash in hand, deposits held at call with banks and bank overdrafts. Bank overdrafts are shown within
borrowings in current liabilities on the balance sheet.
1.14 BORROWINGS
Borrowings are recognized initially at fair value, net of transaction costs incurred. Borrowings are subsequently stated at amortized cost;
any difference between the proceeds (net of transaction costs) and the redemption value is recognized in the consolidated profit and
loss account over the period of the borrowings using the effective interest method.
Fees paid on the establishment of loan facilities are recognized as transaction costs of the loan to the extent that it is probable that
some or all of the facility will be drawn down. In this case, the fee is deferred until the draw-down occurs. To the extent there is no
evidence that it is probable that some or all of the facility will be drawn down, the fee is capitalized as a prepayment for liquidity services
and amortized over the period of the facility to which it relates.
Borrowings are classified as current liabilities unless the Group has an unconditional right to defer settlement of the liability for at least 12
months after the balance sheet date.
1.15 CURRENT AND DEFERRED TAX
The tax expense for the period comprises current and deferred tax. Tax is recognized in the consolidated profit and loss account,
except to the extent that it relates to items recognized in other comprehensive income or directly in equity. In this case the tax is also
recognized in other comprehensive income or directly in equity, respectively.
The current tax charge is calculated on the basis of the tax laws enacted or substantively enacted at the balance sheet date in the
countries where the Company’s subsidiaries and associates operate and generate taxable income. Management periodically evaluates
positions taken in tax returns with respect to situations in which applicable tax regulation is subject to interpretation and establishes
provisions where appropriate on the basis of amounts expected to be paid to the tax authorities.
Deferred tax is provided, using the liability method, on temporary differences arising between the tax bases of assets and liabilities and
their carrying amounts in the consolidated accounts. However, the deferred tax is not accounted for if it arises from initial recognition
of an asset or liability in a transaction other than a business combination that at the time of the transaction affects neither accounting
nor taxable profit or loss. Deferred tax is determined using tax rates (and laws) that have been enacted or substantively enacted by the
balance sheet date and are expected to apply when the related deferred tax asset is realized or the deferred tax liability is settled.
Deferred tax assets are recognized to the extent that it is probable that future taxable profit will be available against which the temporary
differences can be utilized.
Deferred tax is provided on temporary differences arising on investments in subsidiaries, associates, except for deferred tax liability
where the timing of the reversal of the temporary difference is controlled by the Group and it is probable that the temporary difference
will not reverse in the foreseeable future.
86 LI & FUNG LIMITED | ANNUAL REPORT 2011
NOTES TO THE ACCOUNTS (CONTINUED)
1 BASIS OF PREPARATION AND PRINCIPAL ACCOUNTING POLICIES (CONTINUED)
1.15 CURRENT AND DEFERRED TAX (CONTINUED)
Deferred tax assets and liabilities are offset when there is a legally enforceable right to offset current tax assets against current tax
liabilities and when the deferred taxes assets and liabilities relate to income taxes levied by the same taxation authority on either the
taxable entity or different taxable entities where there is an intention to settle the balances on a net basis.
1.16 EMPLOYEE BENEFITS
(a) Employee leave entitlements
Employee entitlements to annual leave are recognized when they accrue to employees. A provision is made for the estimated liability for
annual leave entitlements as a result of services rendered by employees up to the balance sheet date.
Employee entitlements to sick leave and maternity leave are not recognized until the time of leave.
(b) Discretionary bonus
The expected costs of discretionary bonus payments are recognized as a liability when the Group has a present legal or constructive
obligation as a result of services rendered by employees and a reliable estimate of the obligation can be made.
Liabilities for discretionary bonus are expected to be settled within 12 months and are measured at the amounts expected to be paid
when they are settled.
(c) Post employment benefit obligations
The Group participates in a number of defined contribution plans and defined benefit plans throughout the world, the assets of which
are generally held in separate trustee – administrated funds. The defined benefit pension plans are generally funded by payments from
employees and by the relevant Group companies, taking into account of the recommendations of independent qualified actuaries.
The Group’s contributions to the defined contribution plans are charged to the consolidated profit and loss account in the year to which
the contributions relate.
For defined benefit plans, pension costs are assessed using the projected unit credit method. Under this method, the cost of providing
pensions is charged to the consolidated profit and loss account so as to spread the regular cost over the service lives of employees
in accordance with the advice of the actuaries who carry out a full valuation of the plans on an annual basis. The pension obligation is
measured as the present value of the estimated future cash outflows, discounted by reference to market yields on high quality corporate
bonds which have terms to maturity approximating the terms of the related liabilities. Actuarial gains and losses are recognized over the
average remaining service lives of employees.
The Group’s net obligation in respect of long service payments on cessation of employment in certain circumstances under the Hong
Kong Employment Ordinance is the amount of future benefit that employees have earned in return for their service in the current
and prior periods; that benefit is discounted to determine the present value and reduced by entitlements accrued under the Group’s
retirement plans that are attributable to contributions made by the Group. The obligation is calculated using the projected unit credit
method by a qualified actuary. The discount rate is determined by reference to market yields on high quality corporate bonds which
have terms to maturity approximating the terms of the related liabilities.

87LI & FUNG LIMITED | ANNUAL REPORT 2011
NOTES TO THE ACCOUNTS (CONTINUED)
1 BASIS OF PREPARATION AND PRINCIPAL ACCOUNTING POLICIES (CONTINUED)
1.16 EMPLOYEE BENEFITS (CONTINUED)
(d) Share-based compensation
The Group operates an equity-settled, share-based compensation plan. The fair value of the employee services received in exchange
for the grant of the options is recognized as an expense. The total amount to be expensed over the vesting period is determined by
reference to the fair value of the options granted:
• including any market performance conditions;
• excluding the impact of any service and non-market performance vesting conditions (for example, profitability, sale, growth targets
and remaining an employee of the entity over a specified time period); and
• including the impact of any non-vesting conditions (for example, the requirement for employees to save).
Non-market performance vesting conditions are included in assumptions about the number of options that are expected to vest. The
total expense is recognized over the vesting period, which is the period over which all of the specified vesting conditions are to be
satisfied. At each balance sheet date, the Group revises its estimates on the number of options that are expected to vest. It recognizes
the impact of the revision of original estimates, if any, in the consolidated profit and loss account, with a corresponding adjustment to
employee share-based compensation reserve.
The proceeds received net of any directly attributable transaction costs are credited to share capital (nominal value) and share premium
when the options are exercised.
1.17 PROVISIONS
Provisions are recognized when: the Group has a present legal or constructive obligation as a result of past events; it is probable that an
outflow of resources will be required to settle the obligation; and the amount has been reliably estimated. Provisions are not recognized
for future operating losses.
Where there are a number of similar obligations, the likelihood that an outflow will be required in settlement is determined by considering
the class of obligations as a whole. A provision is recognized even if the likelihood of an outflow with respect to any one item included in
the same class of obligations may be small.
Provisions are measured at the present value of the expenditures expected to be required to settle the obligation using a pre-tax
discount rate that reflects current market assessments of the time value of money and the risks specific to the obligation. The increase
in the provision due to passage of time is recognized as interest expense.
1.18 CONTINGENT LIABILITIES AND CONTINGENT ASSETS
A contingent liability is a possible obligation that arises from past events and whose existence will only be confirmed by the occurrence
or non-occurrence of one or more uncertain future events not wholly within the control of the Group. It can also be a present obligation
arising from past events that is not recognized because it is not probable that outflow of economic resources will be required or the
amount of obligation cannot be measured reliably.
88 LI & FUNG LIMITED | ANNUAL REPORT 2011
NOTES TO THE ACCOUNTS (CONTINUED)
1 BASIS OF PREPARATION AND PRINCIPAL ACCOUNTING POLICIES (CONTINUED)
1.18 CONTINGENT LIABILITIES AND CONTINGENT ASSETS (CONTINUED)
A contingent liability is not recognized but is disclosed in the notes to the accounts. When a change in the probability of an outflow
occurs so that outflow is probable, it will then be recognized as a provision.
A contingent asset is a possible asset that arises from past events and whose existence will be confirmed only by the occurrence or
non-occurrence of one or more uncertain events not wholly within the control of the Group.
Contingent assets are not recognized but are disclosed in the notes to the accounts when an inflow of economic benefits is probable.
When inflow is virtually certain, an asset is recognized.
1.19 TOTAL MARGIN
Total margin includes trading gross profit and other recurring income relating to the trading, distribution and logistics business.
1.20 CORE OPERATING PROFIT
Core operating profit is the profit before taxation generated from the Group’s trading, distribution and logistics business which excludes
share of results of associated companies, interest income, interest costs, tax, material gain or loss which are of capital nature or non-
recurring nature (such as gain or loss on disposal or impairment provision of property, plant and equipment, investments, goodwill or
other assets) and acquisition-related costs.
1.21 REVENUE RECOGNITION
Revenue comprises the fair value of the consideration received or receivable for the sale of goods and services in the ordinary course
of the Group’s activities. Revenue is shown net of value-added tax, returns, rebates and discounts and after eliminating sales within the
Group.
The Group recognizes revenue when the amount of revenue can be reliably measured, it is probable that future economic benefits will
flow to the entity and specific criteria have been met for each of the Group’s activities as described below. The amount of revenue is not
considered to be reliably measurable until all contingencies relating to the sale have been resolved. The Group bases its estimates on
historical results, taking into consideration the type of customer, the type of transaction and the specifics of each arrangement.
Revenue from the sale of goods is recognized on the transfer of risks and rewards of ownership, which generally coincides with the time
when the goods are delivered to customers and title has been passed.
Service income is recognized in the accounting period in which the services are rendered, by reference to completion of the specific
transaction assessed on the basis of the actual service provided as a proportion of the total services to be provided.
Operating lease rental income is recognized on a straight-line basis.
Interest income is recognized on a time proportion basis, taking into account the principal amounts outstanding and the interest rates
applicable.
Dividend income is recognized when the right to receive payment is established.
Other income are recognized when the services are rendered.

89LI & FUNG LIMITED | ANNUAL REPORT 2011
NOTES TO THE ACCOUNTS (CONTINUED)
1 BASIS OF PREPARATION AND PRINCIPAL ACCOUNTING POLICIES (CONTINUED)
1.22 BORROWING COSTS
Borrowing costs that are directly attributable to the acquisition, construction or production of qualifying asset that necessarily takes a
substantial period of time to get ready for its intended use or sale are capitalized as part of the cost of that asset, until such time as the
assets are substantially ready for their intended use or sale.
Investment income earned on the temporary investment of specific borrowings pending their expenditure on qualifying assets is
deducted from the borrowing costs eligible for capitalisation.
All other borrowing costs are charged to the consolidated profit and loss account in the year in which they are incurred.
1.23 OPERATING LEASES
Leases in which a significant portion of the risks and rewards of ownership are retained by the lessor are classified as operating leases.
Payments made under operating leases (net of any incentives received from the lessor) are charged to the consolidated profit and loss
account on a straight-line basis over the period of the lease. The upfront prepayments made for leasehold land and land use rights
are amortised on a straight-line basis over the period of the lease or where there is impairment, the impairment is expensed in the
consolidated profit and loss account.
1.24 DERIVATIVE FINANCIAL INSTRUMENTS AND HEDGING ACTIVITIES
Derivatives are initially recognized at fair value on the date a derivative contract is entered into and are subsequently remeasured at their
fair value. The method of recognising the resulting gain or loss depends on whether the derivative is designated as a hedging instrument,
and if so, the nature of the item being hedged. The Group designates certain derivatives as hedges of a particular risk associated with a
recognized liability or a highly probable forecast transaction (cash flow hedge).
The Group documents, at the inception of the transaction, the intended relationship between hedging instruments and hedged items,
as well as its risk management objectives and strategy for undertaking various hedge transactions. The Group also documents its
assessment, both at hedge inception and on an ongoing basis, of whether the derivatives that are used in hedging transactions are
highly effective in offsetting changes in fair values or cash flows of hedged items.
Movements in the fair values of hedging derivatives are included within shareholders’ equity (Note 26). The full fair value of a hedging
derivative is classified as a non-current asset or liability when the remaining maturity of the hedged item is more than 12 months. Trading
derivatives are classified as a current asset or liability.
(a) Cash flow hedge
The effective portion of changes in the fair value of derivatives that are designated and qualify as cash flow hedges are recognized in
other comprehensive income. The gain or loss relating to the ineffective portion is recognized immediately in the consolidated profit and
loss account.
Amounts accumulated in equity are recycled to the consolidated profit and loss account in the periods when the hedged item affects
profit or loss (for example, when the forecast sale that is hedged takes place). The gain or loss relating to the effective portion of forward
foreign exchange contracts hedging export sales is recognized in the consolidated profit and loss account within sales. The gain or loss
relating to the ineffective portion is recognized in the consolidated profit and loss account within other gains/(losses) – net. However,
when the forecast transaction that is hedged results in the recognition of a non-financial asset (for example, inventory or property, plant
and equipment), the gains and losses previously deferred in equity are transferred from equity and included in the initial measurement
of the cost of the asset. The deferred amounts are ultimately recognized in cost of goods sold in case of inventory, or in depreciation in
case of property, plant and equipment.

90 LI & FUNG LIMITED | ANNUAL REPORT 2011
NOTES TO THE ACCOUNTS (CONTINUED)
1 BASIS OF PREPARATION AND PRINCIPAL ACCOUNTING POLICIES (CONTINUED)
1.24 DERIVATIVE FINANCIAL INSTRUMENTS AND HEDGING ACTIVITIES (CONTINUED)
(a) Cash flow hedge (continued)
When a hedging instrument expires or is sold, or when a hedge no longer meets the criteria for hedge accounting, any cumulative gain
or loss existing in equity at that time remains in equity and is recognized when the forecast transaction is ultimately recognized in the
consolidated profit and loss account. When a forecast transaction is no longer expected to occur, the cumulative gain or loss that was
reported in equity is immediately transferred to the consolidated profit and loss account.
(b) Derivatives at fair value through profit or loss and accounted for at fair value through profit or loss
Certain derivative instruments do not qualify for hedge accounting. Changes in the fair value of these derivative instruments are
recognized immediately in the consolidated profit and loss account.
1.25 TRADE PAYABLES
Trade payables are obligations to pay for goods or services that have been acquired in the ordinary course of business from suppliers.
Accounts payable are classified as current liabilities if payment is due within one year or less (or in the normal operating cycle of the
business if longer). If not, they are presented as non-current liabilities.
Trade payables are recognized initially at fair value and subsequently measured at amortized cost using the effective interest method.
1.26 DIVIDEND DISTRIBUTION
Dividend distribution to the Company’s shareholders is recognized as a liability in the Group’s and Company’s accounts in the period in
which the dividends are approved by the Company’s shareholders.
1.27 SHARES HELD BY ESCROW AGENT FOR SETTLEMENT OF ACQUISITION CONSIDERATION
In relation to certain business combinations, the Company issues shares to escrow agents for the settlement of acquisition consideration
payables to the vendors in future years. The shares, valued at the agreed upon issue price, including any directly attributable incremental
costs, are presented as “Shares held by escrow agent for settlement of acquisition consideration” and deducted from total equity.
The number of shares held by escrow agent for settlement of acquisition consideration would be eliminated against the corresponding
number of share capital issued in the calculation of the earnings per share for profit attributable to the shareholders of the Company.
1.28 FINANCIAL GUARANTEE CONTRACT
Financial guarantees are initially recognised in the financial statements at fair value on the date the guarantee was given. The company’s
liabilities under such guarantees are subsequently measured at the higher of the initial amount, less amortization of fees recognised
in accordance with HKAS 18, and the best estimate of the amount required to settle the guarantee. These estimates are determined
based on experience of similar transactions and history of past losses, supplemented by the judgement of management. The fee income
earned is recognized on a straight-line basis over the life of the guarantee. Any increase in the liability relating to guarantees is reported
in the consolidated profit and loss account within administrative expenses.
91LI & FUNG LIMITED | ANNUAL REPORT 2011
NOTES TO THE ACCOUNTS (CONTINUED)
2 CRITICAL ACCOUNTING ESTIMATES AND JUDGMENTSEstimates and judgments are continually evaluated and are based on historical experience and other factors, including expectations of
future events that are believed to be reasonable under the circumstances.
The Group makes estimates and assumptions concerning the future. The resulting accounting estimates will, by definition, seldom equal
the related actual results. The estimates and assumptions that have a significant risk of causing a material adjustment to the carrying
amounts of assets and liabilities within the next financial year are discussed below.
(a) ESTIMATED IMPAIRMENT OF INTANGIBLE ASSETS INCLUDING GOODWILL
The Group tests annually whether goodwill has suffered any impairment, in accordance with the accounting policy stated in Note 1.6.
The recoverable amounts of cash-generating units have been determined based on value-in-use calculations. These calculations require
the use of estimates (Note 12).
(b) USEFUL LIVES OF INTANGIBLE ASSETS
The Group amortizes its intangible assets with finite useful lives on a straight-line basis over their estimated useful lives. The estimated
useful lives reflect the management’s estimates of the periods that the Group intends to derive future economic benefits from the use of
these intangible assets.
(c) IMPAIRMENT OF AVAILABLE-FOR-SALE FINANCIAL ASSETS
The Group follows the guidance of HKAS 39 when determining whether an investment in available-for-sale financial assets is other than
temporarily impaired. This determination requires significant judgment. In making this judgment, the Group evaluates, among other
factors, the duration and extent to which the fair value of an investment is less than its cost, and the expected time span the Group
will hold on to this investment. Based on the Group’s estimation, no impairment provision is required to be made for available-for-sale
financial assets during the current year (Note 17).
(d) INCOME TAXES
The Group is subject to income taxes in numerous jurisdictions. Significant judgment is required in determining the worldwide provision
for income taxes. There are many transactions and calculations for which the ultimate tax determination is uncertain during the ordinary
course of business. The Group recognizes liabilities for anticipated tax audit issues based on estimates of whether additional taxes will
be due. Where the final tax outcome of these matters is different from the amounts that were initially recorded, such differences will
impact the income tax and deferred tax provisions in the period in which such determination is made.
(e) CONTINGENT CONSIDERATIONS OF ACQUISITIONS
Certain of the Group’s business acquisitions involved post-acquisition performance-based contingent considerations. HKFRS 3 (Revised)
is effective prospectively to business combinations for which acquisition date is on or after the beginning of the first annual reporting
period beginning on or after 1 July 2009. The Group follows the requirement of HKFRS 3 (Revised) to recognize the fair value of those
contingent considerations for acquisitions, as of their respective acquisition dates as part of the consideration transferred in exchange
for the acquired business. These fair value measurements require, among other things, significant estimation of post-acquisition
performance of the acquired business and significant judgment on time value of money. Contingent considerations shall be re-measured
at their fair value resulting from events or factors emerge after the acquisition date, with any resulting gain or loss recognized in the
consolidated profit and loss account in accordance with HKFRS 3 (Revised). For acquisitions completed prior to 1 January 2010, the
effective date of HKFRS 3 (Revised), changes in the fair value of contingent consideration was recognized in goodwill.

92 LI & FUNG LIMITED | ANNUAL REPORT 2011
NOTES TO THE ACCOUNTS (CONTINUED)
2 CRITICAL ACCOUNTING ESTIMATES AND JUDGMENTS (CONTINUED)
(e) CONTINGENT CONSIDERATIONS OF ACQUISITIONS (CONTINUED)
The basis of the contingent consideration differs for each acquisition; generally however the contingent consideration reflects a specified
multiple of the post-acquisition financial profitability of the acquired business. Consequently, the actual additional consideration payable
will vary according to the future performance of each individual acquired business, and the liabilities provided reflect estimates of such
future performances. Due to the number of acquisitions for which additional consideration remains outstanding and the variety of
bases of determination, it is not practicable to provide any meaningful sensitivity in relation to the critical assumptions concerning future
profitability of the acquired business.
Should the total actual additional consideration paid in the year ended 31 December 2011 be 0.1% higher/lower than the corresponding
amount of contingent consideration estimated by management as payable at 31 December 2011, there would consequent increases/
reductions in other non-core operating expenses for the year ended 31 December 2011 and goodwill of US$1,820,000 and
US$151,000 respectively.
3 SEGMENT INFORMATIONThe Company is domiciled in Bermuda. The Company is a limited liability company incorporated in Bermuda. The address of its
registered office is Canon’s Court, 22 Victoria Street, Hamilton HM 12, Bermuda and its Hong Kong office is at 11/F, Li Fung Tower, 888
Cheung Sha Wan Road, Kowloon, Hong Kong. The Group is principally engaged in managing the supply chain for retailers and brands
worldwide from over 300 offices and distribution centers in more than 40 economies. Turnover represents revenue generated from sales
and services rendered at invoiced value to customers outside the Group less discounts and returns.
During the year, the Group has accomplished a major restructuring of its operations which resulted in three new operating segments.
The Group’s management (Chief Operating decision-maker) considers the business principally from the perspective of three global
Networks, namely Trading Network, Logistics Network and Distribution Network. Trading Network is the operating segment that focuses
on the global sourcing business. Logistics Network is the operating segment that runs both the Group’s international and domestic
logistics services networks globally. Distribution Network is the operating segment that operates the onshore distribution businesses in
the US, Pan-European and Asian regions. Prior period comparative segment information has been restated accordingly.
The Group’s management assesses the performance of the operating segments based on a measure of operating profit, referred to
as core operating profit (see Note 1.20). This measurement basis includes profit of the operating segments before share of results of
associated companies, interest income, interest expenses and tax, but excludes material gain or loss which is of capital nature or non
recurring nature such as gain or loss on disposal or impairment provision on property, plant and equipment, investments, goodwill or
other assets, or acquisition-related costs. Other information provided to the Group’s management is measured in a manner consistent
with that in the accounts.

93LI & FUNG LIMITED | ANNUAL REPORT 2011
NOTES TO THE ACCOUNTS (CONTINUED)
3 SEGMENT INFORMATION (CONTINUED)
Trading
Network
Logistics
Network
Distribution
Network Elimination Total
US$’000 US$’000 US$’000 US$’000 US$’000
Year ended 31 December 2011
Turnover 15,880,099 446,431 6,305,419 (2,601,678) 20,030,271
Total margin 1,410,282 175,517 1,488,405 3,074,204
Operating costs (845,121) (162,573) (1,184,454) (2,192,148)
Core operating profit 565,161 12,944 303,951 882,056
Gain on disposal of businesses/subsidiary 50,994
Gain on disposal of properties/property
holding subsidiary 13,666
Other non-core operating expenses (66,779)
Operating profit 879,937
Interest income 19,490
Interest expenses
Non-cash interest expenses (21,538)
Cash interest expenses (107,056)
(128,594)
Share of profits less losses of
associated companies 1,231
Profit before taxation 772,064
Taxation (90,660)
Profit for the year 681,404
Depreciation & amortization 41,158 10,499 174,885 226,542
31 December 2011
Non-current assets (other than
available-for-sale financial assets
and deferred tax assets) 2,012,456 525,483 4,336,188 6,874,127

94 LI & FUNG LIMITED | ANNUAL REPORT 2011
NOTES TO THE ACCOUNTS (CONTINUED)
3 SEGMENT INFORMATION (CONTINUED)
Trading
Network
Logistics
Network
Distribution
Network Elimination Total
US$’000 US$’000 US$’000 US$’000 US$’000
Year ended 31 December 2010 –
Restated
Turnover 13,741,995 73,198 3,911,803 (1,814,795) 15,912,201
Total margin 1,176,844 27,344 1,034,101 2,238,289
Operating costs (744,285) (32,661) (736,205) (1,513,151)
Core operating profit/(loss) 432,559 (5,317) 297,896 725,138
Other non-core operating expenses (45,820)
Operating profit 679,318
Interest income 13,567
Interest expenses
Non-cash interest expenses (19,272)
Cash interest expenses (79,171)
(98,443)
Share of profits less losses of
associated companies 1,850
Profit before taxation 596,292
Taxation (47,525)
Profit for the year 548,767
Depreciation & amortization 33,567 2,065 123,322 158,954
31 December 2010 – Restated
Non-current assets (other than
available-for-sale financial assets
and deferred tax assets) 1,249,084 493,467 3,468,955 5,211,506
1 January 2010 – Restated
Non-current assets (other than
available-for-sale financial assets
and deferred tax assets) 927,213 – 1,579,998 2,507,211

95LI & FUNG LIMITED | ANNUAL REPORT 2011
NOTES TO THE ACCOUNTS (CONTINUED)
3 SEGMENT INFORMATION (CONTINUED)The geographical analysis of turnover and non-current assets (other than available-for-sale financial assets and deferred tax assets) is as
follows:
Non-current assets
(other than available-for-sale financial and
deferred tax assets)
Turnover As at 31 December As at 1 January
2011 2010 2011 2010 2010
US$’000 US$’000 US$’000 US$’000 US$’000
(Restated) (Restated) (Restated)
United States of America 11,982,146 10,347,772 4,255,844 3,156,844 1,930,783
Europe 4,281,735 3,855,722 1,324,471 910,028 466,278
China 1,130,676 280,892 436,051 465,484 7,705
Rest of Asia 1,223,679 261,532 624,440 550,375 8,444
Canada 674,179 530,025 111,368 57,073 34,154
Australasia 378,200 361,937 60,770 40,566 29,539
Central and Latin America 256,998 187,266 45,072 21,948 17,190
South Africa and Middle East 102,658 87,055 16,111 9,188 13,118
20,030,271 15,912,201 6,874,127 5,211,506 2,507,211
Turnover to external parties consists of sales of softgoods, hardgoods and logistics income is as follows:
2011 2010
US$’000 US$’000
(Restated)
Softgoods 12,911,434 11,028,821
Hardgoods 6,719,740 4,817,035
Logistics 399,097 66,345
20,030,271 15,912,201
For the year ended 31 December 2011, approximately 13.3% (2010: 14.5%) of the Group’s turnover is derived from a single external
customer, of which 11.8% (2010: 13.0%) and 1.5% (2010: 1.5%) are attributable to the Trading Network and Distribution Network
segments respectively.

96 LI & FUNG LIMITED | ANNUAL REPORT 2011
NOTES TO THE ACCOUNTS (CONTINUED)
4 OPERATING PROFITOperating profit is stated after crediting and charging the following:
2011 2010
US$’000 US$’000
(Restated)
Crediting
Gain on disposal of prepaid premium for land leases – 350
Gain on disposal of businesses/subsidiary (Note 30(c)) 50,994 –
Gain on disposal of properties/property holding subsidiary (Note 30(d)) 13,666 –
Net exchange gains 6,330 –
Charging
Cost of inventories sold 17,043,929 13,746,389
Amortization of computer software and system development costs (Note 12) 6,205 5,348
Amortization of brand licenses (Note 12) 97,394 78,755
Amortization of other intangible assets (Note 12)* 51,878 27,663
Amortization of prepaid premium for land leases (Note 14) 180 37
Depreciation of property, plant and equipment (Note 13) 70,885 47,151
Loss on disposal of property, plant and equipment 2,222 4,640
Loss on disposal of computer software and system development costs 367 26
Net provision for impairment of available-for-sale financial assets (Note 17) – 66
Operating leases rental in respect of land and building 191,076 84,013
Provision for impaired receivables (Note 21) 15,552 17,297
Staff costs including directors’ emoluments (Note 10) 1,227,029 793,234
Business acquisition-related costs (Note 31)* 14,901 18,157
Net exchange losses – 4,536
* Included in other non-core operating expenses

97LI & FUNG LIMITED | ANNUAL REPORT 2011
NOTES TO THE ACCOUNTS (CONTINUED)
4 OPERATING PROFIT (CONTINUED)The remuneration to the auditors for audit and non-audit services is as follows:
2011 2010
US$’000 US$’000
(Restated)
Audit services 5,017 3,402
Non-audit services
– due diligence reviews on acquisitions 2,201 2,593
– taxation services 2,335 1,621
– others 247 378
Total remuneration to auditors charged to consolidated profit and loss account 9,800 7,994
NOTE: Of the above audit and non-audit services fees, US$4,920,000 (2010: US$3,306,000) and US$4,783,000 (2010: US$4,592,000) respectively are
payable to the Company’s auditor.
5 INTEREST EXPENSES
2011 2010
US$’000 US$’000
(Restated)
Non-cash interest expenses on purchase consideration, license royalty payable and long-
term notes
– wholly repayable within five years 16,624 16,575
– not wholly repayable within five years 4,914 2,697
Cash interest on bank loans and overdrafts, long-term notes
– wholly repayable within five years 40,181 30,012
– not wholly repayable within five years 66,875 49,159
128,594 98,443

98 LI & FUNG LIMITED | ANNUAL REPORT 2011
NOTES TO THE ACCOUNTS (CONTINUED)
6 TAXATIONHong Kong profits tax has been provided for at the rate of 16.5% (2010: 16.5%) on the estimated assessable profit for the year.
Taxation on overseas profits has been calculated on the estimated assessable profits for the year at the rates of taxation prevailing in the
countries in which the Group operates.
The amount of taxation charged/(credited) to the consolidated profit and loss account represents:
2011 2010
US$’000 US$’000
(Restated)
Current taxation
– Hong Kong profits tax 11,689 12,678
– Overseas taxation 55,889 38,371
Underprovision in prior years 4,196 2,464
Deferred taxation (Note 29) 18,886 (5,988)
90,660 47,525
The taxation on the Group’s profit before taxation differs from the theoretical amount that would arise using the taxation rate of the home
country of the Company as follows:
2011 2010
% %
Calculated at a taxation rate of 16.5 16.5
Effect of different taxation rates in other countries (3.7) (7.0)
Income net of expenses not subject to taxation (2.8) (4.4)
Underprovision in prior years 0.5 0.4
Utilization of previously unrecognized tax losses (0.2) (0.1)
Unrecognized tax losses 1.4 2.5
Effective tax rate 11.7 7.9
As of the date of the annual report, the Group has disputes with the Hong Kong Inland Revenue (“HKIR”) involving additional tax
assessments amounting to approximately US$247 million on both the non-taxable claim of certain non-Hong Kong sourced income
(“Offshore Claim”) and the deduction claim of marketing expenses (“Deduction Claim”) for the years of assessment from1992/1993 to
2010/2011.
The Commissioner of the HKIR issued a determination on 14 June 2004 to one of our subsidiaries, Li & Fung (Trading) Limited (“LFT”),
confirming additional tax assessments totalling US$43 million relating to the years of assessment from 1992/93 to 2001/02. Based upon
professional advice then obtained, the directors believed that the Group had meritorious defence to appeal against the Commissioner’s
determination. Accordingly, LFT lodged a notice of appeal to the Board of Review on 13 July 2004. The appeal was heard before the
Board of Review in January 2006.
99LI & FUNG LIMITED | ANNUAL REPORT 2011
NOTES TO THE ACCOUNTS (CONTINUED)
6 TAXATION (CONTINUED)The Board of Review issued its decision on 12 June 2009 (“the Board of Review Decision”) and held partially in favour of LFT. It agreed
that the Offshore Claim for the years of assessment from 1992/93 to 2001/02 is valid. In other words, the relevant assessments in
respect of such Offshore Claim should be annulled. On the other hand, the Board of Review disagreed with the Deduction Claim for
the years of assessment from 1992/93 to 2001/02. Therefore, the relevant assessments in respect of such Deduction Claim should be
confirmed.
The Group considered the reasoning of the Board of Review Decision and, having obtained professional advice, decided to lodge an
appeal against the Board of Review Decision in respect of the Deduction Claim.
On the other hand, the HKIR also lodged an appeal against the Board of Review Decision in respect of the Offshore Claim.
On 19 March 2010, the Board of Review stated a case on questions of law in respect of both LFT’s appeal on the Deduction Claim,
and the HKIR’s appeal on the Offshore Claim. On 1 April 2010, both LFT and the HKIR transmitted the stated case to the High Court for
determination.
The appeal by the HKIR in respect of the Board of Review Decision on the Offshore Claim was dismissed by the Court of First Instance
on 18 April 2011, which upheld the Board of Review Decision. LFT was also awarded costs of the appeal.
On 16 May 2011, the HKIR lodged an appeal against the judgment of the Court of First Instance to the Court of Appeal, which appeal
was heard by the Court of Appeal on 14 and 15 February 2012. On 19 March 2012, the Court of Appeal has delivered its judgment. It
has upheld the judgment of the Court of First Instance, and dismissed the HKIR’s appeal. Any appeal against the judgment of the Court
of Appeal to the Court of Final Appeal will require permission of the Court of Appeal or the Court of Final Appeal. The HKIR has until 16
April 2012 to apply for such permission to appeal.
As regards LFT’s appeal on the Deduction Claim, upon the consent of the parties, the Court of First Instance remitted the case stated to
the Board of Review and directed it to make further findings of fact and to determine certain issues. As of the date of this annual report,
further directions/decisions from the Board of Review are awaited.
The Group has also filed objections with the HKIR against the remaining additional tax assessments of US$204 million. The case
before the Board of Review and now the Court of Appeal only applies to the additional tax assessments in respect of LFT for the years
of assessment from 1992/93 to 2001/02. The Group’s dispute with the HKIR regarding the remaining additional tax assessments in
respect of certain other subsidiaries for the years of assessment from 1992/93 to 2001/02, and in respect of the Group for the period
after the 2001/02 assessment years, is ongoing and has not yet been determined. It is therefore not yet before the Board of Review,
and no hearing is currently scheduled.
Based on the assessment of the Group’s legal counsel on the merits of LFT’s further appeal in respect of the Deduction Claim and
the HKIR’s further appeal in respect of the Offshore Claim (which has now been dismissed by the Court of Appeal), and having taken
into account the impact and ramification that the Board of Review Decision has on the tax affairs of LFT, the directors consider that no
material tax liabilities will finally crystallize and sufficient tax provision has been made in the accounts in this regard.
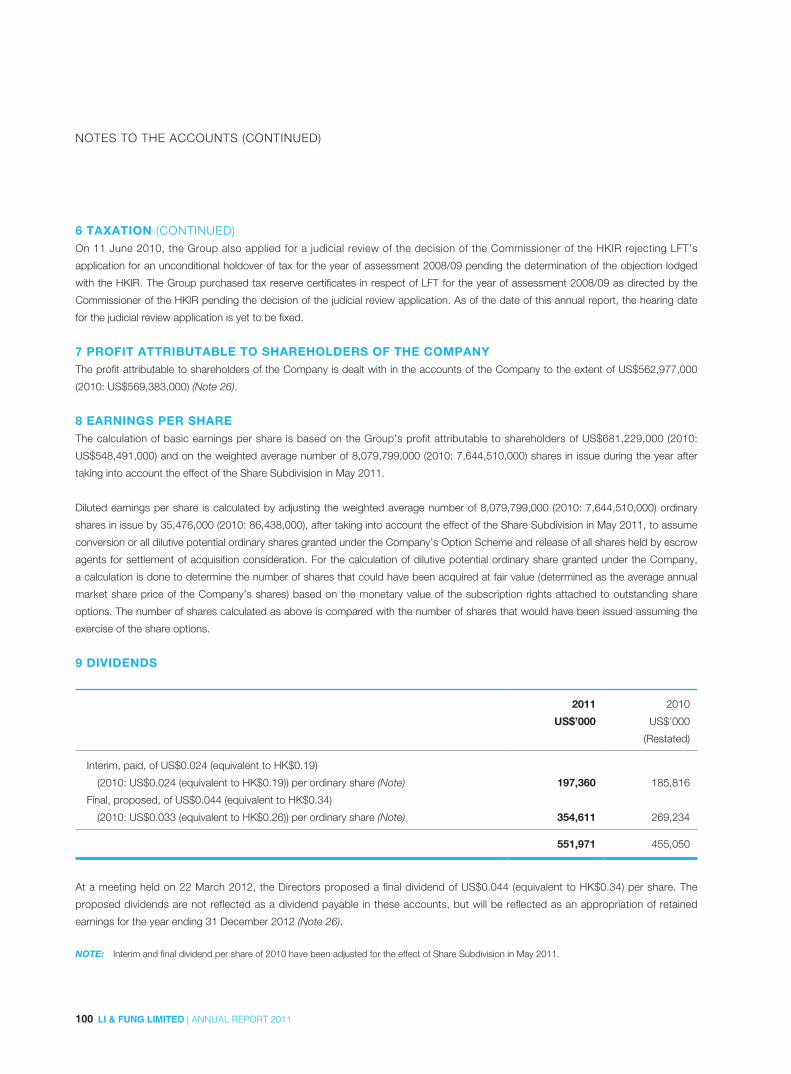
100 LI & FUNG LIMITED | ANNUAL REPORT 2011
NOTES TO THE ACCOUNTS (CONTINUED)
6 TAXATION (CONTINUED)On 11 June 2010, the Group also applied for a judicial review of the decision of the Commissioner of the HKIR rejecting LFT’s
application for an unconditional holdover of tax for the year of assessment 2008/09 pending the determination of the objection lodged
with the HKIR. The Group purchased tax reserve certificates in respect of LFT for the year of assessment 2008/09 as directed by the
Commissioner of the HKIR pending the decision of the judicial review application. As of the date of this annual report, the hearing date
for the judicial review application is yet to be fixed.
7 PROFIT ATTRIBUTABLE TO SHAREHOLDERS OF THE COMPANYThe profit attributable to shareholders of the Company is dealt with in the accounts of the Company to the extent of US$562,977,000
(2010: US$569,383,000) (Note 26).
8 EARNINGS PER SHAREThe calculation of basic earnings per share is based on the Group’s profit attributable to shareholders of US$681,229,000 (2010:
US$548,491,000) and on the weighted average number of 8,079,799,000 (2010: 7,644,510,000) shares in issue during the year after
taking into account the effect of the Share Subdivision in May 2011.
Diluted earnings per share is calculated by adjusting the weighted average number of 8,079,799,000 (2010: 7,644,510,000) ordinary
shares in issue by 35,476,000 (2010: 86,438,000), after taking into account the effect of the Share Subdivision in May 2011, to assume
conversion or all dilutive potential ordinary shares granted under the Company’s Option Scheme and release of all shares held by escrow
agents for settlement of acquisition consideration. For the calculation of dilutive potential ordinary share granted under the Company,
a calculation is done to determine the number of shares that could have been acquired at fair value (determined as the average annual
market share price of the Company’s shares) based on the monetary value of the subscription rights attached to outstanding share
options. The number of shares calculated as above is compared with the number of shares that would have been issued assuming the
exercise of the share options.
9 DIVIDENDS
2011 2010
US$’000 US$’000
(Restated)
Interim, paid, of US$0.024 (equivalent to HK$0.19)
(2010: US$0.024 (equivalent to HK$0.19)) per ordinary share (Note) 197,360 185,816
Final, proposed, of US$0.044 (equivalent to HK$0.34)
(2010: US$0.033 (equivalent to HK$0.26)) per ordinary share (Note) 354,611 269,234
551,971 455,050
At a meeting held on 22 March 2012, the Directors proposed a final dividend of US$0.044 (equivalent to HK$0.34) per share. The
proposed dividends are not reflected as a dividend payable in these accounts, but will be reflected as an appropriation of retained
earnings for the year ending 31 December 2012 (Note 26).
NOTE: Interim and final dividend per share of 2010 have been adjusted for the effect of Share Subdivision in May 2011.
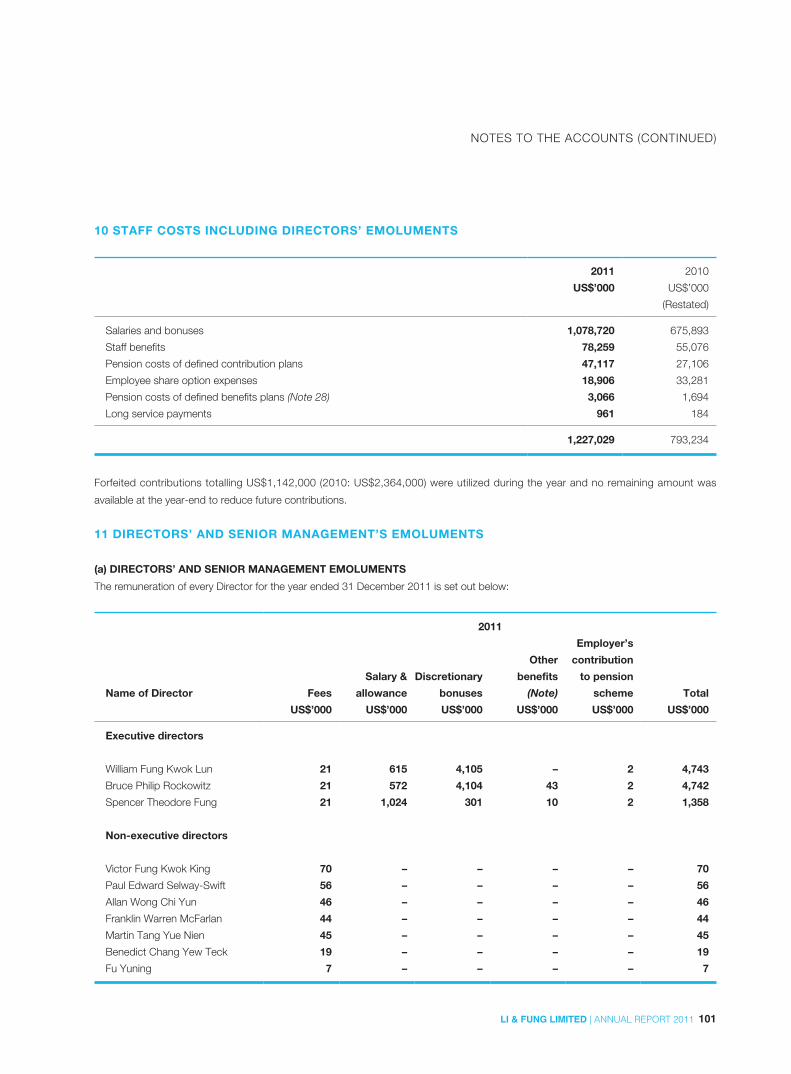
101LI & FUNG LIMITED | ANNUAL REPORT 2011
NOTES TO THE ACCOUNTS (CONTINUED)
10 STAFF COSTS INCLUDING DIRECTORS’ EMOLUMENTS
2011 2010
US$’000 US$’000
(Restated)
Salaries and bonuses 1,078,720 675,893
Staff benefits 78,259 55,076
Pension costs of defined contribution plans 47,117 27,106
Employee share option expenses 18,906 33,281
Pension costs of defined benefits plans (Note 28) 3,066 1,694
Long service payments 961 184
1,227,029 793,234
Forfeited contributions totalling US$1,142,000 (2010: US$2,364,000) were utilized during the year and no remaining amount was
available at the year-end to reduce future contributions.
11 DIRECTORS’ AND SENIOR MANAGEMENT’S EMOLUMENTS
(a) DIRECTORS’ AND SENIOR MANAGEMENT EMOLUMENTS
The remuneration of every Director for the year ended 31 December 2011 is set out below:
2011
Name of Director Fees
Salary &
allowance
Discretionary
bonuses
Other
benefits
(Note)
Employer’s
contribution
to pension
scheme Total
US$’000 US$’000 US$’000 US$’000 US$’000 US$’000
Executive directors
William Fung Kwok Lun 21 615 4,105 – 2 4,743
Bruce Philip Rockowitz 21 572 4,104 43 2 4,742
Spencer Theodore Fung 21 1,024 301 10 2 1,358
Non-executive directors
Victor Fung Kwok King 70 – – – – 70
Paul Edward Selway-Swift 56 – – – – 56
Allan Wong Chi Yun 46 – – – – 46
Franklin Warren McFarlan 44 – – – – 44
Martin Tang Yue Nien 45 – – – – 45
Benedict Chang Yew Teck 19 – – – – 19
Fu Yuning 7 – – – – 7

102 LI & FUNG LIMITED | ANNUAL REPORT 2011
NOTES TO THE ACCOUNTS (CONTINUED)
11 DIRECTORS’ AND SENIOR MANAGEMENT’S EMOLUMENTS (CONTINUED)
(a) DIRECTORS’ AND SENIOR MANAGEMENT EMOLUMENTS (CONTINUED)
2010
Name of Director Fees
Salary &
allowance
Discretionary
bonuses
Other
benefits
(Note)
Employer’s
contribution
to pension
scheme Total
US$’000 US$’000 US$’000 US$’000 US$’000 US$’000
Executive directors
William Fung Kwok Lun 11 615 3,231 – 2 3,859
Bruce Philip Rockowitz 11 622 3,227 49 2 3,911
Spencer Theodore Fung 11 1,045 21 – 2 1,079
Non-executive directors
Victor Fung Kwok King 44 – – – – 44
Paul Edward Selway-Swift 32 – – – – 32
Allan Wong Chi Yun 28 – – – – 28
Franklin Warren McFarlan 22 – – – – 22
Makoto Yasuda 22 – – – – 22
Martin Tang Yue Nien 22 – – – – 22
NOTE: Other benefits include leave pay, insurance premium and club membership.
During the year, Shares were issued to certain directors of the Company pursuant to exercise of the following Share Options under the
Option Scheme:
Number of Share Options exercised (NOTE 1) Exercise Price (NOTE 2) Exercisable Period
352,000 (2010: 2,660,000) HK$12.77 01/3/2009–28/2/2011
880,000 (2010: 1,330,000) HK$12.77 01/3/2010–29/2/2012
1,760,000 (2010: Nil) HK$12.77 01/3/2011–28/2/2013
NOTE 1: The Share Options were exercised before Share Subdivision mentioned in Note 25(a) to the accounts and is adjusted for the effect of Share
Subdivision.
NOTE 2: The exercise price is adjusted for the effect of Share Subdivision.

103LI & FUNG LIMITED | ANNUAL REPORT 2011
NOTES TO THE ACCOUNTS (CONTINUED)
11 DIRECTORS’ AND SENIOR MANAGEMENT’S EMOLUMENTS (CONTINUED)
(a) DIRECTORS’ AND SENIOR MANAGEMENT EMOLUMENTS (CONTINUED)
As at 31 December 2011, certain directors held the following Share Options (after adjustment of Share Subdivision) to acquire Shares of
the Company:
Number of Share Options Exercise Price Exercisable Period
802,000 (2010: 1,682,000 (Note 3)) HK$12.77 01/3/2010–29/2/2012
1,252,000 (2010: 3,012,000 (Note 3)) HK$12.77 01/3/2011–28/2/2013
354,000 (2010: 354,000 (Note 3)) HK$20.76 01/3/2011–28/2/2013
1,440,000 (2010: Nil) HK$20.21 01/5/2012–30/4/2015
1,440,000 (2010: Nil) HK$20.21 01/5/2013–30/4/2015
3,600,000 (2010: Nil) HK$20.21 01/5/2014–30/4/2016
1,000,000 (2010: Nil) HK$14.50 01/5/2013–30/4/2015
1,000,000 (2010: Nil) HK$14.50 01/5/2014–30/4/2016
1,000,000 (2010: Nil) HK$14.50 01/5/2015–30/4/2017
1,000,000 (2010: Nil) HK$14.50 01/5/2016–30/4/2018
1,000,000 (2010: Nil) HK$14.50 01/5/2017–30/4/2019
1,000,000 (2010: Nil) HK$14.50 01/5/2018–30/4/2020
1,000,000 (2010: Nil) HK$14.50 01/5/2019–30/4/2021
1,000,000 (2010: Nil) HK$14.50 01/5/2020–30/4/2022
1,000,000 (2010: Nil) HK$14.50 01/5/2021–30/4/2023
NOTE 3: The number of Share Options is adjusted for the effect of Share Subdivision.
The closing market price of the Shares as at 30 December 2011 was HK$14.38.
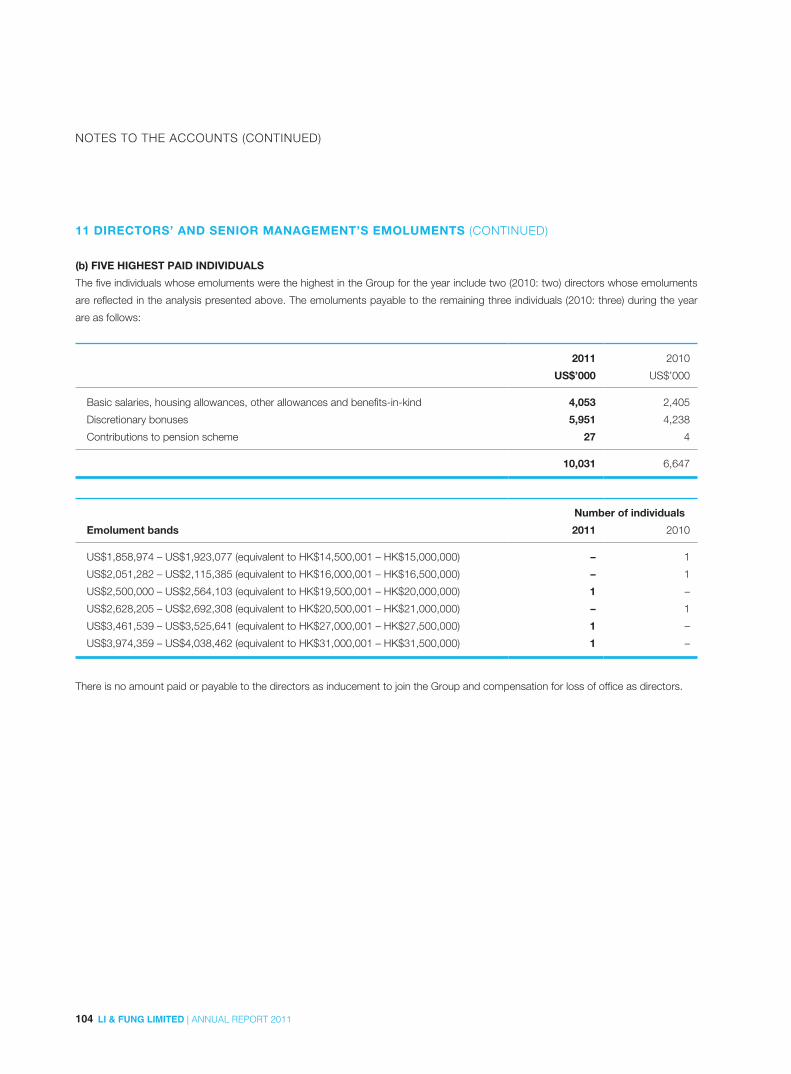
104 LI & FUNG LIMITED | ANNUAL REPORT 2011
NOTES TO THE ACCOUNTS (CONTINUED)
11 DIRECTORS’ AND SENIOR MANAGEMENT’S EMOLUMENTS (CONTINUED)
(b) FIVE HIGHEST PAID INDIVIDUALS
The five individuals whose emoluments were the highest in the Group for the year include two (2010: two) directors whose emoluments
are reflected in the analysis presented above. The emoluments payable to the remaining three individuals (2010: three) during the year
are as follows:
2011 2010
US$’000 US$’000
Basic salaries, housing allowances, other allowances and benefits-in-kind 4,053 2,405
Discretionary bonuses 5,951 4,238
Contributions to pension scheme 27 4
10,031 6,647
Number of individuals
Emolument bands 2011 2010
US$1,858,974 – US$1,923,077 (equivalent to HK$14,500,001 – HK$15,000,000) – 1
US$2,051,282 – US$2,115,385 (equivalent to HK$16,000,001 – HK$16,500,000) – 1
US$2,500,000 – US$2,564,103 (equivalent to HK$19,500,001 – HK$20,000,000) 1 –
US$2,628,205 – US$2,692,308 (equivalent to HK$20,500,001 – HK$21,000,000) – 1
US$3,461,539 – US$3,525,641 (equivalent to HK$27,000,001 – HK$27,500,000) 1 –
US$3,974,359 – US$4,038,462 (equivalent to HK$31,000,001 – HK$31,500,000) 1 –
There is no amount paid or payable to the directors as inducement to join the Group and compensation for loss of office as directors.

105LI & FUNG LIMITED | ANNUAL REPORT 2011
NOTES TO THE ACCOUNTS (CONTINUED)
12 INTANGIBLE ASSETS
The Group
Goodwill
Brand
licenses
Buying
agency
and license
agreements
Customer
relationships
Licensor
relationships
Trademarks
and
brandnames
Computer
software
and system
development
costs Others Total
US$’000 US$’000 US$’000 US$’000 US$’000 US$’000 US$’000 US$’000 US$’000
At 1 January 2011
Cost 4,142,831 376,567 60,867 258,085 71,999 92,451 57,380 1,900 5,062,080
Accumulated amortization – (115,747) (8,031) (25,332) (9,358) (7,429) (13,475) (542) (179,914)
Net book amount 4,142,831 260,820 52,836 232,753 62,641 85,022 43,905 1,358 4,882,166
Year ended 31 December 2011
Opening net book amount 4,142,831 260,820 52,836 232,753 62,641 85,022 43,905 1,358 4,882,166
Exchange differences (19,953) (207) – (233) (2,114) (190) (739) – (23,436)
Acquisition of businesses/subsidiaries
(Note 31) 1,360,849 34,801 – 213,168 45,079 60,601 4 300 1,714,802
Adjustments to purchase consideration
and net asset valuei 25,820 16,291 33,100 (42,822) – (3,200) – – 29,189
Adjustments to purchase consideration
for acquisitions completed prior to
1 January 2010ii 5,536 – – – – – – – 5,536
Additions – 68,911 – – – – 4,832 – 73,743
Disposal of businesses/subsidiary
(Note 30(c)) – – – (157) – – – – (157)
Disposals – – – – – – (367) – (367)
Amortization – (97,394) (6,580) (25,897) (9,234) (9,804) (6,205) (363) (155,477)
Closing net book amount 5,515,083 283,222 79,356 376,812 96,372 132,429 41,430 1,295 6,525,999
At 31 December 2011
Cost 5,515,083 495,605 93,967 427,925 114,904 149,657 61,037 2,200 6,860,378
Accumulated amortization – (212,383) (14,611) (51,113) (18,532) (17,228) (19,607) (905) (334,379)
Net book amount 5,515,083 283,222 79,356 376,812 96,372 132,429 41,430 1,295 6,525,999
i These are adjustments to purchase considerations and net asset values related to certain acquisitions of businesses/subsidiaries in the prior year, which
were previously determined on a provisional basis. During the measurement period, the Company recognized adjustments to the provisional amounts as
if the accounting for the business combination had been completed at the acquisition date. Save as adjustments to goodwill and other intangible assets
arising from business combination stated above, there were corresponding net adjustments to purchase consideration of US$8,425,000 and other
assets/liabilities of approximately US$20,764,000.
ii For acquisitions completed prior to 1 January 2010, the effective date of HKFRS 3 (Revised) “Business Combination” being adopted by the Group, the
changes in accrued contingent considerations determined based on post-acquisition performance were made against goodwill.
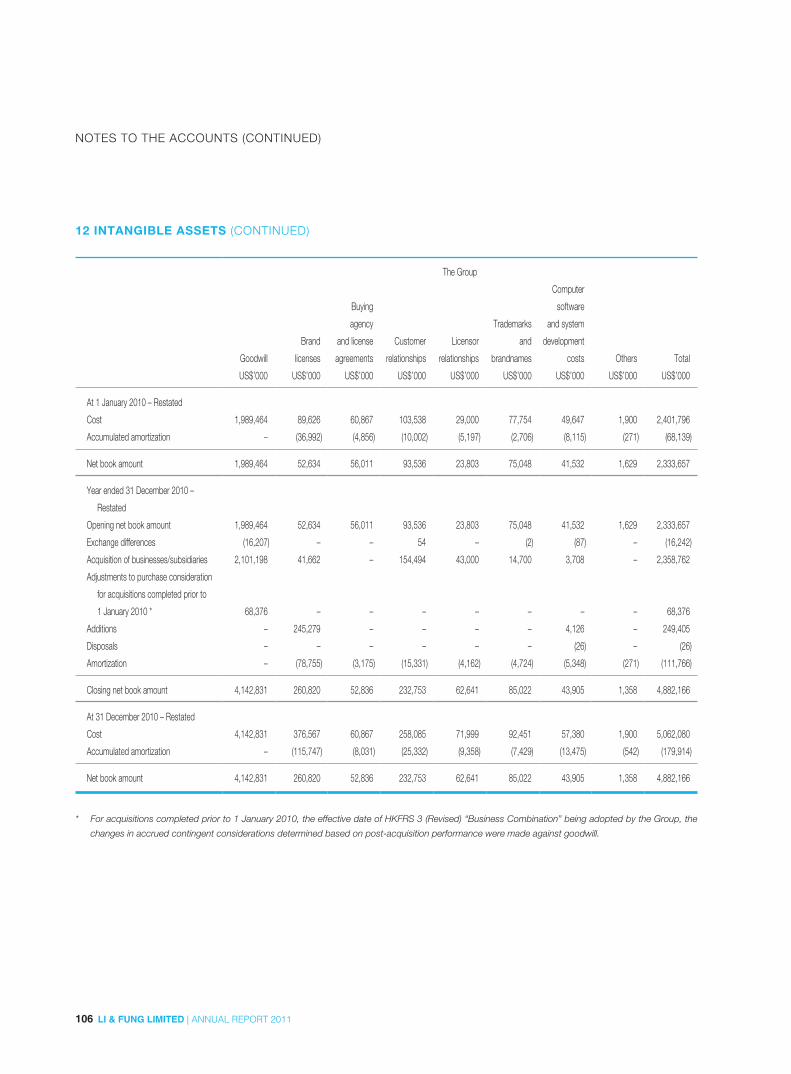
106 LI & FUNG LIMITED | ANNUAL REPORT 2011
NOTES TO THE ACCOUNTS (CONTINUED)
12 INTANGIBLE ASSETS (CONTINUED)
The Group
Goodwill
Brand
licenses
Buying
agency
and license
agreements
Customer
relationships
Licensor
relationships
Trademarks
and
brandnames
Computer
software
and system
development
costs Others Total
US$’000 US$’000 US$’000 US$’000 US$’000 US$’000 US$’000 US$’000 US$’000
At 1 January 2010 – Restated
Cost 1,989,464 89,626 60,867 103,538 29,000 77,754 49,647 1,900 2,401,796
Accumulated amortization – (36,992) (4,856) (10,002) (5,197) (2,706) (8,115) (271) (68,139)
Net book amount 1,989,464 52,634 56,011 93,536 23,803 75,048 41,532 1,629 2,333,657
Year ended 31 December 2010 –
Restated
Opening net book amount 1,989,464 52,634 56,011 93,536 23,803 75,048 41,532 1,629 2,333,657
Exchange differences (16,207) – – 54 – (2) (87) – (16,242)
Acquisition of businesses/subsidiaries 2,101,198 41,662 – 154,494 43,000 14,700 3,708 – 2,358,762
Adjustments to purchase consideration
for acquisitions completed prior to
1 January 2010 * 68,376 – – – – – – – 68,376
Additions – 245,279 – – – – 4,126 – 249,405
Disposals – – – – – – (26) – (26)
Amortization – (78,755) (3,175) (15,331) (4,162) (4,724) (5,348) (271) (111,766)
Closing net book amount 4,142,831 260,820 52,836 232,753 62,641 85,022 43,905 1,358 4,882,166
At 31 December 2010 – Restated
Cost 4,142,831 376,567 60,867 258,085 71,999 92,451 57,380 1,900 5,062,080
Accumulated amortization – (115,747) (8,031) (25,332) (9,358) (7,429) (13,475) (542) (179,914)
Net book amount 4,142,831 260,820 52,836 232,753 62,641 85,022 43,905 1,358 4,882,166
* For acquisitions completed prior to 1 January 2010, the effective date of HKFRS 3 (Revised) “Business Combination” being adopted by the Group, the
changes in accrued contingent considerations determined based on post-acquisition performance were made against goodwill.
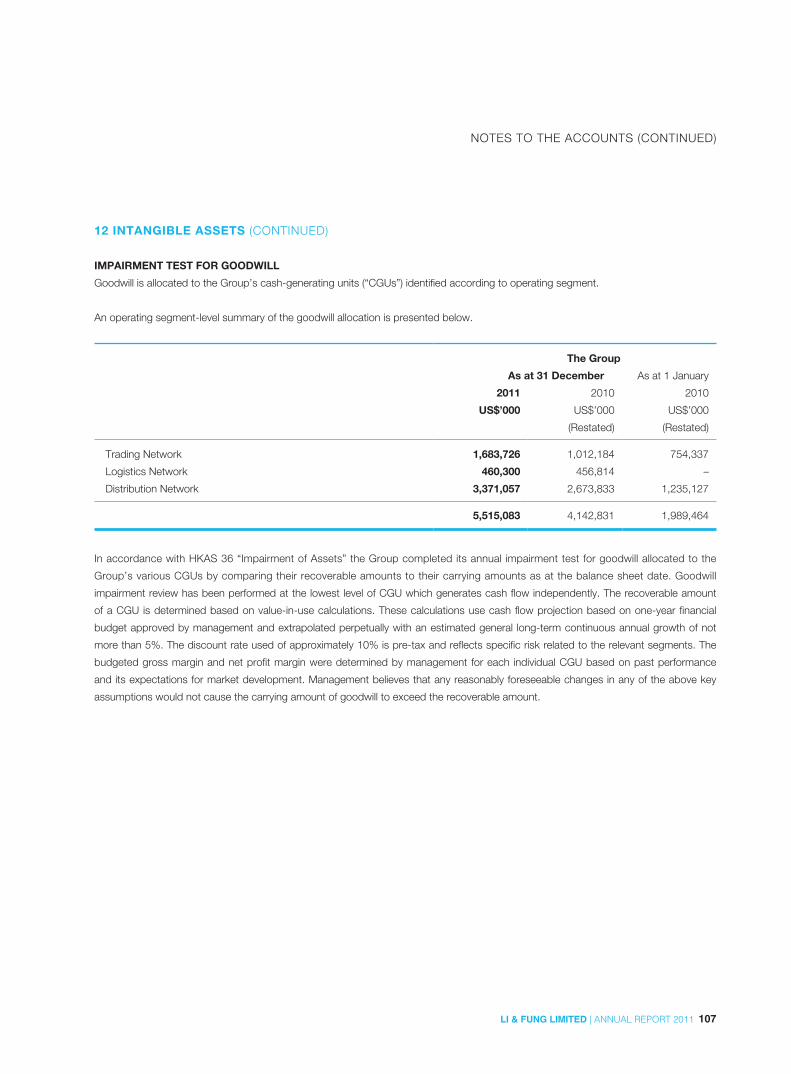
107LI & FUNG LIMITED | ANNUAL REPORT 2011
NOTES TO THE ACCOUNTS (CONTINUED)
12 INTANGIBLE ASSETS (CONTINUED)
IMPAIRMENT TEST FOR GOODWILL
Goodwill is allocated to the Group’s cash-generating units (“CGUs”) identified according to operating segment.
An operating segment-level summary of the goodwill allocation is presented below.
The Group
As at 31 December As at 1 January
2011 2010 2010
US$’000 US$’000 US$’000
(Restated) (Restated)
Trading Network 1,683,726 1,012,184 754,337
Logistics Network 460,300 456,814 –
Distribution Network 3,371,057 2,673,833 1,235,127
5,515,083 4,142,831 1,989,464
In accordance with HKAS 36 “Impairment of Assets” the Group completed its annual impairment test for goodwill allocated to the
Group’s various CGUs by comparing their recoverable amounts to their carrying amounts as at the balance sheet date. Goodwill
impairment review has been performed at the lowest level of CGU which generates cash flow independently. The recoverable amount
of a CGU is determined based on value-in-use calculations. These calculations use cash flow projection based on one-year financial
budget approved by management and extrapolated perpetually with an estimated general long-term continuous annual growth of not
more than 5%. The discount rate used of approximately 10% is pre-tax and reflects specific risk related to the relevant segments. The
budgeted gross margin and net profit margin were determined by management for each individual CGU based on past performance
and its expectations for market development. Management believes that any reasonably foreseeable changes in any of the above key
assumptions would not cause the carrying amount of goodwill to exceed the recoverable amount.
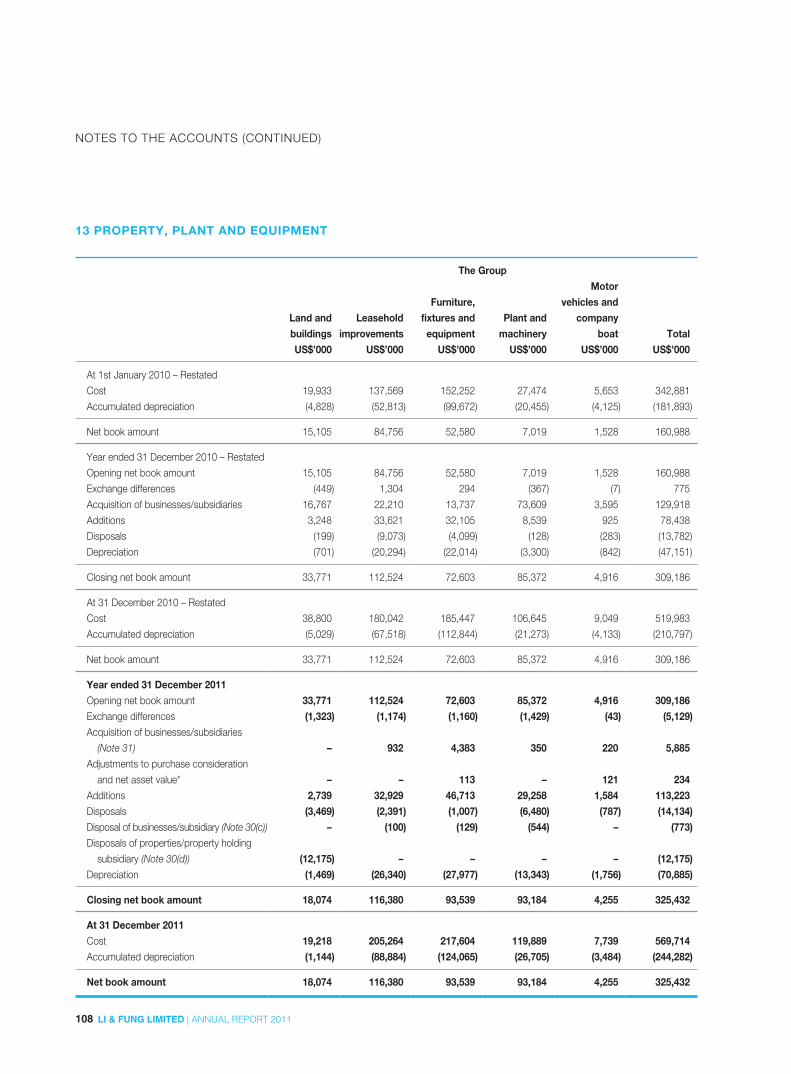
108 LI & FUNG LIMITED | ANNUAL REPORT 2011
NOTES TO THE ACCOUNTS (CONTINUED)
13 PROPERTY, PLANT AND EQUIPMENT
The Group
Land and buildings
Leasehold improvements
Furniture, fixtures and
equipmentPlant and
machinery
Motor vehicles and
company boat Total
US$’000 US$’000 US$’000 US$’000 US$’000 US$’000
At 1st January 2010 – Restated
Cost 19,933 137,569 152,252 27,474 5,653 342,881
Accumulated depreciation (4,828) (52,813) (99,672) (20,455) (4,125) (181,893)
Net book amount 15,105 84,756 52,580 7,019 1,528 160,988
Year ended 31 December 2010 – Restated
Opening net book amount 15,105 84,756 52,580 7,019 1,528 160,988
Exchange differences (449) 1,304 294 (367) (7) 775
Acquisition of businesses/subsidiaries 16,767 22,210 13,737 73,609 3,595 129,918
Additions 3,248 33,621 32,105 8,539 925 78,438
Disposals (199) (9,073) (4,099) (128) (283) (13,782)
Depreciation (701) (20,294) (22,014) (3,300) (842) (47,151)
Closing net book amount 33,771 112,524 72,603 85,372 4,916 309,186
At 31 December 2010 – Restated
Cost 38,800 180,042 185,447 106,645 9,049 519,983
Accumulated depreciation (5,029) (67,518) (112,844) (21,273) (4,133) (210,797)
Net book amount 33,771 112,524 72,603 85,372 4,916 309,186
Year ended 31 December 2011Opening net book amount 33,771 112,524 72,603 85,372 4,916 309,186Exchange differences (1,323) (1,174) (1,160) (1,429) (43) (5,129)Acquisition of businesses/subsidiaries
(Note 31) – 932 4,383 350 220 5,885Adjustments to purchase consideration
and net asset value* – – 113 – 121 234Additions 2,739 32,929 46,713 29,258 1,584 113,223Disposals (3,469) (2,391) (1,007) (6,480) (787) (14,134)Disposal of businesses/subsidiary (Note 30(c)) – (100) (129) (544) – (773)Disposals of properties/property holding
subsidiary (Note 30(d)) (12,175) – – – – (12,175)Depreciation (1,469) (26,340) (27,977) (13,343) (1,756) (70,885)
Closing net book amount 18,074 116,380 93,539 93,184 4,255 325,432
At 31 December 2011Cost 19,218 205,264 217,604 119,889 7,739 569,714Accumulated depreciation (1,144) (88,884) (124,065) (26,705) (3,484) (244,282)
Net book amount 18,074 116,380 93,539 93,184 4,255 325,432

109LI & FUNG LIMITED | ANNUAL REPORT 2011
NOTES TO THE ACCOUNTS (CONTINUED)
13 PROPERTY, PLANT AND EQUIPMENT (CONTINUED)Depreciation of US$38,493,000 (2010: US$33,477,000), US$13,864,000 (2010: US$10,587,000), US$13,389,000 (2010:
US$2,336,000) and US$5,139,000 (2010: US$751,000) has been expensed in merchandising expenses, administrative expenses,
selling and distribution expenses and cost of sales respectively.
At 31 December 2011, land and buildings of US$3,990,000 (31 December 2010: US$7,500,000 and 1 January 2010: Nil) were pledged
as security for the Group’s short-term bank loans (Note 24).
* Adjustments to net asset values related to certain acquisitions of businesses/subsidiaries in the prior year, that were previously determined on a
provisional basis.
14 PREPAID PREMIUM FOR LAND LEASESThe Group’s interests in leasehold land and land use rights represent prepaid operating lease payments and their net book value is
analyzed as follows:
The Group
As at 31 December As at 1 January
2011 2010 2010
US$’000 US$’000 US$’000
(Restated) (Restated)
Outside Hong Kong, held on:
Leases of between 10 to 50 years 2,715 3,372 311
Leases of over 50 years 429 442 –
3,144 3,814 311
The Group
2011 2010
US$’000 US$’000
(Restated)
Beginning of the year 3,814 311
Acquisition of businesses/subsidiaries – 3,514
Disposal (77) (1)
Disposal of properties/property holding subsidiary (Note 30(d)) (239) –
Amortization of prepaid premium for land leases (180) (37)
Exchange differences (174) 27
End of the year 3,144 3,814
Amortization of US$170,000 (2010: Nil) and US$10,000 (2010: US$37,000) has been expensed in selling and distribution expenses and
merchandising expenses respectively.

110 LI & FUNG LIMITED | ANNUAL REPORT 2011
NOTES TO THE ACCOUNTS (CONTINUED)
15 INTERESTS IN SUBSIDIARIES
The Company
As at 31 December As at 1 January
2011 2010 2010
US$’000 US$’000 US$’000
(Restated) (Restated)
Unlisted shares, at cost 1,089,285 1,089,285 52,193
Loan to a subsidiary 250,319 250,319 250,319
1,339,604 1,339,604 302,512
The loan to a subsidiary is interest free and unsecured. The Company does not have any intention to seek repayment from the
subsidiary.
Details of principal subsidiaries are set out on in Note 41.
16 ASSOCIATED COMPANIES
The Group
2011 2010
US$’000 US$’000
(Restated)
Beginning of the year 6,140 3,622
Share of profits less losses of associated companies 1,231 1,850
Dividend received (300) (686)
Acquisition of businesses/subsidiaries – 184
Addition – 1,228
Exchange differences (56) (58)
Total interest in associated companies 7,015 6,140
Details of principal associated companies are set out in Note 41.
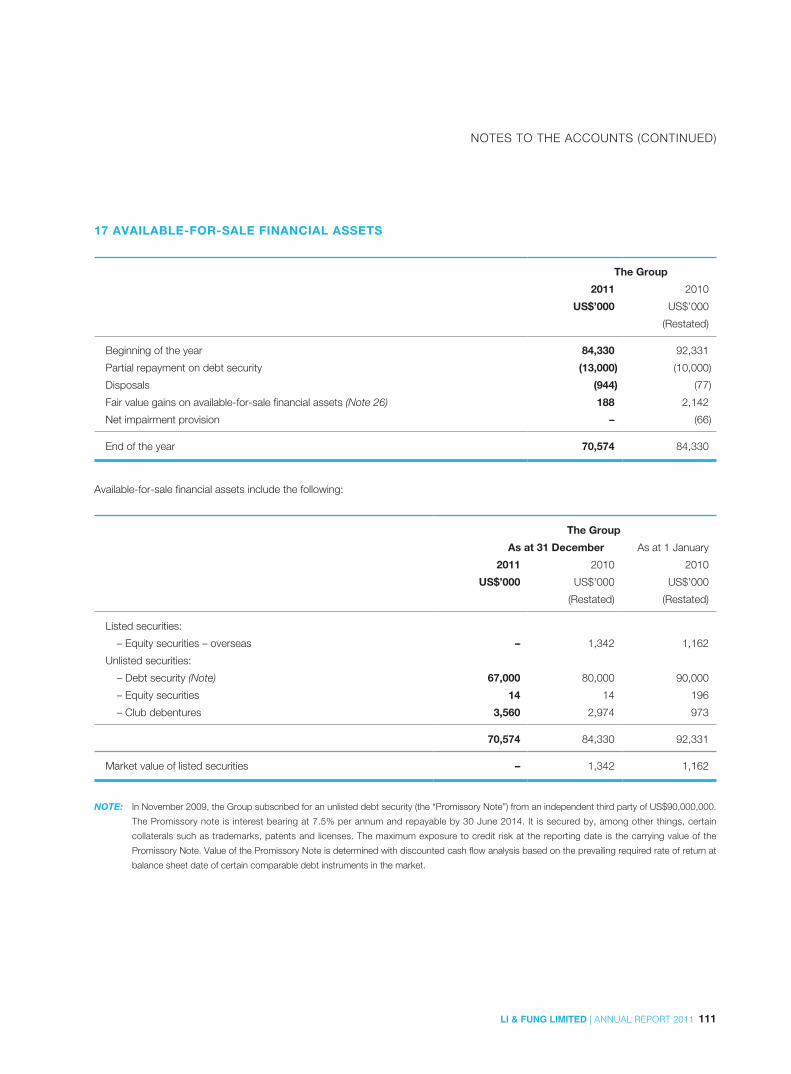
111LI & FUNG LIMITED | ANNUAL REPORT 2011
NOTES TO THE ACCOUNTS (CONTINUED)
17 AVAILABLE-FOR-SALE FINANCIAL ASSETS
The Group
2011 2010
US$’000 US$’000
(Restated)
Beginning of the year 84,330 92,331
Partial repayment on debt security (13,000) (10,000)
Disposals (944) (77)
Fair value gains on available-for-sale financial assets (Note 26) 188 2,142
Net impairment provision – (66)
End of the year 70,574 84,330
Available-for-sale financial assets include the following:
The Group
As at 31 December As at 1 January
2011 2010 2010
US$’000 US$’000 US$’000
(Restated) (Restated)
Listed securities:
– Equity securities – overseas – 1,342 1,162
Unlisted securities:
– Debt security (Note) 67,000 80,000 90,000
– Equity securities 14 14 196
– Club debentures 3,560 2,974 973
70,574 84,330 92,331
Market value of listed securities – 1,342 1,162
NOTE: In November 2009, the Group subscribed for an unlisted debt security (the “Promissory Note”) from an independent third party of US$90,000,000.
The Promissory note is interest bearing at 7.5% per annum and repayable by 30 June 2014. It is secured by, among other things, certain
collaterals such as trademarks, patents and licenses. The maximum exposure to credit risk at the reporting date is the carrying value of the
Promissory Note. Value of the Promissory Note is determined with discounted cash flow analysis based on the prevailing required rate of return at
balance sheet date of certain comparable debt instruments in the market.
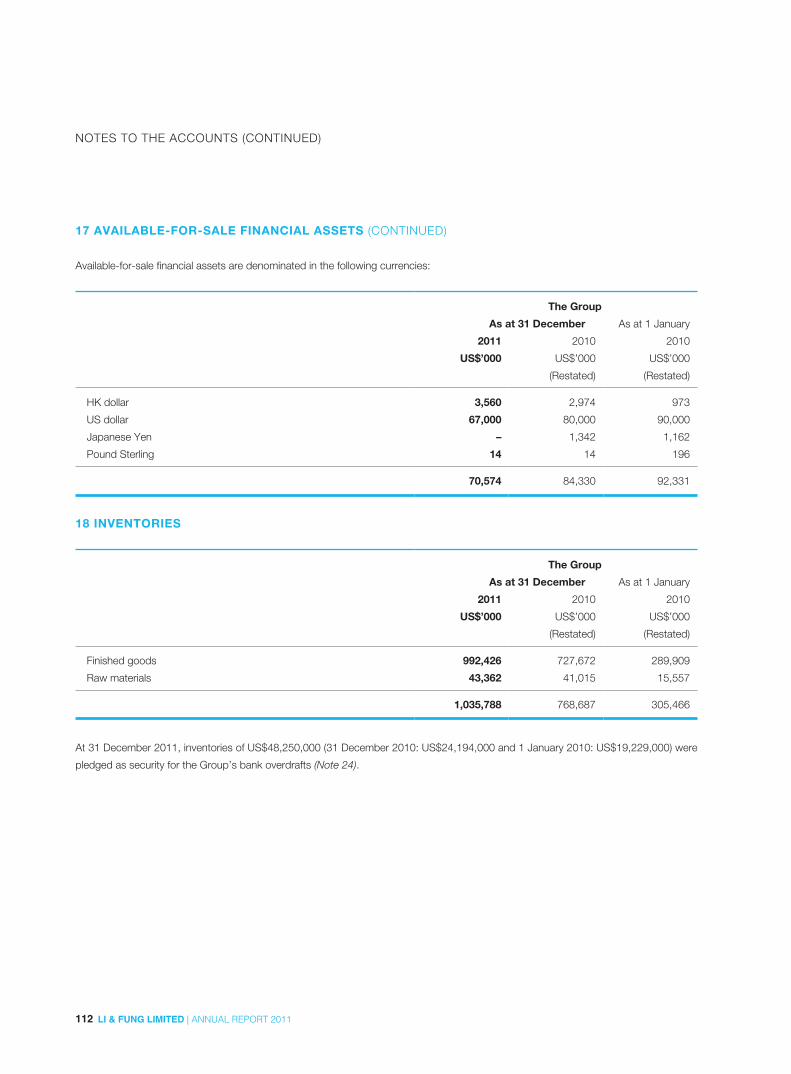
112 LI & FUNG LIMITED | ANNUAL REPORT 2011
NOTES TO THE ACCOUNTS (CONTINUED)
17 AVAILABLE-FOR-SALE FINANCIAL ASSETS (CONTINUED)
Available-for-sale financial assets are denominated in the following currencies:
The Group
As at 31 December As at 1 January
2011 2010 2010
US$’000 US$’000 US$’000
(Restated) (Restated)
HK dollar 3,560 2,974 973
US dollar 67,000 80,000 90,000
Japanese Yen – 1,342 1,162
Pound Sterling 14 14 196
70,574 84,330 92,331
18 INVENTORIES
The Group
As at 31 December As at 1 January
2011 2010 2010
US$’000 US$’000 US$’000
(Restated) (Restated)
Finished goods 992,426 727,672 289,909
Raw materials 43,362 41,015 15,557
1,035,788 768,687 305,466
At 31 December 2011, inventories of US$48,250,000 (31 December 2010: US$24,194,000 and 1 January 2010: US$19,229,000) were
pledged as security for the Group’s bank overdrafts (Note 24).

113LI & FUNG LIMITED | ANNUAL REPORT 2011
NOTES TO THE ACCOUNTS (CONTINUED)
19 DUE FROM/(TO) RELATED COMPANIES
The Group The Company
As at 31 December
As at
1 January As at 31 December
As at
1 January
2011 2010 2010 2011 2010 2010
US$’000 US$’000 US$’000 US$’000 US$’000 US$’000
(Restated) (Restated) (Restated) (Restated)
Due from:
Subsidiaries – – – 3,855,441 3,650,510 2,532,192
Associated companies 9,876 8,330 12,655 – – –
Related companies 7,072 4,833 – – – –
16,948 13,163 12,655 3,855,441 3,650,510 2,532,192
Due to:
Associated companies 333 – – – – –
Related companies 12,342 6,531 – – – –
12,675 6,531 – – – –
The amounts are unsecured, interest free and repayable on demand, except for amounts due from an associated company amounting
to US$9,710,000 (31 December 2010: US$7,788,000 and 1 January 2010: US$11,004,000) which are unsecured but interest bearing
at approximately 5% per annum. Fair values of amounts due from related companies are approximately the same as the carrying values.
20 DERIVATIVE FINANCIAL INSTRUMENTS
As at 31 December As at 1 January
2011 2010 2010
US$’000 US$’000 US$’000
(Restated) (Restated)
Forward foreign exchange contracts – assets/(liabilities) (Note 38) 13,743 (1,892) 336
Gains in equity of US$9,474,000 (31 December 2010: Losses of US$752,000 and 1 January 2010: Gains of US$784,000) on forward
foreign exchange contracts as of 31 December 2011 will be released to the consolidated profit and loss account at various dates
between one month to one year from the balance sheet date (Note 26).
For the years ended 31 December 2011 and 2010, there was no material ineffective portion recognized in the profit or loss account
arising from cash flow hedges.
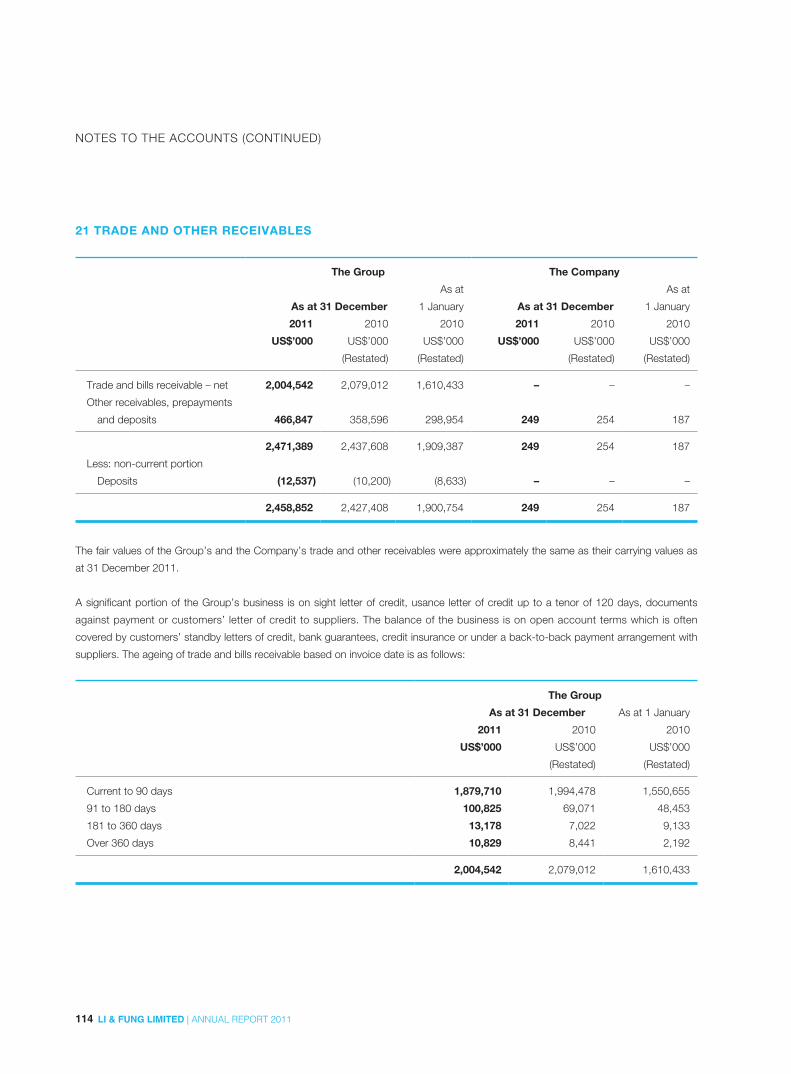
114 LI & FUNG LIMITED | ANNUAL REPORT 2011
NOTES TO THE ACCOUNTS (CONTINUED)
21 TRADE AND OTHER RECEIVABLES
The Group The Company
As at 31 December
As at
1 January As at 31 December
As at
1 January
2011 2010 2010 2011 2010 2010
US$’000 US$’000 US$’000 US$’000 US$’000 US$’000
(Restated) (Restated) (Restated) (Restated)
Trade and bills receivable – net 2,004,542 2,079,012 1,610,433 – – –
Other receivables, prepayments
and deposits 466,847 358,596 298,954 249 254 187
2,471,389 2,437,608 1,909,387 249 254 187
Less: non-current portion
Deposits (12,537) (10,200) (8,633) – – –
2,458,852 2,427,408 1,900,754 249 254 187
The fair values of the Group’s and the Company’s trade and other receivables were approximately the same as their carrying values as
at 31 December 2011.
A significant portion of the Group’s business is on sight letter of credit, usance letter of credit up to a tenor of 120 days, documents
against payment or customers’ letter of credit to suppliers. The balance of the business is on open account terms which is often
covered by customers’ standby letters of credit, bank guarantees, credit insurance or under a back-to-back payment arrangement with
suppliers. The ageing of trade and bills receivable based on invoice date is as follows:
The Group
As at 31 December As at 1 January
2011 2010 2010
US$’000 US$’000 US$’000
(Restated) (Restated)
Current to 90 days 1,879,710 1,994,478 1,550,655
91 to 180 days 100,825 69,071 48,453
181 to 360 days 13,178 7,022 9,133
Over 360 days 10,829 8,441 2,192
2,004,542 2,079,012 1,610,433
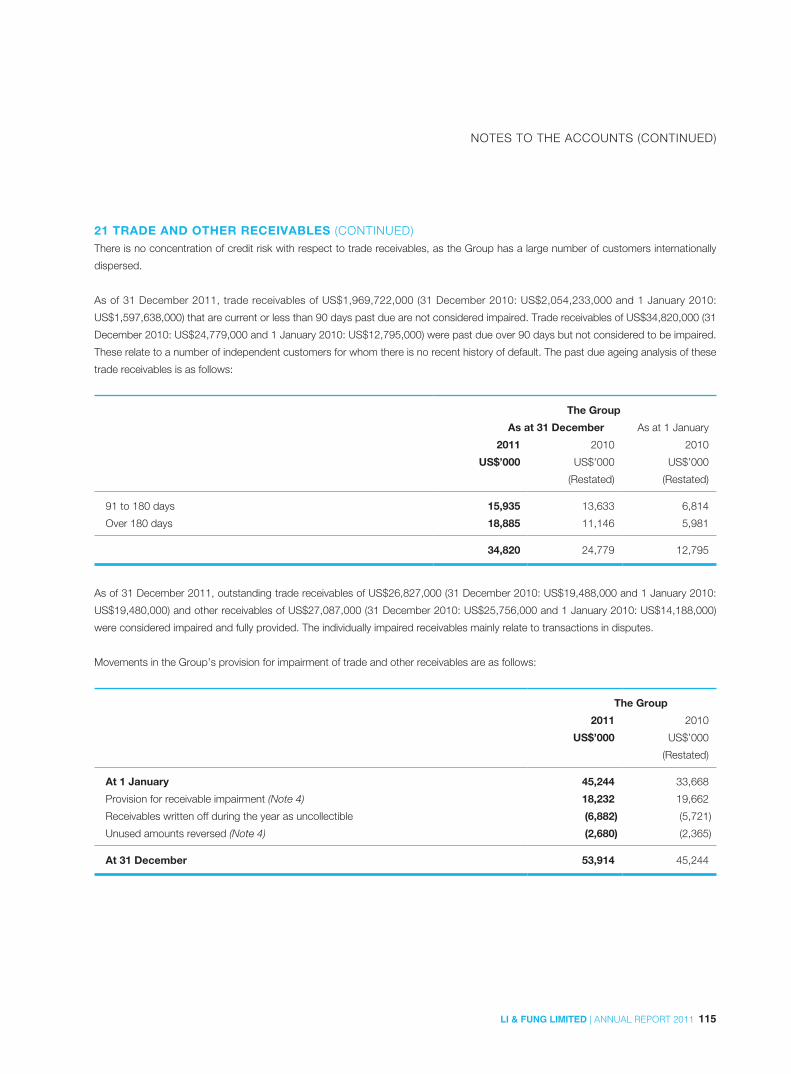
115LI & FUNG LIMITED | ANNUAL REPORT 2011
NOTES TO THE ACCOUNTS (CONTINUED)
21 TRADE AND OTHER RECEIVABLES (CONTINUED)There is no concentration of credit risk with respect to trade receivables, as the Group has a large number of customers internationally
dispersed.
As of 31 December 2011, trade receivables of US$1,969,722,000 (31 December 2010: US$2,054,233,000 and 1 January 2010:
US$1,597,638,000) that are current or less than 90 days past due are not considered impaired. Trade receivables of US$34,820,000 (31
December 2010: US$24,779,000 and 1 January 2010: US$12,795,000) were past due over 90 days but not considered to be impaired.
These relate to a number of independent customers for whom there is no recent history of default. The past due ageing analysis of these
trade receivables is as follows:
The Group
As at 31 December As at 1 January
2011 2010 2010
US$’000 US$’000 US$’000
(Restated) (Restated)
91 to 180 days 15,935 13,633 6,814
Over 180 days 18,885 11,146 5,981
34,820 24,779 12,795
As of 31 December 2011, outstanding trade receivables of US$26,827,000 (31 December 2010: US$19,488,000 and 1 January 2010:
US$19,480,000) and other receivables of US$27,087,000 (31 December 2010: US$25,756,000 and 1 January 2010: US$14,188,000)
were considered impaired and fully provided. The individually impaired receivables mainly relate to transactions in disputes.
Movements in the Group’s provision for impairment of trade and other receivables are as follows:
The Group
2011 2010
US$’000 US$’000
(Restated)
At 1 January 45,244 33,668
Provision for receivable impairment (Note 4) 18,232 19,662
Receivables written off during the year as uncollectible (6,882) (5,721)
Unused amounts reversed (Note 4) (2,680) (2,365)
At 31 December 53,914 45,244
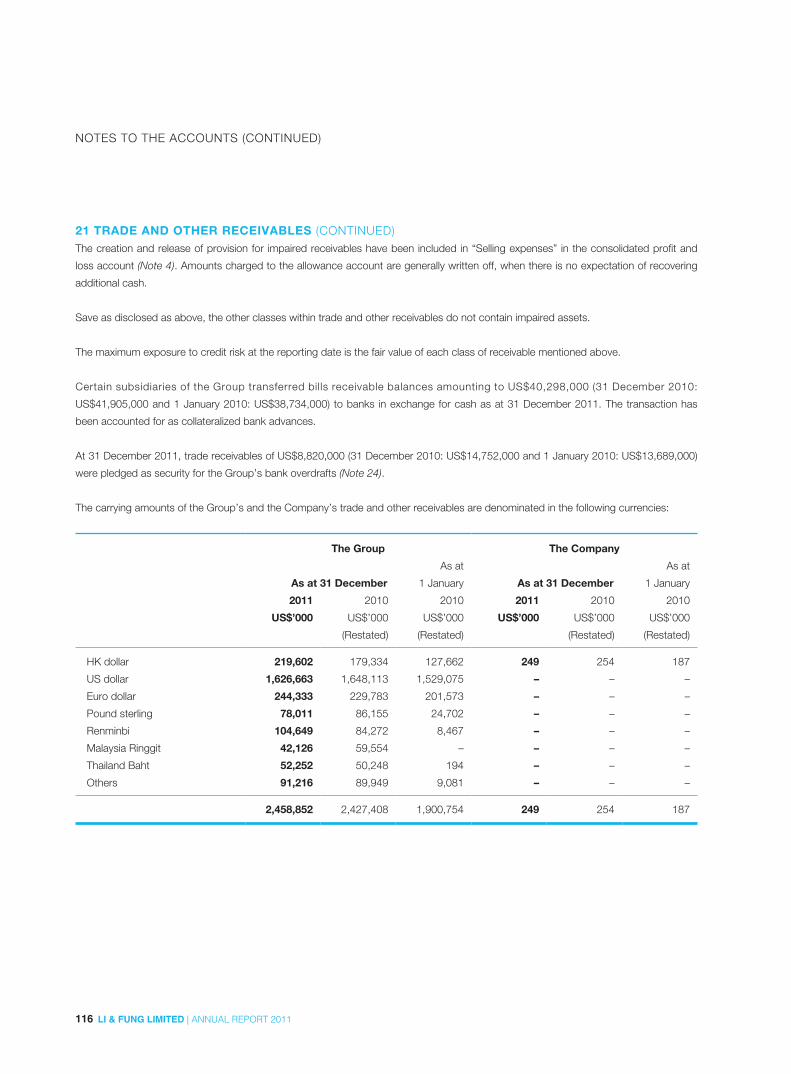
116 LI & FUNG LIMITED | ANNUAL REPORT 2011
NOTES TO THE ACCOUNTS (CONTINUED)
21 TRADE AND OTHER RECEIVABLES (CONTINUED)The creation and release of provision for impaired receivables have been included in “Selling expenses” in the consolidated profit and
loss account (Note 4). Amounts charged to the allowance account are generally written off, when there is no expectation of recovering
additional cash.
Save as disclosed as above, the other classes within trade and other receivables do not contain impaired assets.
The maximum exposure to credit risk at the reporting date is the fair value of each class of receivable mentioned above.
Certain subsidiaries of the Group transferred bills receivable balances amounting to US$40,298,000 (31 December 2010:
US$41,905,000 and 1 January 2010: US$38,734,000) to banks in exchange for cash as at 31 December 2011. The transaction has
been accounted for as collateralized bank advances.
At 31 December 2011, trade receivables of US$8,820,000 (31 December 2010: US$14,752,000 and 1 January 2010: US$13,689,000)
were pledged as security for the Group’s bank overdrafts (Note 24).
The carrying amounts of the Group’s and the Company’s trade and other receivables are denominated in the following currencies:
The Group The Company
As at 31 December
As at
1 January As at 31 December
As at
1 January
2011 2010 2010 2011 2010 2010
US$’000 US$’000 US$’000 US$’000 US$’000 US$’000
(Restated) (Restated) (Restated) (Restated)
HK dollar 219,602 179,334 127,662 249 254 187
US dollar 1,626,663 1,648,113 1,529,075 – – –
Euro dollar 244,333 229,783 201,573 – – –
Pound sterling 78,011 86,155 24,702 – – –
Renminbi 104,649 84,272 8,467 – – –
Malaysia Ringgit 42,126 59,554 – – – –
Thailand Baht 52,252 50,248 194 – – –
Others 91,216 89,949 9,081 – – –
2,458,852 2,427,408 1,900,754 249 254 187
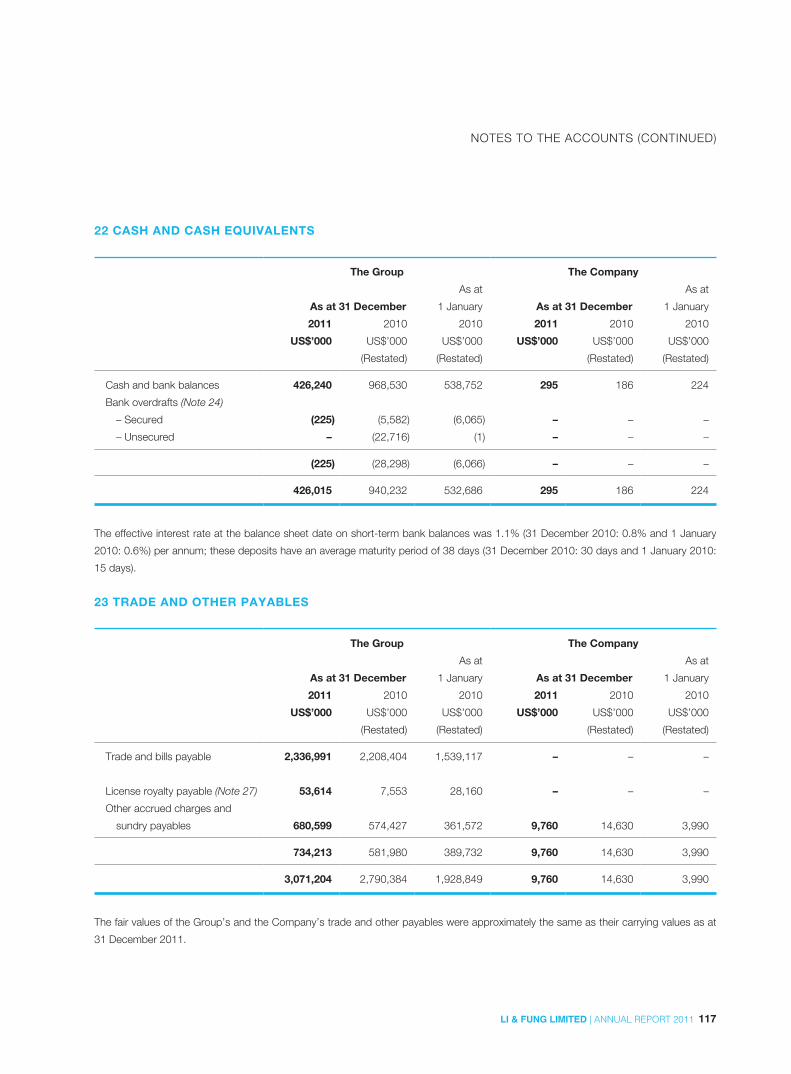
117LI & FUNG LIMITED | ANNUAL REPORT 2011
NOTES TO THE ACCOUNTS (CONTINUED)
22 CASH AND CASH EQUIVALENTS
The Group The Company
As at 31 December
As at
1 January As at 31 December
As at
1 January
2011 2010 2010 2011 2010 2010
US$’000 US$’000 US$’000 US$’000 US$’000 US$’000
(Restated) (Restated) (Restated) (Restated)
Cash and bank balances 426,240 968,530 538,752 295 186 224
Bank overdrafts (Note 24)
– Secured (225) (5,582) (6,065) – – –
– Unsecured – (22,716) (1) – – –
(225) (28,298) (6,066) – – –
426,015 940,232 532,686 295 186 224
The effective interest rate at the balance sheet date on short-term bank balances was 1.1% (31 December 2010: 0.8% and 1 January
2010: 0.6%) per annum; these deposits have an average maturity period of 38 days (31 December 2010: 30 days and 1 January 2010:
15 days).
23 TRADE AND OTHER PAYABLES
The Group The Company
As at 31 December
As at
1 January As at 31 December
As at
1 January
2011 2010 2010 2011 2010 2010
US$’000 US$’000 US$’000 US$’000 US$’000 US$’000
(Restated) (Restated) (Restated) (Restated)
Trade and bills payable 2,336,991 2,208,404 1,539,117 – – –
License royalty payable (Note 27) 53,614 7,553 28,160 – – –
Other accrued charges and
sundry payables 680,599 574,427 361,572 9,760 14,630 3,990
734,213 581,980 389,732 9,760 14,630 3,990
3,071,204 2,790,384 1,928,849 9,760 14,630 3,990
The fair values of the Group’s and the Company’s trade and other payables were approximately the same as their carrying values as at
31 December 2011.
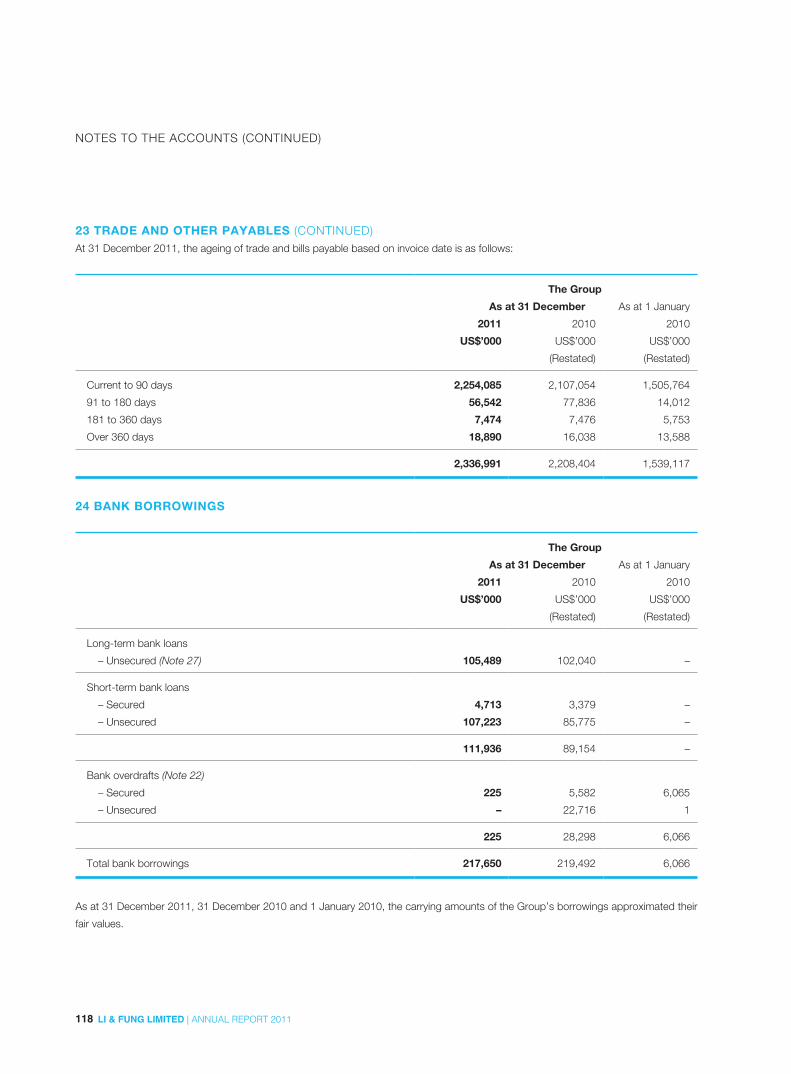
118 LI & FUNG LIMITED | ANNUAL REPORT 2011
NOTES TO THE ACCOUNTS (CONTINUED)
23 TRADE AND OTHER PAYABLES (CONTINUED)At 31 December 2011, the ageing of trade and bills payable based on invoice date is as follows:
The Group
As at 31 December As at 1 January
2011 2010 2010
US$’000 US$’000 US$’000
(Restated) (Restated)
Current to 90 days 2,254,085 2,107,054 1,505,764
91 to 180 days 56,542 77,836 14,012
181 to 360 days 7,474 7,476 5,753
Over 360 days 18,890 16,038 13,588
2,336,991 2,208,404 1,539,117
24 BANK BORROWINGS
The Group
As at 31 December As at 1 January
2011 2010 2010
US$’000 US$’000 US$’000
(Restated) (Restated)
Long-term bank loans
– Unsecured (Note 27) 105,489 102,040 –
Short-term bank loans
– Secured 4,713 3,379 –
– Unsecured 107,223 85,775 –
111,936 89,154 –
Bank overdrafts (Note 22)
– Secured 225 5,582 6,065
– Unsecured – 22,716 1
225 28,298 6,066
Total bank borrowings 217,650 219,492 6,066
As at 31 December 2011, 31 December 2010 and 1 January 2010, the carrying amounts of the Group’s borrowings approximated their
fair values.
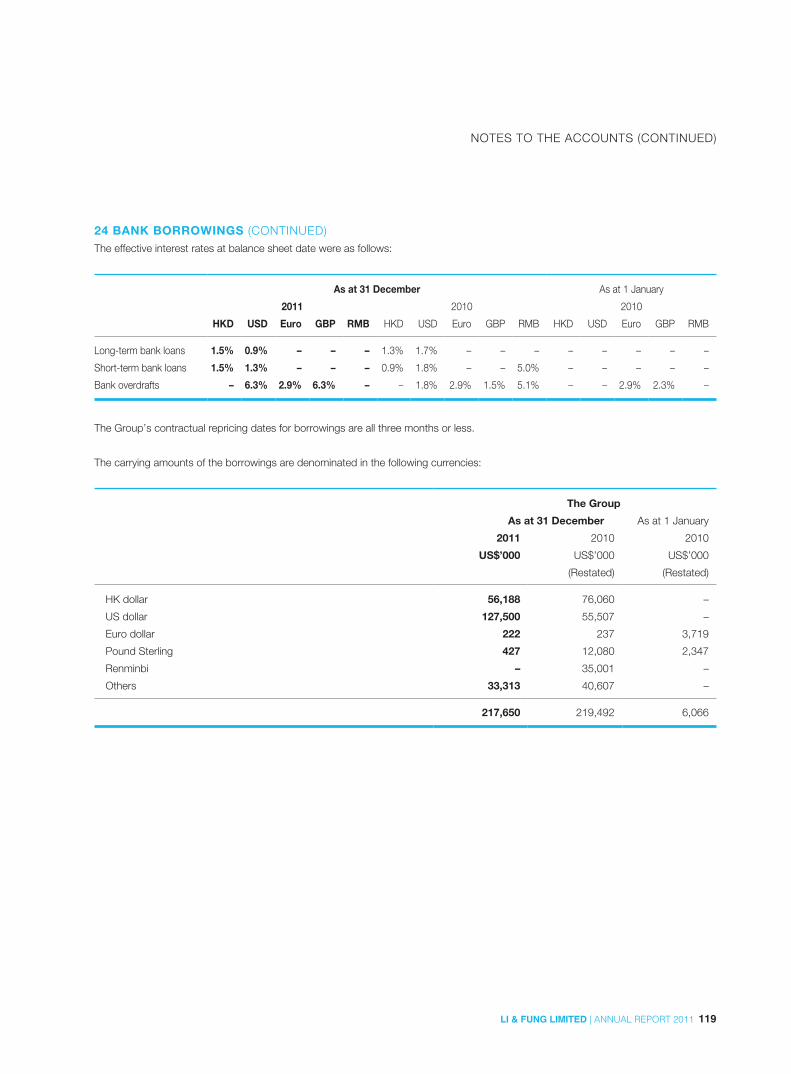
119LI & FUNG LIMITED | ANNUAL REPORT 2011
NOTES TO THE ACCOUNTS (CONTINUED)
24 BANK BORROWINGS (CONTINUED)The effective interest rates at balance sheet date were as follows:
As at 31 December As at 1 January
2011 2010 2010
HKD USD Euro GBP RMB HKD USD Euro GBP RMB HKD USD Euro GBP RMB
Long-term bank loans 1.5% 0.9% – – – 1.3% 1.7% – – – – – – – –
Short-term bank loans 1.5% 1.3% – – – 0.9% 1.8% – – 5.0% – – – – –
Bank overdrafts – 6.3% 2.9% 6.3% – – 1.8% 2.9% 1.5% 5.1% – – 2.9% 2.3% –
The Group’s contractual repricing dates for borrowings are all three months or less.
The carrying amounts of the borrowings are denominated in the following currencies:
The Group
As at 31 December As at 1 January
2011 2010 2010
US$’000 US$’000 US$’000
(Restated) (Restated)
HK dollar 56,188 76,060 –
US dollar 127,500 55,507 –
Euro dollar 222 237 3,719
Pound Sterling 427 12,080 2,347
Renminbi – 35,001 –
Others 33,313 40,607 –
217,650 219,492 6,066
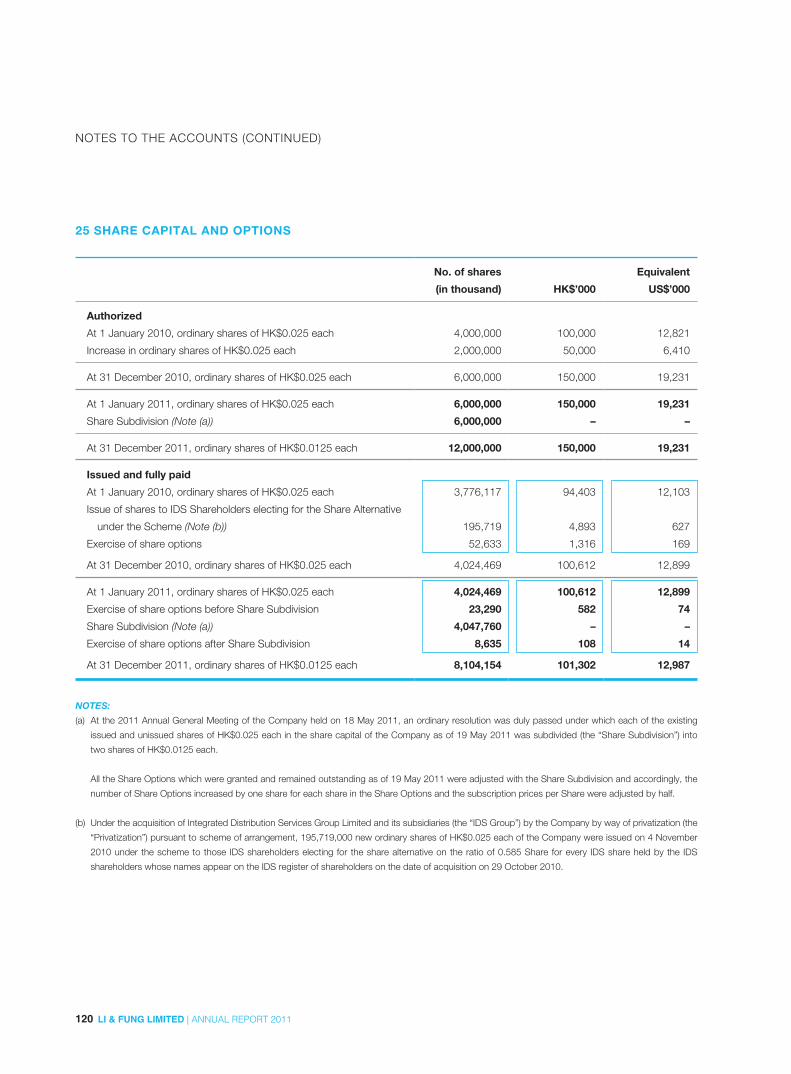
120 LI & FUNG LIMITED | ANNUAL REPORT 2011
NOTES TO THE ACCOUNTS (CONTINUED)
25 SHARE CAPITAL AND OPTIONS
No. of shares Equivalent
(in thousand) HK$’000 US$’000
Authorized
At 1 January 2010, ordinary shares of HK$0.025 each 4,000,000 100,000 12,821
Increase in ordinary shares of HK$0.025 each 2,000,000 50,000 6,410
At 31 December 2010, ordinary shares of HK$0.025 each 6,000,000 150,000 19,231
At 1 January 2011, ordinary shares of HK$0.025 each 6,000,000 150,000 19,231
Share Subdivision (Note (a)) 6,000,000 – –
At 31 December 2011, ordinary shares of HK$0.0125 each 12,000,000 150,000 19,231
Issued and fully paid
At 1 January 2010, ordinary shares of HK$0.025 each 3,776,117 94,403 12,103
Issue of shares to IDS Shareholders electing for the Share Alternative
under the Scheme (Note (b)) 195,719 4,893 627
Exercise of share options 52,633 1,316 169
At 31 December 2010, ordinary shares of HK$0.025 each 4,024,469 100,612 12,899
At 1 January 2011, ordinary shares of HK$0.025 each 4,024,469 100,612 12,899
Exercise of share options before Share Subdivision 23,290 582 74
Share Subdivision (Note (a)) 4,047,760 – –
Exercise of share options after Share Subdivision 8,635 108 14
At 31 December 2011, ordinary shares of HK$0.0125 each 8,104,154 101,302 12,987
NOTES:
(a) At the 2011 Annual General Meeting of the Company held on 18 May 2011, an ordinary resolution was duly passed under which each of the existing
issued and unissued shares of HK$0.025 each in the share capital of the Company as of 19 May 2011 was subdivided (the “Share Subdivision”) into
two shares of HK$0.0125 each.
All the Share Options which were granted and remained outstanding as of 19 May 2011 were adjusted with the Share Subdivision and accordingly, the
number of Share Options increased by one share for each share in the Share Options and the subscription prices per Share were adjusted by half.
(b) Under the acquisition of Integrated Distribution Services Group Limited and its subsidiaries (the “IDS Group”) by the Company by way of privatization (the
“Privatization”) pursuant to scheme of arrangement, 195,719,000 new ordinary shares of HK$0.025 each of the Company were issued on 4 November
2010 under the scheme to those IDS shareholders electing for the share alternative on the ratio of 0.585 Share for every IDS share held by the IDS
shareholders whose names appear on the IDS register of shareholders on the date of acquisition on 29 October 2010.

121LI & FUNG LIMITED | ANNUAL REPORT 2011
NOTES TO THE ACCOUNTS (CONTINUED)
25 SHARE CAPITAL AND OPTIONS (CONTINUED)Details of share options granted by the Company pursuant to the Option Scheme and the share options outstanding at 31 December 2011 are as follows:
Number of Share Options
Exercise Before Share Subdivision Adjustment After Share Subdivision
Grant DatePriceHK$ Exercisable period
As at1/1/2011 Granted Exercised Cancelled Lapsed
for ShareSubdivision Granted Exercised Cancelled Lapsed
As at31/12/2011
20/6/2005 6.72 20/6/2008–19/6/2011 1,973,600 – (1,302,600) – – 671,000 – (1,342,000) – – –20/6/2005 6.72 20/6/2009–19/6/2012 5,414,200 – (2,136,200) – – 3,278,000 – (1,220,000) – – 5,336,00023/1/2006 6.86 20/6/2008–19/6/2011 462,000 – (231,000) – – 231,000 – (462,000) – – –23/1/2006 6.86 20/6/2009–19/6/2012 462,000 – – – – 462,000 – – – – 924,00019/6/2006 7.82 20/6/2008–19/6/2011 194,000 – – – – 194,000 – (388,000) – – –19/6/2006 7.82 20/6/2009–19/6/2012 260,000 – – – – 260,000 – (100,000) – – 420,000
2/2/2007 12.75 20/6/2008–19/6/2011 372,000 – (184,000) – – 188,000 – (248,000) – (128,000) –2/2/2007 12.75 20/6/2009–19/6/2012 1,472,000 – (128,000) – – 1,344,000 – – – – 2,688,000
13/7/2007 14.96 20/6/2009–19/6/2012 482,000 – – – – 482,000 – – (92,000) – 872,00024/1/2008 12.77 1/3/2009–28/2/2011 7,107,000 – (4,744,000) (817,000) (1,546,000) – – – – – –24/1/2008 12.77 1/3/2010–29/2/2012 19,166,400 – (5,695,000) – – 13,471,400 – (2,178,000) (60,000) – 24,704,80024/1/2008 12.77 1/3/2011–28/2/2013 24,378,000 – (4,976,500) – – 19,401,500 – (1,620,000) (60,000) – 37,123,00021/5/2008 15.00 1/3/2009–28/2/2011 922,000 – (541,000) (97,500) (283,500) – – – – – –21/5/2008 15.00 1/3/2010–29/2/2012 1,020,500 – (333,500) – – 687,000 – (30,000) – – 1,344,00021/5/2008 15.00 1/3/2011–28/2/2013 1,370,000 – (267,000) – – 1,103,000 – – – – 2,206,00013/8/2008 13.10 1/3/2009–28/2/2011 389,200 – (173,700) (89,200) (126,300) – – – – – –13/8/2008 13.10 1/3/2010–29/2/2012 1,107,900 – (294,000) – – 813,900 – (75,500) – – 1,552,30013/8/2008 13.10 1/3/2011–28/2/2013 1,697,100 – (334,500) – – 1,362,600 – (122,400) – – 2,602,80024/2/2009 8.61 1/3/2010–29/2/2012 794,000 – (332,000) – – 462,000 – (164,000) (76,000) – 684,00024/2/2009 8.61 1/3/2011–28/2/2013 2,348,000 – (1,279,600) – – 1,068,400 – (472,800) (60,000) – 1,604,00014/8/2009 13.90 1/3/2010–29/2/2012 1,274,500 – (79,300) – – 1,195,200 – (149,400) – – 2,241,00014/8/2009 13.90 1/3/2011–28/2/2013 2,098,200 – (258,400) – – 1,839,800 – (63,200) – – 3,616,40025/3/2010 20.76 1/3/2011–28/2/2013 2,733,100 – – – – 2,733,100 – – (599,600) – 4,866,600
15/11/2010 22.42 1/3/2011–28/2/2013 1,178,600 – – – – 1,178,600 – – – – 2,357,20011/4/2011 20.21 1/5/2012–30/4/2015 – 16,501,000 – – – 16,501,000 – – (142,000) – 32,860,00011/4/2011 20.21 1/5/2013–30/4/2015 – 16,777,000 – – – 16,777,000 – – (150,000) – 33,404,00011/4/2011 20.21 1/5/2014–30/4/2016 – 41,722,000 – – – 41,722,000 – – (218,000) – 83,226,000
21/11/2011 15.20 1/5/2012–30/4/2015 – – – – – – 2,162,000 – (123,000) – 2,039,00021/11/2011 15.20 1/5/2013–30/4/2015 – – – – – – 4,476,000 – (248,000) – 4,228,00021/11/2011 15.20 1/5/2014–30/4/2016 – – – – – – 10,011,000 – (554,000) – 9,457,00022/12/2011 14.50 1/5/2013–30/4/2015 – – – – – – 3,000,000 – – – 3,000,00022/12/2011 14.50 1/5/2014–30/4/2016 – – – – – – 3,000,000 – – – 3,000,00022/12/2011 14.50 1/5/2015–30/4/2017 – – – – – – 3,000,000 – – – 3,000,00022/12/2011 14.50 1/5/2016–30/4/2018 – – – – – – 3,000,000 – – – 3,000,00022/12/2011 14.50 1/5/2017–30/4/2019 – – – – – – 3,000,000 – – – 3,000,00022/12/2011 14.50 1/5/2018–30/4/2020 – – – – – – 3,000,000 – – – 3,000,00022/12/2011 14.50 1/5/2019–30/4/2021 – – – – – – 3,000,000 – – – 3,000,00022/12/2011 14.50 1/5/2020–30/4/2022 – – – – – – 3,000,000 – – – 3,000,00022/12/2011 14.50 1/5/2021–30/4/2023 – – – – – – 3,000,000 – – – 3,000,000
Total 78,676,300 75,000,000 (23,290,300) (1,003,700) (1,955,800) 127,426,500 43,649,000 (8,635,300) (2,382,600) (128,000) 287,356,100
Subsequent to 31 December 2011, 31,048,800 Shares have been allotted and issued under the Option Scheme.
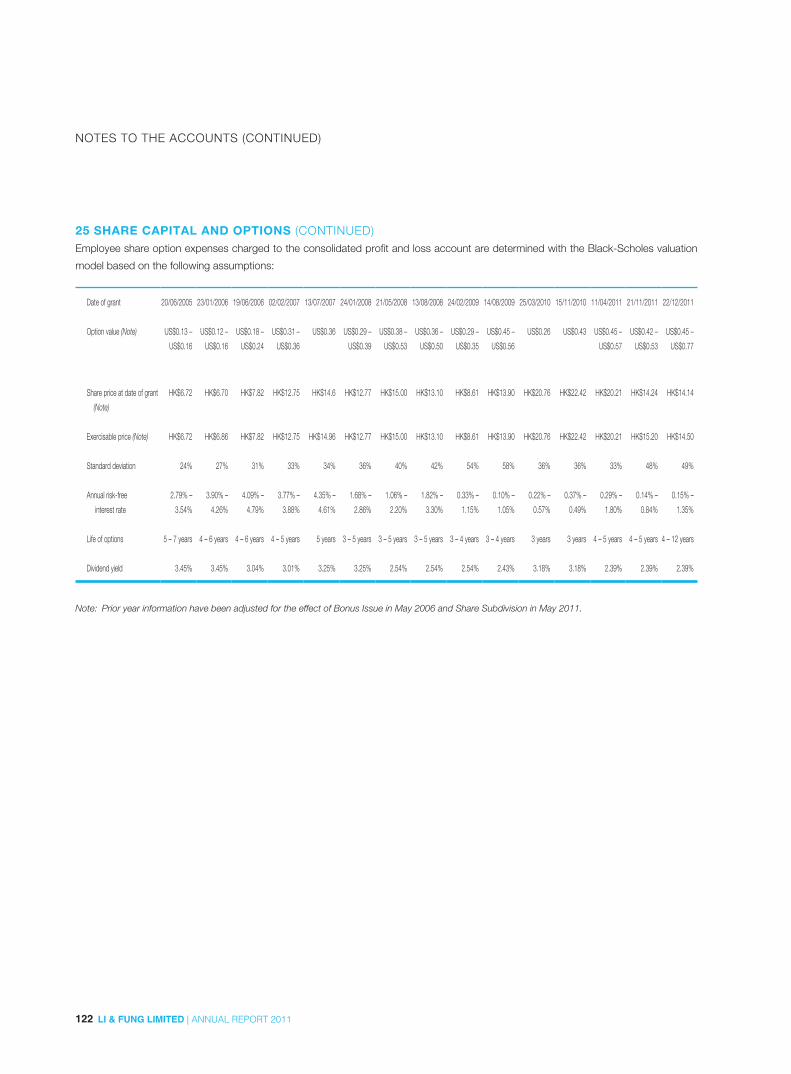
122 LI & FUNG LIMITED | ANNUAL REPORT 2011
NOTES TO THE ACCOUNTS (CONTINUED)
25 SHARE CAPITAL AND OPTIONS (CONTINUED)Employee share option expenses charged to the consolidated profit and loss account are determined with the Black-Scholes valuation
model based on the following assumptions:
Date of grant 20/06/2005 23/01/2006 19/06/2006 02/02/2007 13/07/2007 24/01/2008 21/05/2008 13/08/2008 24/02/2009 14/08/2009 25/03/2010 15/11/2010 11/04/2011 21/11/2011 22/12/2011
Option value (Note) US$0.13 –
US$0.16
US$0.12 –
US$0.16
US$0.18 –
US$0.24
US$0.31 –
US$0.36
US$0.36 US$0.29 –
US$0.39
US$0.38 –
US$0.53
US$0.36 –
US$0.50
US$0.29 –
US$0.35
US$0.45 –
US$0.56
US$0.26 US$0.43 US$0.45 –
US$0.57
US$0.42 –
US$0.53
US$0.45 –
US$0.77
Share price at date of grant
(Note)
HK$6.72 HK$6.70 HK$7.82 HK$12.75 HK$14.6 HK$12.77 HK$15.00 HK$13.10 HK$8.61 HK$13.90 HK$20.76 HK$22.42 HK$20.21 HK$14.24 HK$14.14
Exercisable price (Note) HK$6.72 HK$6.86 HK$7.82 HK$12.75 HK$14.96 HK$12.77 HK$15.00 HK$13.10 HK$8.61 HK$13.90 HK$20.76 HK$22.42 HK$20.21 HK$15.20 HK$14.50
Standard deviation 24% 27% 31% 33% 34% 36% 40% 42% 54% 58% 36% 36% 33% 48% 49%
Annual risk-free
interest rate
2.79% –
3.54%
3.90% –
4.26%
4.09% –
4.79%
3.77% –
3.88%
4.35% –
4.61%
1.68% –
2.86%
1.06% –
2.20%
1.82% –
3.30%
0.33% –
1.15%
0.10% –
1.05%
0.22% –
0.57%
0.37% –
0.49%
0.29% –
1.80%
0.14% –
0.84%
0.15% –
1.35%
Life of options 5 – 7 years 4 – 6 years 4 – 6 years 4 – 5 years 5 years 3 – 5 years 3 – 5 years 3 – 5 years 3 – 4 years 3 – 4 years 3 years 3 years 4 – 5 years 4 – 5 years 4 – 12 years
Dividend yield 3.45% 3.45% 3.04% 3.01% 3.25% 3.25% 2.54% 2.54% 2.54% 2.43% 3.18% 3.18% 2.39% 2.39% 2.39%
Note: Prior year information have been adjusted for the effect of Bonus Issue in May 2006 and Share Subdivision in May 2011.

123LI & FUNG LIMITED | ANNUAL REPORT 2011
NOTES TO THE ACCOUNTS (CONTINUED)
26 RESERVES
(a) THE GROUP
Shares held
by escrow
agent for
settlement of
acquisition
consideration
(Note (iii))
Capital
reserve
(Note (i))
Employee
share-based
compensation
reserve
Revaluation
reserve
Hedging
reserve
Deferred
benefit
obligation
Exchange
reserve Total
US$’000 US$’000 US$’000 US$’000 US$’000 US$’000 US$’000 US$’000
Balance at 1 January 2011 (23,385) 3,544 45,826 2,308 (752) – (50,409) (22,868)
Comprehensive income
Currency translation differences – – – – – – (27,803) (27,803)
Net fair value gains on available-for-sale
financial assets, net of tax (Note 17) – – – 188 – – – 188
Net fair value gains on cash flow hedges,
net of tax – – – – 10,226 – – 10,226
Net actuarial loss from post employment benefits – – – – – (3,549) – (3,549)
Transactions with owners
Employee share option scheme:
– value of employee services – – 18,906 – – – – 18,906
– transfer to share premium – – (17,495) – – – – (17,495)
Release of shares held by escrow agent for
settlement of acquisition consideration 14,882 – – – – – – 14,882
Transfer to capital reserve – 74 – – – – – 74
At 31 December 2011 (8,503) 3,618 47,237 2,496 9,474 (3,549) (78,212) (27,439)
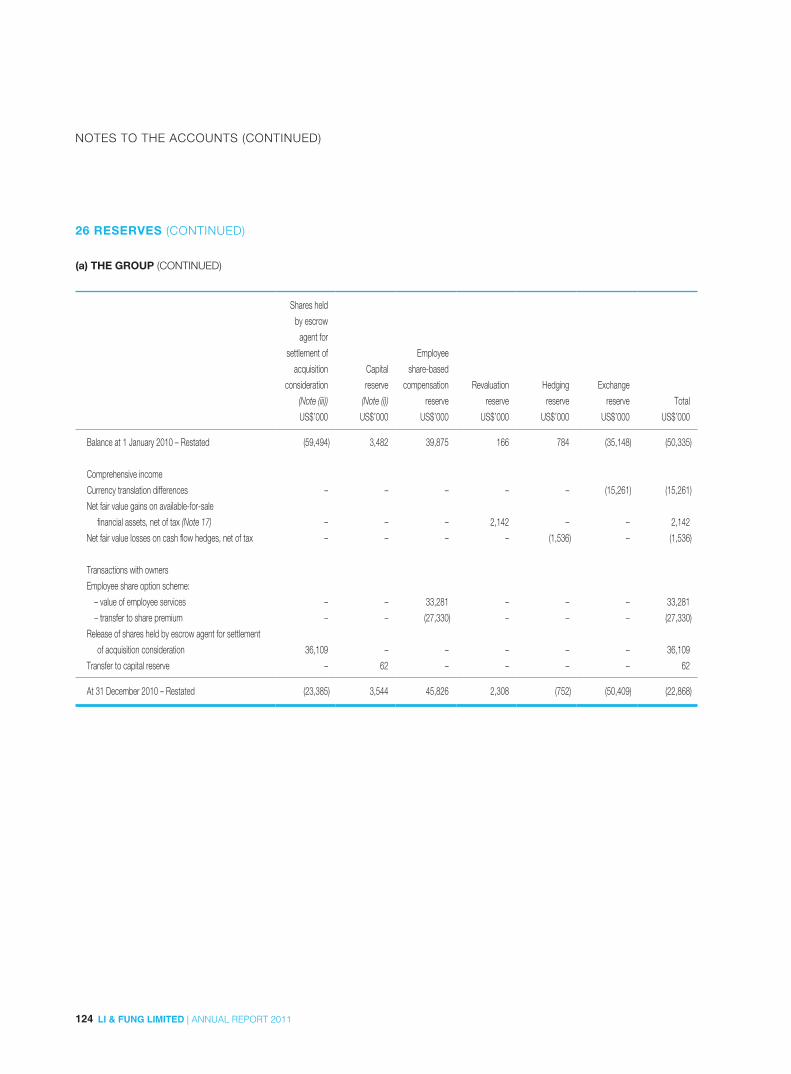
124 LI & FUNG LIMITED | ANNUAL REPORT 2011
NOTES TO THE ACCOUNTS (CONTINUED)
26 RESERVES (CONTINUED)
(a) THE GROUP (CONTINUED)
Shares held
by escrow
agent for
settlement of
acquisition
consideration
(Note (iii))
Capital
reserve
(Note (i))
Employee
share-based
compensation
reserve
Revaluation
reserve
Hedging
reserve
Exchange
reserve Total
US$’000 US$’000 US$’000 US$’000 US$’000 US$’000 US$’000
Balance at 1 January 2010 – Restated (59,494) 3,482 39,875 166 784 (35,148) (50,335)
Comprehensive income
Currency translation differences – – – – – (15,261) (15,261)
Net fair value gains on available-for-sale
financial assets, net of tax (Note 17) – – – 2,142 – – 2,142
Net fair value losses on cash flow hedges, net of tax – – – – (1,536) – (1,536)
Transactions with owners
Employee share option scheme:
– value of employee services – – 33,281 – – – 33,281
– transfer to share premium – – (27,330) – – – (27,330)
Release of shares held by escrow agent for settlement
of acquisition consideration 36,109 – – – – – 36,109
Transfer to capital reserve – 62 – – – – 62
At 31 December 2010 – Restated (23,385) 3,544 45,826 2,308 (752) (50,409) (22,868)
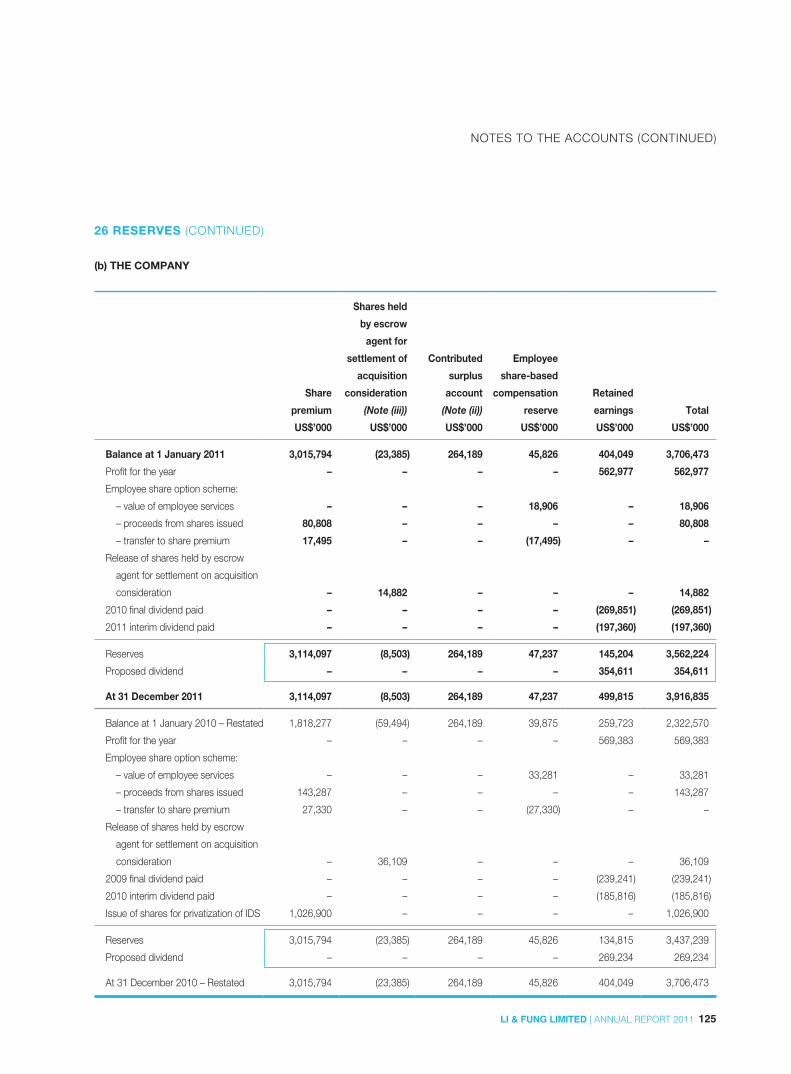
125LI & FUNG LIMITED | ANNUAL REPORT 2011
NOTES TO THE ACCOUNTS (CONTINUED)
26 RESERVES (CONTINUED)
(b) THE COMPANY
Share
premium
Shares held
by escrow
agent for
settlement of
acquisition
consideration
(Note (iii))
Contributed
surplus
account
(Note (ii))
Employee
share-based
compensation
reserve
Retained
earnings Total
US$’000 US$’000 US$’000 US$’000 US$’000 US$’000
Balance at 1 January 2011 3,015,794 (23,385) 264,189 45,826 404,049 3,706,473
Profit for the year – – – – 562,977 562,977
Employee share option scheme:
– value of employee services – – – 18,906 – 18,906
– proceeds from shares issued 80,808 – – – – 80,808
– transfer to share premium 17,495 – – (17,495) – –
Release of shares held by escrow
agent for settlement on acquisition
consideration – 14,882 – – – 14,882
2010 final dividend paid – – – – (269,851) (269,851)
2011 interim dividend paid – – – – (197,360) (197,360)
Reserves 3,114,097 (8,503) 264,189 47,237 145,204 3,562,224
Proposed dividend – – – – 354,611 354,611
At 31 December 2011 3,114,097 (8,503) 264,189 47,237 499,815 3,916,835
Balance at 1 January 2010 – Restated 1,818,277 (59,494) 264,189 39,875 259,723 2,322,570
Profit for the year – – – – 569,383 569,383
Employee share option scheme:
– value of employee services – – – 33,281 – 33,281
– proceeds from shares issued 143,287 – – – – 143,287
– transfer to share premium 27,330 – – (27,330) – –
Release of shares held by escrow
agent for settlement on acquisition
consideration – 36,109 – – – 36,109
2009 final dividend paid – – – – (239,241) (239,241)
2010 interim dividend paid – – – – (185,816) (185,816)
Issue of shares for privatization of IDS 1,026,900 – – – – 1,026,900
Reserves 3,015,794 (23,385) 264,189 45,826 134,815 3,437,239
Proposed dividend – – – – 269,234 269,234
At 31 December 2010 – Restated 3,015,794 (23,385) 264,189 45,826 404,049 3,706,473
126 LI & FUNG LIMITED | ANNUAL REPORT 2011
NOTES TO THE ACCOUNTS (CONTINUED)
26 RESERVES (CONTINUED)
(b) THE COMPANY (CONTINUED)NOTES:
(i) Capital reserve represents amount set aside from the profit of certain overseas subsidiaries of the Group in accordance with the local statutory
requirements.
(ii) The contributed surplus account of the Company represents:
(1) The difference between the nominal value of the Company’s shares issued in exchange for the issued ordinary shares of Li & Fung (B.V.I.) Limited
and the value of net assets of the underlying subsidiaries acquired as at 2 June 1992 amounting to US$14,232,000. At Group level, the amount is
reclassified into its components of reserves of the underlying subsidiaries.
(2) The difference between the issue price and the nominal value of the Company’s shares issued in connection with the acquisition of Colby in 2000
amounting to US$249,957,000. At Group level, the amount is set off against goodwill arising from the acquisition.
(iii) The Company issued shares for acquisitions of CGroup and Regatta in 2007. These Shares were held by escrow agents and valued at the respective
agreed upon issue price. During the year, certain portions of these shares amounted to approximately US$14,882,000 were released to the vendors
as the settlement of deferred considerations. At the balance sheet date, the remaining shares held by the escrow agent amounted to approximately
US$8,503,000 were deducted from total equity. The total amount of deferred consideration for the acquisition of CGroup had been finalized.
Accordingly, the remaining shares held by the escrow agent for CGroup of approximately US$6,739,000 were considered as treasury shares of the
Company as of 31 December 2011.

127LI & FUNG LIMITED | ANNUAL REPORT 2011
NOTES TO THE ACCOUNTS (CONTINUED)
27 LONG-TERM LIABILITIES
The Group The Company
As at 31 December
As at
1 January As at 31 December
As at
1 January
2011 2010 2010 2011 2010 2010
US$’000 US$’000 US$’000 US$’000 US$’000 US$’000
(Restated) (Restated) (Restated) (Restated)
Long-term loans from non-
controlling shareholders 4,910 4,921 4,983 – – –
Long-term bank loans (Note 24) 105,489 102,040 – – – –
Long-term notes – unsecured 1,256,007 1,256,552 496,452 1,256,007 1,256,552 496,452
Balance of purchase consideration
payable for acquisitions 1,970,376 1,168,742 438,761 – – –
Balance of purchase consideration
payable for acquisitions to be
settled by shares issued and
held by escrow agent 1,764 16,646 59,494 – – –
License royalty payable 225,036 195,518 57,697 – – –
Other non-current liability
(non-financial liability) 66,530 34,787 10,323 – – –
3,630,112 2,779,206 1,067,710 1,256,007 1,256,552 496,452
Current portion of balance of
purchase consideration
payable for acquisitions (323,712) (248,314) (145,983) – – –
Current portion of balance of
purchase consideration payable
for acquisitions to be settled
by shares issued and held by
escrow agent (1,764) (16,646) (41,500) – – –
Current portion of license royalty
payable (Note 23) (53,614) (7,553) (28,160) – – –
3,251,022 2,506,693 852,067 1,256,007 1,256,552 496,452
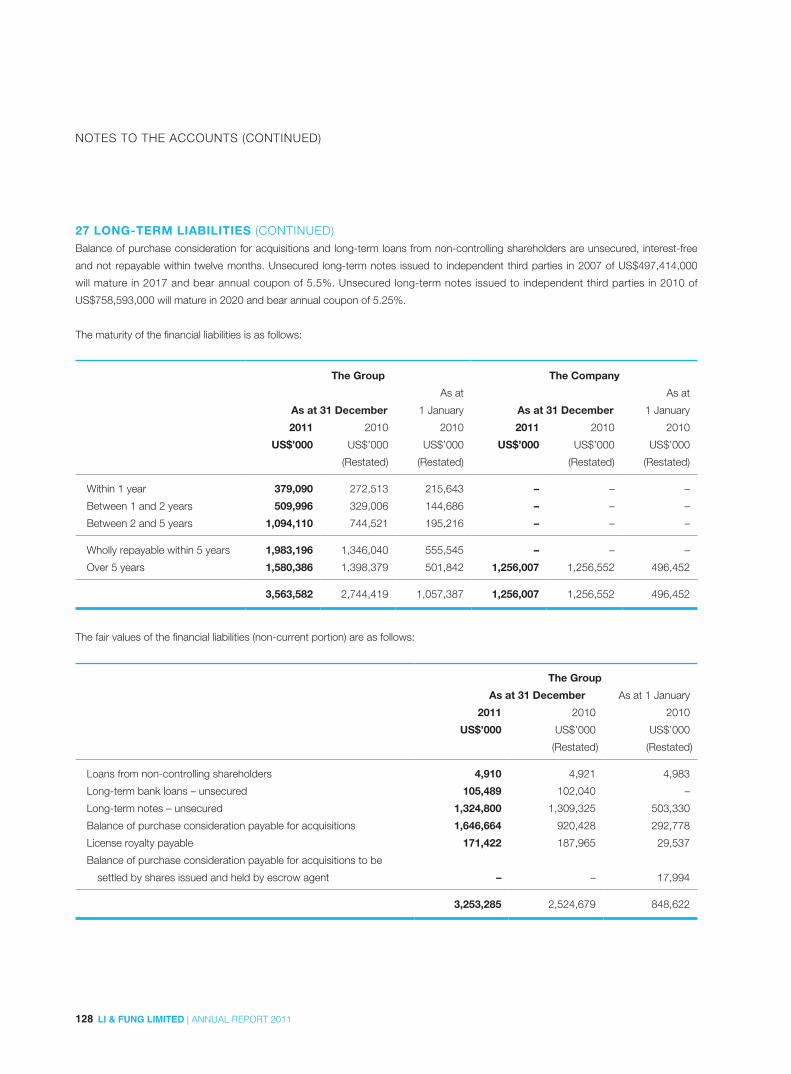
128 LI & FUNG LIMITED | ANNUAL REPORT 2011
NOTES TO THE ACCOUNTS (CONTINUED)
27 LONG-TERM LIABILITIES (CONTINUED)Balance of purchase consideration for acquisitions and long-term loans from non-controlling shareholders are unsecured, interest-free
and not repayable within twelve months. Unsecured long-term notes issued to independent third parties in 2007 of US$497,414,000
will mature in 2017 and bear annual coupon of 5.5%. Unsecured long-term notes issued to independent third parties in 2010 of
US$758,593,000 will mature in 2020 and bear annual coupon of 5.25%.
The maturity of the financial liabilities is as follows:
The Group The Company
As at 31 December
As at
1 January As at 31 December
As at
1 January
2011 2010 2010 2011 2010 2010
US$’000 US$’000 US$’000 US$’000 US$’000 US$’000
(Restated) (Restated) (Restated) (Restated)
Within 1 year 379,090 272,513 215,643 – – –
Between 1 and 2 years 509,996 329,006 144,686 – – –
Between 2 and 5 years 1,094,110 744,521 195,216 – – –
Wholly repayable within 5 years 1,983,196 1,346,040 555,545 – – –
Over 5 years 1,580,386 1,398,379 501,842 1,256,007 1,256,552 496,452
3,563,582 2,744,419 1,057,387 1,256,007 1,256,552 496,452
The fair values of the financial liabilities (non-current portion) are as follows:
The Group
As at 31 December As at 1 January
2011 2010 2010
US$’000 US$’000 US$’000
(Restated) (Restated)
Loans from non-controlling shareholders 4,910 4,921 4,983
Long-term bank loans – unsecured 105,489 102,040 –
Long-term notes – unsecured 1,324,800 1,309,325 503,330
Balance of purchase consideration payable for acquisitions 1,646,664 920,428 292,778
License royalty payable 171,422 187,965 29,537
Balance of purchase consideration payable for acquisitions to be
settled by shares issued and held by escrow agent – – 17,994
3,253,285 2,524,679 848,622

129LI & FUNG LIMITED | ANNUAL REPORT 2011
NOTES TO THE ACCOUNTS (CONTINUED)
27 LONG-TERM LIABILITIES (CONTINUED)The carrying amounts of financial liabilities are denominated in the following currencies:
The Group
As at 31 December As at 1 January
2011 2010 2010
US$’000 US$’000 US$’000
(Restated) (Restated)
Hong Kong dollar 148,120 166,261 17,360
US dollar 2,970,644 2,353,074 1,025,608
Pound sterling 193,826 209,232 12,419
Euro dollar 233,809 – 2,000
Others 17,183 15,852 –
3,563,582 2,744,419 1,057,387
28 POST-EMPLOYMENT BENEFIT OBLIGATIONS
The Group
As at 31 December As at 1 January
2011 2010 2010
US$’000 US$’000 US$’000
(Restated) (Restated)
Pension obligations (Note) 7,713 4,576 2,097
Long service payment liabilities 5,383 3,735 1,206
13,096 8,311 3,303
NOTE: The Group participates in a number of defined benefit plans in certain countries. Most of these pension plans are final salary defined benefit plans.
The assets of the funded plans are held independently of the Group’s assets in separate trustee-administered funds. The Group’s defined benefit
plans are valued by qualified actuaries annually using the projected unit credit method.

130 LI & FUNG LIMITED | ANNUAL REPORT 2011
NOTES TO THE ACCOUNTS (CONTINUED)
28 POST-EMPLOYMENT BENEFIT OBLIGATIONS (CONTINUED)(i) The amount recognized in the consolidated balance sheet is determined as follows:
The Group
As at 31 December As at 1 January
2011 2010 2010
US$’000 US$’000 US$’000
(Restated) (Restated)
Present value obligations 43,808 38,863 28,361
Fair value of plan assets (28,936) (28,792) (18,957)
14,872 10,071 9,404
Unrecognized actuarial losses (7,173) (5,495) (7,307)
Amount not recognized as assets 14 – –
Pension obligations 7,713 4,576 2,097
(ii) The amount recognized in the consolidated profit and loss account is as follows:
The Group
2011 2010
US$’000 US$’000
(Restated)
Current service cost 2,795 1,810
Interest cost 1,358 1,186
Expected return on plan assets (1,361) (955)
Net actuarial loss recognized during the year 349 392
Gains on curtailments and settlements (75) (739)
Total, included in staff costs (Note 10) 3,066 1,694

131LI & FUNG LIMITED | ANNUAL REPORT 2011
NOTES TO THE ACCOUNTS (CONTINUED)
28 POST-EMPLOYMENT BENEFIT OBLIGATIONS (CONTINUED)(iii) The movements in the fair value of plan assets of the year are as follows:
The Group
2011 2010
US$’000 US$’000
(Restated)
At 1 January 28,792 18,957
Expected return on plan assets 1,361 955
Actuarial (losses)/gains (941) 1,283
Exchange differences (480) 737
Assets acquired in business combination – 7,719
Transferred out (113) –
Employer contributions 1,676 1,392
Benefits paid (1,359) (2,251)
At 31 December 28,936 28,792
(iv) Movement in the net pension obligations recognized in the consolidated balance sheet:
The Group
2011 2010
US$’000 US$’000
(Restated)
At 1 January 4,576 2,097
Total expense – as shown in (ii) 3,066 1,694
Contributions paid (1,821) (1,392)
Exchange difference (151) 343
Liabilities acquired in business combination 426 1,834
Net actuarial loss recognized through reserve 1,617 –
At 31 December 7,713 4,576

132 LI & FUNG LIMITED | ANNUAL REPORT 2011
NOTES TO THE ACCOUNTS (CONTINUED)
28 POST-EMPLOYMENT BENEFIT OBLIGATIONS (CONTINUED)(v) The principal actuarial assumptions used are as follows:
As at 31 December As at 1 January
2011 2010 2010
% % %
Discount rate 1.75–7.75 1.75–7.13 2.25–11.06
Expected rate of return on plan assets 1.75–6.5 1.75–6.4 2.25–7
Expected rate of future salary increases 3–8 3–8 3–5.5
Expected rate of future pension increases 2.9 3.3 3.4
(vi) Experience adjustments (loss)/gain:
The Group
2011 2010
US$’000 US$’000
(Restated)
Experience adjustments on plan liabilities (2,469) 394
Experience adjustments on plan assets (941) 1,283
29 DEFERRED TAXATIONDeferred taxation is calculated in full on temporary differences under the liability method using a principal taxation rate of 16.5% (2010:
16.5%).
The movement on the net deferred tax liabilities is as follows:
The Group
2011 2010
US$’000 US$’000
(Restated)
At 1 January 9,180 1,624
Charged/(credited) to consolidated profit and loss account (Note 6) 18,886 (5,988)
Acquisition of businesses/subsidiaries (Note 31) (38) 13,579
Adjustments to purchase consideration and net asset value 572 –
Disposal of subsidiaries 135 –
Exchange differences (7) (35)
At 31 December 28,728 9,180
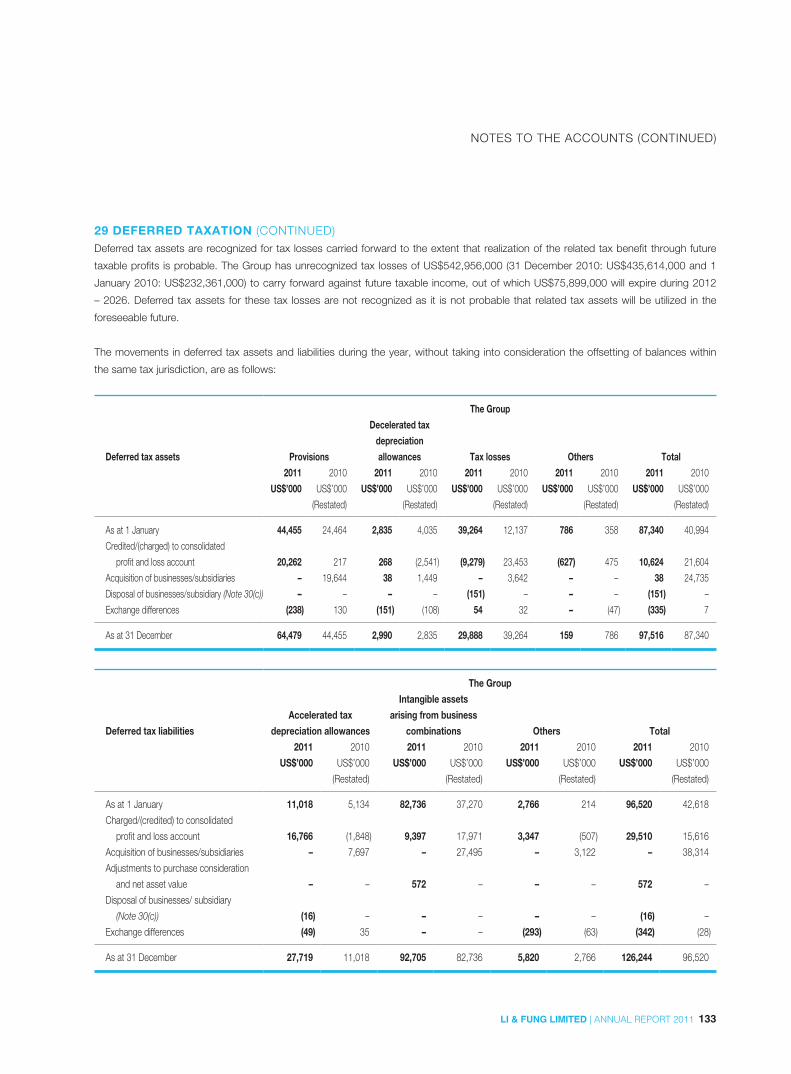
133LI & FUNG LIMITED | ANNUAL REPORT 2011
NOTES TO THE ACCOUNTS (CONTINUED)
29 DEFERRED TAXATION (CONTINUED)Deferred tax assets are recognized for tax losses carried forward to the extent that realization of the related tax benefit through future
taxable profits is probable. The Group has unrecognized tax losses of US$542,956,000 (31 December 2010: US$435,614,000 and 1
January 2010: US$232,361,000) to carry forward against future taxable income, out of which US$75,899,000 will expire during 2012
– 2026. Deferred tax assets for these tax losses are not recognized as it is not probable that related tax assets will be utilized in the
foreseeable future.
The movements in deferred tax assets and liabilities during the year, without taking into consideration the offsetting of balances within
the same tax jurisdiction, are as follows:
The Group
Deferred tax assets Provisions
Decelerated tax
depreciation
allowances Tax losses Others Total
2011 2010 2011 2010 2011 2010 2011 2010 2011 2010
US$’000 US$’000 US$’000 US$’000 US$’000 US$’000 US$’000 US$’000 US$’000 US$’000
(Restated) (Restated) (Restated) (Restated) (Restated)
As at 1 January 44,455 24,464 2,835 4,035 39,264 12,137 786 358 87,340 40,994
Credited/(charged) to consolidated
profit and loss account 20,262 217 268 (2,541) (9,279) 23,453 (627) 475 10,624 21,604
Acquisition of businesses/subsidiaries – 19,644 38 1,449 – 3,642 – – 38 24,735
Disposal of businesses/subsidiary (Note 30(c)) – – – – (151) – – – (151) –
Exchange differences (238) 130 (151) (108) 54 32 – (47) (335) 7
As at 31 December 64,479 44,455 2,990 2,835 29,888 39,264 159 786 97,516 87,340
The Group
Deferred tax liabilities
Accelerated tax
depreciation allowances
Intangible assets
arising from business
combinations Others Total
2011 2010 2011 2010 2011 2010 2011 2010
US$’000 US$’000 US$’000 US$’000 US$’000 US$’000 US$’000 US$’000
(Restated) (Restated) (Restated) (Restated)
As at 1 January 11,018 5,134 82,736 37,270 2,766 214 96,520 42,618
Charged/(credited) to consolidated
profit and loss account 16,766 (1,848) 9,397 17,971 3,347 (507) 29,510 15,616
Acquisition of businesses/subsidiaries – 7,697 – 27,495 – 3,122 – 38,314
Adjustments to purchase consideration
and net asset value – – 572 – – – 572 –
Disposal of businesses/ subsidiary
(Note 30(c)) (16) – – – – – (16) –
Exchange differences (49) 35 – – (293) (63) (342) (28)
As at 31 December 27,719 11,018 92,705 82,736 5,820 2,766 126,244 96,520

134 LI & FUNG LIMITED | ANNUAL REPORT 2011
NOTES TO THE ACCOUNTS (CONTINUED)
29 DEFERRED TAXATION (CONTINUED)After offsetting balances within the same tax jurisdiction, the balances as disclosed in the consolidated balance sheet are as follows:
The Group
As at 31 December As at 1 January
2011 2010 2010
US$’000 US$’000 US$’000
(Restated) (Restated)
Deferred tax assets 24,148 20,195 7,459
Deferred tax liabilities (52,876) (29,375) (9,083)
(28,728) (9,180) (1,624)
The Group
As at 31 December As at 1 January
2011 2010 2010
US$’000 US$’000 US$’000
(Restated) (Restated)
The amounts shown in the consolidated balance sheet
include the following:
Deferred tax assets to be recovered after more than 12 months 16,666 19,084 6,425
Deferred tax assets to be recovered within 12 months 7,482 1,111 1,034
Deferred tax liabilities to be settled after more than 12 months 45,512 28,213 7,424
Deferred tax liabilities to be settled within 12 months 7,364 1,162 1,659
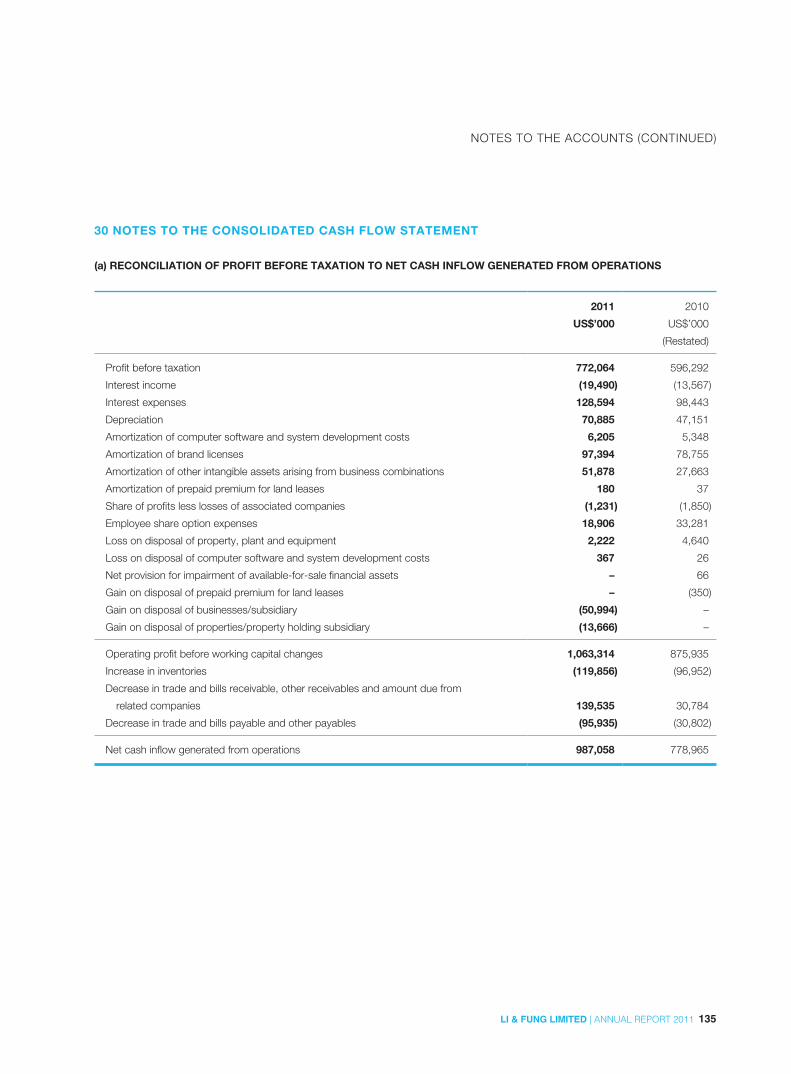
135LI & FUNG LIMITED | ANNUAL REPORT 2011
NOTES TO THE ACCOUNTS (CONTINUED)
30 NOTES TO THE CONSOLIDATED CASH FLOW STATEMENT
(a) RECONCILIATION OF PROFIT BEFORE TAXATION TO NET CASH INFLOW GENERATED FROM OPERATIONS
2011 2010
US$’000 US$’000
(Restated)
Profit before taxation 772,064 596,292
Interest income (19,490) (13,567)
Interest expenses 128,594 98,443
Depreciation 70,885 47,151
Amortization of computer software and system development costs 6,205 5,348
Amortization of brand licenses 97,394 78,755
Amortization of other intangible assets arising from business combinations 51,878 27,663
Amortization of prepaid premium for land leases 180 37
Share of profits less losses of associated companies (1,231) (1,850)
Employee share option expenses 18,906 33,281
Loss on disposal of property, plant and equipment 2,222 4,640
Loss on disposal of computer software and system development costs 367 26
Net provision for impairment of available-for-sale financial assets – 66
Gain on disposal of prepaid premium for land leases – (350)
Gain on disposal of businesses/subsidiary (50,994) –
Gain on disposal of properties/property holding subsidiary (13,666) –
Operating profit before working capital changes 1,063,314 875,935
Increase in inventories (119,856) (96,952)
Decrease in trade and bills receivable, other receivables and amount due from
related companies 139,535 30,784
Decrease in trade and bills payable and other payables (95,935) (30,802)
Net cash inflow generated from operations 987,058 778,965
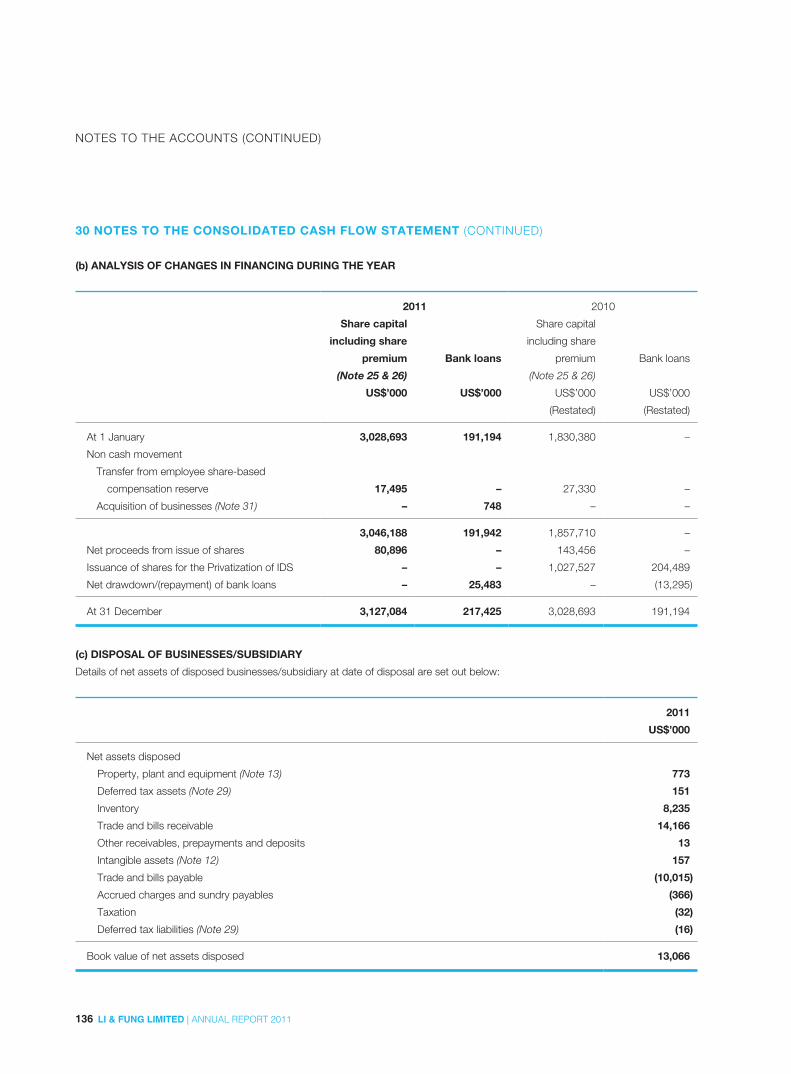
136 LI & FUNG LIMITED | ANNUAL REPORT 2011
NOTES TO THE ACCOUNTS (CONTINUED)
30 NOTES TO THE CONSOLIDATED CASH FLOW STATEMENT (CONTINUED)
(b) ANALYSIS OF CHANGES IN FINANCING DURING THE YEAR
2011 2010
Share capital
including share
premium Bank loans
Share capital
including share
premium Bank loans
(Note 25 & 26) (Note 25 & 26)
US$’000 US$’000 US$’000 US$’000
(Restated) (Restated)
At 1 January 3,028,693 191,194 1,830,380 –
Non cash movement
Transfer from employee share-based
compensation reserve 17,495 – 27,330 –
Acquisition of businesses (Note 31) – 748 – –
3,046,188 191,942 1,857,710 –
Net proceeds from issue of shares 80,896 – 143,456 –
Issuance of shares for the Privatization of IDS – – 1,027,527 204,489
Net drawdown/(repayment) of bank loans – 25,483 – (13,295)
At 31 December 3,127,084 217,425 3,028,693 191,194
(c) DISPOSAL OF BUSINESSES/SUBSIDIARY
Details of net assets of disposed businesses/subsidiary at date of disposal are set out below:
2011
US$’000
Net assets disposed
Property, plant and equipment (Note 13) 773
Deferred tax assets (Note 29) 151
Inventory 8,235
Trade and bills receivable 14,166
Other receivables, prepayments and deposits 13
Intangible assets (Note 12) 157
Trade and bills payable (10,015)
Accrued charges and sundry payables (366)
Taxation (32)
Deferred tax liabilities (Note 29) (16)
Book value of net assets disposed 13,066

137LI & FUNG LIMITED | ANNUAL REPORT 2011
NOTES TO THE ACCOUNTS (CONTINUED)
30 NOTES TO THE CONSOLIDATED CASH FLOW STATEMENT (CONTINUED)
(c) DISPOSAL OF BUSINESSES/SUBSIDIARY (CONTINUED)
Analysis of net inflow of cash and cash equivalents in respect of the disposal:
2011
US$’000
Consideration received 66,246
Expenses incurred in respect of the disposal (2,186)
Net inflow of cash and cash equivalents in respect of disposal of businesses/subsidiary 64,060
Analysis of gain on disposal of businesses/subsidiary:
2011
US$’000
Consideration net of expenses incurred 64,060
Less: Net assets disposed (13,066)
Gain on disposal of businesses/subsidiary (Note 4) 50,994
(d) DISPOSAL OF PROPERTIES/PROPERTY HOLDING SUBSIDIARY
Details of net assets of disposed properties/property holding subsidiary at date of disposal are set out below:
2011
US$’000
Net assets disposed
Property, plant and equipments (Note 13) 12,175
Prepaid premium for land leases (Note 14) 239
Other receivables, prepayments and deposits 36
Accrued charges and sundry payables 71
Taxation 14
Book value of net assets disposed 12,535

138 LI & FUNG LIMITED | ANNUAL REPORT 2011
NOTES TO THE ACCOUNTS (CONTINUED)
30 NOTES TO THE CONSOLIDATED CASH FLOW STATEMENT (CONTINUED)
(d) DISPOSAL OF PROPERTIES/PROPERTY HOLDING SUBSIDIARY (CONTINUED)
Analysis of net inflow of cash and cash equivalents in respect of the disposal:
2011
US$’000
Consideration received 26,720
Expenses incurred in respect of the disposal (519)
Net inflow of cash and cash equivalents in respect of disposal of properties/property holding subsidiary 26,201
Analysis of gain on disposal of properties/property holding subsidiary:
2011
US$’000
Consideration net of expenses incurred 26,201
Less: Net assets disposed (12,535)
Gain on disposal of properties/property holding subsidiary (Note 4) 13,666
31 BUSINESS COMBINATIONSDuring the year, the Group completed a series of acquisitions to expand the Group’s existing scale of operation and enlarge the Group’s
market presence. The Group was not required to made an announcement in accordance with Chapter 14 of the Listing Rules for any
individual acquisition completed during the year since none of the acquisitions, on a standalone basis, would be of sufficient material to
be recognized as notifiable transaction, and, for reasons of materiality and commercial sensitivity, no disclosure is provided of the details
and impact of any individual acquisition. However, on a collective basis, the estimated aggregate undiscounted total consideration
amounted to approximately US$1,849 million, among which aggregate initial considerations paid was approximately US$707 million and
the aggregate potential undiscounted performance-based contingent consideration payable could range from nil to US$1,189 million.
The fair value of the aggregate contingent consideration payable of approximately US$1,103 million was determined based on applying
agreed multiples to the estimated post-acquisition performance of the acquired businesses/subsidiaries and time value of money.
The acquisitions completed by the Group in current year involved no non-controlling interest. The acquisition of businesses/subsidiaries
contributed revenue of approximately US$1,219 million, core operating profit of approximately US$136 million and profit after tax
of approximately US$85 million to the Group for the period from their respective dates of acquisition to 31 December 2011. If these
acquisitions had occurred on 1 January 2011, Group revenue would have been approximately US$20,777 million; core operating profit
would have been approximately US$957 million, profit after tax would have been approximately US$723 million. These amounts have
been calculated using the Group’s accounting policies, and adjusting the results of the relevant subsidiaries to reflect the additional
amortization that would have been charged assuming the fair value adjustments to intangible assets had applied from 1 January 2011,
together with the consequential tax effect.

139LI & FUNG LIMITED | ANNUAL REPORT 2011
NOTES TO THE ACCOUNTS (CONTINUED)
31 BUSINESS COMBINATIONS (CONTINUED)Details of net assets acquired, goodwill and acquisition-related costs are as follows:
US$’000
Purchase consideration to be settled by cash 1,809,916
Less: Fair value of net assets acquired * (449,067)
Goodwill (Note 12) 1,360,849
Acquisition-related costs (included in other non-core operating expenses in the consolidated
profit and loss account for the year ended 31 December 2011). 14,901
* As at 31 December 2011, verification of individual assets/liabilities of the acquired businesses is in progress and the Group has not finalized the fair
value assessments. The relevant fair value of individual assets/liabilities stated above are provisional.
The goodwill is attributable to the acquired workforces, the profitability and the synergies expected to arise from the acquired
businesses. Goodwill recognized of US$472,474,000 is expected to be deductible for income tax purposes.
The initial carrying amounts of the assets and liabilities, other than intangible assets arising from business combinations, of the acquired
businesses approximate their fair values at respective acquisition dates and are as follows:
US$’000
Net assets acquired:
Intangible assets (Note 12)i
– Customer relationships 213,168
– Licensor relationships 45,079
– Trademarks 60,601
– Brand licenses 34,801
– Computer software and system development costs 4
– Others 300
Property, plant and equipment (Note 13) 5,885
Inventories 164,420
Trade and bills receivable ii 166,052
Other receivables, prepayments and deposits 43,209
Cash and bank balances 7,144
Tax recoverable 153
Trade and bills payables (62,349)
Accrued charges and sundry payables (227,043)
Bank overdrafts (1,111)
Bank loans (748)
Bank advance for discounted bills (536)
Deferred tax assets (Note 29) 38
Fair value of net assets acquired 449,067
140 LI & FUNG LIMITED | ANNUAL REPORT 2011
NOTES TO THE ACCOUNTS (CONTINUED)
31 BUSINESS COMBINATIONS (CONTINUED)i Intangible assets arising from business combinations represent customer relationships, trademarks, licensor relationships, brand licenses and various
other smaller intangible assets. The Group has engaged external valuers to perform fair value assessments on these intangible assets in accordance
with HKAS 38 “Intangible Assets” and HKFRS 3 “Business Combination”. As at the date of the accounts, the valuation assessments have not yet been
completed and the Group has not finalized the fair value assessments for all of the intangible assets. The relevant fair values of intangible assets stated
above provisional.
ii The fair value of trade and bills receivables with a fair value of US$166,052,000 which are expected to be collectible in full.
Details of these acquisitions are as follows:
In January 2011, the Group completed the acquisition of substantially all of the assets that constitutes a business of Oxford Apparel,
which was one of the operating groups of Oxford Industries, Inc..
Also, in January 2011, the Group acquired Beyond Productions, LLC and Modium. Beyond Productions, LLC was a leading designer
and licensor of women’s fashion apparel and accessories. Modium was a virtual manufacturer of ladies’ and men’s woven apparel
based in Istanbul, Turkey.
In March 2011, the Group acquired: (i) Celissa, a trading company based in Istanbul, Turkey, supplying wovens and knits to customers
in Europe; (ii) Techno Source USA, Inc., one of the fastest-growing toy companies and a toy innovator with a track record of successfully
introducing electronic and non-electronic games; and (iii) Stone Sapphire/Gemstone Printing, a company specializing in the supply of
printed paper products and technical packaging.
In May 2011, the Group acquired: (i) Loyaltex Apparel Ltd., a sourcing and development company specialized in knits, woven/denim and
sweater; (ii) TVMania, the leading Pan-European supplier of character licensed and branded merchandize with the most comprehensive
set of licenses across Europe; (iii) Hampshire Designers, Inc.. It was the women’s division of Hampshire Group Limited in the US; and
(iv) Collection 2000, which specialized in fashion color cosmetics products for the beauty industry in the UK, with a range of products
available in the majority of the country’s leading mass color cosmetics retailers.
In June 2011, the Group acquired Exim Designs Co., Ltd., a Thai-based furniture trading company that specialized in ready-to-
assemble, flat-pack furniture.
In July 2011, the Group acquired the business of Union Rich USA, LLC. and Lloyd Textile Fashion Company Limited. Union Rich USA,
LLC. was a leading product development company specializing in storage and organization products for home and business and travel.
Lloyd Textile Fashion Company Limited is a design Company with well-established relationships with customers and expert knowledge
of men’s product categories and markets.
In August 2011, the Group acquired the businesses of (i) Fishman and Tobin, Inc., which was a children’s apparel company and a key
supplier to the boy’s dresswear market, specialized in boy’s dresswear, boys and girls school uniforms, boys sportswear and men’s
dresswear; and (ii) Crimzon Rose International, one of the leading companies that designs, sources, markets and distributes costume
jewelry and accessories under its own brands or licenses.
In September 2011, the Group acquired (i) Midway Enterprises (Guangzhou) Ltd, Wonderful World (HK) Ltd and Wonderful Overseas
Limited from the Roly Group. They operate children apparel and toys businesses in Greater China; and (ii) True Innovations, LLC, one of
the leading office and entertainment furniture trading companies servicing mass retailers.
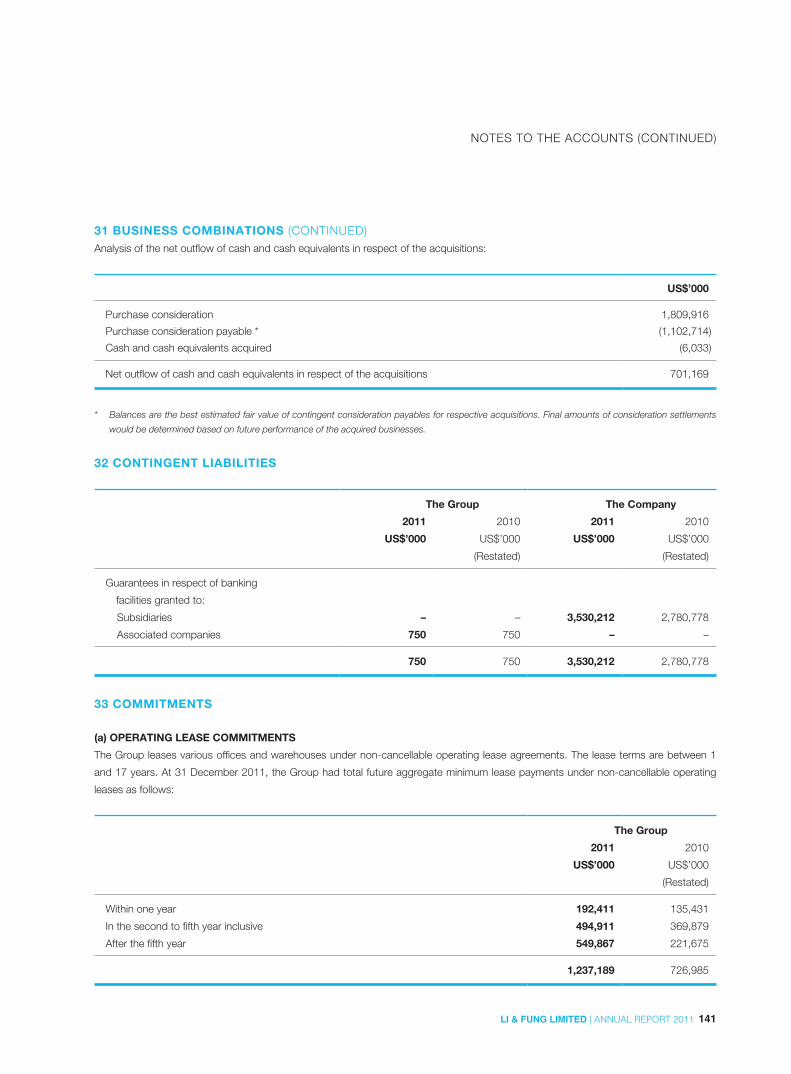
141LI & FUNG LIMITED | ANNUAL REPORT 2011
NOTES TO THE ACCOUNTS (CONTINUED)
31 BUSINESS COMBINATIONS (CONTINUED)Analysis of the net outflow of cash and cash equivalents in respect of the acquisitions:
US$’000
Purchase consideration 1,809,916
Purchase consideration payable * (1,102,714)
Cash and cash equivalents acquired (6,033)
Net outflow of cash and cash equivalents in respect of the acquisitions 701,169
* Balances are the best estimated fair value of contingent consideration payables for respective acquisitions. Final amounts of consideration settlements
would be determined based on future performance of the acquired businesses.
32 CONTINGENT LIABILITIES
The Group The Company
2011 2010 2011 2010
US$’000 US$’000 US$’000 US$’000
(Restated) (Restated)
Guarantees in respect of banking
facilities granted to:
Subsidiaries – – 3,530,212 2,780,778
Associated companies 750 750 – –
750 750 3,530,212 2,780,778
33 COMMITMENTS
(a) OPERATING LEASE COMMITMENTS
The Group leases various offices and warehouses under non-cancellable operating lease agreements. The lease terms are between 1
and 17 years. At 31 December 2011, the Group had total future aggregate minimum lease payments under non-cancellable operating
leases as follows:
The Group
2011 2010
US$’000 US$’000
(Restated)
Within one year 192,411 135,431
In the second to fifth year inclusive 494,911 369,879
After the fifth year 549,867 221,675
1,237,189 726,985
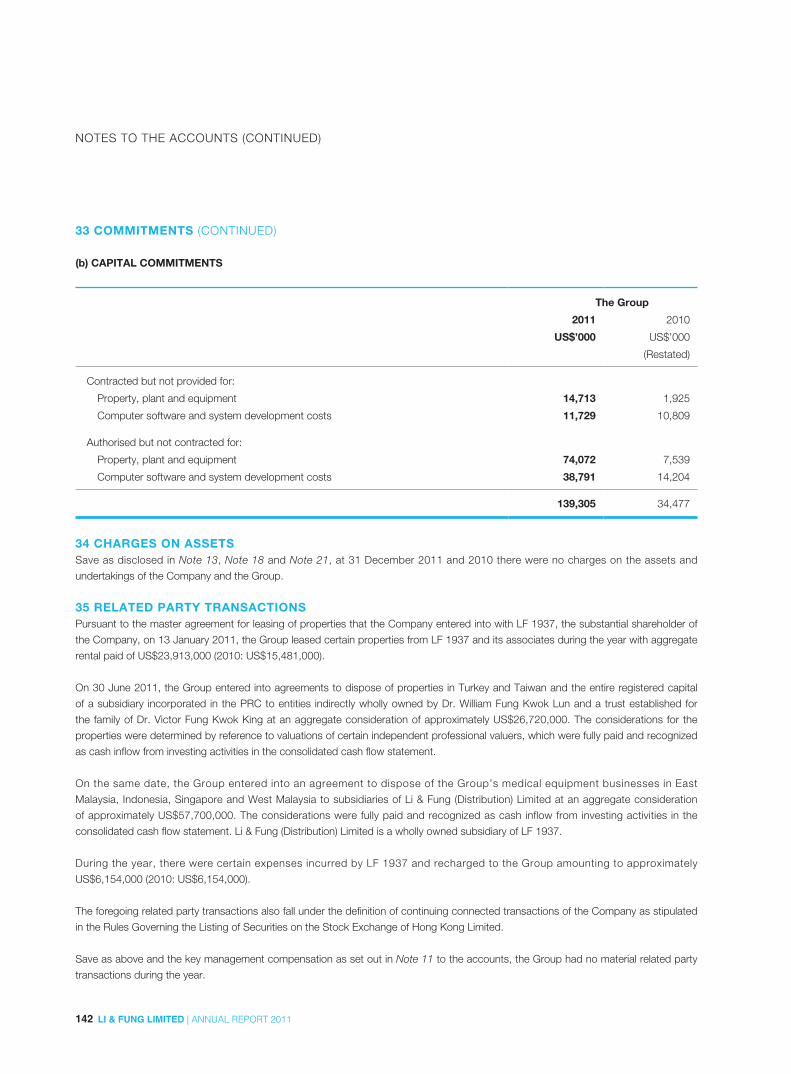
142 LI & FUNG LIMITED | ANNUAL REPORT 2011
NOTES TO THE ACCOUNTS (CONTINUED)
33 COMMITMENTS (CONTINUED)
(b) CAPITAL COMMITMENTS
The Group
2011 2010
US$’000 US$’000
(Restated)
Contracted but not provided for:
Property, plant and equipment 14,713 1,925
Computer software and system development costs 11,729 10,809
Authorised but not contracted for:
Property, plant and equipment 74,072 7,539
Computer software and system development costs 38,791 14,204
139,305 34,477
34 CHARGES ON ASSETSSave as disclosed in Note 13, Note 18 and Note 21, at 31 December 2011 and 2010 there were no charges on the assets and
undertakings of the Company and the Group.
35 RELATED PARTY TRANSACTIONSPursuant to the master agreement for leasing of properties that the Company entered into with LF 1937, the substantial shareholder of
the Company, on 13 January 2011, the Group leased certain properties from LF 1937 and its associates during the year with aggregate
rental paid of US$23,913,000 (2010: US$15,481,000).
On 30 June 2011, the Group entered into agreements to dispose of properties in Turkey and Taiwan and the entire registered capital
of a subsidiary incorporated in the PRC to entities indirectly wholly owned by Dr. William Fung Kwok Lun and a trust established for
the family of Dr. Victor Fung Kwok King at an aggregate consideration of approximately US$26,720,000. The considerations for the
properties were determined by reference to valuations of certain independent professional valuers, which were fully paid and recognized
as cash inflow from investing activities in the consolidated cash flow statement.
On the same date, the Group entered into an agreement to dispose of the Group’s medical equipment businesses in East
Malaysia, Indonesia, Singapore and West Malaysia to subsidiaries of Li & Fung (Distribution) Limited at an aggregate consideration
of approximately US$57,700,000. The considerations were fully paid and recognized as cash inflow from investing activities in the
consolidated cash flow statement. Li & Fung (Distribution) Limited is a wholly owned subsidiary of LF 1937.
During the year, there were certain expenses incurred by LF 1937 and recharged to the Group amounting to approximately
US$6,154,000 (2010: US$6,154,000).
The foregoing related party transactions also fall under the definition of continuing connected transactions of the Company as stipulated
in the Rules Governing the Listing of Securities on the Stock Exchange of Hong Kong Limited.
Save as above and the key management compensation as set out in Note 11 to the accounts, the Group had no material related party
transactions during the year.
143LI & FUNG LIMITED | ANNUAL REPORT 2011
NOTES TO THE ACCOUNTS (CONTINUED)
36 FINANCIAL RISK MANAGEMENTThe Group’s activities expose it to a variety of financial risks: market risk (including foreign exchange risk, fair value interest rate risk,
cash flow interest rate risk and price risk), credit risk, and liquidity risk. The Group’s overall risk management program focuses on the
unpredictability of financial markets and seeks to minimize potential adverse effects on the Group’s financial performance. The Group uses
derivative financial instruments to hedge certain risk exposures.
(a) MARKET RISK
(i) Foreign exchange risk
The Group operates globally with almost all of its sales and purchases traded in foreign currencies, mostly in US dollar. HK dollar is
pegged to US dollar at a range between 7.75 to 7.85 and the foreign exchange exposure between US dollar and HK dollar is therefore
limited.
The Group is exposed to foreign exchange risk arising from various currency exposures mainly to the extent of its receivables and
payables in currencies other than US dollar, such as Euro dollar and Sterling Pound. To minimize such risks, sales and purchases are
generally transacted in the same currency.
Foreign exchange risk arising from sales and purchases transacted in different currencies are managed by the Group treasury through
the use of foreign exchange forward contracts. Pursuant to the Group policy in place, foreign exchange forward contracts, or any other
financial derivatives, are entered into by the Group for hedging purposes. The Group has not entered into any financial derivatives for
speculation.
The Group’s cash is mainly kept in either HK dollar or US dollar to minimize the foreign exchange risk.
At 31 December 2011, if the major foreign currencies, such as Euro dollar and Sterling Pound, to which the Group had exposure to had
strengthened/weakened by 10% (2010: 10%) against US and HK dollar with all other variables held constant, profit for the year and
equity would have been approximately 2.0% (2010: 2.0%) and 2.0% (2010: 2.0%) higher/lower, mainly as a result of foreign exchange
gains/losses on translation of foreign currencies denominated trade receivables, available-for-sale financial assets, borrowings and
intangible assets.
(ii) Price risk
The Group is exposed to equity securities price risk because of investments held by the Group and classified on the consolidated
balance sheet as available-for-sale financial assets. The Group maintains these equity securities investments for long-term strategic
purposes and the Group’s overall exposure to price risk is not significant.
At 31 December 2011 and up to the report date of the accounts, the Group held no material financial derivative instruments except
for certain foreign exchange forward contracts entered into for hedging of foreign exchange risk exposure on sales and purchases
transacted in different currencies. At 31 December 2011, the fair value of foreign exchange forward contracts entered into by the Group
amounted to US$13,743,000 (2010: liabilities of US$1,892,000), which has been reflected in full in the Group’s consolidated balance
sheet as derivative financial instruments assets.

144 LI & FUNG LIMITED | ANNUAL REPORT 2011
NOTES TO THE ACCOUNTS (CONTINUED)
36 FINANCIAL RISK MANAGEMENT (CONTINUED)
(a) MARKET RISK (CONTINUED)
(iii) Cash flow and fair value interest rate risk
As the Group has no significant interest-bearing assets except for available-for-sale debt security, the Group’s income and operating
cash flows are substantially independent of changes in market interest rates.
The Group’s interest rate risk arises mainly from US dollar denominated bank borrowings and the US dollar denominated long-term
notes issued. Bank borrowings at variable rates expose the group to cash flow interest rate risk. The available-for-sale debt security issued
at a fixed interest rate exposes the Group to fair value interest rate risk. The Group’s policy is to maintain a diversified mix of variable and
fixed rate borrowings based on prevailing market conditions.
At 31 December 2011, if the variable interest rates on the bank borrowings had been 0.1% higher/lower with all other variables held
constant, profit for the year and equity would have been approximately US$2,368,000 (2010: US$1,233,000) lower/higher, mainly as a
result of higher/lower interest expenses on floating rate borrowings. If the prevailing market interest rate on the available-for-sale debt
security had been 0.1% higher/lower with all other variables held constant, the Group’s profit would have been increased or decreased
by approximately US$213,000 (2010: US$244,000).
(b) CREDIT RISK
Credit risk mainly arises from trade and other receivables as well as cash and bank balances of the Group.
Most of the Group’s cash and bank balances are held in major global financial institutions.
The Group has stringent policies in place to manage its credit risk with trade and other receivables, which include but are not limited to
the measures set out below:
(i) A significant portion of business is secured by back-to-back payment arrangements or covered by letters of credit, customers’
standby letters of credit, bank guarantees or credit insurance;
(ii) Certain trade receivable balances on open account term are factored to external financial institutions without recourse;
(iii) The Group’s credit control team makes an assessment of each individual customer and vendor and determines the credit limits
based on, among other factors, their trading and settlement history as well as their respective financial background.
The Group’s five largest customers, in aggregate, account for less than 30% of the Group’s business. Transactions with these
customers are entered into within the credit limits designated by the Group.
Except for trade receivables of US$26,827,000 (2010: US$19,488,000) and other receivables of US$27,087,000 (2010: US$25,756,000)
were impaired and fully provided, none of the other financial assets including available-for-sale debt security (Note 17), due from related
companies (Note 19) and other receivables and deposits (Note 21) impaired as there is no recent history of default of the counterparties.
The maximum exposure of these other financial assets to credit risk at the reporting date is their carrying amounts.
(c) LIQUIDITY RISK
Prudent liquidity risk management implies maintaining sufficient cash on hand and the availability of funding through an adequate
amount of committed credit facilities from the Group’s bankers.
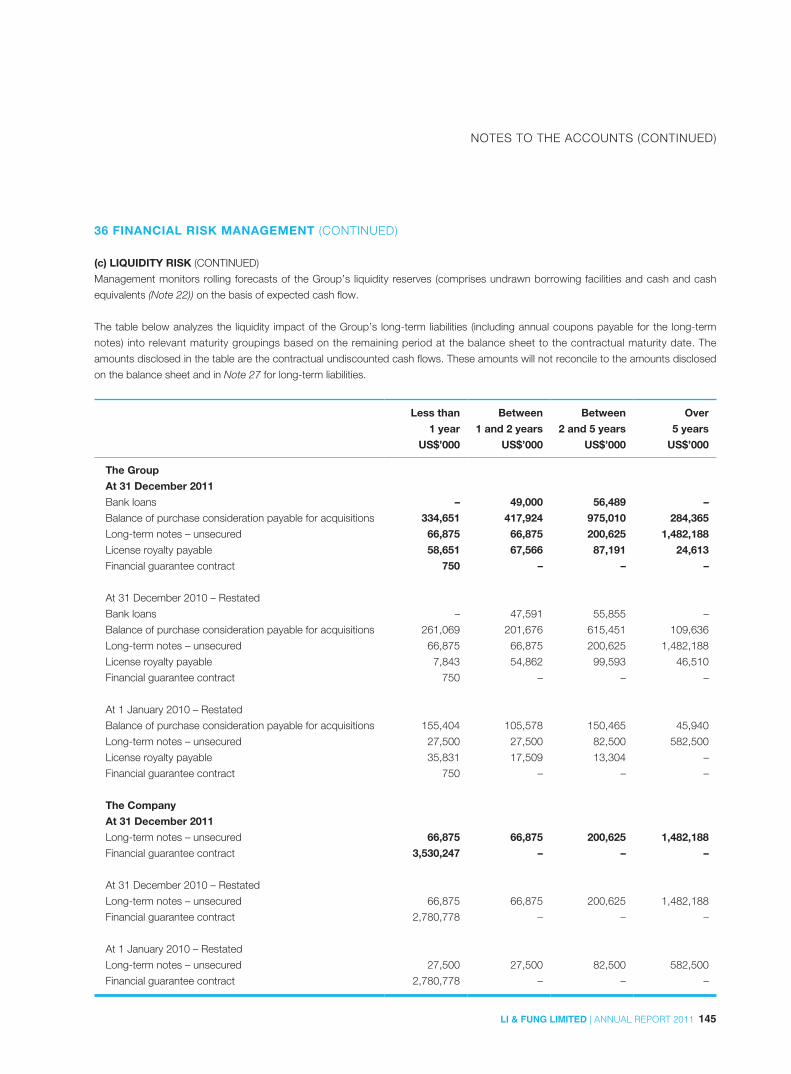
145LI & FUNG LIMITED | ANNUAL REPORT 2011
NOTES TO THE ACCOUNTS (CONTINUED)
36 FINANCIAL RISK MANAGEMENT (CONTINUED)
(c) LIQUIDITY RISK (CONTINUED)
Management monitors rolling forecasts of the Group’s liquidity reserves (comprises undrawn borrowing facilities and cash and cash
equivalents (Note 22)) on the basis of expected cash flow.
The table below analyzes the liquidity impact of the Group’s long-term liabilities (including annual coupons payable for the long-term
notes) into relevant maturity groupings based on the remaining period at the balance sheet to the contractual maturity date. The
amounts disclosed in the table are the contractual undiscounted cash flows. These amounts will not reconcile to the amounts disclosed
on the balance sheet and in Note 27 for long-term liabilities.
Less than
1 year
Between
1 and 2 years
Between
2 and 5 years
Over
5 years
US$’000 US$’000 US$’000 US$’000
The Group
At 31 December 2011
Bank loans – 49,000 56,489 –
Balance of purchase consideration payable for acquisitions 334,651 417,924 975,010 284,365
Long-term notes – unsecured 66,875 66,875 200,625 1,482,188
License royalty payable 58,651 67,566 87,191 24,613
Financial guarantee contract 750 – – –
At 31 December 2010 – Restated
Bank loans – 47,591 55,855 –
Balance of purchase consideration payable for acquisitions 261,069 201,676 615,451 109,636
Long-term notes – unsecured 66,875 66,875 200,625 1,482,188
License royalty payable 7,843 54,862 99,593 46,510
Financial guarantee contract 750 – – –
At 1 January 2010 – Restated
Balance of purchase consideration payable for acquisitions 155,404 105,578 150,465 45,940
Long-term notes – unsecured 27,500 27,500 82,500 582,500
License royalty payable 35,831 17,509 13,304 –
Financial guarantee contract 750 – – –
The Company
At 31 December 2011
Long-term notes – unsecured 66,875 66,875 200,625 1,482,188
Financial guarantee contract 3,530,247 – – –
At 31 December 2010 – Restated
Long-term notes – unsecured 66,875 66,875 200,625 1,482,188
Financial guarantee contract 2,780,778 – – –
At 1 January 2010 – Restated
Long-term notes – unsecured 27,500 27,500 82,500 582,500
Financial guarantee contract 2,780,778 – – –
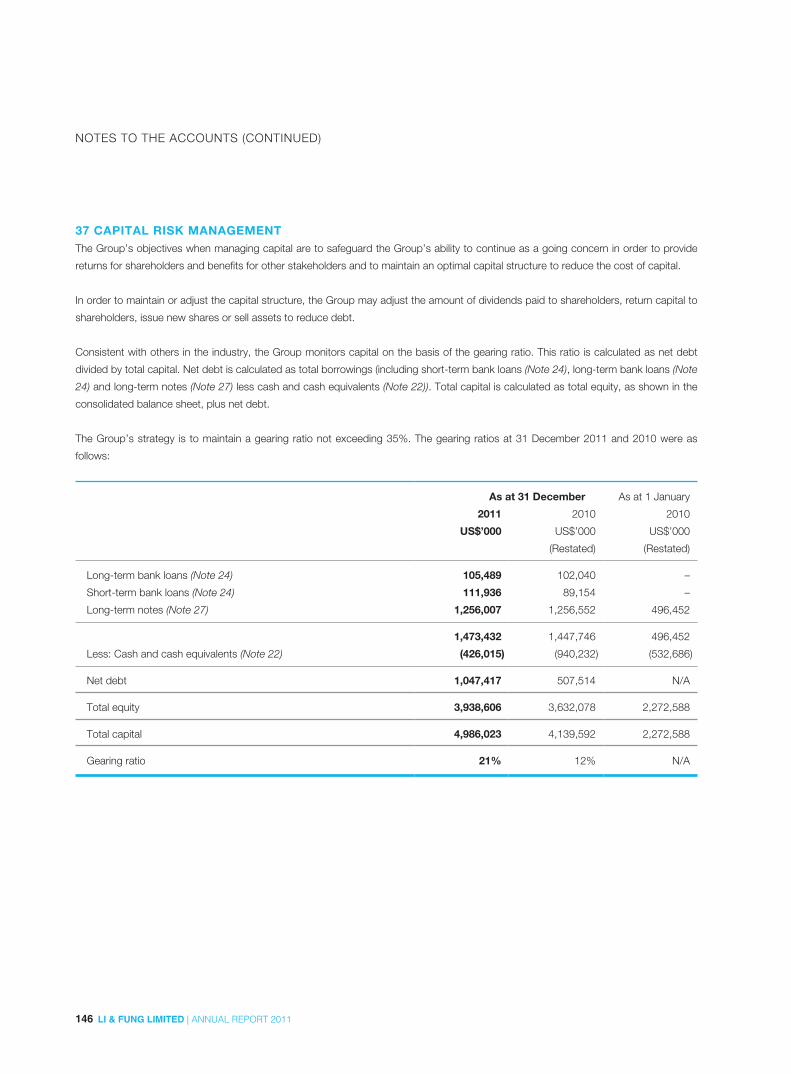
146 LI & FUNG LIMITED | ANNUAL REPORT 2011
NOTES TO THE ACCOUNTS (CONTINUED)
37 CAPITAL RISK MANAGEMENTThe Group’s objectives when managing capital are to safeguard the Group’s ability to continue as a going concern in order to provide
returns for shareholders and benefits for other stakeholders and to maintain an optimal capital structure to reduce the cost of capital.
In order to maintain or adjust the capital structure, the Group may adjust the amount of dividends paid to shareholders, return capital to
shareholders, issue new shares or sell assets to reduce debt.
Consistent with others in the industry, the Group monitors capital on the basis of the gearing ratio. This ratio is calculated as net debt
divided by total capital. Net debt is calculated as total borrowings (including short-term bank loans (Note 24), long-term bank loans (Note
24) and long-term notes (Note 27) less cash and cash equivalents (Note 22)). Total capital is calculated as total equity, as shown in the
consolidated balance sheet, plus net debt.
The Group’s strategy is to maintain a gearing ratio not exceeding 35%. The gearing ratios at 31 December 2011 and 2010 were as
follows:
As at 31 December As at 1 January
2011 2010 2010
US$’000 US$’000 US$’000
(Restated) (Restated)
Long-term bank loans (Note 24) 105,489 102,040 –
Short-term bank loans (Note 24) 111,936 89,154 –
Long-term notes (Note 27) 1,256,007 1,256,552 496,452
1,473,432 1,447,746 496,452
Less: Cash and cash equivalents (Note 22) (426,015) (940,232) (532,686)
Net debt 1,047,417 507,514 N/A
Total equity 3,938,606 3,632,078 2,272,588
Total capital 4,986,023 4,139,592 2,272,588
Gearing ratio 21% 12% N/A
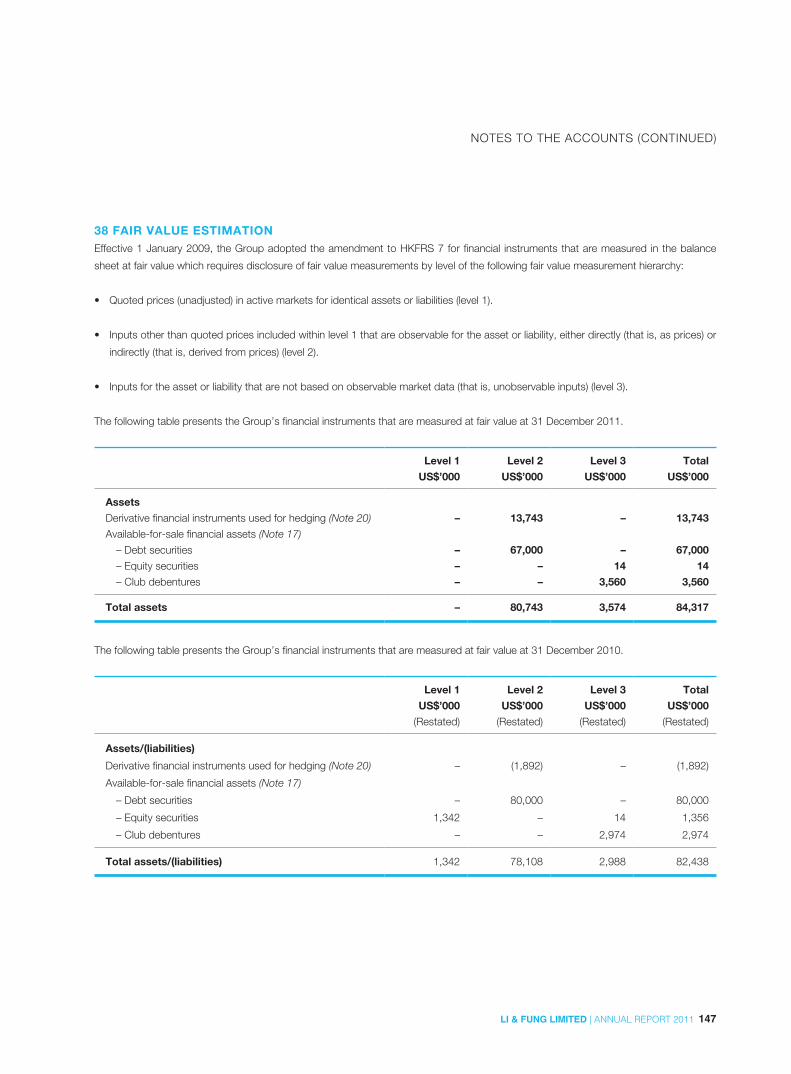
147LI & FUNG LIMITED | ANNUAL REPORT 2011
NOTES TO THE ACCOUNTS (CONTINUED)
38 FAIR VALUE ESTIMATIONEffective 1 January 2009, the Group adopted the amendment to HKFRS 7 for financial instruments that are measured in the balance
sheet at fair value which requires disclosure of fair value measurements by level of the following fair value measurement hierarchy:
• Quoted prices (unadjusted) in active markets for identical assets or liabilities (level 1).
• Inputs other than quoted prices included within level 1 that are observable for the asset or liability, either directly (that is, as prices) or
indirectly (that is, derived from prices) (level 2).
• Inputs for the asset or liability that are not based on observable market data (that is, unobservable inputs) (level 3).
The following table presents the Group’s financial instruments that are measured at fair value at 31 December 2011.
Level 1 Level 2 Level 3 Total
US$’000 US$’000 US$’000 US$’000
Assets
Derivative financial instruments used for hedging (Note 20) – 13,743 – 13,743
Available-for-sale financial assets (Note 17)
– Debt securities – 67,000 – 67,000
– Equity securities – – 14 14
– Club debentures – – 3,560 3,560
Total assets – 80,743 3,574 84,317
The following table presents the Group’s financial instruments that are measured at fair value at 31 December 2010.
Level 1 Level 2 Level 3 Total
US$’000 US$’000 US$’000 US$’000
(Restated) (Restated) (Restated) (Restated)
Assets/(liabilities)
Derivative financial instruments used for hedging (Note 20) – (1,892) – (1,892)
Available-for-sale financial assets (Note 17)
– Debt securities – 80,000 – 80,000
– Equity securities 1,342 – 14 1,356
– Club debentures – – 2,974 2,974
Total assets/(liabilities) 1,342 78,108 2,988 82,438
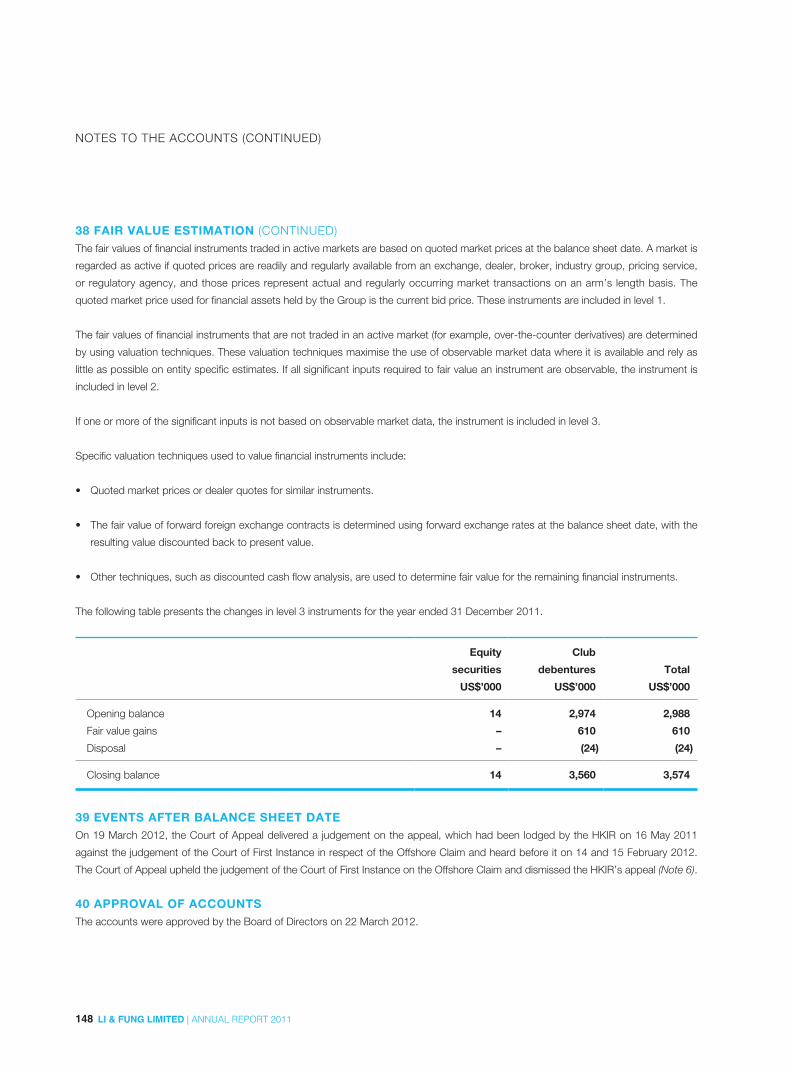
148 LI & FUNG LIMITED | ANNUAL REPORT 2011
NOTES TO THE ACCOUNTS (CONTINUED)
38 FAIR VALUE ESTIMATION (CONTINUED)The fair values of financial instruments traded in active markets are based on quoted market prices at the balance sheet date. A market is
regarded as active if quoted prices are readily and regularly available from an exchange, dealer, broker, industry group, pricing service,
or regulatory agency, and those prices represent actual and regularly occurring market transactions on an arm’s length basis. The
quoted market price used for financial assets held by the Group is the current bid price. These instruments are included in level 1.
The fair values of financial instruments that are not traded in an active market (for example, over-the-counter derivatives) are determined
by using valuation techniques. These valuation techniques maximise the use of observable market data where it is available and rely as
little as possible on entity specific estimates. If all significant inputs required to fair value an instrument are observable, the instrument is
included in level 2.
If one or more of the significant inputs is not based on observable market data, the instrument is included in level 3.
Specific valuation techniques used to value financial instruments include:
• Quoted market prices or dealer quotes for similar instruments.
• The fair value of forward foreign exchange contracts is determined using forward exchange rates at the balance sheet date, with the
resulting value discounted back to present value.
• Other techniques, such as discounted cash flow analysis, are used to determine fair value for the remaining financial instruments.
The following table presents the changes in level 3 instruments for the year ended 31 December 2011.
Equity
securities
Club
debentures Total
US$’000 US$’000 US$’000
Opening balance 14 2,974 2,988
Fair value gains – 610 610
Disposal – (24) (24)
Closing balance 14 3,560 3,574
39 EVENTS AFTER BALANCE SHEET DATEOn 19 March 2012, the Court of Appeal delivered a judgement on the appeal, which had been lodged by the HKIR on 16 May 2011
against the judgement of the Court of First Instance in respect of the Offshore Claim and heard before it on 14 and 15 February 2012.
The Court of Appeal upheld the judgement of the Court of First Instance on the Offshore Claim and dismissed the HKIR’s appeal (Note 6).
40 APPROVAL OF ACCOUNTSThe accounts were approved by the Board of Directors on 22 March 2012.
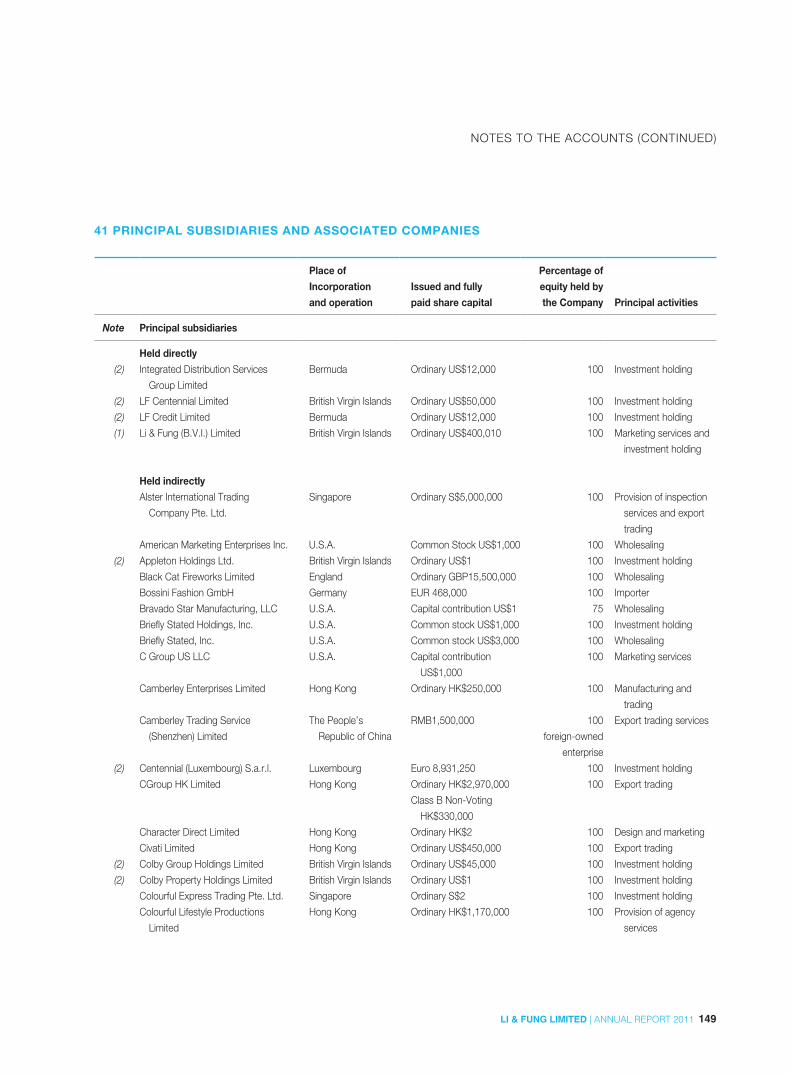
149LI & FUNG LIMITED | ANNUAL REPORT 2011
NOTES TO THE ACCOUNTS (CONTINUED)
41 PRINCIPAL SUBSIDIARIES AND ASSOCIATED COMPANIES
Place of
Incorporation
and operation
Issued and fully
paid share capital
Percentage of
equity held by
the Company Principal activities
Note Principal subsidiaries
Held directly
(2) Integrated Distribution Services
Group Limited
Bermuda Ordinary US$12,000 100 Investment holding
(2) LF Centennial Limited British Virgin Islands Ordinary US$50,000 100 Investment holding
(2) LF Credit Limited Bermuda Ordinary US$12,000 100 Investment holding
(1) Li & Fung (B.V.I.) Limited British Virgin Islands Ordinary US$400,010 100 Marketing services and
investment holding
Held indirectly
Alster International Trading
Company Pte. Ltd.
Singapore Ordinary S$5,000,000 100 Provision of inspection
services and export
trading
American Marketing Enterprises Inc. U.S.A. Common Stock US$1,000 100 Wholesaling
(2) Appleton Holdings Ltd. British Virgin Islands Ordinary US$1 100 Investment holding
Black Cat Fireworks Limited England Ordinary GBP15,500,000 100 Wholesaling
Bossini Fashion GmbH Germany EUR 468,000 100 Importer
Bravado Star Manufacturing, LLC U.S.A. Capital contribution US$1 75 Wholesaling
Briefly Stated Holdings, Inc. U.S.A. Common stock US$1,000 100 Investment holding
Briefly Stated, Inc. U.S.A. Common stock US$3,000 100 Wholesaling
C Group US LLC U.S.A. Capital contribution
US$1,000
100 Marketing services
Camberley Enterprises Limited Hong Kong Ordinary HK$250,000 100 Manufacturing and
trading
Camberley Trading Service
(Shenzhen) Limited
The People’s
Republic of China
RMB1,500,000 100
foreign-owned
enterprise
Export trading services
(2) Centennial (Luxembourg) S.a.r.l. Luxembourg Euro 8,931,250 100 Investment holding
CGroup HK Limited Hong Kong Ordinary HK$2,970,000
Class B Non-Voting
HK$330,000
100 Export trading
Character Direct Limited Hong Kong Ordinary HK$2 100 Design and marketing
Civati Limited Hong Kong Ordinary US$450,000 100 Export trading
(2) Colby Group Holdings Limited British Virgin Islands Ordinary US$45,000 100 Investment holding
(2) Colby Property Holdings Limited British Virgin Islands Ordinary US$1 100 Investment holding
Colourful Express Trading Pte. Ltd. Singapore Ordinary S$2 100 Investment holding
Colourful Lifestyle Productions
Limited
Hong Kong Ordinary HK$1,170,000 100 Provision of agency
services
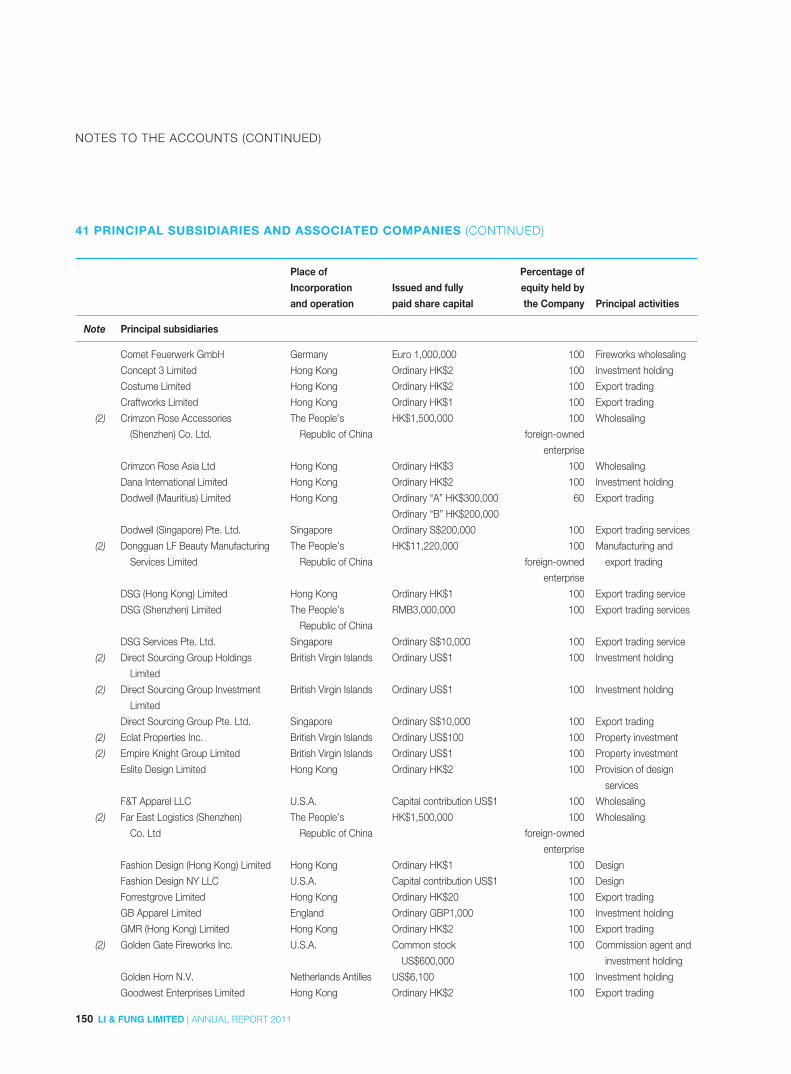
150 LI & FUNG LIMITED | ANNUAL REPORT 2011
NOTES TO THE ACCOUNTS (CONTINUED)
Place of
Incorporation
and operation
Issued and fully
paid share capital
Percentage of
equity held by
the Company Principal activities
Note Principal subsidiaries
Comet Feuerwerk GmbH Germany Euro 1,000,000 100 Fireworks wholesaling
Concept 3 Limited Hong Kong Ordinary HK$2 100 Investment holding
Costume Limited Hong Kong Ordinary HK$2 100 Export trading
Craftworks Limited Hong Kong Ordinary HK$1 100 Export trading
(2) Crimzon Rose Accessories
(Shenzhen) Co. Ltd.
The People’s
Republic of China
HK$1,500,000 100
foreign-owned
enterprise
Wholesaling
Crimzon Rose Asia Ltd Hong Kong Ordinary HK$3 100 Wholesaling
Dana International Limited Hong Kong Ordinary HK$2 100 Investment holding
Dodwell (Mauritius) Limited Hong Kong Ordinary “A” HK$300,000
Ordinary “B” HK$200,000
60 Export trading
Dodwell (Singapore) Pte. Ltd. Singapore Ordinary S$200,000 100 Export trading services
(2) Dongguan LF Beauty Manufacturing
Services Limited
The People’s
Republic of China
HK$11,220,000 100
foreign-owned
enterprise
Manufacturing and
export trading
DSG (Hong Kong) Limited Hong Kong Ordinary HK$1 100 Export trading service
DSG (Shenzhen) Limited The People’s
Republic of China
RMB3,000,000 100 Export trading services
DSG Services Pte. Ltd. Singapore Ordinary S$10,000 100 Export trading service
(2) Direct Sourcing Group Holdings
Limited
British Virgin Islands Ordinary US$1 100 Investment holding
(2) Direct Sourcing Group Investment
Limited
British Virgin Islands Ordinary US$1 100 Investment holding
Direct Sourcing Group Pte. Ltd. Singapore Ordinary S$10,000 100 Export trading
(2) Eclat Properties Inc. British Virgin Islands Ordinary US$100 100 Property investment
(2) Empire Knight Group Limited British Virgin Islands Ordinary US$1 100 Property investment
Eslite Design Limited Hong Kong Ordinary HK$2 100 Provision of design
services
F&T Apparel LLC U.S.A. Capital contribution US$1 100 Wholesaling
(2) Far East Logistics (Shenzhen)
Co. Ltd
The People’s
Republic of China
HK$1,500,000 100
foreign-owned
enterprise
Wholesaling
Fashion Design (Hong Kong) Limited Hong Kong Ordinary HK$1 100 Design
Fashion Design NY LLC U.S.A. Capital contribution US$1 100 Design
Forrestgrove Limited Hong Kong Ordinary HK$20 100 Export trading
GB Apparel Limited England Ordinary GBP1,000 100 Investment holding
GMR (Hong Kong) Limited Hong Kong Ordinary HK$2 100 Export trading
(2) Golden Gate Fireworks Inc. U.S.A. Common stock
US$600,000
100 Commission agent and
investment holding
Golden Horn N.V. Netherlands Antilles US$6,100 100 Investment holding
Goodwest Enterprises Limited Hong Kong Ordinary HK$2 100 Export trading
41 PRINCIPAL SUBSIDIARIES AND ASSOCIATED COMPANIES (CONTINUED)
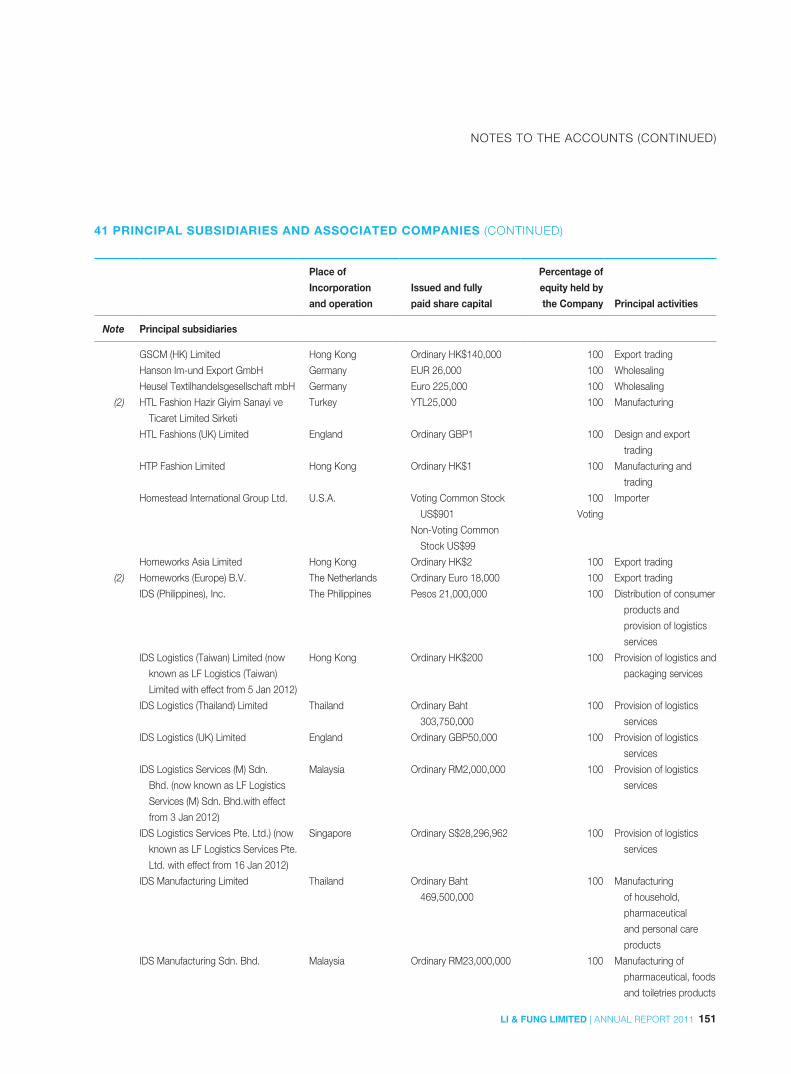
151LI & FUNG LIMITED | ANNUAL REPORT 2011
NOTES TO THE ACCOUNTS (CONTINUED)
Place of
Incorporation
and operation
Issued and fully
paid share capital
Percentage of
equity held by
the Company Principal activities
Note Principal subsidiaries
GSCM (HK) Limited Hong Kong Ordinary HK$140,000 100 Export trading
Hanson Im-und Export GmbH Germany EUR 26,000 100 Wholesaling
Heusel Textilhandelsgesellschaft mbH Germany Euro 225,000 100 Wholesaling
(2) HTL Fashion Hazir Giyim Sanayi ve
Ticaret Limited Sirketi
Turkey YTL25,000 100 Manufacturing
HTL Fashions (UK) Limited England Ordinary GBP1 100 Design and export
trading
HTP Fashion Limited Hong Kong Ordinary HK$1 100 Manufacturing and
trading
Homestead International Group Ltd. U.S.A. Voting Common Stock
US$901
Non-Voting Common
Stock US$99
100
Voting
Importer
Homeworks Asia Limited Hong Kong Ordinary HK$2 100 Export trading
(2) Homeworks (Europe) B.V. The Netherlands Ordinary Euro 18,000 100 Export trading
IDS (Philippines), Inc. The Philippines Pesos 21,000,000 100 Distribution of consumer
products and
provision of logistics
services
IDS Logistics (Taiwan) Limited (now
known as LF Logistics (Taiwan)
Limited with effect from 5 Jan 2012)
Hong Kong Ordinary HK$200 100 Provision of logistics and
packaging services
IDS Logistics (Thailand) Limited Thailand Ordinary Baht
303,750,000
100 Provision of logistics
services
IDS Logistics (UK) Limited England Ordinary GBP50,000 100 Provision of logistics
services
IDS Logistics Services (M) Sdn.
Bhd. (now known as LF Logistics
Services (M) Sdn. Bhd.with effect
from 3 Jan 2012)
Malaysia Ordinary RM2,000,000 100 Provision of logistics
services
IDS Logistics Services Pte. Ltd.) (now
known as LF Logistics Services Pte.
Ltd. with effect from 16 Jan 2012)
Singapore Ordinary S$28,296,962 100 Provision of logistics
services
IDS Manufacturing Limited Thailand Ordinary Baht
469,500,000
100 Manufacturing
of household,
pharmaceutical
and personal care
products
IDS Manufacturing Sdn. Bhd. Malaysia Ordinary RM23,000,000 100 Manufacturing of
pharmaceutical, foods
and toiletries products
41 PRINCIPAL SUBSIDIARIES AND ASSOCIATED COMPANIES (CONTINUED)
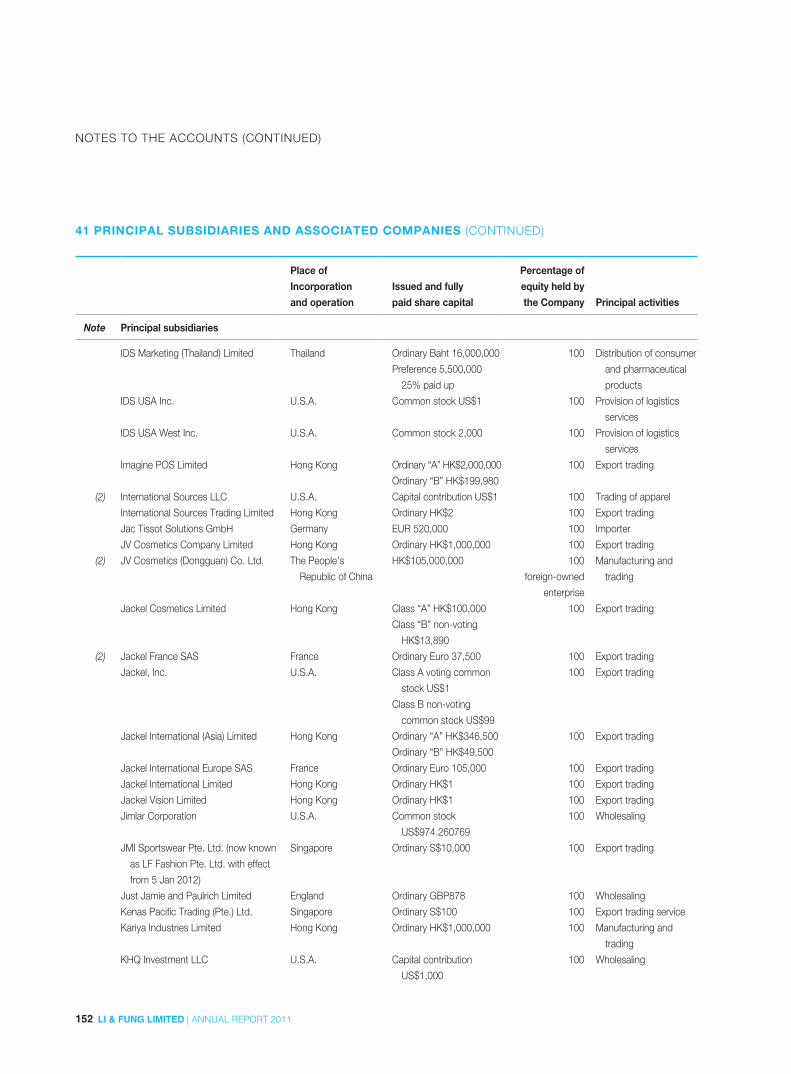
152 LI & FUNG LIMITED | ANNUAL REPORT 2011
NOTES TO THE ACCOUNTS (CONTINUED)
Place of
Incorporation
and operation
Issued and fully
paid share capital
Percentage of
equity held by
the Company Principal activities
Note Principal subsidiaries
IDS Marketing (Thailand) Limited Thailand Ordinary Baht 16,000,000
Preference 5,500,000
25% paid up
100 Distribution of consumer
and pharmaceutical
products
IDS USA Inc. U.S.A. Common stock US$1 100 Provision of logistics
services
IDS USA West Inc. U.S.A. Common stock 2,000 100 Provision of logistics
services
Imagine POS Limited Hong Kong Ordinary “A” HK$2,000,000
Ordinary “B” HK$199,980
100 Export trading
(2) International Sources LLC U.S.A. Capital contribution US$1 100 Trading of apparel
International Sources Trading Limited Hong Kong Ordinary HK$2 100 Export trading
Jac Tissot Solutions GmbH Germany EUR 520,000 100 Importer
JV Cosmetics Company Limited Hong Kong Ordinary HK$1,000,000 100 Export trading
(2) JV Cosmetics (Dongguan) Co. Ltd. The People’s
Republic of China
HK$105,000,000 100
foreign-owned
enterprise
Manufacturing and
trading
Jackel Cosmetics Limited Hong Kong Class “A” HK$100,000
Class “B” non-voting
HK$13,890
100 Export trading
(2) Jackel France SAS France Ordinary Euro 37,500 100 Export trading
Jackel, Inc. U.S.A. Class A voting common
stock US$1
Class B non-voting
common stock US$99
100 Export trading
Jackel International (Asia) Limited Hong Kong Ordinary “A” HK$346,500
Ordinary “B” HK$49,500
100 Export trading
Jackel International Europe SAS France Ordinary Euro 105,000 100 Export trading
Jackel International Limited Hong Kong Ordinary HK$1 100 Export trading
Jackel Vision Limited Hong Kong Ordinary HK$1 100 Export trading
Jimlar Corporation U.S.A. Common stock
US$974.260769
100 Wholesaling
JMI Sportswear Pte. Ltd. (now known
as LF Fashion Pte. Ltd. with effect
from 5 Jan 2012)
Singapore Ordinary S$10,000 100 Export trading
Just Jamie and Paulrich Limited England Ordinary GBP878 100 Wholesaling
Kenas Pacific Trading (Pte.) Ltd. Singapore Ordinary S$100 100 Export trading service
Kariya Industries Limited Hong Kong Ordinary HK$1,000,000 100 Manufacturing and
trading
KHQ Investment LLC U.S.A. Capital contribution
US$1,000
100 Wholesaling
41 PRINCIPAL SUBSIDIARIES AND ASSOCIATED COMPANIES (CONTINUED)
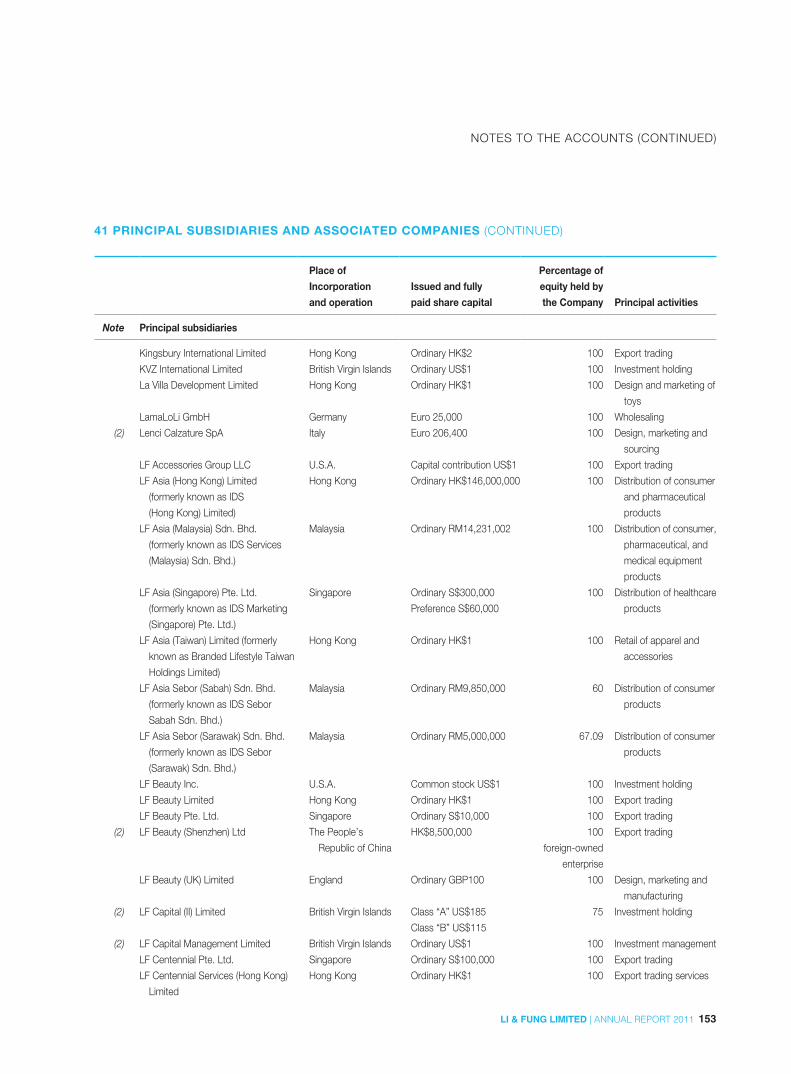
153LI & FUNG LIMITED | ANNUAL REPORT 2011
NOTES TO THE ACCOUNTS (CONTINUED)
Place of
Incorporation
and operation
Issued and fully
paid share capital
Percentage of
equity held by
the Company Principal activities
Note Principal subsidiaries
Kingsbury International Limited Hong Kong Ordinary HK$2 100 Export trading
KVZ International Limited British Virgin Islands Ordinary US$1 100 Investment holding
La Villa Development Limited Hong Kong Ordinary HK$1 100 Design and marketing of
toys
LamaLoLi GmbH Germany Euro 25,000 100 Wholesaling
(2) Lenci Calzature SpA Italy Euro 206,400 100 Design, marketing and
sourcing
LF Accessories Group LLC U.S.A. Capital contribution US$1 100 Export trading
LF Asia (Hong Kong) Limited
(formerly known as IDS
(Hong Kong) Limited)
Hong Kong Ordinary HK$146,000,000 100 Distribution of consumer
and pharmaceutical
products
LF Asia (Malaysia) Sdn. Bhd.
(formerly known as IDS Services
(Malaysia) Sdn. Bhd.)
Malaysia Ordinary RM14,231,002 100 Distribution of consumer,
pharmaceutical, and
medical equipment
products
LF Asia (Singapore) Pte. Ltd.
(formerly known as IDS Marketing
(Singapore) Pte. Ltd.)
Singapore Ordinary S$300,000
Preference S$60,000
100 Distribution of healthcare
products
LF Asia (Taiwan) Limited (formerly
known as Branded Lifestyle Taiwan
Holdings Limited)
Hong Kong Ordinary HK$1 100 Retail of apparel and
accessories
LF Asia Sebor (Sabah) Sdn. Bhd.
(formerly known as IDS Sebor
Sabah Sdn. Bhd.)
Malaysia Ordinary RM9,850,000 60 Distribution of consumer
products
LF Asia Sebor (Sarawak) Sdn. Bhd.
(formerly known as IDS Sebor
(Sarawak) Sdn. Bhd.)
Malaysia Ordinary RM5,000,000 67.09 Distribution of consumer
products
LF Beauty Inc. U.S.A. Common stock US$1 100 Investment holding
LF Beauty Limited Hong Kong Ordinary HK$1 100 Export trading
LF Beauty Pte. Ltd. Singapore Ordinary S$10,000 100 Export trading
(2) LF Beauty (Shenzhen) Ltd The People’s
Republic of China
HK$8,500,000 100
foreign-owned
enterprise
Export trading
LF Beauty (UK) Limited England Ordinary GBP100 100 Design, marketing and
manufacturing
(2) LF Capital (II) Limited British Virgin Islands Class “A” US$185
Class “B” US$115
75 Investment holding
(2) LF Capital Management Limited British Virgin Islands Ordinary US$1 100 Investment management
LF Centennial Pte. Ltd. Singapore Ordinary S$100,000 100 Export trading
LF Centennial Services (Hong Kong)
Limited
Hong Kong Ordinary HK$1 100 Export trading services
41 PRINCIPAL SUBSIDIARIES AND ASSOCIATED COMPANIES (CONTINUED)
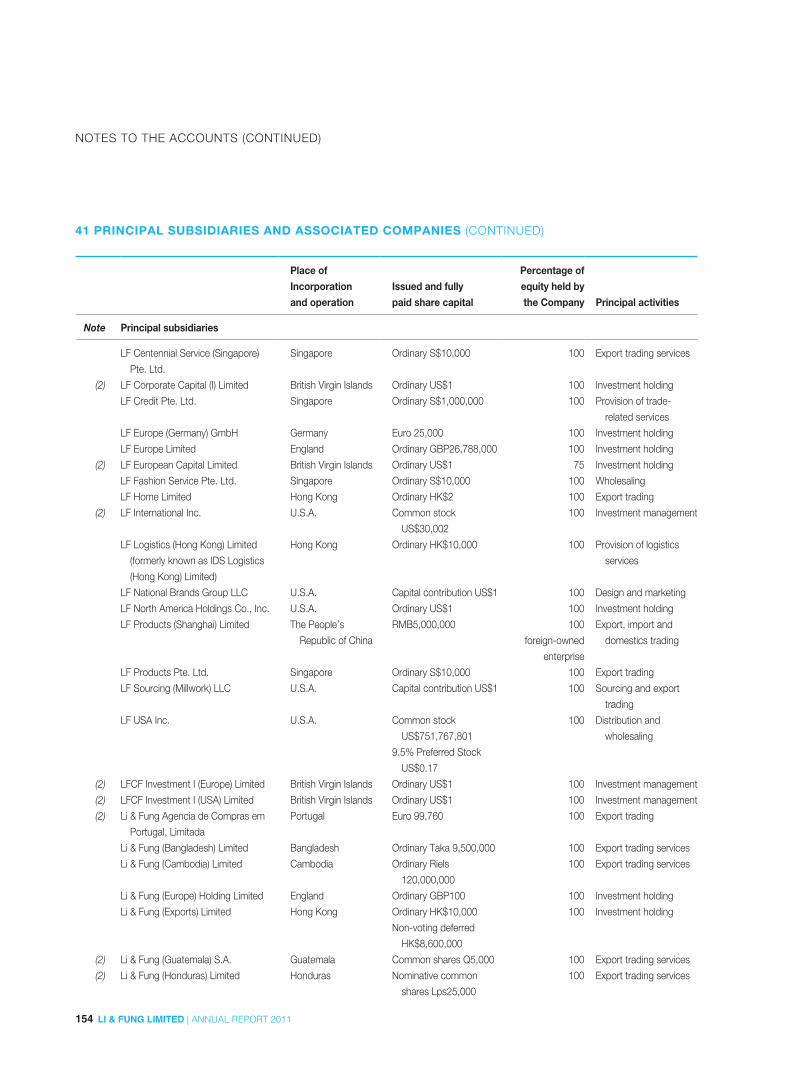
154 LI & FUNG LIMITED | ANNUAL REPORT 2011
NOTES TO THE ACCOUNTS (CONTINUED)
Place of
Incorporation
and operation
Issued and fully
paid share capital
Percentage of
equity held by
the Company Principal activities
Note Principal subsidiaries
LF Centennial Service (Singapore)
Pte. Ltd.
Singapore Ordinary S$10,000 100 Export trading services
(2) LF Corporate Capital (I) Limited British Virgin Islands Ordinary US$1 100 Investment holding
LF Credit Pte. Ltd. Singapore Ordinary S$1,000,000 100 Provision of trade-
related services
LF Europe (Germany) GmbH Germany Euro 25,000 100 Investment holding
LF Europe Limited England Ordinary GBP26,788,000 100 Investment holding
(2) LF European Capital Limited British Virgin Islands Ordinary US$1 75 Investment holding
LF Fashion Service Pte. Ltd. Singapore Ordinary S$10,000 100 Wholesaling
LF Home Limited Hong Kong Ordinary HK$2 100 Export trading
(2) LF International Inc. U.S.A. Common stock
US$30,002
100 Investment management
LF Logistics (Hong Kong) Limited
(formerly known as IDS Logistics
(Hong Kong) Limited)
Hong Kong Ordinary HK$10,000 100 Provision of logistics
services
LF National Brands Group LLC U.S.A. Capital contribution US$1 100 Design and marketing
LF North America Holdings Co., Inc. U.S.A. Ordinary US$1 100 Investment holding
LF Products (Shanghai) Limited The People’s
Republic of China
RMB5,000,000 100
foreign-owned
enterprise
Export, import and
domestics trading
LF Products Pte. Ltd. Singapore Ordinary S$10,000 100 Export trading
LF Sourcing (Millwork) LLC U.S.A. Capital contribution US$1 100 Sourcing and export
trading
LF USA Inc. U.S.A. Common stock
US$751,767,801
9.5% Preferred Stock
US$0.17
100 Distribution and
wholesaling
(2) LFCF Investment I (Europe) Limited British Virgin Islands Ordinary US$1 100 Investment management
(2) LFCF Investment I (USA) Limited British Virgin Islands Ordinary US$1 100 Investment management
(2) Li & Fung Agencia de Compras em
Portugal, Limitada
Portugal Euro 99,760 100 Export trading
Li & Fung (Bangladesh) Limited Bangladesh Ordinary Taka 9,500,000 100 Export trading services
Li & Fung (Cambodia) Limited Cambodia Ordinary Riels
120,000,000
100 Export trading services
Li & Fung (Europe) Holding Limited England Ordinary GBP100 100 Investment holding
Li & Fung (Exports) Limited Hong Kong Ordinary HK$10,000
Non-voting deferred
HK$8,600,000
100 Investment holding
(2) Li & Fung (Guatemala) S.A. Guatemala Common shares Q5,000 100 Export trading services
(2) Li & Fung (Honduras) Limited Honduras Nominative common
shares Lps25,000
100 Export trading services
41 PRINCIPAL SUBSIDIARIES AND ASSOCIATED COMPANIES (CONTINUED)

155LI & FUNG LIMITED | ANNUAL REPORT 2011
NOTES TO THE ACCOUNTS (CONTINUED)
Place of
Incorporation
and operation
Issued and fully
paid share capital
Percentage of
equity held by
the Company Principal activities
Note Principal subsidiaries
Li & Fung (India) Private Limited India Equity shares Rupee
64,000,200
100 Export trading services
Li & Fung (Korea) Limited Korea Common stock Won
200,000,000
100 Export trading services
(2) Li & Fung (Mauritius) Limited Mauritius “A” Shares Rupees
750,000
“B” Shares Rupees
500,000
60 Export trading services
(2) Li & Fung (Morocco) SARL Morocco Dirhams10,000 100 Export trading services
Li & Fung Mumessillik Pazarlama
Limited Sirketi
Turkey YTL15,639,650 100 Export trading services
(2) Li & Fung (Nicaragua), Sociedad
Anonima
Nicaragua Nominative shares
C$50,000
100 Export trading services
Li & Fung Pakistan (Private) Limited Pakistan Rs10,000,000 100 Export trading services
Li & Fung (Philippines) Inc. The Philippines Peso 1,000,000 100 Export trading services
(2) Li & Fung (Portugal) Limited England Ordinary GBP100 100 Investment holding
Li & Fung (Properties) Limited Hong Kong Ordinary HK$1,000,000 100 Investment holding
Li & Fung (Singapore) Pte Limited Singapore Ordinary S$25,000 100 Export trading services
Li & Fung South Africa (Proprietary)
Limited
South Africa Ordinary Rand 100 100 Export trading services
Li & Fung Taiwan Holdings Limited Taiwan NT$287,996,000 100 Investment holding
Li & Fung Taiwan Investments Limited British Virgin Islands Ordinary US$4,912,180 100 Investment holding
Li & Fung (Taiwan) Limited Taiwan NT$63,000,000 100 Sourcing and inspection
Li & Fung (Thailand) Limited Thailand Baht 20,000,000 100 Export trading services
(2) Li & Fung Trading (Italia) S.r.l. Italy Euro 100,000 100 Export trading services
Li & Fung (Trading) Limited Hong Kong Ordinary HK$200
Non-voting deferred
HK$10,000,000
100 Export trading and
investment holding
Li & Fung Trading Service
(Shanghai) Company Limited
The People’s
Republic of China
US$6,000,000 100
foreign-owned
enterprise
Export trading services
Li & Fung Trading Service
(Shenzhen) Limited
The People’s
Republic of China
RMB3,000,000 100
foreign-owned
enterprise
Export trading services
Li & Fung Trading (Shanghai) Limited The People’s
Republic of China
RMB50,000,000 100
foreign-owned
enterprise
Export trading
Li & Fung (Vietnam) Limited Vietnam US$800,000 100 Export trading services
Lion Rock Far East (1972) Limited Hong Kong Ordinary HK$20 100 Investment holding
Lion Rock (Hong Kong) Limited Hong Kong Ordinary HK$10,000 100 Investment holding
41 PRINCIPAL SUBSIDIARIES AND ASSOCIATED COMPANIES (CONTINUED)
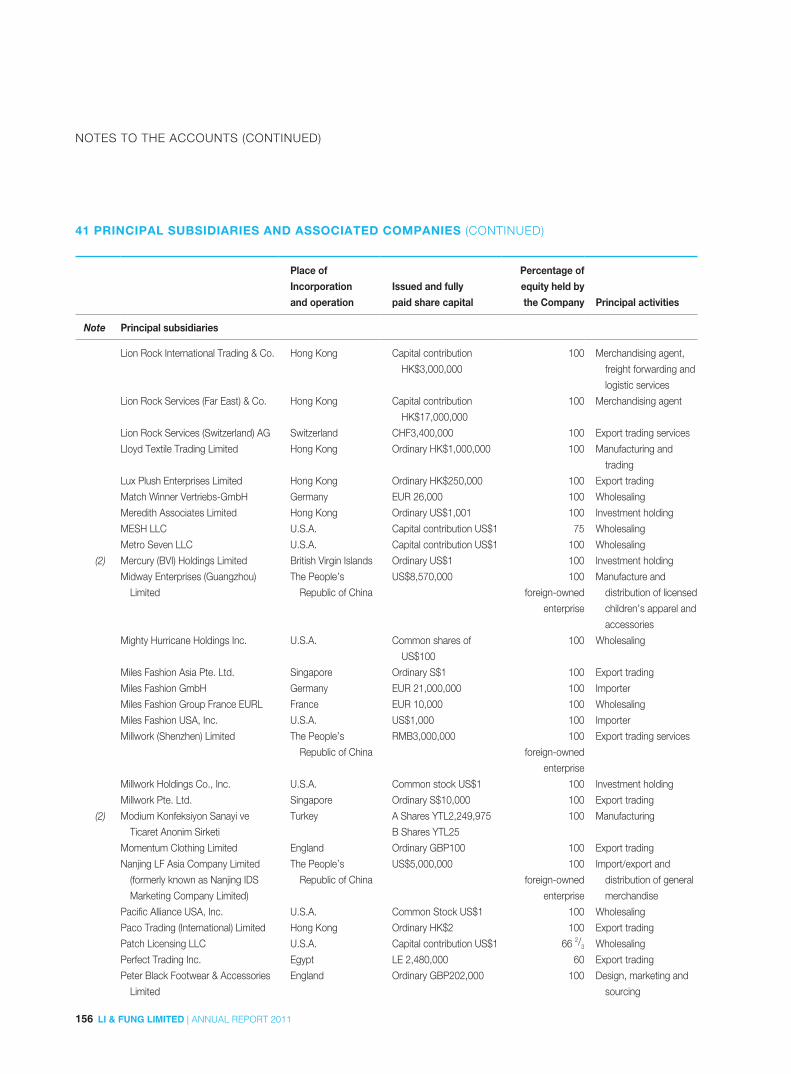
156 LI & FUNG LIMITED | ANNUAL REPORT 2011
NOTES TO THE ACCOUNTS (CONTINUED)
Place of
Incorporation
and operation
Issued and fully
paid share capital
Percentage of
equity held by
the Company Principal activities
Note Principal subsidiaries
Lion Rock International Trading & Co. Hong Kong Capital contribution
HK$3,000,000
100 Merchandising agent,
freight forwarding and
logistic services
Lion Rock Services (Far East) & Co. Hong Kong Capital contribution
HK$17,000,000
100 Merchandising agent
Lion Rock Services (Switzerland) AG Switzerland CHF3,400,000 100 Export trading services
Lloyd Textile Trading Limited Hong Kong Ordinary HK$1,000,000 100 Manufacturing and
trading
Lux Plush Enterprises Limited Hong Kong Ordinary HK$250,000 100 Export trading
Match Winner Vertriebs-GmbH Germany EUR 26,000 100 Wholesaling
Meredith Associates Limited Hong Kong Ordinary US$1,001 100 Investment holding
MESH LLC U.S.A. Capital contribution US$1 75 Wholesaling
Metro Seven LLC U.S.A. Capital contribution US$1 100 Wholesaling
(2) Mercury (BVI) Holdings Limited British Virgin Islands Ordinary US$1 100 Investment holding
Midway Enterprises (Guangzhou)
Limited
The People’s
Republic of China
US$8,570,000 100
foreign-owned
enterprise
Manufacture and
distribution of licensed
children’s apparel and
accessories
Mighty Hurricane Holdings Inc. U.S.A. Common shares of
US$100
100 Wholesaling
Miles Fashion Asia Pte. Ltd. Singapore Ordinary S$1 100 Export trading
Miles Fashion GmbH Germany EUR 21,000,000 100 Importer
Miles Fashion Group France EURL France EUR 10,000 100 Wholesaling
Miles Fashion USA, Inc. U.S.A. US$1,000 100 Importer
Millwork (Shenzhen) Limited The People’s
Republic of China
RMB3,000,000 100
foreign-owned
enterprise
Export trading services
Millwork Holdings Co., Inc. U.S.A. Common stock US$1 100 Investment holding
Millwork Pte. Ltd. Singapore Ordinary S$10,000 100 Export trading
(2) Modium Konfeksiyon Sanayi ve
Ticaret Anonim Sirketi
Turkey A Shares YTL2,249,975
B Shares YTL25
100 Manufacturing
Momentum Clothing Limited England Ordinary GBP100 100 Export trading
Nanjing LF Asia Company Limited
(formerly known as Nanjing IDS
Marketing Company Limited)
The People’s
Republic of China
US$5,000,000 100
foreign-owned
enterprise
Import/export and
distribution of general
merchandise
Pacific Alliance USA, Inc. U.S.A. Common Stock US$1 100 Wholesaling
Paco Trading (International) Limited Hong Kong Ordinary HK$2 100 Export trading
Patch Licensing LLC U.S.A. Capital contribution US$1 66 2/3 Wholesaling
Perfect Trading Inc. Egypt LE 2,480,000 60 Export trading
Peter Black Footwear & Accessories
Limited
England Ordinary GBP202,000 100 Design, marketing and
sourcing
41 PRINCIPAL SUBSIDIARIES AND ASSOCIATED COMPANIES (CONTINUED)
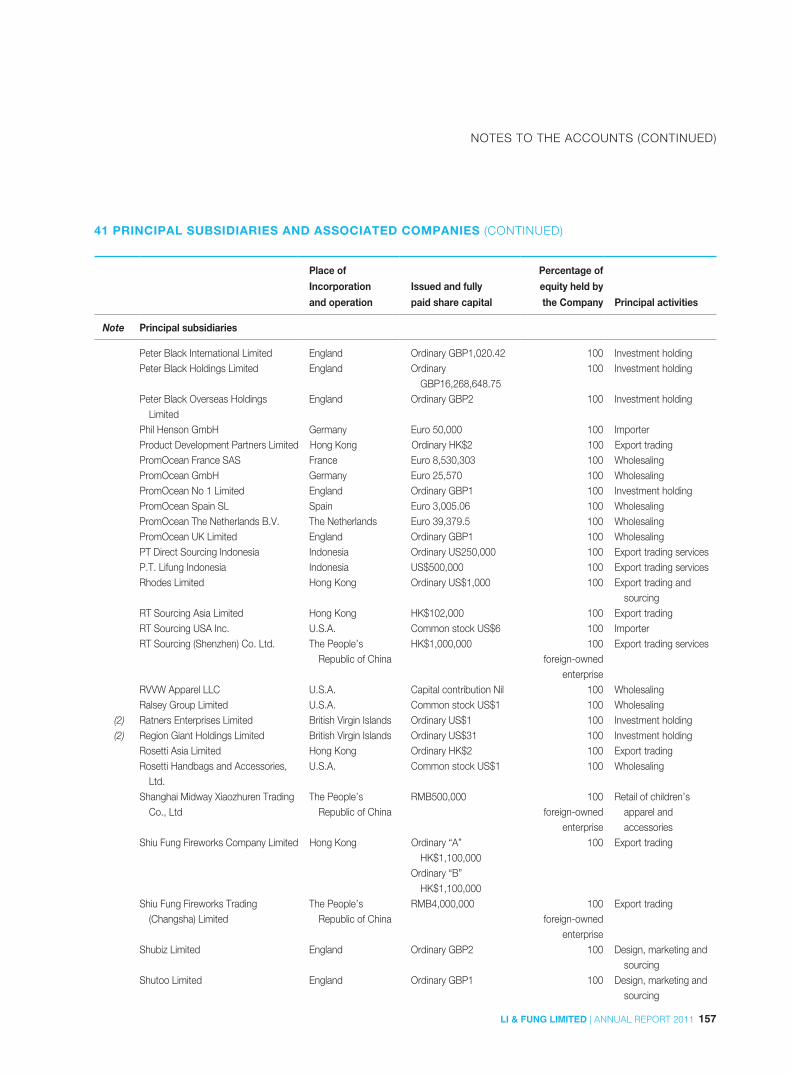
157LI & FUNG LIMITED | ANNUAL REPORT 2011
NOTES TO THE ACCOUNTS (CONTINUED)
Place of
Incorporation
and operation
Issued and fully
paid share capital
Percentage of
equity held by
the Company Principal activities
Note Principal subsidiaries
Peter Black International Limited England Ordinary GBP1,020.42 100 Investment holdingPeter Black Holdings Limited England Ordinary
GBP16,268,648.75100 Investment holding
Peter Black Overseas Holdings Limited
England Ordinary GBP2 100 Investment holding
Phil Henson GmbH Germany Euro 50,000 100 ImporterProduct Development Partners Limited Hong Kong Ordinary HK$2 100 Export tradingPromOcean France SAS France Euro 8,530,303 100 WholesalingPromOcean GmbH Germany Euro 25,570 100 WholesalingPromOcean No 1 Limited England Ordinary GBP1 100 Investment holdingPromOcean Spain SL Spain Euro 3,005.06 100 WholesalingPromOcean The Netherlands B.V. The Netherlands Euro 39,379.5 100 WholesalingPromOcean UK Limited England Ordinary GBP1 100 WholesalingPT Direct Sourcing Indonesia Indonesia Ordinary US250,000 100 Export trading servicesP.T. Lifung Indonesia Indonesia US$500,000 100 Export trading servicesRhodes Limited Hong Kong Ordinary US$1,000 100 Export trading and
sourcingRT Sourcing Asia Limited Hong Kong HK$102,000 100 Export tradingRT Sourcing USA Inc. U.S.A. Common stock US$6 100 ImporterRT Sourcing (Shenzhen) Co. Ltd. The People’s
Republic of ChinaHK$1,000,000 100
foreign-owned enterprise
Export trading services
RVVW Apparel LLC U.S.A. Capital contribution Nil 100 WholesalingRalsey Group Limited U.S.A. Common stock US$1 100 Wholesaling
(2) Ratners Enterprises Limited British Virgin Islands Ordinary US$1 100 Investment holding(2) Region Giant Holdings Limited British Virgin Islands Ordinary US$31 100 Investment holding
Rosetti Asia Limited Hong Kong Ordinary HK$2 100 Export tradingRosetti Handbags and Accessories,
Ltd.U.S.A. Common stock US$1 100 Wholesaling
Shanghai Midway Xiaozhuren Trading Co., Ltd
The People’s Republic of China
RMB500,000 100foreign-owned
enterprise
Retail of children’s apparel and accessories
Shiu Fung Fireworks Company Limited Hong Kong Ordinary “A” HK$1,100,000
Ordinary “B” HK$1,100,000
100 Export trading
Shiu Fung Fireworks Trading (Changsha) Limited
The People’s Republic of China
RMB4,000,000 100 foreign-owned
enterprise
Export trading
Shubiz Limited England Ordinary GBP2 100 Design, marketing and sourcing
Shutoo Limited England Ordinary GBP1 100 Design, marketing and sourcing
41 PRINCIPAL SUBSIDIARIES AND ASSOCIATED COMPANIES (CONTINUED)

158 LI & FUNG LIMITED | ANNUAL REPORT 2011
NOTES TO THE ACCOUNTS (CONTINUED)
Place of
Incorporation
and operation
Issued and fully
paid share capital
Percentage of
equity held by
the Company Principal activities
Note Principal subsidiaries
Silvereed (Hong Kong) Limited Hong Kong Ordinary HK$1 100 Export tradingSky Million International Limited Hong Kong Ordinary HK$2 100 Property investmentSports Brands Italia Limited Hong Kong Ordinary HK$1,000,000 100 Export trading
(2) STS Shenzhen Testing Service Limited The People’s Republic of China
US$660,000 100 foreign-owned
enterprise
Testing and technology consultation
(2) Tantallon Enterprises Limited British Virgin Islands Ordinary US$1 100 Investment holding(2) Texnorte II-Industrias Texteis, Limitada Portugal Quotas Euro 5,000 100 Export trading
Texnorte Industrial Limited Hong Kong Ordinary HK$2 100 Export tradingTH Success Limited Hong Kong Ordinary HK$1,560,000 100 Export tradingToy Island Manufacturing Company
LimitedHong Kong Ordinary HK$62,000,000 100 Design and marketing
Toy Island (USA) LLC U.S.A. Capital contribution US$100
100 Marketing
T.V.M. Design Services Ltd Israel Ordinary NIS100 100 Design and marketingToonsland Limited Hong Kong Ordinary HK$200,000 100 Distribution of children’s
apparel and accessories
TVM Europe GmbH Germany Euro 25,000 100 WholesalingTVMania Italy S.r.l. Italy Euro 10,000 100 WholesalingTVMania UK Limited England Ordinary GBP2 100 WholesalingVentana Bekleidungsfabrikation GmbH Germany Euro 26,000 100 WholesalingVisage Group Limited England Ordinary GBP100,000 100 Investment holdingVisage Holdings (2010) Limited England Ordinary GBP2 100 Investment holdingVisage Holdings Limited England Ordinary GBP35,163 100 Investment holdingVisage (Hong Kong) Limited Hong Kong Ordinary HK$100,000 100 Design and marketingVisage Limited England Ordinary GBP54,100 100 Design, marketing and
sourcingVZI Investment Corp. U.S.A. Common stock US$1 100 WholesalingW S Trading Limited Hong Kong Ordinary HK$1,000,000 100 Export tradingWonderful World Overseas Limited British Virgin Islands Ordinary US$1 100 Investment holdingWilson Fabric Mart (China) Ltd
(formerly known as Verity Enterprises Limited)
Hong Kong Ordinary HK$2,000,000 100 Export trading
Wilson Textile Limited Hong Kong Ordinary HK$1 100 Export trading888 UK Limited England Ordinary GBP100 100 Service company
NOTES:
(1) Li & Fung (B.V.I.) Limited provides the subsidiaries with promotional and marketing services outside Hong Kong.
(2) Subsidiaries not audited by PricewaterhouseCoopers. The aggregate net assets of subsidiaries not audited/reviewed by PricewaterhouseCoopers
amounted to less than 5% of the Group’s total net assets.
41 PRINCIPAL SUBSIDIARIES AND ASSOCIATED COMPANIES (CONTINUED)
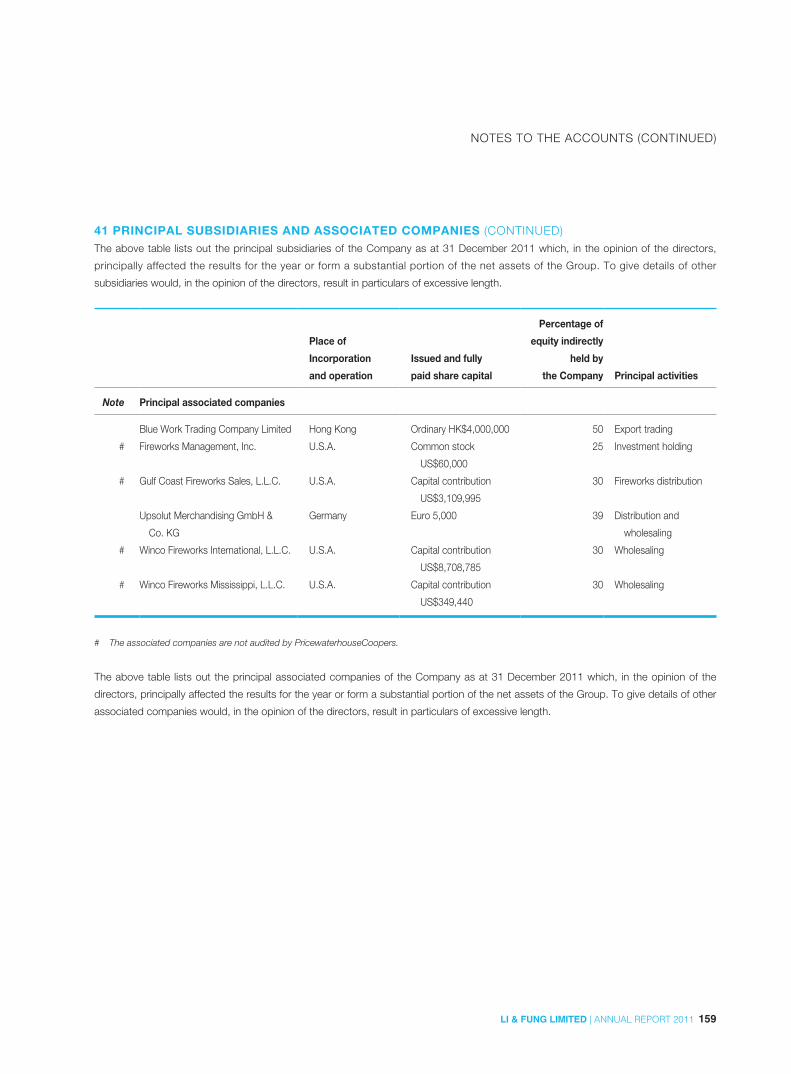
159LI & FUNG LIMITED | ANNUAL REPORT 2011
NOTES TO THE ACCOUNTS (CONTINUED)
41 PRINCIPAL SUBSIDIARIES AND ASSOCIATED COMPANIES (CONTINUED)The above table lists out the principal subsidiaries of the Company as at 31 December 2011 which, in the opinion of the directors,
principally affected the results for the year or form a substantial portion of the net assets of the Group. To give details of other
subsidiaries would, in the opinion of the directors, result in particulars of excessive length.
Place of
Incorporation
and operation
Issued and fully
paid share capital
Percentage of
equity indirectly
held by
the Company Principal activities
Note Principal associated companies
Blue Work Trading Company Limited Hong Kong Ordinary HK$4,000,000 50 Export trading
# Fireworks Management, Inc. U.S.A. Common stock
US$60,000
25 Investment holding
# Gulf Coast Fireworks Sales, L.L.C. U.S.A. Capital contribution
US$3,109,995
30 Fireworks distribution
Upsolut Merchandising GmbH &
Co. KG
Germany Euro 5,000 39 Distribution and
wholesaling
# Winco Fireworks International, L.L.C. U.S.A. Capital contribution
US$8,708,785
30 Wholesaling
# Winco Fireworks Mississippi, L.L.C. U.S.A. Capital contribution
US$349,440
30 Wholesaling
# The associated companies are not audited by PricewaterhouseCoopers.
The above table lists out the principal associated companies of the Company as at 31 December 2011 which, in the opinion of the
directors, principally affected the results for the year or form a substantial portion of the net assets of the Group. To give details of other
associated companies would, in the opinion of the directors, result in particulars of excessive length.

TEN-YEAR FINANCIAL SUMMARY
160 LI & FUNG LIMITED | ANNUAL REPORT 2011
CONSOLIDATED PROFIT & LOSS ACCOUNT
2011 2010 2009 2008 2007 2006 2005 2004 2003 2002
US$’000 US$’000 US$’000 US$’000 US$’000 US$’000 US$’000 US$’000 US$’000 US$’000
TurnoverContinuing operations 20,030,271 15,912,201 13,394,741 14,195,143 11,853,840 8,719,264 7,130,433 6,047,513 5,465,450 4,779,662Discontinued operations – – – – – – – – – –
20,030,271 15,912,201 13,394,741 14,195,143 11,853,840 8,719,264 7,130,433 6,047,513 5,465,450 4,779,662
Operating profitContinuing operations 879,937 679,318 497,373 390,310 461,545 309,272 241,615 199,492 160,511 145,772Discontinued operations – – – – – – – – – –
879,937 679,318 497,373 390,310 461,545 309,272 241,615 199,492 160,511 145,772Interest income 19,490 13,567 11,636 14,455 26,691 12,627 8,915 5,534 4,920 6,357Interest expenses (128,594) (98,443) (47,706) (61,561) (64,059) (18,983) (2,741) (1,470) (1,258) (1,152)Share of profit less losses of
associated companies 1,231 1,850 998 794 634 1,359 1,162 4,205 55 (210)Profit before taxation 772,064 596,292 462,301 343,998 424,811 304,275 248,951 207,761 164,228 150,767Taxation (90,660) (47,525) (30,798) (33,269) (32,379) (22,011) (19,391) (16,699) (13,324) (11,906)
Profit for the year 681,404 548,767 431,503 310,729 392,432 282,264 229,560 191,062 150,904 138,861
Attributable to:Continuing operations 681,229 548,491 431,937 310,505 392,312 282,284 229,523 191,182 152,455 138,832Discontinued operations – – – – – – – – – –
Shareholders of the Company 681,229 548,491 431,937 310,505 392,312 282,284 229,523 191,182 152,455 138,832Non-controlling interests 175 276 (434) 225 121 (20) 38 (120) (1,552) 29
681,404 548,767 431,503 310,730 392,433 282,264 229,561 191,062 150,903 138,861
Earnings per share (US cents) (Note)
Basic 8.43 7.17 5.83 4.44 5.74 4.30 3.56 2.98 2.40 2.19Continuing operations 8.43 7.17 5.83 4.44 5.74 4.30 3.56 2.98 2.40 2.19
Dividend per share (US cents) (Note) 6.79 5.77 4.81 3.65 4.55 3.53 2.91 2.45 2.04 1.78Special dividend per share
(US cents) (Note) – – – – – – – 1.46 – –
CONSOLIDATED BALANCE SHEET
2011 2010 2009 2008 2007 2006 2005 2004 2003 2002US$’000 US$’000 US$’000 US$’000 US$’000 US$’000 US$’000 US$’000 US$’000 US$’000
Intangible assets 6,525,999 4,882,166 2,333,657 1,872,068 1,458,287 604,252 360,177 167,222 78,570 41,884Property, plant and equipment 325,432 309,186 160,988 164,495 144,872 142,868 121,488 91,667 93,727 84,403Other non-current assets 117,418 124,679 112,356 20,246 27,974 113,166 126,028 128,778 117,869 98,420Current assets 3,951,571 4,177,788 2,757,963 2,752,051 2,444,428 1,966,007 1,349,745 1,057,244 895,034 804,032Current liabilities 3,664,820 3,317,362 2,227,923 2,288,234 2,095,649 1,658,606 1,264,395 772,589 636,011 533,263
Net current assets 286,751 860,426 530,040 463,817 348,779 307,401 85,350 284,655 259,023 270,769
7,255,600 6,176,457 3,137,041 2,520,626 1,979,912 1,167,687 693,043 672,322 549,189 495,476
Financed by:Share capital 12,987 12,899 12,103 11,648 11,060 10,928 9,412 9,350 9,301 9,263Reserves 3,925,619 3,619,179 2,260,485 1,704,039 1,253,589 1,048,924 583,511 594,424 527,939 476,182
Total equity 3,938,606 3,632,078 2,272,588 1,715,687 1,264,649 1,059,852 592,923 603,774 537,240 485,445Other non-current liabilities 3,316,994 2,544,379 864,453 804,939 715,263 107,835 100,120 68,548 11,949 10,031
7,255,600 6,176,457 3,137,041 2,520,626 1,979,912 1,167,687 693,043 672,322 549,189 495,476
NOTE: Adjusted for the effect of 1-for-10 Bonus Issue in May 2006 and Share Subdivision in May 2011


LIFUNG TOWER888 Cheung Sha Wan Road
Kowloon, Hong Kong
Tel. (852) 2300 2300 | www.lifung.com PRINTED ON POST-CONSUMER WASTE RECYCLED PAPER