arabidopsis thaliana small rna sequencing · 2018. 5. 2. · september 2015 . project information...
TRANSCRIPT

Arabidopsis thaliana small RNA Sequencing
Report September 2015

Project Information
Client Name Client
Company / Institution Macrogen
Order Number Order ID
Species Arabidopsis thaliana
Reference UCSC hg19
miRBase / Rfam version miRBase v21 / Rfam 9.1
Type of Read Single-end
Read Length 51
Number of Samples 4
Library Kit TruSeq small RNA Library Prep Kit
Library Protocol TruSeq small RNA Library Prep Guide, Part # 150041697 Rev. G
Reagent TruSeq SBS Kit v3
Sequencing Protocol HiSeq 2000 System User Guide Part # 15011190 Rev. V HCS 2.2.38
Type of Sequencer HiSeq 2000
Sequencing Control Software HCS v2.2
Comment

Table of Contents
1. Experimental Methods and Workflow ............................ 4 2. Analysis Methods and Workflow ..................................... 6 3. Summary of Data Production .............................................. 7
3.1. Raw data Statistics 3.2. Average Base Quality at Each Cycle 3.3. Trimmed Data Statistics 3.4 Average Base Quality at Each Cycle after Trimming 3.5 Read length distribution of trimmed reads 3.6 Unique Clustering
4. smRNA Analysis Result ....................................................... 13 4.1 Quantification of mature miRNA abundance 4.2 Prediction of known/novel miRNA 4.3 Classification by categories of smRNA
5. Differentially Expressed miRNA Analysis Results .. 24 5.1 Data Analysis Quality Check and Preprocessing 5.2 Differentially Expressed miRNA Analysis Workflow 5.3 Significant miRNA Results
6. Data Download Information ................................................... 36
6.1. Raw Data 6.2. Analysis Results
Appendix .......................................................................................... 39 Reference ......................................................................................... 42

1. Experimental Methods and Workflow
Figure 1. miRNA Sequencing Experiment Workflow
Reference : https://en.wikipedia.org/wiki/MicroRNA_sequencing 1) Isolate the total RNA from a sample of interest using an isothiocyanate / phenol / chloroform (GITC/phenol) method or a commercial product such as Trizol (Invitrogen) reagent. 2) Size selection is performed to extract the miRNA fragments from the total RNA. The total RNA is run on an agarose gel and the band corresponding to the size of miRNAs is cut

out for further processing. This procedure excludes all bigger fragments, including all mRNAs and rRNAs from the samples. This step does not have to be carried out before the ligation and reverse transcription steps. 3) The sequencing adapters are ligated to the (size-selected) RNA molecules, which act as primer binding sites during reverse transcription and PCR amplification. Adenylated single strand DNA 3’adapter followed by a 5’adapter is ligated to the small RNAs using a ligating enzyme such as T4 RNA ligase2. The adapters are also designed to capture small RNAs with 5’ phosphate groups which is characteristic of microRNAs, rather than RNA degradation products with 5’ hydroxyl groups. 4) miRNA fragments with ligated adapters are converted to cDNA fragments which are later used in the sequencing reaction. There are many commercial kits using some form of reverse transcriptase in order to carry out this step. PCR is then performed to amplify the pool of cDNA sequences. 5) The amplified cDNA fragments by PCR is run on agarose gel again and the band containing the molecules corresponding to the miRNA fragments with ligated adapters is cut out for subsequent sequencing( library size is ranged from 145bp to 160bp) 6) cDNA fragments are sequenced by the read length using sequence by synthesis method on the illumina platform.

2. Analysis Methods and Workflow
Figure 2. miRNA Sequencing Analysis Workflow
The objectives of miRNA analysis are divided into four following contents .
Quantification of miRNA expression Filtering differentially expressed miRNA Prediction of known/ novel miRNAs Classification by categories of smRNA
1) After sequencing, the raw sequence reads are filtered based on quality. The adapter sequences are also trimmed off the raw sequence reads. 2) The trimmed reads are gathered and forming a unique cluster. This cluster contains reads that are 100% match to the sequence identity as well as read length. The cluster is given its temporary cluster ID and the number of reads it holds. 3) To detect known and novel miRNAs, unique clustered reads are aligned to reference genome and also aligned to precursor miRNAs obtained from miRBase v21. The miRDeep2 algorithm is used to predict potential hairpin structures and to assign scores that represent the probability that hairpins are true miRNA precursors. 4) Unique clustered reads are sequentially aligned to reference genome, miRBase v21 and non-coding RNA database, Rfam9.1 to classify known miRNAs and other type of RNA such as tRNA, snRNA, snoRNA etc. 5) The read counts for each miRNA are then normalized to the total number of mapped miRNAs to report the abundance of each miRNA. 6) In groups with different conditions, miRNAs that express differentially are filtered out through statistical hypothesis testing.
3. Summary of Data Production
3.1. Raw data Statistics
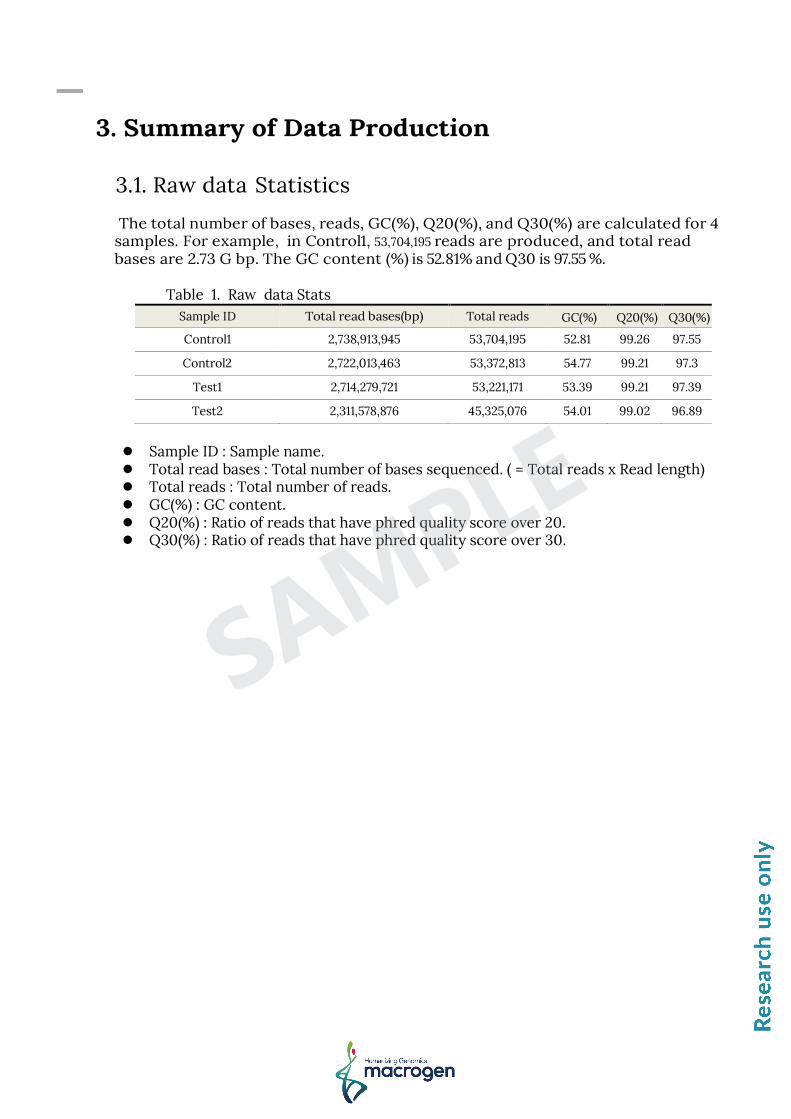
The total number of bases, reads, GC(%), Q20(%), and Q30(%) are calculated for 4 samples. For example, in Control1, 53,704,195 reads are produced, and total read bases are 2.73 G bp. The GC content (%) is 52.81% and Q30 is 97.55 %.
Table 1. Raw data Stats
Sample ID Total read bases(bp) Total reads GC(%) Q20(%) Q30(%)
Control1 2,738,913,945 53,704,195 52.81 99.26 97.55
Control2 2,722,013,463 53,372,813 54.77 99.21 97.3
Test1 2,714,279,721 53,221,171 53.39 99.21 97.39
Test2 2,311,578,876 45,325,076 54.01 99.02 96.89
Sample ID : Sample name. Total read bases : Total number of bases sequenced. ( = Total reads x Read length) Total reads : Total number of reads. GC(%) : GC content. Q20(%) : Ratio of reads that have phred quality score over 20. Q30(%) : Ratio of reads that have phred quality score over 30.

3.2. Average Base Quality at Each Cycle The quality of produced data is determined by the phred quality score at each cycle. Box plot containing the average quality at each cycle is created with FastQC (http://www.bioinformatics.babraham.ac.uk/projects/fastqc). The x-axis shows number of cycles and y-axis shows phred quality score. Phred quality score 20 means 99% accuracy and reads over score of 20 are accepted as good quality.
Figure 3. Read quality at each cycle of Control1 (read1)
Yellow box : interquartile range (25-75%) of phred score at each cycle Red line : median phred score at each cycle Blue line : average phred score at each cycle Green background: Good quality. Orange background: Acceptable quality. Red background : Bad quality

3.3. Trimmed Data Statistics The reads start at the first base after the 5' sequencing adapter and in Illumina sequencing typically end after 51 bp (in case of sequencing 51 bp SE). As mature miRNAs are normally only up to 24 bp in length, the reads will contain part of 3' adapter sequence that has to be removed. Adapter trimming process is done to eliminate the adapter sequences that exist in the read using Cutadapt. If a read matches at least first 5 bp of 3' adapter sequence, it is regarded as an adapter sequence, and then trimmed from the read. Trimmed reads should be at the minimum of 18 bp in order to be considered reliable for analysis. Afterwards, 3' end of each read is quality trimmed with -q 10 in Cutadapt. Table 2. Trimmed data Stats
Sample ID Total read bases(bp) Total reads GC(%) Q20(%) Q30(%)
Control1 1,316,228,539 45,721,036 51.41 99.56 98.18
Control2 703,149,840 31,040,103 51.78 99.54 97.99
Test1 1,023,660,902 43,420,828 51.83 99.56 98.07
Test2 650,292,881 29,380,996 52.1 99.57 98.08
Table 3. Filtered non-adapter data Stats
Sample ID Total read bases(bp) Total reads GC(%) Q20(%) Q30(%)
Control1 15,216,921 298,371 53.77 93.13 90.56
Control2 5,464,701 107,151 49.38 88.15 85.25
Test1 2,996,556 58,756 51.73 74.62 70.15
Test2 3,577,395 70,145 50.72 82.63 79
Table 4. Filtered short reads less than 18 bases Sample ID Total read bases(bp) Total reads GC(%) Q20(%) Q30(%)
Control1 56,377,909 7,645,651 60.57 99.55 97.86
Control2 284,099,497 22,202,434 62.26 99.49 97.62
Test1 123,413,072 9,708,462 59.2 99.55 97.9
Test2 206,638,397 15,851,887 60.22 99.53 97.83
Total read bases : Total number of bases after trimming. Total reads : Total number of reads after trimming. GC(%) : GC content. Q20(%) : Ratio of reads that have phred quality score of over 20. Q30(%) : Ratio of reads that have phred quality score of over 30.

3.4 Average Base Quality at Each Cycle after Trimming Figure 4 shows base quality at each cycle after trimming.
Figure 4. Read quality at each cycle of Control1 (read1) after trimming
Yellow box : interquartile range (25-75%) of phred score at each cycle Red line : median phred score at each cycle Blue line : average phred score at each cycle Green background: Good quality. Orange background: Acceptable quality. Red background : Bad quality

3.5 Read length distribution of trimmed reads Figure 5 shows the read length distribution of trimmed reads. Generally mature miRNAs are 20~25nt in length.
Figure 5. Read length distribution of trimmed reads

3.6 Unique Clustering To minimize the sequence uniqueness and computational intensity, adapter sequence trimmed reads are gathered and form a cluster. This cluster contains reads that are 100% match to the sequence identity and read length. The cluster is given its temporary cluster ID and the number of reads it holds.
※ cluster ID is defined as seq_[i]_x[n] where i ≥ 0, n > 0 : 'i' means unique temporary number of cluster and 'n' is the count of reads assigned to the temporary cluster ID. Table 5. Unique clustered reads
Sample Total reads Unique clustered reads
Control1 45,721,036 2,417,525
Control2 31,040,103 1,788,074
Test1 43,420,828 2,588,046
Test2 29,380,996 1,647,507
Total reads : number of trimmed reads Unique clustered reads : number of uniquely clustered reads after clustering

4. smRNA Analysis Result 4.1 Quantification of mature miRNA abundance Quantification step is divided into three procedures. At First, mature miRNA sequences of relevant species are aligned to precursor miRNA sequences from miRBase v21( bowtie option : -f -v 0 -a --best --strata –norc). In the second step, unique clustered reads are aligned to precursor sequence( bowtie option : -f -v 1 -a --best --strata –norc). Bowtie aligner is used in the mapping steps. In the third step, we determine overlapping mature miRNA regions between two mapping results. Afterwards, the read count of mature miRNAs are extracted from the overlapping regions in the miRDeep2 Quantifier module. If a read is mapped to multiple mature miRNAs, the read counts are assigned equally to the abundance level of each mature miRNA. Table 6. Mapped unique clustered reads to miRBase precursor
Sample Total reads Mapped reads Unique clustered reads Mapped unique clustered reads
Control1 45,721,036 641,787(1.4%) 2,417,525 9,958
Control2 31,040,103 2,054,345(6.6%) 1,788,074 12,623
Test1 43,420,828 932,042(2.1%) 2,588,046 10,426
Test2 29,380,996 896,110(3.0%) 1,647,507 9,499
Table7 is an example of the expression profile of miRBase precursor for each sample in read count. Table8 shows the expression profile of known mature miRNA across samples. The expression profile of known mature miRNA is used to analyze differentially expressed miRNA(DE miRNA) later.

Table 7. Expression profile according to miRBase precursor(Example)
miRBase precursor id : Clicking this field will display a pdf of the structure
and read signature of the miRNA. total read count : the sum of read counts for the 5p and 3p sequences. 5p miRNA id 5p read counts : the number of reads that mapped to the miRNA hairpin
and are contained in the sequence covered by the 5p sequence, including 2 nts upstream and 5 nts downstream.
3p miRNA id 3p read counts: the number of reads that mapped to the miRNA hairpin
and are contained in the sequence covered by the 3p sequence, including 2 nts upstream and 5 nts downstream.
remaining reads: the number of reads that did not map to any of the 5p or 3p sequences
miRBase 5p sequence(s): the 5p miRNA sequence(s) miRBase 3p sequence(s): the 3p miRNA sequence(s) miRBase precursor sequence: the precursor miRNA sequence

Table 8. Expression profile according to known mature miRNA (Example)
Mature miRNA : Mature miRNA ID Precusor : Precursor ID Precursor_desc : Precursor description miRBase : miRBase ID ENTREZGENE : ENTREZGENE accession HGNC : HGNC accession (HUGO Gene Nomenclature Committee) MGI : MGI accession (Mouse Genome Information) RFAM : RFAM accession (RNA families database) Sample Name_readCount : Read count of the sample called "Sample
Name"

4.2 Prediction of known/novel miRNA To predict the known and novel miRNA, unique clustered reads are aligned to reference genome and precursor miRNAs separately. Novel microRNAs are predicted from mature, star and loop sequence according to the RNAfold algorithm using miRDeep2. The RNAfold function uses the nearest-neighbor thermodynamic model to predict the minimum free-energy secondary structure of an RNA sequence. RNAfold-generated graphic contains the actual in silico-folded hairpin, with the number of reads for each part of the hairpin, score for minimum free energy, score for randfold, and score for conserved seed sequence. In addition to detecting known and novel miRNAs, miRDeep2 estimates their abundance. Table 9. Mapped unique clustered reads to reference genome
Sample Total reads Mapped reads Unmapped reads
Control1 45,721,036 39,327,099 (86%) 6,393,937 (14%)
Control2 31,040,103 28,470,743 (91.7%) 2,569,360 (8.3%)
Test1 43,420,828 39,956,723 (92%) 3,464,105 (8%)
Test2 29,380,996 26,995,702 (91.9%) 2,385,294 (8.1%)
Table 10 shows an example of the summary result of predicted known/novel miRNAs by miRDeep2 at score cut-offs from -10 to 10. Table 10. Survey of miRDeep2 performance at score cut-offs from -10 to 10
miRDeep2 score: for details on how the log-odds score is calculated, see
Friedlander et al., Nature Biotechnology, 2008. predicted by miRDeep2: novel miRNA hairpins are defined by not having
any of the reference mature miRNAs mapping perfectly (full length, no mismatches). The numbers show how many novel miRNA hairpins have a score equal to or exceeding the cut-off.
estimated false positives: number of false positive miRNA hairpins predicted at this cut-off, as estimated by the miRDeep2 controls (see Friedlander et al., Nature Biotechnology, 2008). Mean and standard deviation is estimated from 100 rounds of permuted controls.
estimated true positives: the number of true positive miRNA hairpins is estimated as t = total novel miRNAs - false positive novel miRNAs. The
percentage of the predicted novel miRNAs that is estimated to be true positives is calculated as p = t / total novel miRNAs. The number of false positives is estimated from 100 rounds of permuted controls. In each of the 100 rounds, t and p are calculated, generating mean and standard deviation of t and p. The variable p can be used as an estimation of miRDeep2 positive predictive value at the score cut-off.
in species: number of reference mature miRNAs for that species given as input to miRDeep2.
in data: number of reference mature miRNAs for that species that map perfectly (full length, no mismatches) to one or more of precursor candidates that have been excised from the genome by miRDeep2.
detected by miRDeep2: number of reference mature miRNAs for that species that map perfectly (full length, no mismatches) to one or more of predicted miRNA hairpins that have a score equal to or exceeding the cut-off. The percentage of reference mature miRNAs in data that is detected by miRDeep2 is calculated as s = reference mature miRNAs detected / reference mature miRNAs in data. s can be used as an estimation of miRDeep2 sensitivity at the score cut-off.
estimated signal-to-noise: for the given score cut-off, the signal-to-noise ratio is estimated as r = total miRNA hairpins reported / mean estimated false positive miRNA hairpins over 100 rounds of permuted controls.
excision gearing: this is the minimum read stack height required for excising a potential miRNA precursor from the genome in this analysis.
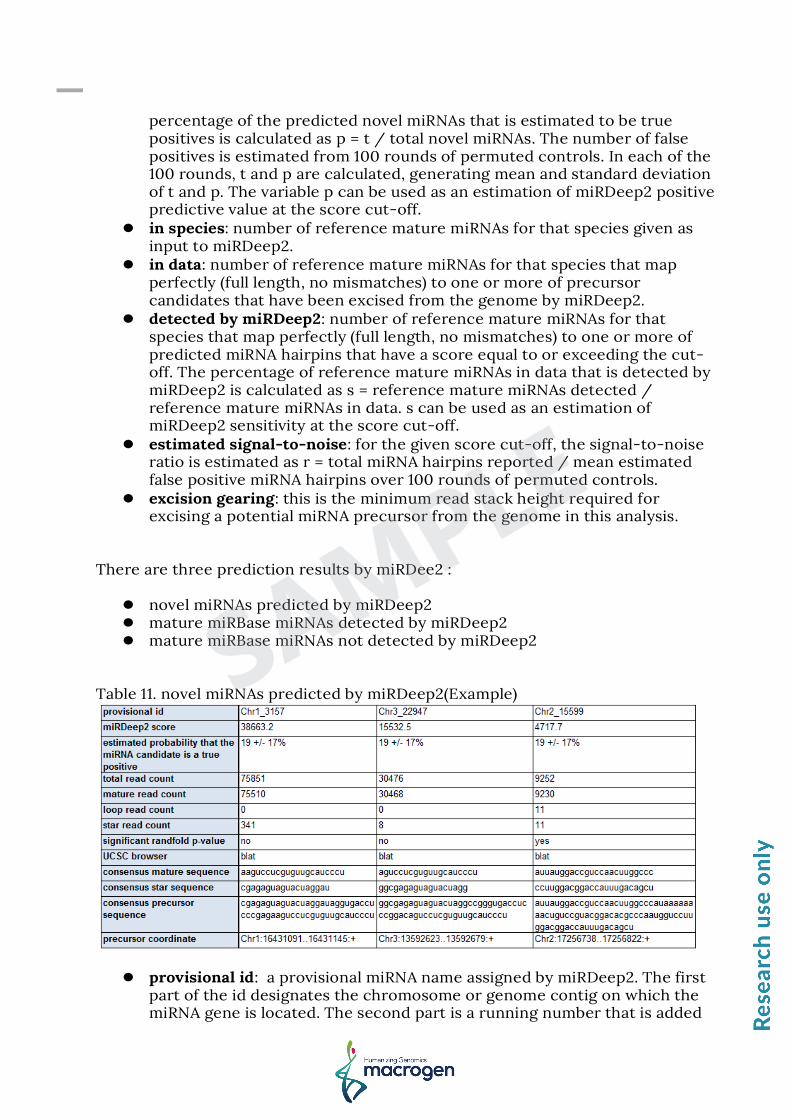
There are three prediction results by miRDee2 : novel miRNAs predicted by miRDeep2 mature miRBase miRNAs detected by miRDeep2 mature miRBase miRNAs not detected by miRDeep2
Table 11. novel miRNAs predicted by miRDeep2(Example)
provisional id: a provisional miRNA name assigned by miRDeep2. The first
part of the id designates the chromosome or genome contig on which the miRNA gene is located. The second part is a running number that is added

to avoid identical ids. The running number is incremented by one for each potential miRNA precursor that is excised from the genome. Clicking this field will display a pdf of the structure, read signature and score breakdown of the reported miRNA.
miRDeep2 score: the log-odds score assigned to the hairpin estimated probability that the miRNA candidate is a true positive: the
estimated probability that a predicted novel miRNA with a score of this or higher is a true positive. To see exactly how this probability is estimated, mouse over the \'novel miRNAs, true positives\' in the table at the top of the webpage.
total read count: the sum of read counts for the predicted mature, loop and star miRNAs.
mature read count: the number of reads that mapped to the predicted miRNA hairpin and are contained in the sequence covered by the predicted mature miRNA, including 2 nts upstream and 5 nts downstream.
loop read count: the number of reads that mapped to the predicted miRNA hairpin and are contained in the sequence covered by the predicted miRNA loop, including 2 nts upstream and 5 nts downstream.
star read count: the number of reads that mapped to the predicted miRNA hairpin and are contained in the sequence covered by the predicted star miRNA, including 2 nts upstream and 5 nts downstream.
significant randfold p-value: if the estimated randfold p-value of the excised potential miRNA hairpin is lower or equal to 0.05 (see Bonnet et al., Bioinformatics, 2004).
UCSC browser: if a species name was put into miRDeep2, then clicking this field will initiate a UCSC blat search of the consensus precursor sequence against the reference genome.
consensus mature sequence: the consensus mature miRNA sequence as inferred from the deep sequencing reads.
consensus star sequence: the consensus star miRNA sequence as inferred from the deep sequencing reads.
consensus precursor sequence: the consensus precursor miRNA sequence as inferred from the deep sequencing reads. Note that this is the inferred Drosha hairpin product, and therefore does not include substantial flanking genomic sequence as does most miRBase precursors.
precursor coordinate: The given precursor coordinates refer to absolute position in the mapped reference sequence.
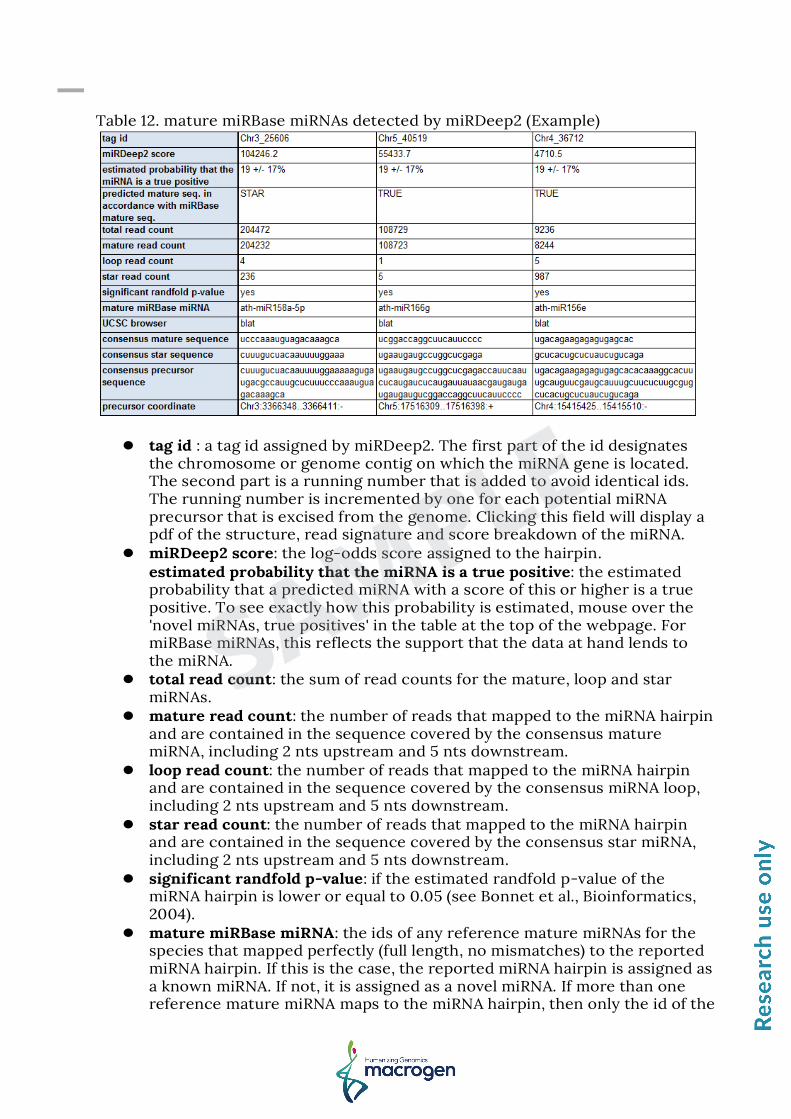
Table 12. mature miRBase miRNAs detected by miRDeep2 (Example)
tag id : a tag id assigned by miRDeep2. The first part of the id designates
the chromosome or genome contig on which the miRNA gene is located. The second part is a running number that is added to avoid identical ids. The running number is incremented by one for each potential miRNA precursor that is excised from the genome. Clicking this field will display a pdf of the structure, read signature and score breakdown of the miRNA.
miRDeep2 score: the log-odds score assigned to the hairpin. estimated probability that the miRNA is a true positive: the estimated probability that a predicted miRNA with a score of this or higher is a true positive. To see exactly how this probability is estimated, mouse over the 'novel miRNAs, true positives' in the table at the top of the webpage. For miRBase miRNAs, this reflects the support that the data at hand lends to the miRNA.
total read count: the sum of read counts for the mature, loop and star miRNAs.
mature read count: the number of reads that mapped to the miRNA hairpin and are contained in the sequence covered by the consensus mature miRNA, including 2 nts upstream and 5 nts downstream.
loop read count: the number of reads that mapped to the miRNA hairpin and are contained in the sequence covered by the consensus miRNA loop, including 2 nts upstream and 5 nts downstream.
star read count: the number of reads that mapped to the miRNA hairpin and are contained in the sequence covered by the consensus star miRNA, including 2 nts upstream and 5 nts downstream.
significant randfold p-value: if the estimated randfold p-value of the miRNA hairpin is lower or equal to 0.05 (see Bonnet et al., Bioinformatics, 2004).
mature miRBase miRNA: the ids of any reference mature miRNAs for the species that mapped perfectly (full length, no mismatches) to the reported miRNA hairpin. If this is the case, the reported miRNA hairpin is assigned as a known miRNA. If not, it is assigned as a novel miRNA. If more than one reference mature miRNA maps to the miRNA hairpin, then only the id of the

reference miRBase miRNA that matches the predicted mature sequence is output.
UCSC browser: if a species name was put into miRDeep2, then clicking this field will initiate a UCSC blat search of the consensus precursor sequence against the reference genome.
consensus mature sequence: the consensus mature miRNA sequence as inferred from the deep sequencing reads.
consensus star sequence: the consensus star miRNA sequence as inferred from the deep sequencing reads.
consensus precursor sequence: the consensus precursor miRNA sequence as inferred from the deep sequencing reads. Note that this is the inferred Drosha hairpin product, and therefore does not include substantial flanking genomic sequence as does most miRBase precursors.
precursor coordinate: The given precursor coordinates refer to absolute position in the mapped reference sequence

Table 13. mature miRBase miRNAs not detected by miRDeep2 (Example)
miRBase precursor id: Clicking this field will display a pdf of the structure
and read signature of the miRNA. total read count: the sum of read counts for the mature and star miRNAs. 5p read counts: the number of reads that mapped to the miRNA hairpin and
are contained in the sequence covered by the 5p sequence, including 2 nts upstream and 5 nts downstream. In parenthesis are normalized read counts shown.
3p read counts: the number of reads that mapped to the miRNA hairpin and are contained in the sequence covered by the 3p sequence, including 2 nts upstream and 5 nts downstream. In parenthesis are normalized read counts shown.
remaining reads: the number of reads that did not map to any of the mature and star sequences
miRBase 5p sequence(s): the 5p miRNA sequence(s) miRBase 3p sequence(s): the 3p miRNA sequence(s) miRBase precursor sequence: this is the precursor miRNA sequence
4.3 Classification by categories of smRNA
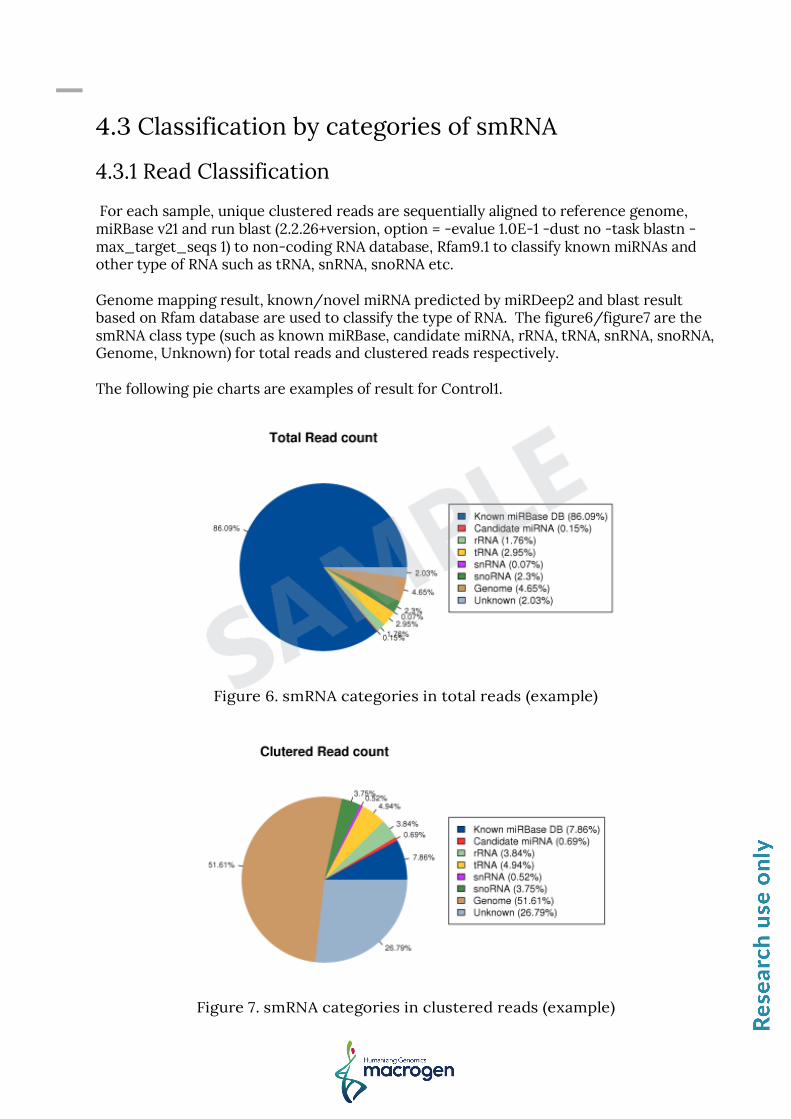
4.3.1 Read Classification For each sample, unique clustered reads are sequentially aligned to reference genome, miRBase v21 and run blast (2.2.26+version, option = -evalue 1.0E-1 -dust no -task blastn -max_target_seqs 1) to non-coding RNA database, Rfam9.1 to classify known miRNAs and other type of RNA such as tRNA, snRNA, snoRNA etc. Genome mapping result, known/novel miRNA predicted by miRDeep2 and blast result based on Rfam database are used to classify the type of RNA. The figure6/figure7 are the smRNA class type (such as known miRBase, candidate miRNA, rRNA, tRNA, snRNA, snoRNA, Genome, Unknown) for total reads and clustered reads respectively. The following pie charts are examples of result for Control1.
Figure 6. smRNA categories in total reads (example)
Figure 7. smRNA categories in clustered reads (example)

4.3.2 Alert Information for multiple aligned miRNA In case of reads assigned to known miRNA or novel candidate, miRNA are also aligned to Rfam database. These miRNAs are regarded as unreliable RNA type. We provide the alert information about the unreliable RNA type in the following table. . Table 14. Alert Information
miRNA : Known miRNA or Novel miRNA candidate category miRNA ID : miRBase ID or Novel miRNA ID Rfam alert : In case that predicted miRNAs are also aligned to non-coding
RNA database(Rfam), the column displays non coding RNA types assigned. Total count : the number of read count aligned to miRNA Alert count : the number of read count matched to non-coding RNA
sequence from Rfam
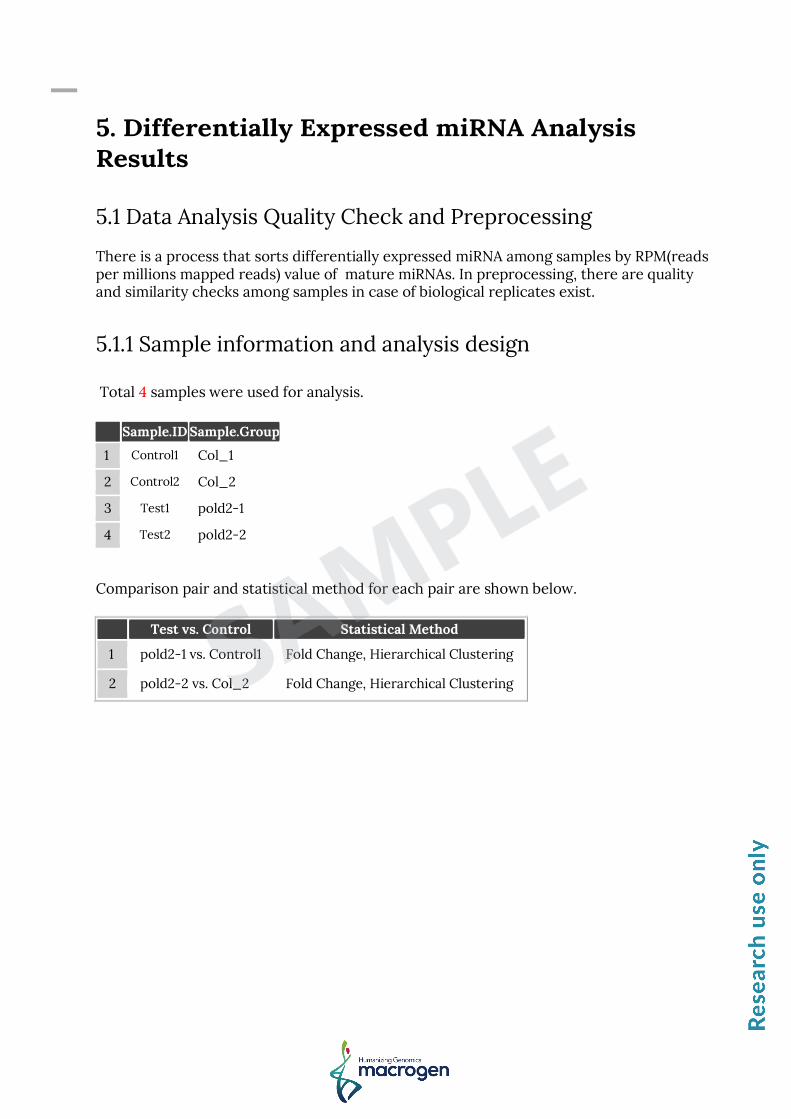
5. Differentially Expressed miRNA Analysis Results 5.1 Data Analysis Quality Check and Preprocessing There is a process that sorts differentially expressed miRNA among samples by RPM(reads per millions mapped reads) value of mature miRNAs. In preprocessing, there are quality and similarity checks among samples in case of biological replicates exist. 5.1.1 Sample information and analysis design Total 4 samples were used for analysis.
Sample.ID Sample.Group
1 Control1 Col_1
2 Control2 Col_2
3 Test1 pold2-1
4 Test2 pold2-2
Comparison pair and statistical method for each pair are shown below.
Test vs. Control Statistical Method
1 pold2-1 vs. Control1 Fold Change, Hierarchical Clustering
2 pold2-2 vs. Col_2 Fold Change, Hierarchical Clustering

5.1.2 Data Quality Check For each miRNA, 130 mature miRNAs with at least one zero RPMs are excluded leaving 297 mature miRNAs to be analyzed.
5.1.3 Data Transformation and Normalization To facilitate log2 transformation, 1 was added to the raw signal(RPM). This process is performed because raw signals are scattered along wide range and most signals are concentrated on the low signal value. The log transformation reduces the range of the signals and produces more even data distribution. In order to reduce systematic bias after log transformation, quantile normalization is used with preprocessCore R library.

5.1.3.1 Boxplot of miRNA expression difference between samples Below boxplots show the corresponding sample's expression distribution of raw signal RPM+1, log2 transformation and quantile normalization based on percentile(median, 50 percentile, 75 percentile, maximum and minimum). To facilitate log2 transformation, 1 was added to the raw signal(RPM).
5.1.3.2 Density plot of miRNA expression per sample Below density plots show the corresponding samples expression distribution before and after of raw signal(RPM)+1, log2 transformation, quantile normalization.

5.1.3.3 Correlation Analysis among samples The similarity between samples is obtained through Pearson's coefficient of the
log2(RPM+1) value. For range (-1 ≤ r ≤ 1), the closer the value is to 1, the more similar the samples are. Correlation matrix of all samples is as follows.

5.1.4 Hierarchical clustering Analysis Using each sample's log2(RPM+1) value, the high expression similarities were grouped together(Distance metric=Euclidean distance, Linkage method= Complete linkage).

5.1.5 Multidimensional Scaling Analysis Using each sample’s log2(RPM+1) value, the similarity between samples is graphically shown in a 2D plot to show the variability of the total data. This allows identification of any outlier samples, or similar expression patterns between sample groups.

5.2 Differentially Expressed miRNA Analysis Workflow Below shows the steps of DE miRNA (Differentially Expressed miRNAs) analysis. 1) the read counts of mature miRNA obtained from miRDeep2 Quantifier module are used as the original raw data. The read counts of each miRNA are then normalized to the total number of mapped miRNAs as RPM(Reads per millions mapped reads)to compare the abundance between samples. Raw data (Path: result_smRNA_excel >result_smRNA.xlsx>MatureBased_expression ) : 427 transcripts, 4 samples 2) During data preprocessing, low quality miRNAs are filtered. Afterwards, log2 transformation of RPM+1 and quantile normalization are performed. Processed data (Path: DE_miRNA_result > data2.xlsx) : 297 mature miRNAs, 4 samples 3) Statistical analysis is performed using Fold Change per comparison pair. The significant results are selected on conditions of |fc|≥2. (data3_*.xlsx contains significant transcripts which satisfies |fc|≥2 conditions in at least one of total comparison pairs.) Significant data (Path: DE_miRNA_result > data3_fc2.xlsx) : 55 mature miRNAs Significant data (Path: DE_miRNA_result > data3_pold2-1_vs_Control1_fc2.xlsx) : 36 mature miRNAs Significant data (Path: DE_miRNA_result > data3_pold2-2_vs_Col_2_fc2.xlsx) : 23 mature miRNAs 4) For significant miRNA list, hierarchical clustering analysis is performed to group the similar samples and miRNAs. These results are graphically depicted using heatmap and dendogram. - Hierarchical Clustering (Euclidean Distance, Complete Linkage) (Path: : DE_miRNA_result > Cluster image)

The following results are examples of pold2-1_vs_Control1 comparison pair. 5.3 Significant miRNA Results
5.3.1 Up, down regulated miRNA count by fold change The graph below shows the number of up and down regulated miRNAs based on fold change of comparison pair.
5.3.2 Up, down regulated count by fold change and p-value (in case of existing p-value) The graph below shows the number of up and down regulated miRNAs based on fold change and p-value of comparison pair.

5.3.3 Distribution of expression level between two groups. The graph below shows the distribution of Normalized Log2(RPM+1) of each group for comparison pair.
5.3.4 Scatter plot of expression level between two groups The graph below shows the expression levels between comparison pair as a scatter plot. X-axis is control and Y-axis is average normalized value of the group.
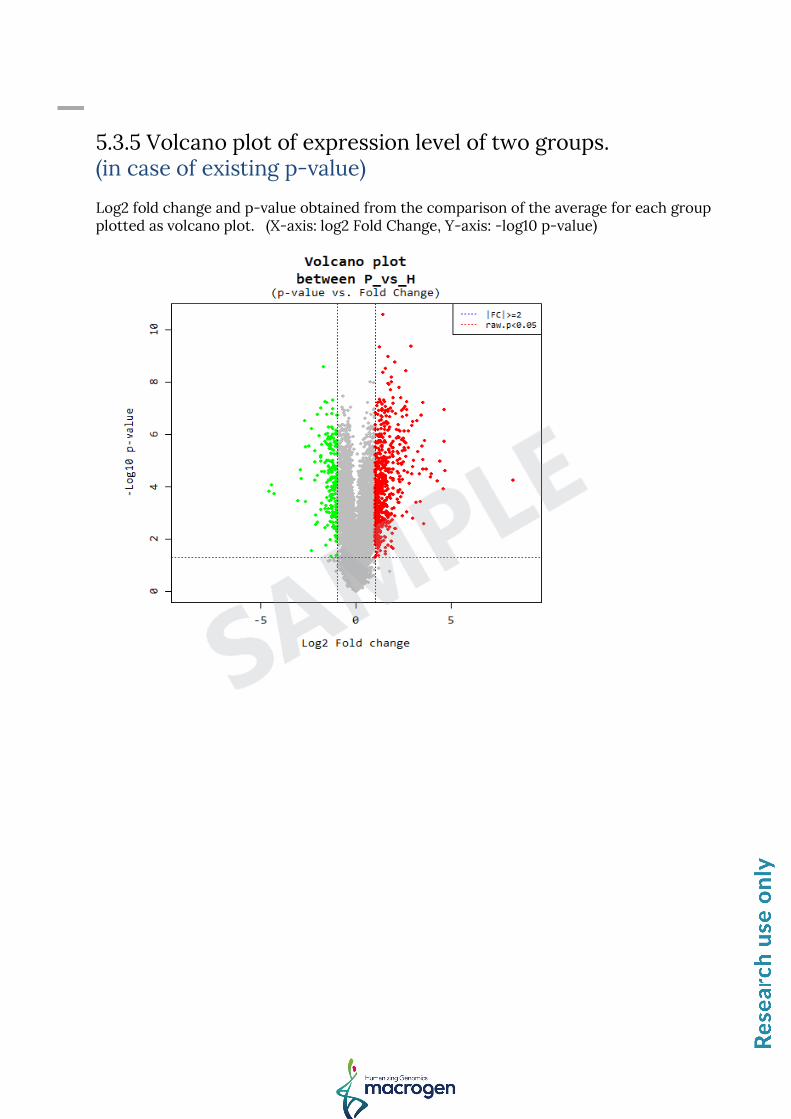
5.3.5 Volcano plot of expression level of two groups. (in case of existing p-value) Log2 fold change and p-value obtained from the comparison of the average for each group plotted as volcano plot. (X-axis: log2 Fold Change, Y-axis: -log10 p-value)

5.3.6 Volume plot of different genes depending on expression volume Expression volume is defined as the geometric mean of two group’s expression level. In order to confirm the miRNAs that show higher expression difference compared to the control according to expression volume, volume plot is drawn. (X-axis: volume, Y-axis: log2Fold Change). For example, even though fold change might be different by two-fold, the transcripts with higher volume may be more credible.
red dot : Top five transcripts by volume which satisfies, |fc| ≥ 2

5.3.7 Hierarchical Clustering Analysis ( Path: DE_miRNA_result > Cluster image) Heatmap shows result of hierarchical clustering analysis (Euclidean Method, Complete Linkage) which clusters the similarity of miRNAs and samples by expression level (normalized value) from significant DE miRNA list(data3).

6. Data Download Information
6.1. Raw Data
Download link File size md5sum
Control1_1.fastq.gz 3.3G 2cc774c7efd446d98d212242dbbc04f8
Control1_2.fastq.gz 3.2G e477c6dbb23c1c3127e451d62d5563f5
Control2_1.fastq.gz 3.5G 25a9419d8f107beabac8e5481693c4bb
Control2_2.fastq.gz 3.5G 7d770c082e2e3edb4ed2316746d1ce92
Test1_1.fastq.gz 3.3G 2cc774c7efd446d98d212242dbbc04f8
Test1_2.fastq.gz 3.2G e477c6dbb23c1c3127e451d62d5563f5
Test2_1.fastq.gz 3.5G 25a9419d8f107beabac8e5481693c4bb
Test2_2.fastq.gz 3.5G 7d770c082e2e3edb4ed2316746d1ce92
fastq.gz : This is a zip file of raw data used in analysis md5sum : In order to verify the integrity of files, md5sum is used. If the
values of md5sum are the same, there is no forgery, modification or omission.
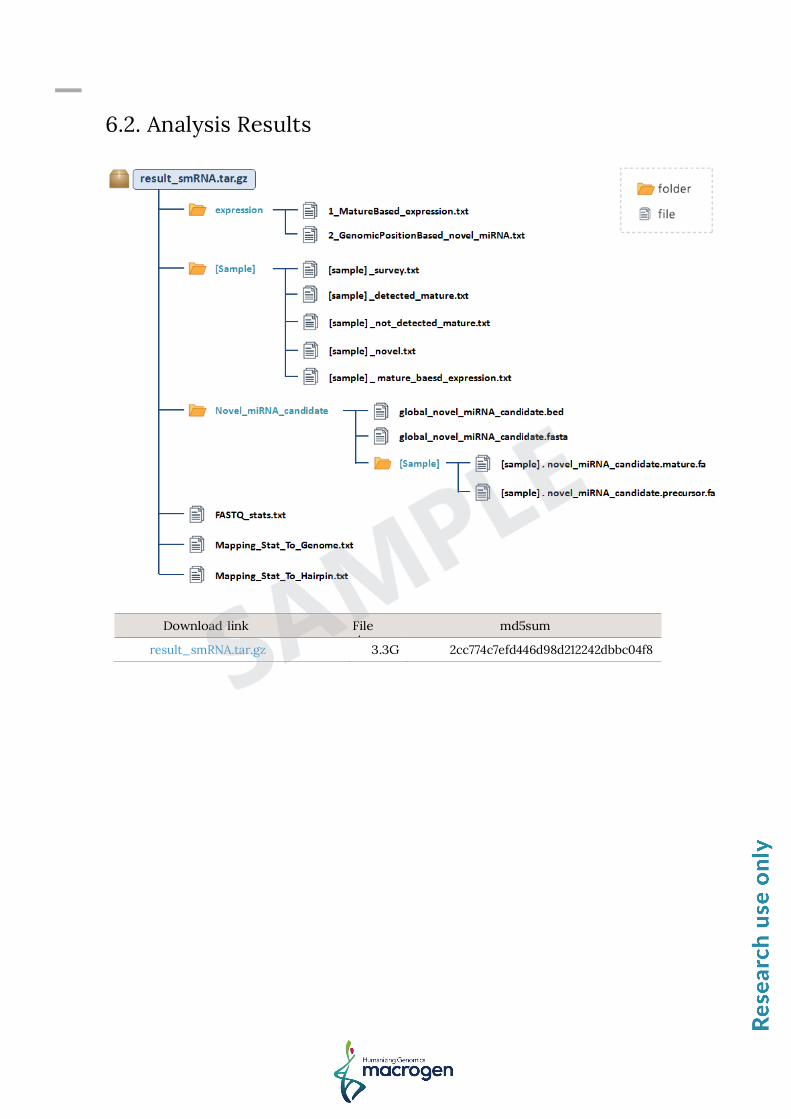
6.2. Analysis Results
Download link File size
md5sum
result_smRNA.tar.gz 3.3G 2cc774c7efd446d98d212242dbbc04f8
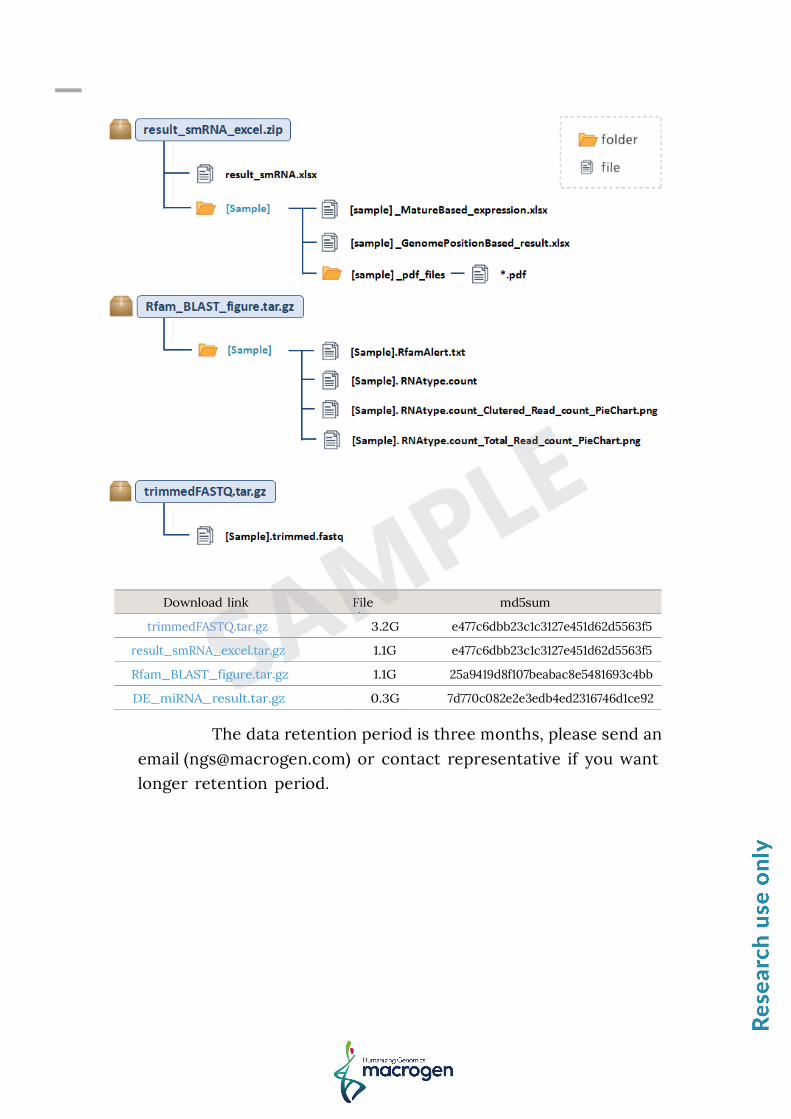
Download link File size
md5sum
trimmedFASTQ.tar.gz 3.2G e477c6dbb23c1c3127e451d62d5563f5
result_smRNA_excel.tar.gz 1.1G e477c6dbb23c1c3127e451d62d5563f5
Rfam_BLAST_figure.tar.gz 1.1G 25a9419d8f107beabac8e5481693c4bb
DE_miRNA_result.tar.gz 0.3G 7d770c082e2e3edb4ed2316746d1ce92
The data retention period is three months, please send an
email ([email protected]) or contact representative if you want longer retention period.

Appendix
1. FAQ
Q: I want to see the produced data. How can I open those files?
A: Large volume zip file that is provided by our compnay is not user-
friendly in Windows environment, so it is recommended to use linux
environment for smooth operation.
2. FASTQ File
Example of FASTQ
FASTQ file is composed of four lines.
Line 1 : ID line includes information such as flow cell lane information.
Line 2 : Sequences line.
Line 3 : Separator line (+ mark).
Line 4 : Quality values line about sequences.

3. Phred Quality Score Chart
Phred quality score numerically expresses the accuracy of each nucleotide.
Higher Q number signifies higher accuracy. For example, if Phred assigns a
quality score of 30 to a base, the chances of having base call error are 1 in 1000.
Phred Quality Score Q is calculated with -10log10P, where P is probability of erroneous base call.
Quality of phred score
Probability of incorrect base call
Base call accuracy Characters
10 1 in 10 90% !"#$%&'()*+
20 1 in 100 99% ,-./012345
30 1 in 1000 99.9% 6789:;h=i?
40 1 in 10000 99.99% @ABCDEFGHIJ
Encoding : Sanger Quality (ASCII Character Code=Phred Quality Value + 33)
4. Programs and databases used in Analysis
4. 1. FastQC v0.10.0 FastQC is a program that performs quality check on the raw sequences before analysis to make sure data integrity. The main function is importing BAM, SAM, FastQ files and providing quick overview on which section has problems. It provides such results as graphs and tables in html files.
4.2. Cutadapt (1.9.dev3) Cutadapt finds and removes adapter sequences, primers, poly-A tails and other types of unwanted sequence from your high-throughput sequencing reads.
-q: Try to trim low-quality ends from reads before adapter removal.
-g: Sequence of an adapter that was ligated to the 5' end.
-a: Sequence of an adapter that was ligated to the 3' end.
-O: Minimum overlap length.
--max-n: The max proportion of N's allowed in a read.
-m: Discard trimmed reads that are shorter than LENGTH.
-n: Try to remove adapters at most COUNT times.
4.3. miRDeep2 (2.0.0.7), Bowtie (1.1.1) miRDeep2 is a completely overhauled tool which discovers microRNA genes by analyzing sequenced RNAs. The tool reports known and hundreds of novel microRNAs with high accuracy in seven species representing the major animal clades. The low consumption of time and memory combined with user-friendly interactive graphic output makes miRDeep2 accessible for straightforward application in current reasearch.
4.4. miRBase (release 21) The miRBase database is a searchable database of published miRNA sequences and annotation. Each entry in the miRBase Sequence database represents a predicted hairpin portion of a miRNA transcript (termed mir in the database), with information on the location and sequence of the mature miRNA sequence (termed miR). Both hairpin and mature sequences are available for searching and browsing, and entries can also be retrieved by name, keyword, references and annotation.
4.5. Rfam (v9.1) The Rfam database is a collection of RNA families, each represented by multiple sequence alignments, consensus secondary structures and covariance models (CMs). Rfam makes use of a large amount of publicly available data, especially published multiple sequence alignments and secondary structures, and repackages these data in a single searchable and sustainable resource.

Reference
1. Martin, M. (2011). Cutadapt removes adapter sequences from high-throughput sequencing reads. EMBnet. journal, 17(1), pp-10.
2. Friedlander, M. R., Chen, W., Adamidi, C., Maaskola, J., Einspanier, R., Knespel, S., & Rajewsky, N. (2008). Discovering microRNAs from deep sequencing data using miRDeep. Nature biotechnology, 26(4), 407-415.
3. Kozomara, A., & Griffiths-Jones, S. (2013). miRBase: annotating high confidence microRNAs using deep sequencing data. Nucleic acids research, gkt1181.
4. Gardner, P. P., Daub, J., Tate, J. G., Nawrocki, E. P., Kolbe, D. L., Lindgreen, S., ... & Bateman, A. (2009). Rfam: updates to the RNA families database. Nucleic acids research, 37(suppl 1), D136-D140.
5. Langmead, B., Trapnell, C., Pop, M., & Salzberg, S. L. (2009). Ultrafast and memory-efficient alignment of short DNA sequences to the human genome. Genome biol, 10(3), R25.
6. Quinlan, A. R., & Hall, I. M. (2010). BEDTools: a flexible suite of utilities for comparing genomic features. Bioinformatics, 26(6), 841-842.
7. Li, H., Handsaker, B., Wysoker, A., Fennell, T., Ruan, J., Homer, N., ... & Durbin, R. (2009). The sequence alignment/map format and SAMtools. Bioinformatics, 25(16), 2078-2079.
