arbitrage in the foreign exchange market: turning on the...
TRANSCRIPT
Arbitrage in the Foreign Exchange Market:
Turning on the Microscope∗
Q. Farooq Akrama, Dagfinn Rimea and Lucio Sarnoa,b
a: Norges Bankb: University of Warwick and CEPR
This version: August 15, 2005
Abstract
This paper investigates the presence and characteristics of arbitrage opportunitiesin the foreign exchange market using a unique data set for three major capital andforeign exchange markets that covers a period of more than seven months at tickfrequency, obtained from Reuters on special order. We provide evidence on the fre-quency, size and duration of round-trip and one-way arbitrage opportunities in realtime. The analysis unveils the existence of numerous short-lived arbitrage oppor-tunities, whose size is economically significant across exchange rates and comparableacross different maturities of the instruments involved in arbitrage. The duration ofarbitrage opportunities is, on average, high enough to allow agents to exploit devia-tions from the law of one price, but low enough to explain why such opportunitieshave gone undetected in much previous research using data at lower frequency.
JEL classification: F31; F41; G14; G15.Keywords: exchange rates; arbitrage; foreign exchange microstructure.
∗Acknowledgments: This work was partly undertaken when Lucio Sarno was a Visiting Scholar atNorges Bank. The authors are grateful to a number of people who kindly offered constructive commentsat various stages of this paper, including Magnus Dahlquist, Martin Evans, Rich Lyons, Michael Melvin,Michael Moore, Carol Osler, Mark Salmon, Mark Taylor, in addition to participants in presentations atthe Stockholm Institute for Financial Research; the University of Oslo; Norges Bank; the 2005 ForeignExchange Microstructure Conference, Aix-en-Provence; the 2005 High-Frequency Econometrics and Mi-crostructure Workshop, University of Warwick. The authors also thank several foreign exchange tradersand colleagues in the Market Operations Department of Norges Bank for insightful conversations, espe-cially Jan Engebretsen. The authors alone are responsible for the views expressed in the paper and forany errors that may remain.
1

1 Introduction
Arbitrage is one of the fundamental pillars of financial economics. It seems to be generally
accepted that financial markets do not offer riskfree arbitrage opportunities, at least when
allowance is made for transaction costs. This notion is directly related to the law of
one price, which postulates that in well-functioning, efficient financial markets identical
securities must have the same price, no matter how they are created. For example, if a
derivative instrument can be created using two different sets of underlying securities, then
the total price for each would be the same or else an arbitrage opportunity would exist.
Arbitrage is the mechanism that should ensure the validity of the law of one price.
While the assumption of no arbitrage is likely to be reasonably mild or valid in several
contexts in finance, violations of the law of one price can be rationalized on several grounds.
In general terms, the absence of arbitrage opportunities gives rise to the so-called ‘arbitrage
paradox,’ first pointed out by Grossman and Stiglitz (1976, 1980). That is, if arbitrage
is never observed, market participants may not have sufficient incentives to watch the
market, in which case arbitrage opportunities could arise. A possible resolution to this
paradox is for very short-term arbitrage opportunities to arise, inviting traders to exploit
them, and hence be quickly eliminated. Also, microstructure theory shows how price
differences may occur for identical assets in markets that are less than fully centralized or
with imperfect degree of transparency (O’Hara, 1995; Lyons, 2001).1
Empirical studies have, however, been unable to detect short-term arbitrage opportu-
nities in a variety of financial markets. Given the high activity level in major financial
markets, such short-term arbitrage opportunities can only be adequately studied using
real-time quotations on all asset prices involved, which are notoriously difficult to obtain.
Furthermore, one must take into account all relevant aspects of the microstructure of the
market in order to capture the opportunities and transaction costs that market partici-
pants face. Yet, if present, the existence and properties of riskless arbitrage opportunities
are of great interest to both academics and participants in financial markets, given the
central role of no-arbitrage conditions in the theory and practice of financial economics.
The prime motivation of this paper is to investigate empirically the existence of ar-
bitrage and the properties of potential departures from no-arbitrage conditions using a
microstructure perspective. Specifically, we choose to study the foreign exchange (FX)
1See also the theories related to limits to arbitrage and speculation (Shleifer and Vishny, 1997; Lyons,2001).
2
market, where no-arbitrage conditions are well known and relatively easy to test. In
currency markets net returns on similar interest-bearing domestic and foreign assets are
believed to be equal when exchange rate risk is hedged through forward contracts, imply-
ing that it is neither profitable to earn nor save money by exploiting differences in lending
or borrowing rates across domestic and foreign security markets while avoiding exchange
rate risk through forward or swap contracts—this condition is termed covered interest rate
parity. Another form of arbitrage which has received less attention by the relevant liter-
ature is the related concept of one-way arbitrage—in the form of both owner arbitrage and
borrower arbitrage. These are violations of the law of one price in the sense that they
represent violations of the condition that the domestic interest rate should be the same as
the foreign interest rate when the latter is adjusted to fully hedge for exchange rate risk.
A key advantage of this study relative to all previous empirical analyses of arbitrage
is our data set. A rigorous empirical examination of no-arbitrage conditions in the FX
market requires high-frequency, contemporaneous, tradable (firm) quotes of comparable
domestic and foreign interest rates and spot and forward exchange rates. This require-
ment is necessary in order to establish whether an apparent deviation from no-arbitrage
conditions actually represented a profitable opportunity to agents at a given time or not.
Moreover, the high level of activity in FX and international capital markets demands use
of high-frequency, real-time quotes to characterize the properties of arbitrage opportuni-
ties, especially their duration. Finally, it is equally important to have a sufficiently long
sample to generate robust results. Our data set is the first data set in this literature that
possesses these characteristics.
Empirical studies of arbitrage in the FX market so far have not employed data sets that
meet the above-noted strict requirements, mainly because such data sets have been unavail-
able to researchers. This literature suggests that arbitrage opportunities do not generally
arise in the FX market and mispricing is unimportant when one accounts for estimated
transactions costs.2 On the other hand, the growing literature on high-frequency exchange
rate behavior and FX market microstructure has not—to the best of our knowledge—studied
arbitrage, focusing instead on a variety of other issues relating to international currency
patterns, trading behavior, and the role of order flow in explaining exchange rate move-
ments (e.g. Lyons, 1995, 2001; Osler, 2000, 2003, 2005; Covrig and Melvin, 2002; Evans,
2Studies of FX arbitrage—primarily based on tests of covered interest parity—include Branson (1969),Frenkel (1973), Frenkel and Levich, (1975, 1977), Callier (1981), Taylor (1987, 1989), Rhee and Chang(1992), Fletcher and Taylor (1993), Aliber, Chowdhry and Yan (2003), Juhl, Miles and Weidenmier (2005).
3

2002; Evans and Lyons, 2002a,b, 2005; Payne, 2003; Bjønnes and Rime, 2005; Lyons and
Moore, 2005).
Use of real time quotations can also shed light on the validity of another proposed res-
olution of the arbitrage paradox, which is the anecdote that providers of interest rate and
exchange rate quotes set their quotes such that they knowingly do not offer counterparts
riskless profit opportunities—i.e. prices that violate the law of one price. For example, if
quotes are always set such that no-arbitrage conditions are ensured conditional on the lat-
est quotes of other instruments, these conditions will hold continuously without requiring
trade to actually take place. Accordingly, presence of profitable arbitrage opportunities
in real time would point towards possible inefficiencies in information gathering, profit
maximization and or other constraints on parts of quote-providers.
Our data set includes contemporaneous tick quotes of exchange rates and interest rates
that pertain to the most liquid segments of the FX and capital markets. The sample
includes tradable ask and bid quotes for three major US dollar exchange rates: Euro, UK
sterling and Japanese yen. It also includes ask and bid quotes for exchange rate swaps
and for interest rates on deposits in quoting and base currencies. The tick quotes cover a
period of more than seven months spanning from 12 February to 30 September 2004, and
is the longest and highest-frequency data set ever used for examining FX arbitrage. The
data has been collected through Reuters dealing system on special order.
To anticipate our key results, we find evidence of numerous short-lived arbitrage oppor-
tunities, especially in the form of one-way arbitrage. The size of arbitrage opportunities is
economically significant across exchange rates and comparable across different maturities
of the instruments involved in arbitrage. The duration of arbitrage opportunities is, on
average, high enough to allow agents to exploit deviations from the law of one price, but
low enough to explain why such opportunities have gone undetected in much previous
research using data at lower frequency. We find little evidence in favor of the view that
prices for spot and forward rates and for money market instruments are set directly from
the formulas of no-arbitrage conditions in real time. Finally, we examine whether and
to what extent frequency, size and duration of apparent arbitrage opportunities vary with
the pace of markets.
The paper is organized as follows. Section 2 presents the concepts of round-trip
and one-way arbitrage in the FX market. This section also describes the relationships
between these various forms of arbitrage. Section 3 briefly discusses quoting conventions,
4

transaction costs and their implications for calculations of gains and losses from arbitrage
of the different forms. In addition, this section describes our data set and notes some
basic properties of interest rates and exchange rate quotes. Section 4 presents our main
empirical findings, relating to frequency, size and durations of returns from arbitrage
opportunities. Section 5 reports the results from a sensitivity analysis of the core results;
and an analysis of whether and how characteristics of profitable arbitrage opportunities
vary with market pace. Section 6 briefly summarizes the main conclusions. Finally the
appendix presents further details on quoting conventions, calculations of days to maturity
and transaction costs for different exchange rates and traded volumes.
2 Riskless Arbitrage in the FX Market
2.1 Round-trip, Covered Arbitrage
Covered interest parity (CIP) postulates that it is not possible to earn positive returns
by borrowing domestic assets for lending abroad (or vice versa) while covering the ex-
change rate risk through a forward contract of equal maturity. Domestic and foreign
interest bearing assets can be considered similar if they are of equal maturity and share
the same characteristics, such as liquidity and political and default risk. Commonly, CIP
is expressed as
(1 + id) =1
S(1 + if )F, (1)
where id and if denote domestic and foreign interest rates on similar assets, respectively;
S is the spot nominal exchange rate; and F is the forward exchange rate of maturity equal
to that of the interest bearing assets. The spot exchange rate is expressed in units of
domestic currency per unit of foreign currency.
The common expression of CIP in equation (1) neglects transaction costs, however.
Such costs may be largely captured by market quotes of interest rates and exchange
rates which are expressed in terms of ask and bid quotes. The spread between ask and
bid rates/quotes for an asset is assumed to take into account inventory, information and
processing costs associated with the trading of the asset (see e.g. O’Hara, 1995).3
3 In addition, fixed settlement costs may be incurred to settle and implement a trade. Also, theinitiator of a trade may need to pay brokerage fees if a transaction is conducted through a broker. Thebrokerage fee often depends on the maturity of the asset and the total volume traded by a dealer in amonth. However, brokerage and settlement costs are often paid at the end of a month and are thereforegenerally neglected by a trader when conducting a single trade. This is particularly because a single tradeis typically of a relatively large size, say at least of 10 million US dollars, by formal or informal marketconventions. Hence, brokerage and settlement costs per unit of currency traded become miniscule, about
5
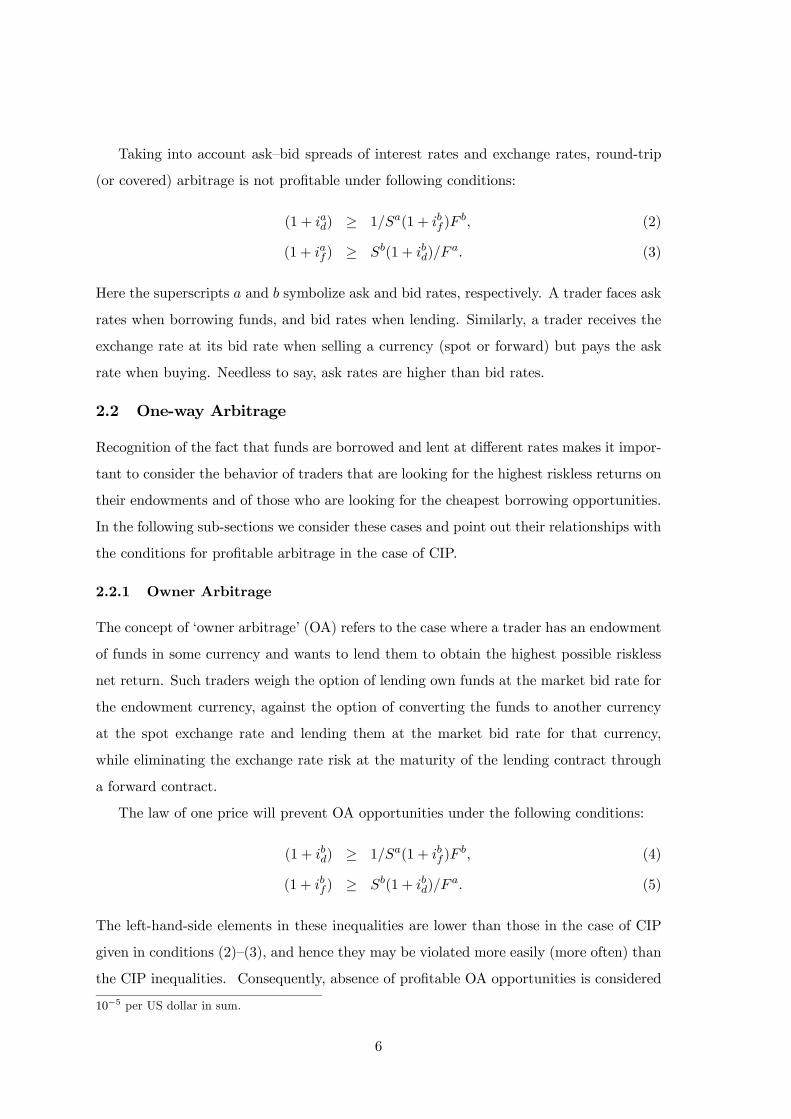
Taking into account ask—bid spreads of interest rates and exchange rates, round-trip
(or covered) arbitrage is not profitable under following conditions:
(1 + iad) ≥ 1/Sa(1 + ibf )Fb, (2)
(1 + iaf ) ≥ Sb(1 + ibd)/Fa. (3)
Here the superscripts a and b symbolize ask and bid rates, respectively. A trader faces ask
rates when borrowing funds, and bid rates when lending. Similarly, a trader receives the
exchange rate at its bid rate when selling a currency (spot or forward) but pays the ask
rate when buying. Needless to say, ask rates are higher than bid rates.
2.2 One-way Arbitrage
Recognition of the fact that funds are borrowed and lent at different rates makes it impor-
tant to consider the behavior of traders that are looking for the highest riskless returns on
their endowments and of those who are looking for the cheapest borrowing opportunities.
In the following sub-sections we consider these cases and point out their relationships with
the conditions for profitable arbitrage in the case of CIP.
2.2.1 Owner Arbitrage
The concept of ‘owner arbitrage’ (OA) refers to the case where a trader has an endowment
of funds in some currency and wants to lend them to obtain the highest possible riskless
net return. Such traders weigh the option of lending own funds at the market bid rate for
the endowment currency, against the option of converting the funds to another currency
at the spot exchange rate and lending them at the market bid rate for that currency,
while eliminating the exchange rate risk at the maturity of the lending contract through
a forward contract.
The law of one price will prevent OA opportunities under the following conditions:
(1 + ibd) ≥ 1/Sa(1 + ibf )Fb, (4)
(1 + ibf ) ≥ Sb(1 + ibd)/Fa. (5)
The left-hand-side elements in these inequalities are lower than those in the case of CIP
given in conditions (2)—(3), and hence they may be violated more easily (more often) than
the CIP inequalities. Consequently, absence of profitable OA opportunities is considered
10−5 per US dollar in sum.
6

a stronger indication and test of market efficiency than absence of profitable covered
arbitrage opportunities.4,5
Intuitively, the relation between CIP and OA is clear. One is more likely to gain from
moving own funds between currency markets than borrowed funds. Thus, if it pays to
move borrowed funds from one currency market to another (while covering the exchange
rate risk), it will certainly pay to do so with own funds. Moreover, if one cannot earn
a positive return by lending own funds in another currency market, one can rule out a
positive return by lending borrowed funds in the other currency market.
2.2.2 Borrower Arbitrage
The concept of ‘borrower arbitrage’ (BA) refers to the case where a trader is searching
for the cheapest way to finance an investment. Such traders face the option of borrowing
funds in the desired currency directly, or to borrow funds in another currency and convert
them to the desired currency at the spot exchange rate, while eliminating the exchange rate
risk at the maturity of the borrowing contract through a forward contract. In this case,
funding costs avoided by choosing the relatively cheaper borrowing opportunity essentially
represents riskfree net return.
The law of one price will prevent BA opportunities under the following conditions:
(1 + iad) ≤ 1/Sb(1 + iaf )Fa, (6)
(1 + iaf ) ≤ Sa(1 + iad)/Fb. (7)
The first inequality is relevant when the funds are required in domestic currency while the
second one becomes relevant when funds are required in the foreign currency.6
4Alternatively, one may be interested in measuring the riskless net return in another currency thanthe endowment currency. In that case, if the endowment is in the domestic currency, one would weighthe option of lending it in the domestic market and convert the resulting amount at maturity to foreigncurrency at the forward exchange rate, against the option of converting the endowment right away to theforeign currency at the spot exchange rate and lending the resulting amount in the foreign capital market.In this case, if the domestic currency is the quoting currency, one would face the forward exchange rateat the ask in the first option, and the spot exchange rate at the ask in the second option. However, ifthe domestic currency was the base currency, one would be facing the bid side of both the forward andthe spot exchange rates. We do not consider these alternatives in the empirical work below because theyare less stringent tests of arbitrage (since these variants require more transactions) and because we do nothave data on market outright forward rates.
5 It also follows that profitable arbitrage in the case of CIP implies profitable OA while the conversemay not be true—i.e. violation of conditions (2) and (3) is a sufficient but not a necessary condition forthe violation of conditions (4) and (5) respectively. Moreover, if OA is not profitable, neither will CIParbitrage be profitable while the opposite may not be the case—i.e. validity of conditions (4) and (5) is asufficient but not a necessary condition for the validity of conditions (2) and (3) respectively. In Table 1(Panels I-II), we show the relationship between CIP and OA.
6Here we implicitly assume that revenues used to serve the borrowing costs incur in the same currency
7
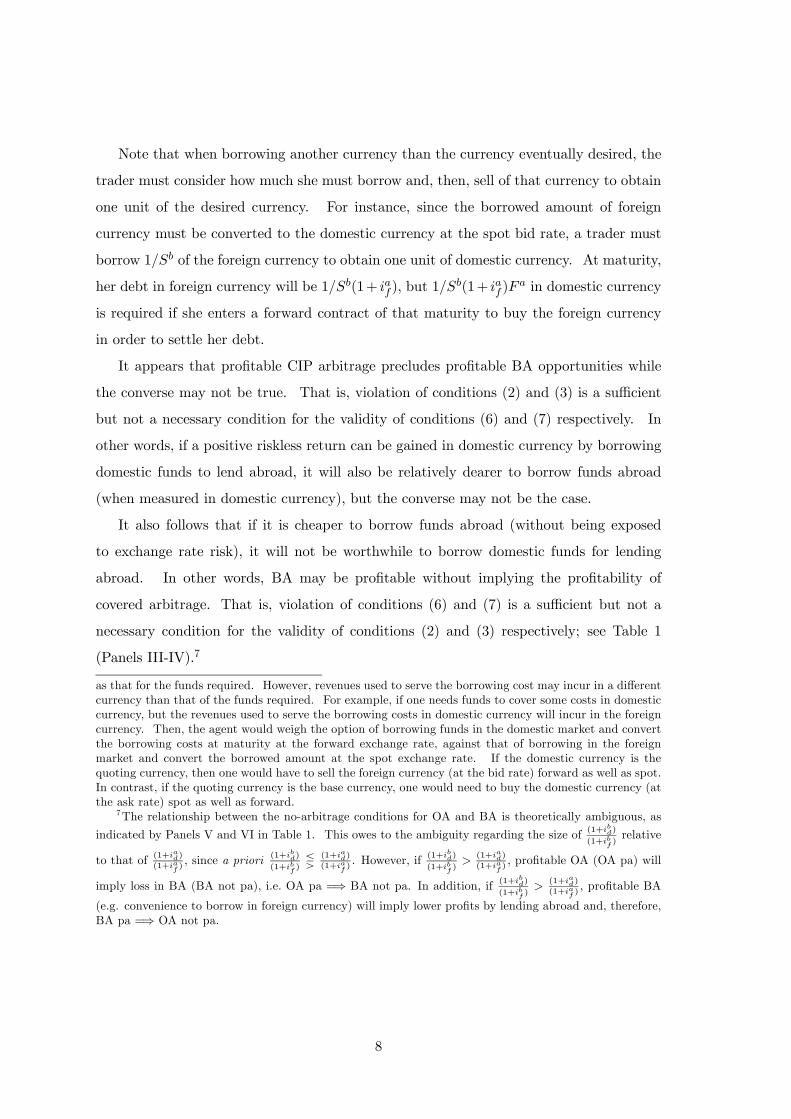
Note that when borrowing another currency than the currency eventually desired, the
trader must consider how much she must borrow and, then, sell of that currency to obtain
one unit of the desired currency. For instance, since the borrowed amount of foreign
currency must be converted to the domestic currency at the spot bid rate, a trader must
borrow 1/Sb of the foreign currency to obtain one unit of domestic currency. At maturity,
her debt in foreign currency will be 1/Sb(1+ iaf ), but 1/Sb(1+ iaf )F
a in domestic currency
is required if she enters a forward contract of that maturity to buy the foreign currency
in order to settle her debt.
It appears that profitable CIP arbitrage precludes profitable BA opportunities while
the converse may not be true. That is, violation of conditions (2) and (3) is a sufficient
but not a necessary condition for the validity of conditions (6) and (7) respectively. In
other words, if a positive riskless return can be gained in domestic currency by borrowing
domestic funds to lend abroad, it will also be relatively dearer to borrow funds abroad
(when measured in domestic currency), but the converse may not be the case.
It also follows that if it is cheaper to borrow funds abroad (without being exposed
to exchange rate risk), it will not be worthwhile to borrow domestic funds for lending
abroad. In other words, BA may be profitable without implying the profitability of
covered arbitrage. That is, violation of conditions (6) and (7) is a sufficient but not a
necessary condition for the validity of conditions (2) and (3) respectively; see Table 1
(Panels III-IV).7
as that for the funds required. However, revenues used to serve the borrowing cost may incur in a differentcurrency than that of the funds required. For example, if one needs funds to cover some costs in domesticcurrency, but the revenues used to serve the borrowing costs in domestic currency will incur in the foreigncurrency. Then, the agent would weigh the option of borrowing funds in the domestic market and convertthe borrowing costs at maturity at the forward exchange rate, against that of borrowing in the foreignmarket and convert the borrowed amount at the spot exchange rate. If the domestic currency is thequoting currency, then one would have to sell the foreign currency (at the bid rate) forward as well as spot.In contrast, if the quoting currency is the base currency, one would need to buy the domestic currency (atthe ask rate) spot as well as forward.
7The relationship between the no-arbitrage conditions for OA and BA is theoretically ambiguous, as
indicated by Panels V and VI in Table 1. This owes to the ambiguity regarding the size of (1+ibd)
(1+ibf)relative
to that of (1+iad)
(1+iaf), since a priori (1+ibd)
(1+ibf)Q (1+iad)
(1+iaf). However, if (1+ibd)
(1+ibf)>
(1+iad)
(1+iaf), profitable OA (OA pa) will
imply loss in BA (BA not pa), i.e. OA pa =⇒ BA not pa. In addition, if (1+ibd)
(1+ibf)>
(1+iad)
(1+iaf), profitable BA
(e.g. convenience to borrow in foreign currency) will imply lower profits by lending abroad and, therefore,BA pa =⇒ OA not pa.
8
3 Data Issues and the Calculations of Returns from Arbi-trage
We obtained data from the Reuters dealing system, which embeds general market quoting
and maturity conventions. In this section, we present precise formulas for calculating
deviations from the different no-arbitrage conditions in light of these conventions as well
as transaction costs that a trader would typically face when dealing through this system.
Appendix A provides a detailed account of quoting conventions, calculations of days to
maturity and transaction costs for different exchange rates and traded volumes.
3.1 Formulas Used for the Calculations
In Reuters dealing system traders trade swaps rather than (outright) forwards and, in
particular, they act on so-called swap points. Swap points express a multiple of the
difference between forward and spot exchange rates. By convention, all of the exchange
rates are quoted with 4 decimals, except for the Japanese yen, where 2 decimals are used.
Swap points are therefore obtained by multiplying the difference between forward and spot
exchange rates by 104 in general, and by 102 in the case of the Japanese yen.
We investigate potential returns from arbitrage by comparing the swap points quoted
through Reuters with corresponding derived (or theoretical) swap points. The derived
points can be obtained by rewriting the formulas presented above, (2)—(7), while taking
into account relevant quoting and maturity conventions. For example, the deviation from
the CIP condition (2) can be expressed as:
(F b − Sa)−Sa(iad × D
360 − ibf × D360)
(100 + ibf × D360)
× 104, (8)
where the first term denotes market swap-points for a given maturity obtained from
Reuters, while the second term represents the corresponding derived swap-points. Table
2 presents derived deviations for all of the no-arbitrage conditions pertaining to CIP, OA
and BA.
In order to calculate derived swap points that are directly comparable to swap points
quoted by Reuters, we adjust the interest rates, which are quoted in percent per annum,
so to obtain interest rates for maturities less than a year. Here D denotes the number
of days to maturity of swap and deposit contracts. It is calculated as the actual number
of business days between the (spot) value date and the maturity date of a contract while
9

taking into account bank holidays in the home countries of currencies and securities, and
other conventions—see Appendix A for details. In general, the total number of days to
maturity in a year are 360. For sterling contracts, however, the total number of days in
a year are set to 365 in line with market conventions. Finally, the resulting term must
be multiplied by 104 (or 102 in the case of the Japanese yen) to obtain the derived swap
points. Deviations from a no-arbitrage condition, e.g. (8), are expressed in pips since
they are defined as the difference between quoted and derived swap points.
In our empirical analysis, we treat the quoting currency as the domestic currency (d)
and the base currency as the foreign currency (f), for convenience. Table 3 denotes
explicitly the quoting and base currencies for the three exchange rates examined. Interest
rates with subscripts d and f refer to interest rates on securities in the quoting and base
currencies outlined in the table.
In actual calculations of returns from arbitrage, we deduct 1/10 of a pip (10−5) from
the expressions for returns presented in Table 2 to obtain returns less brokerage and
settlement costs. Appendix A.2 shows that the sum of brokerage and settlement costs
are at most 1/10 of a pip per US dollar for a trade of required size.8 Thus, the number
and size of profitable returns obtained by us are likely to represent lower bounds on the
number of profitable returns through arbitrage.
3.2 Data
We employ tick data collected via a continuous feed from Reuters over the period February
13—September 30, 2004. The data set allows us to investigate both round-trip as well as
one-way arbitrage for three major exchange rates at four different maturities: 1, 3, 6 and
12 months. The data set includes ask and bid spot exchange rates for the three major
exchange rates: USD/Euro, USD/GBP and JPY/USD—hereafter EUR, GBP and JPY,
respectively. It also includes ask and bid quotes for the exchange rate swaps for the four
maturities as well as for euro-currency deposits for the four currencies involved.
For the spot exchange rates we have firm, transaction quotes from Reuters electronic
brokerage system (D3000-2). For the other instruments, only indicative ask and bid
quotes were available to us. In light of evidence for spot exchange rates in Danielsson
and Payne (2002), and conversations with users of the Reuters dealing system, spreads
8 Ideally, we should have converted 1/10 of a pip in US dollars to each of the quoting and base currenciesat the appropriate exchange rate at the end of each month—see Appendix A.2. On the other hand, we areprobably deducting more than the average cost for each trade.
10
between indicative ask and bid quotes for swaps as well as for interest rates may be
considered wider than those for corresponding firm ask and bid quotes. It seems to be
a common perception that the difference between indicative quotes and firm quotes is
smaller for swaps and interest rates than for spot rates.9 Importantly, it can be shown
that use of indicative quotes, with relatively wider ask-bid spreads than those of firm
quotes, would not lead us to exaggerate the number and size of arbitrage violations.10
In general, ask and bid quotes for an instrument (say a spot exchange rate) do not ap-
pear contemporaneously with those for other instruments (e.g. euro-currency deposits
for the currencies involved). In order to obtain continuous series of contemporane-
ous/synchronized (to the second) ask and bid quotes for different instruments, we merged
all instruments according to date and time to the second into a file and then filled in miss-
ing ask and bid quotes for an instrument by using the latest quotes for that instrument.
In order to severely limit the number of stale quotes, we excluded weekends and days with
unusually low or no trading activity (either due to a holiday or failure of the feed), which
left us with quotes for 151 trading days.11 In addition, we ignored quotes from hours with
little trading and thus included only quotes that appear during 07:00—18:00 GMT on the
included days. Despite ignoring numerous observations to ensure calculations of arbitrage
opportunities with as many fresh quotes as possible, we are still able to investigate a large
number of data points; over 2 million in the case of EUR and GBP.
9 Indicative spot quotes may at times be quite different from firm interbank quotes because the formerquotes may be used for marketing purposes to non-bank customers. The interbank market has othersources for obtaining information on spot quotes, e.g. electronic broker screens. For swaps and deposits,however, indicative quotes are regarded as a reliable information source in the market since few alternativeinformation sources are present. It is therefore reasonable to expect that the indicative quotes are closerto firm quotes in the latter cases than in the case of spot quotes.
10This can be seen by taking the derivative of, e.g., a deviation from CIP (dev_cip) with respect todeviations from firm quotes for an instrument, say k. Consider, as a representative example, the formulafor a CIP deviation on the bid side, adjusted to allow for indicative quotes to deviate from firm quotes byan amount (x):
dev_cipb = (F b − Sa)− xSwap − Saiad + xid − ibf − xif ×D × 104
36000 + ibf − xif ×D,
where, for example, iad + xid denotes the indicative quote for the domestic borrowing interest rate at theask. This deviation from CIP using indicative quotes refers to the case when funds are borrowed at thedomestic interest rate and lent abroad at the foreign interest rate. Obviously, ∂dev_cipb/∂xk <0 for k =Swap, id and if since the denominator in these expressions is positive.
11 In addition to weekends, we left out the following days: April 2, 5—9, 12, May 3 and 31, June 17—18,August 10, 13, 24, and September 15, as these days were characterized by unusually low trading. Thus wewere left with 151 days out of 231 days over the sample period February 13—September 30, 2004.
11
4 Frequency, Size and Duration of Arbitrage Opportunities
In this section we report our key findings regarding the frequency (share), size (aver-
age profits) and duration of arbitrage opportunities distinguishing between round-trip, or
covered, arbitrage and one-way arbitrage. Our results are obtained using the formulas
described in Sections 2-3, and all calculations are estimation-free. This is important since
arbitrage opportunities detected could not be riskless if there was any ‘estimation risk’
(parameter uncertainty) involved in our calculations.
4.1 Round-trip, Covered Arbitrage
Table 4 presents results based on calculations of CIP arbitrage opportunities for the three
exchange rates and four maturities examined. Results are given for both bid and ask
sides—i.e. the outcomes of arbitrage both for the case when one borrows funds in the
quoting currency to lend in the base currency and vice versa (these cases are referred to
as “Bid” and “Ask” respectively, in the table).
The table gives results for the case where all of the observations are used—Panel (a), “All
deviations”—and for the case where only observations consistent with profitable deviations
are considered—Panel (b), “Profitable deviations.” Starting from the case where all of the
observations are used, let us note the large number of data points available to us, exceeding
two million for EUR and GBP. For JPY, the number of data points is lower but still over
800,000. The lower number of data points in the case of JPY can be explained on two
grounds. First, the most active electronic market for trading JPY is Electronic Broking
System (EBS). Second, our choice of trading hours described in the previous section
allows us to cover trading on JPY taking place during the main European trading hours
and partly the main US trading hours, at the expense of excluding the main Japanese
trading hours.12 The table shows that, as one would expect, the average return from CIP
arbitrage is negative, in all of the cases—i.e. the figures in the column headed by “mean”
are negative throughout the table. This means that, on average, CIP arbitrage is loss
making. Furthermore, the t-values suggest that the losses are statistically significant at
conventional levels of significance.13 Also, the median return is very close to the mean
12Note that EBS is also the main trading platform for EUR. Nevertheless, we still have a very largenumber of data points for EUR, although the largest number of observations is for GBP, for which Reutersis the main trading platform.
13The t-values in the case of GBP are generally smaller in absolute terms than those for the otherexchange rates, but still suggest significant losses in covered interest arbitrage on average at the 5% levelof significance.
12
return.
Since these mean returns are period returns, it is instructive to annualize them to
make them more comparable. These calculations are given under the column headed
“Ann. mean”, which illustrates how the (negative) returns are generally comparable across
different maturities. In Table 4 we also document the pace of the market by “inter-quote
time,” which is defined as the average time between two consecutive deviations from CIP.
Because at least one of the quotes involved in a CIP deviation formula must change in
order to define a new CIP deviation, inter-quote time seems to be an appropriate aggregate
indicator of the pace of FX and capital markets. The figures reported indicate that the
pace of the market is very fast. New CIP deviations occur every 2-3 seconds on average
for Euro and GBP, and every 6-7 seconds for JPY.
Turning to the case where we consider only profitable CIP deviations, the column
headed “Pa dev.” reports the number of profitable arbitrage opportunities out of the total
number of data points available (“All dev.”) calculated for each of the exchange rates
and maturities considered. Profitable deviations from CIP arbitrage are defined as the
subset of CIP deviations with values in excess of 0.1 pip. The results suggest thousands
of profitable arbitrage opportunities for all exchange rates, at most of the maturities.
However, the profitable arbitrage opportunities are miniscules as shares of the total number
of data points considered. The shares range from zero to 1.5% in the case of EUR, from
0.2% to 2.3% for GBP, and from 0.2% to 0.5% for JPY.14
When examining the annualized mean return from profitable arbitrage deviations,
we find that these returns range from a minimum of 2 pips for the case of EUR at the
one-month bid side to a maximum of 15 pips for the JPY at the three-month ask. Also,
the returns show no systematic pattern with maturity of the instruments involved in
14Table 4 also suggests that there are fewer profitable arbitrage opportunities with borrowed dollarfunds than with borrowed funds in euro, sterling and yen. This tendency is implied by the relativelyhigher share of profitable arbitrage opportunities on the ask sides relative to the bid sides in the case ofEUR and GBP and on the bid side relative to the ask side in the case of JPY. In the latter case, USD isthe base currency (f in the formula), while USD is the quoting currency (d in the formula) in the formercases—see Table 2.
13
arbitrage.15,16 Finally, the average inter-quote time for profitable deviations is in the range
between less than 2 seconds and 15.6 seconds, except for one extreme case of 25 seconds for
EUR at the one-month bid. In the latter case, the average inter-quote time is calculated
only across 73 data points, which is the smallest number of arbitrage opportunities detected
in Table 4.
Generally, for each exchange rate and both for profitable and non-profitable CIP de-
viations, the average inter-quote time tends to decline with maturity, i.e. market pace
is higher for longer-maturity contracts. Although this decline is not always monotonic,
it seems to suggest a faster level of trading activity in the one-year forward and capital
markets relative to shorter-maturity markets.
Table 5 presents information about the duration of profitable CIP arbitrage opportu-
nities. The table reports summary statistics of the durations of clusters (sequences) of
profitable CIP deviations. A cluster is defined as consisting of at least two profitable CIP
deviations in a row. The number of clusters, across exchange rates and maturities, ranges
from a minimum of ten to a maximum of over one thousand. Notably, most clusters of
profitable CIP deviations do not seem to last beyond a few minutes. Moreover, in most
of the cases, average durations falls in the range from 30 seconds to less than 2 minutes.
Median values of the durations are even lower than the corresponding average durations:
they are less than 1 minute for the case of EUR; at most 1:28 minutes for the case of
GBP; and at most 3:3 minutes for the case of Japan. It is worth noting, that durations of
clusters tend to decline, albeit non-monotonically, with the maturity of contracts. This
seems to be consistent with the relatively high market pace (low inter-quote time) at higher
maturities noted above.
Sample standard deviations of the durations reveal large variations in the duration
of profitable CIP deviations, however. The standard deviations are quite different across
the cases examined: they are mostly less than a few minutes, but exceptionally they are
15The lack of relationship between size and maturity is contrast with the conjecture that there maybe a “maturity effect” such that size of arbitrage profits increases with maturity. Such conjecture wasrationalized by Taylor (1989) on the basis of prudential credit limits that make more appealing arbitrageat short maturity and less appealing at long maturity in a foreign exchange decentralized market wherecredit assessment is made cumbersome by lack of transparency. Of course, credit rating assessment ismuch easier within Reuters electronic system than in the pre-electronic, telephone-based brokerage systemsstudied by Taylor. We suspect that, for this reason, prudential credit limits may not provide a strongrationale for requiring larger returns for longer-maturity arbitrage activities in electronic systems such asReuters. For a discussion of credit limits in decentralized and centralized, electronic markets, see Sarnoand Taylor (2001, Ch. 2).
16 In all cases, the median values of profits are comparable to the corresponding mean values, which alsosuggests fairly symmetric distributions of profits from round-trip arbitrage.
14
higher than 10 minutes and as high as 89 minutes in one of the cases for GBP. Often
the relatively large standard deviations occur when there are relatively few observations,
i.e. clusters. It seems that, exceptionally, some clusters of profitable CIP deviations can
persist for hours, but these are rare circumstances in our large sample of data. In fact,
inspection of the first and third quantiles in the last two columns of Table 5 indicate that
duration is not particularly high even at these quantiles of the distribution of durations,
suggesting that the high standard deviations reported are potentially driven by isolated
outliers.
Overall, we find a number of CIP arbitrage opportunities. However, these opportuni-
ties amount to a tiny number when one compares them to the total number of observations
examined. This is consistent with the widely held view that CIP holds tightly and that
CIP violations are rare occurrences. The size of profitable CIP violations is, however,
economically appealing. Their duration is relatively low but sufficiently high on average
for a trader to exploit the arbitrage opportunities. On the basis of our conversations with
traders dealing in the Reuters system, it would certainly take less than one minute to
exploit arbitrage opportunities arising from both round-trip and one-way arbitrage, and
it may take as little as 30 seconds.
4.2 One-way Arbitrage: Owner Arbitrage (OA) and Borrower Arbitrage(BA)
We now report results for one-way arbitrage, in the form of both OA and BA. The results
are presented in the same format as for the CIP arbitrage deviations reported in Tables
4-5.
Table 6 reports characteristics of OA opportunities for the three exchange rates and
four maturities considered. As one would expect, on average, OA calculations deliver
period returns that are generally negative and always insignificantly different from zero, on
the basis of t-values. We also note that median returns are mostly close to the mean values,
as in the case of CIP deviations. However, in contrast with the case of CIP arbitrage,
the results indicate the presence of a large number of profitable OA opportunities in most
cases. In particular, the frequency of profitable OA, calculated as shares of profitable OA
opportunities out of the total number of data points available, varies in the range from
about 15% to 48% in the case of EUR, 12% to 46% for GBP, and from about 11% to over
60% in the case of JPY. This is consistent with several conversations we held with FX
15

dealers, who argue that OA and BA opportunities do arise much more frequently than
CIP violations.17
Like for the case of CIP arbitrage, there does not appear to be any systematic pattern
linking returns to maturity. The annualized riskless mean returns from OA range from
a minimum of 2 pips to a maximum of 6 pips across the three exchange rates examined.
We also note that in contrast with the distributions of all deviations for OA, distributions
of profitable OA opportunities seem to be slightly skewed to the left as the median values
of the gains are generally lower than the corresponding mean values. The average inter-
quote time is in the range from about 2 seconds to 8 seconds, confirming the fast pace
of FX and capital markets, and the tendency of longer-maturity markets to display faster
activity levels than shorter-maturity markets.
Table 7 presents information about durations of profitable OA opportunities. The
summary statistics of durations are quite similar to the case for CIP violations. In
particular, averages of the cluster durations are mostly less than 5 minutes, and seem to
decline with the maturity of the contracts. The standard deviations of cluster durations
display more variation across the different cases, in comparison with the case of CIP, while
the median is always lower than the mean duration.
Let us now turn to BA opportunities, analyzed in Table 8. On average, BA mean
returns are generally negative and always insignificantly different from zero, on the basis
of t-values. The median returns are mostly close to the mean values, as for CIP and OA.
The frequency of BA opportunities is largely comparable to that of OA opportunities,
with the corresponding shares ranging from about 8% to 50% in the case of EUR, 13%
to 50% for GBP, and from about 11% to over 68% in the case of JPY. The average
sizes of gains from BA opportunities are also comparable to those from OA in Table 6.
Moreover, the distributions of the gains from BA may be slightly skewed, as the median
values are generally lower than the corresponding mean values. The annualized riskless
mean returns from BA range from a minimum of 2 pips to a maximum of 6 pips across
the three exchange rates examined. The inter-quote times are similar to those in the
case of OA, in the range from about 2 seconds to about 9 seconds. Finally, Table 9 shows
that the summary statistics of the cluster durations are similar to the case for CIP and
17The results also suggest that there were relatively more opportunities to earn higher returns on ownfunds by investing them in euro, sterling and yen deposits rather than in dollar deposits. This tendencyis evident from the relatively higher shares of profitable owner arbitrage opportunities on ask sides in thecase of EUR and GBP, and on the bid side in the case of JPY.
16
especially similar to the results for OA.
Overall, we find a large number of opportunities of one-way arbitrage—both in the form
of OA and BA opportunities. The large share of these opportunities is somewhat puzzling,
although the simple analytics in Section 2 implies that one-way arbitrage will occur more
often than CIP arbitrage. Moreover, through our conversations with traders, we learned
that they are aware of the high frequency of one-way arbitrage. Dealers will consider OA
form of arbitrage whenever they receive a fund to allocate, while they will consider the
BA form of arbitrage when looking for funding opportunities.
The two one-way arbitrage opportunities display similar properties in terms of both
size and duration. The size is economically appealing and their duration is relatively low,
consistent with the notion that arbitrage opportunities are short-lived. Duration appears
to be lower for longer-maturities contracts, presumably because the market pace is higher
for longer-maturity foreign and capital markets. However, the average duration is, in
general, such that a trader would have sufficient time to exploit the arbitrage opportunities.
5 Robustness and Further Empirical Analysis
In this section we undertake some robustness checks on the results reported in the previous
section and further empirical work designed to shed light on the properties of arbitrage
violations and their relation with the pace of the market. We start by investigating
two important issues in this context, namely the assessment of how genuine the arbitrage
opportunities detected are—i.e. evaluating the possibility of stale quotes—and the possibility
that the law of one price in the FX market is guaranteed by prices being set directly from
the formulas of the no-arbitrage conditions.
5.1 Are Arbitrage Opportunities Genuine or Due to Stale Quotes?
As described in our data section, we restricted our core analysis to the most active periods
of market activity in order to limit the possibility of using stale quotes, that is quotes
that may not be actually tradable even if they appear on the Reuters system. This was
achieved by excluding weekends and days with unusually low or no trading activity, by
ignoring quotes from hours with little trading and by including only quotes during the
highest activity part of the trading day, namely 07:00—18:00 GMT.
In this sub-section we address the sensitivity of our results by further restricting the
sample to quotes that may be considered particularly “fresh.” To this end, we amend the
17
data set used until now as follows: we consider only deviations for which new quotes for
all instruments involved in arbitrage had appeared on the Reuters system in the previous
two minutes. All deviations which did not meet this criterion were excluded from the
sample.
The results, reported in Table 10, indicate that this screening of the data reduces
drastically the number of observations analyzed, especially for JPY. As a consequence,
the number of profitable deviations also decreases substantially. However, the frequency
of occurrence of arbitrage—calculated as a share of profitable arbitrage violations out of
the total number of data points—remains fairly similar to the frequencies reported for CIP
in Table 4, for OA in Table 6, and for BA in Table 8. Specifically, we find a low share
for CIP violation, ranging from zero to about 3%, and high shares for both OA and BA,
ranging from zero to 83%, and from zero to 76% respectively. Interestingly, for some
exchange rates or maturities the frequency is lower in the new, more selective data set
with particularly fresh quotes, while for some cases the frequency is higher relative to the
baseline data set used in Section 4.
We also checked whether these arbitrage opportunities occur during a specific time of
the day when, for example, trading might be particularly low—e.g. at the very beginning
of the trading day examined. However, we find that arbitrage violations are roughly
equally distributed in each hour of the trading day considered here, from 07:00 to 18:00
GMT. This removes the concern that opportunities may follow a specific intraday seasonal
pattern such that they occur when traders are not active.18
Overall, these findings corroborate the results in Section 4 and add credibility to the
view that the arbitrage violations reported here are genuine arbitrage opportunities which
traders would have been able to trade upon at the time of their occurrence.
5.2 Is the Forward Rate Priced Using No-arbitrage Conditions?
Given our findings that there exist arbitrage violations, it is obvious that at least one of
the assets involved in FX arbitrage is sometimes mispriced to an extent that is sufficient
to generate arbitrage opportunities. With tick data on all four assets at our disposal, we
can assess the mispricing in each asset to shed further light on how arbitrage arises.
Anecdotal evidence that is documented both in the FX market and in academic circles
suggests that forward contracts may be priced according to the CIP condition, or even
18These results are not reported to conserve space but they are available from the authors upon request.
18

more stringent no-arbitrage conditions (e.g. OA or BA). If this is the case, then price
setting would be carried out in such a way as to prevent arbitrage opportunities from
arising. We are in a position to test this conjecture in continuous time for the first
time in this literature. Given our data on profitable CIP, OA and BA opportunities, we
calculated the number of times an arbitrage opportunity was present at the same second
when only the swap quote was fresh (just posted). We would expect that if forwards were
priced using, e.g., the CIP formula, the CIP condition should not be violated whenever
the forward is priced, i.e. whenever the swap quote changes.
Our results, reported in Table 11 for all of the three forms of arbitrage, do not support
this conjecture. The table shows that the percentage of total CIP, OA and BA arbitrage
opportunities that occur when there is only a swap price change vary from virtually zero
to 50% or above. The presence of a potentially large number of profitable arbitrage
opportunities does not support the view that forward rates are set such that they ensure the
validity of the CIP, OA or BA formulas using all available information. Thus, apparently,
either the practice of using the no-arbitrage conditions to set prices is not particularly
common or feasible at this high frequency, and/or the providers of quotes do not update
the formulas with all available information when offering forward quotes. Another reason
may be that microstructure effects, like quote-shading (improving ask or bid quotes) when
controlling inventory risk (Garman, 1976), push swap rates temporarily, yet frequently,
away from no-arbitrage prices.
We also carried out this exercise for each of the other instruments involved in arbitrage
(spot rate, and the two interest rates), recording similar results to the ones reported in
Table 11 for the forward rate—not reported but available upon request. This indicates
that none of the asset prices is systematically set using no-arbitrage conditions, and that
each of them is partly responsible for the mispricing leading to the arbitrage violations
reported here.
5.3 The Role of Market Pace
In this sub-section, we provide some illustrative evidence on whether frequency, size and
duration of profitable arbitrage opportunities vary with the pace of the market. We
undertake this investigation for all forms of arbitrage considered above to examine the
generality of the findings. To this end, we estimate simple linear cross-sectional regression
models with measures of frequency, size and durations of profitable arbitrage opportunities
19

as dependent variables, regressed on an intercept and inter-quote time as the explanatory
variable. That is, the regression model is of the form:
yi = αy + βyIQy, i + εy, i (9)
where y = frequency, size, or duration of deviations from no-arbitrage conditions; IQ
denotes inter-quote time; and εy is an error term. Subscript i indicates an observation
number; i = 1, 2, 3, ...Ny. The Greek letters represent time-invariant parameters.
The models are estimated by ordinary least squares (OLS) for all of the three forms of
arbitrage for the currency pairs examined. Accordingly, values for y and IQ as well as the
total numbers of observations (N) depend on the form of arbitrage and the currency pair
analyzed. We obtained observations for y and IQ, and stacked these in corresponding
columns in accordance with both the arbitrage direction (i.e. stacking together ask and
bid sides) and the maturity of the instruments involved.19 Thus, the total number of
observations Ny becomes equal to the sum of the total number of observations associated
with the different maturities for each yi examined.
The variables are defined more precisely as follows. The y-variable frequency is defined,
for a given form of arbitrage and currency pair, as the share of profitable deviations out of
the total number of deviations from the corresponding no-arbitrage condition that occur
in an business hour over the sample period. In this case, Ny can potentially be 13,288,
which is the product of the 2 potential arbitrage directions (ask and bid); the 4 maturities
considered; the 11 business hours (between 07.00—18.00 GMT); and 151 working days
included in the sample. However, profitable arbitrage opportunities do neither occur
every hour in our sample nor in both directions. Thus, Ny is expected to be lower than
13,288, especially for the case of CIP arbitrage. Each observation of inter-quote time
(IQ) in the regressions for frequency would be equal to the average time between all of
the (profitable and non-profitable) deviations used when calculating the corresponding
observations for the frequency to which it is associated in the regressions.
The y-variable size measures the average return of profitable deviations in a profitable
cluster, while duration refers to the time a profitable cluster lasts. The inter-quote time
(IQ) in the regressions for size and durations refers to the average time between the row
of profitable deviations constituting a profitable cluster. For a given form of arbitrage,
19Alternatively, we could have formulated separate models for the ask and the bid sides and for each ofthe four maturities examined.
20

the total number of observations used in a regression for size or duration for a currency
pair would be equal to all profitable clusters for that currency pair.
The results from estimating regression (9) for each of frequency, size and duration, for
all three currency pairs and no-arbitrage conditions, are given in Table 12. The results
confirm our previous conjectures that these characteristics of arbitrage opportunities are
linked to the pace of the market, as proxied by the inter-quote time. In particular, each
of frequency, size and duration is positively related to inter-quote time, i.e. negatively
related to the market pace. This suggests that when markets are particularly active,
as described by a high number of new quotes per unit of time, we should observe fewer
arbitrage opportunities, smaller arbitrage profits, and more short-lived arbitrage.
For frequency and size there are a few instances where inter-quote time does not enter
the regression with a statistically significant coefficient and occasionally we observe a
counterintuitive negative sign. However, the results are particularly clear-cut for the
case of duration—in terms of both obtaining correctly signed and statistically significant
positive coefficients. This suggests that high market pace is intimately related to arbitrage
opportunities that are more short lived, as one would expect.
6 Conclusions
Finance theory postulates that in well-functioning markets no-arbitrage conditions hold
in continuous time, not just on average. This paper provides evidence that short-lived
arbitrage opportunities exist in three major FX and capital markets. These opportuni-
ties represent violations of the law of one price linking spot and forward exchange rates
to interest rates across countries. The size of arbitrage opportunities is economically
significant for the three exchange rates and across all of the different maturities of the
instruments involved in arbitrage. The duration of arbitrage opportunities is, on average,
high enough to allow agents to exploit deviations from the law of one price. However,
duration is low enough to suggest that markets exploit arbitrage opportunities rapidly.
The high speed of arbitrage recorded in this paper can explain why such opportunities
have gone undetected in much previous research using data at lower frequency.
We could detect the existence and measure the duration of a number of short-lived
arbitrage opportunities only by using a unique data set at tick frequency for contempo-
raneous quotes of comparable domestic and foreign interest rates and spot and forward
21

exchange rates. These features of the data set have proven key to establish whether
deviations from no-arbitrage conditions actually represented a profitable opportunity to
agents at a given time or not, and to shed light on the time the market requires to re-
store no-arbitrage prices in an electronic trading platform such as Reuters. In turn, this
emphasizes how studies of arbitrage demand the analysis of tick, carefully matched data
on the assets involved in arbitrage with meticulous attention to the finest institutional
details.
We find the results in this paper, at the same time, comforting and puzzling. On
the one hand, it is comforting that the observed short-lived arbitrage opportunities pro-
vide evidence in support of the resolution proposed to the Grossman-Stiglitz ‘arbitrage
paradox.’ If arbitrage was never observed, market participants may not have sufficient
incentives to watch the market, in which case arbitrage opportunities should arise. In
turn, very short-term arbitrage opportunities invite traders to exploit them and hence
will be quickly eliminated. While this view of arbitrage is appealing, previous empirical
studies have been unable to detect such short-term arbitrage opportunities in a variety of
financial markets, and this paper explains why that would happen with aggregate data.
To reiterate, arbitrage is indeed very short lived, and requires turning on the microscope
on high-quality tick data to be detected.
On the other hand, the results in this paper raise further questions. Specifically, it
seems puzzling that the frequency of one-way arbitrage can be as high as 50% or 60%
of the observations in our sample. This is indicative that at the high frequency at
which markets operate, that is in real time, mispricing is indeed quite common. One
would normally think that offering a price that allows arbitrage is indicative that a dealer
is ill-informed and/or irrational, implying that incipient—as opposed to actual—arbitrage
operations should cause no-arbitrage conditions to hold. Our evidence suggests that this
is not the case and, in fact, prices are offered that generate actual, short-lived arbitrage
opportunities. Understanding why this happens and what market makers and regulators
can do to avoid it remain important avenues for future research.
22
A Details on Calculations and Transactions costs
A.1 Calculating Days to Maturity (D)
We adjust interest rates, which are quoted in per cent per annum, by D/360 or D/365 to
obtain interest rates for a period less than a year. By convention, 365 refers to the total
number of days in a year for a Common Wealth country, while 360 refers to the number of
total days for other countries. D is the actual number of business days between the (spot)
value date and the maturity date, which is generally the same date as the value date but
in a different month.
Exceptionally, if the maturity date is a holiday in the home country of a security, the
maturity date becomes the first business day after that holiday. If the value date is the
last business day in a month, the maturity date will also be the last business day but of a
different month. This is commonly referred to as the “end-of-month end-of-month rule.”
For swap contracts, the value date and the maturity date must not be a holiday in the US
and in the home countries of the quoting and the base currencies. We took holidays, i.e.
days that are not settlement dates, for the different currencies from Bloomberg to account
for this convention.
For almost all securities the value date falls on the second business day after the day of
trading. The exception is the Eurosterling interest rate where the value date is the same
as the trade date. Consequently, the maturity date of a sterling security that is traded
on the same date as, e.g., a dollar security would generally differ by two days. In order
to ensure that both securities mature on the same day, dealers borrow or lend a sterling
security forward with maturity on the value date of the other currency. Such deals are
made through direct contact between dealers and, hence, do not generate transaction costs
payable to Reuters.
A.2 Transaction Costs: Brokerage Fees and Settlement Costs
There are two types of variable transaction costs associated with trading in the FX market,
in addition to those captured by ask-bid spreads: brokerage fees and settlement costs. In
our case, the brokerage fees refer to the costs of trading swap contracts through Reuters
electronic broking system, Reuters Dealing 3000. At present, the Reuters system does not
allow for trading of deposits in the security markets. Such trading is conducted via direct
contact between dealers or through voice brokers. The variable broker costs of trading in
deposits may therefore be assumed to be zero. Settlement costs, however, are incurred
on trades of both swap contracts and deposits.
The brokerage fee is paid by the initiator of a trade (aggressor) at the end of a month
in the Reuters dealing system for swaps. Such fee increases with the maturity of a traded
23
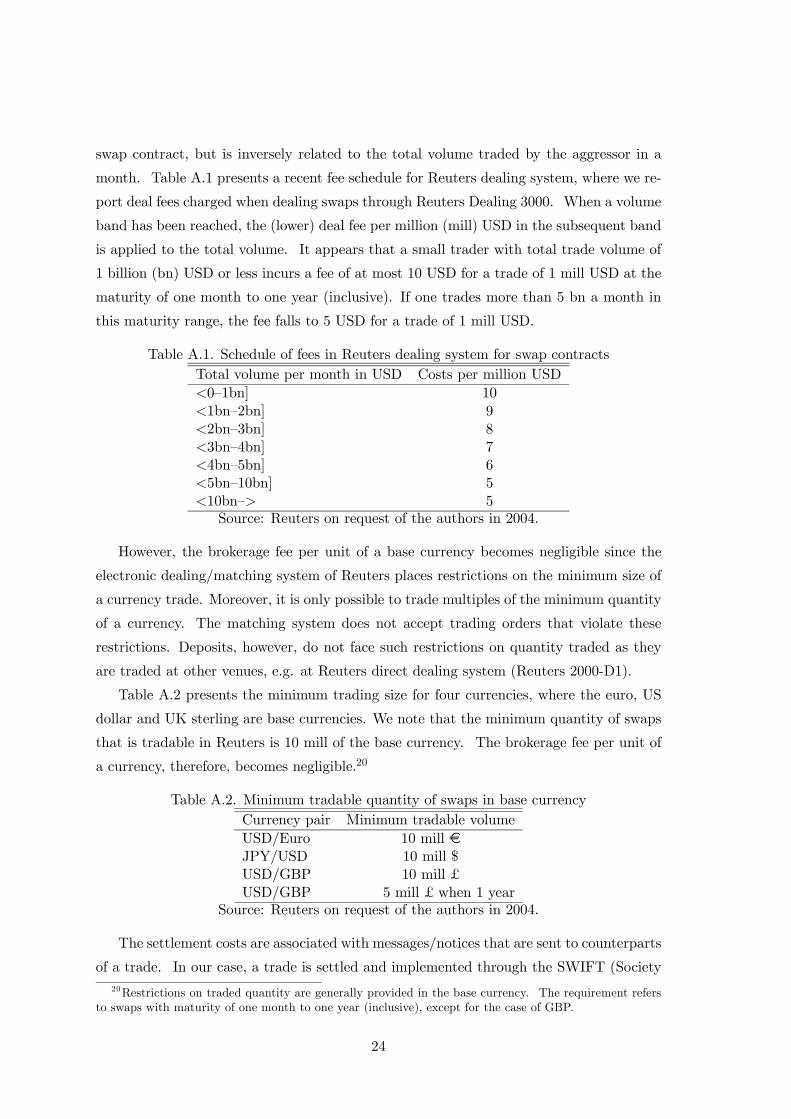
swap contract, but is inversely related to the total volume traded by the aggressor in a
month. Table A.1 presents a recent fee schedule for Reuters dealing system, where we re-
port deal fees charged when dealing swaps through Reuters Dealing 3000. When a volume
band has been reached, the (lower) deal fee per million (mill) USD in the subsequent band
is applied to the total volume. It appears that a small trader with total trade volume of
1 billion (bn) USD or less incurs a fee of at most 10 USD for a trade of 1 mill USD at the
maturity of one month to one year (inclusive). If one trades more than 5 bn a month in
this maturity range, the fee falls to 5 USD for a trade of 1 mill USD.
Table A.1. Schedule of fees in Reuters dealing system for swap contractsTotal volume per month in USD Costs per million USD<0—1bn] 10<1bn—2bn] 9<2bn—3bn] 8<3bn—4bn] 7<4bn—5bn] 6<5bn—10bn] 5<10bn—> 5
Source: Reuters on request of the authors in 2004.
However, the brokerage fee per unit of a base currency becomes negligible since the
electronic dealing/matching system of Reuters places restrictions on the minimum size of
a currency trade. Moreover, it is only possible to trade multiples of the minimum quantity
of a currency. The matching system does not accept trading orders that violate these
restrictions. Deposits, however, do not face such restrictions on quantity traded as they
are traded at other venues, e.g. at Reuters direct dealing system (Reuters 2000-D1).
Table A.2 presents the minimum trading size for four currencies, where the euro, US
dollar and UK sterling are base currencies. We note that the minimum quantity of swaps
that is tradable in Reuters is 10 mill of the base currency. The brokerage fee per unit of
a currency, therefore, becomes negligible.20
Table A.2. Minimum tradable quantity of swaps in base currencyCurrency pair Minimum tradable volumeUSD/Euro 10 mill €JPY/USD 10 mill $USD/GBP 10 mill £USD/GBP 5 mill £ when 1 year
Source: Reuters on request of the authors in 2004.
The settlement costs are associated with messages/notices that are sent to counterparts
of a trade. In our case, a trade is settled and implemented through the SWIFT (Society20Restrictions on traded quantity are generally provided in the base currency. The requirement refers
to swaps with maturity of one month to one year (inclusive), except for the case of GBP.
24

for Worldwide Interbank Financial Telecommunication) network. There are three notices
associated with each transaction: notice of confirmation, payment instructions and notice
of incoming payments. Confirmation of a deal is sent to both sides of the deal on the
trading date. This is followed by payment instructions to the banks where both parties
have accounts that will be debited. Finally, a notice of incoming payments is sent to the
banks where both parties want the incoming payments to be credited.
The cost of a notice is 14 − 28 cents and is the same for transactions in the FX andsecurity markets. The cost does not depend on the venue of trading, i.e. it is the same for
trading directly or via a broker (voice or electronic). Thus each party incurs a total cost
of 0.42−0.84 cents for the three messages per transaction. These costs are charged at theend of each month. SWIFT invoices its customers either in dollars or euros, depending on
the country in which the customer is located irrespective of the invoicing address.21
An arbitrage deal using a currency swap leads to three transactions, one in the FX
market and two in the security markets, and thus for a total of 9 (= 3×3) notices. Hence,the total (variable) settlement costs vary in the range of 1.26−2.52 (= 3×0.42−3×0.84)USD. In extraordinary situations, a trade may require more than three notices and,
therefore, to higher costs.
Overall, even the total of variable transaction costs (brokerage fees and settlement
costs) per unit of a base currency becomes negligible. For example, the sum of brokerage
fee and settlement costs of a minimum-size swap of 10 mill USD of, e.g., maturity one
month to one year (inclusive) would at most be (10×10 + 0.84) = 100.84 USD, i.e. 10.084per 1 mill USD or ca. 1/10 of a pip per USD.
21Customers located in the Americas and in Asia are in principle invoiced in dollars. All other customersare invoiced in euros. Where fees are denominated in another currency, they are converted to dollars oreuros at the market spot selling rate at 15.00 Belgian time at the end of period for which the invoice isissued.
25

References
Aliber, R.Z., Chowdry, B. and Yan, S. (2003), “Some Evidence that a Tobin Tax on
Foreign Exchange Transactions May Increase Volatility,” European Finance Review,
7, 481—510.
Branson, W.H. (1969), “The Minimum Covered Interest Differential Needed for Interna-
tional Arbitrage Activity,” Journal of Political Economy, 77, 1028—1035.
Bjønnes, G.H. and Rime, D. (2005), “Dealer Behavior and Trading Systems in the Foreign
Exchange Market,” Journal of Financial Economics, 75, 571—605.
Callier, P. (1981), “One Way Arbitrage, Foreign Exchange and Security Markets: A
Note,” Journal of Finance, 36, 1177—1186.
Covrig, V. and Melvin, M. (2002), “Asymmetric Information and Price Discovery in
the FX Market: Does Tokyo Know More About the Yen?”, Journal of Empirical
Finance, 9, 271—285.
Danielsson, J. and Payne, R. (2002), “Liquidity Determination in an Order Driven Mar-
ket,” Financial Markets Group, London School of Economics, mimeo.
Evans, M.D.D. (2002), “FX Trading and Exchange Rate Dynamics,” Journal of Finance,
57, 2405—2447.
Evans. M.D.D. and Lyons, R.K. (2002a), “Order Flow and Exchange Rate Dynamics,”
Journal of Political Economy, 110, 170—180.
Evans. M.D.D. and Lyons, R.K. (2002b), “Informational Integration and FX Trading,”
Journal of International Money and Finance, 21, 807—831.
Evans. M.D.D. and Lyons, R.K. (2005), “Meese—Rogoff Redux: Micro—based Exchange
Rate Forecasting,” NBER Working Paper 11042, American Economic Review, forth-
coming.
Fletcher, D.J. and Taylor, L.W. (1996), “SWAP Covered Interest Parity in Long—date
Capital Markets,” Review of Economics and Statistics, 78, 530—538.
Frenkel, J.A. (1973), “Elasticities and the Interest Parity Theory,” Journal of Political
Economy, 81, 741—747.
Frenkel, J.A. and Levich, R.M. (1975), “Covered Interest Arbitrage: Unexploited Prof-
its,” Journal of Political Economy, 83, 325—338.
26

Frenkel, J.A. and Levich, R.M. (1977), “Transaction Costs and Interest Arbitrage: Tran-
quil Versus Turbulent Periods,” Journal of Political Economy, 85, 1209—1226.
Garman, M. (1976), “Market Microstructure,” Journal of Financial Economics, 3, 257—
275.
Grossman, S.J. and Stiglitz, J.E. (1976), “Information and Competitive Price Systems,”
American Economic Review, 66, 246—252.
Grossman, S.J. and Stiglitz, J.E. (1980), “On the Impossibility of Informationally Effi-
cient Markets,” American Economic Review, 70, 393—407.
Juhl, T., Miles, W. and Weidenmier, M. (2004), “Covered Interest Arbitrage: Then vs
Now,” NBER Working Paper No. W10961, Economica, forthcoming.
Lyons, R.K. (1995), “Tests of Microstructural Hypothesis in the Foreign Exchange Mar-
ket,” Journal of Financial Economics, 39, 321—351.
Lyons, R.K. (2001), The Microstructure Approach to Exchange Rates. Cambridge, USA:
MIT Press.
Lyons, R.K. and Moore, M. (2005), “An Information Approach to International Cur-
rencies,” NBER Working Paper No. 11220, University of California, Berkeley and
Queen’s University, Belfast, mimeo.
O’Hara, M. (1995), Microstructure Theory. Oxford, UK: Blackwell Publishers.
Osler, C.L. (2000), “Support for Resistance: Technical Analysis and Intraday Exchange
Rates,” Federal Reserve Bank of New York Economic Policy Review, 6, 53—67.
Osler, C.L. (2003), “Currency Orders and Exchange Rate Dynamics: Explaining the
Success of Technical Analysis,” Journal of Finance, 58, 1791—1820.
Osler, C.L. (2005), “Stop—loss Orders and Price Cascades in Currency Markets,” Journal
of International Money and Finance, 24, 219—241.
Payne, R. (2003), “Informed Trade in Spot Foreign Exchange Markets: An Empirical
Investigation,” Journal of International Economics, 61, 307—329.
Rhee, S.G. and Chang, R.P. (1992), “Intra—day Arbitrage Opportunities in Foreign Ex-
change and Eurocurrency Markets,” Journal of Finance, 47, 363—379.
27

Sarno, L. and Taylor, M.P. (2001), The Microstructure of the Foreign Exchange Market.
A selective survey of the literature, Princeton Studies in International Economics
series, No. 89, Princeton, NJ: Princeton University Press.
Shleifer, A. and Vishny, R. (1997), “The Limits of Arbitrage,” Journal of Finance, 52,
35—55.
Taylor, M.P. (1987), “Covered Interest Parity: A High—Frequency, High—Quality Data
Study,” Economica, 54, 429—438.
Taylor, M.P. (1989), “Covered Interest Arbitrage and Market Turbulence,” Economic
Journal, 99, 376—391.
28
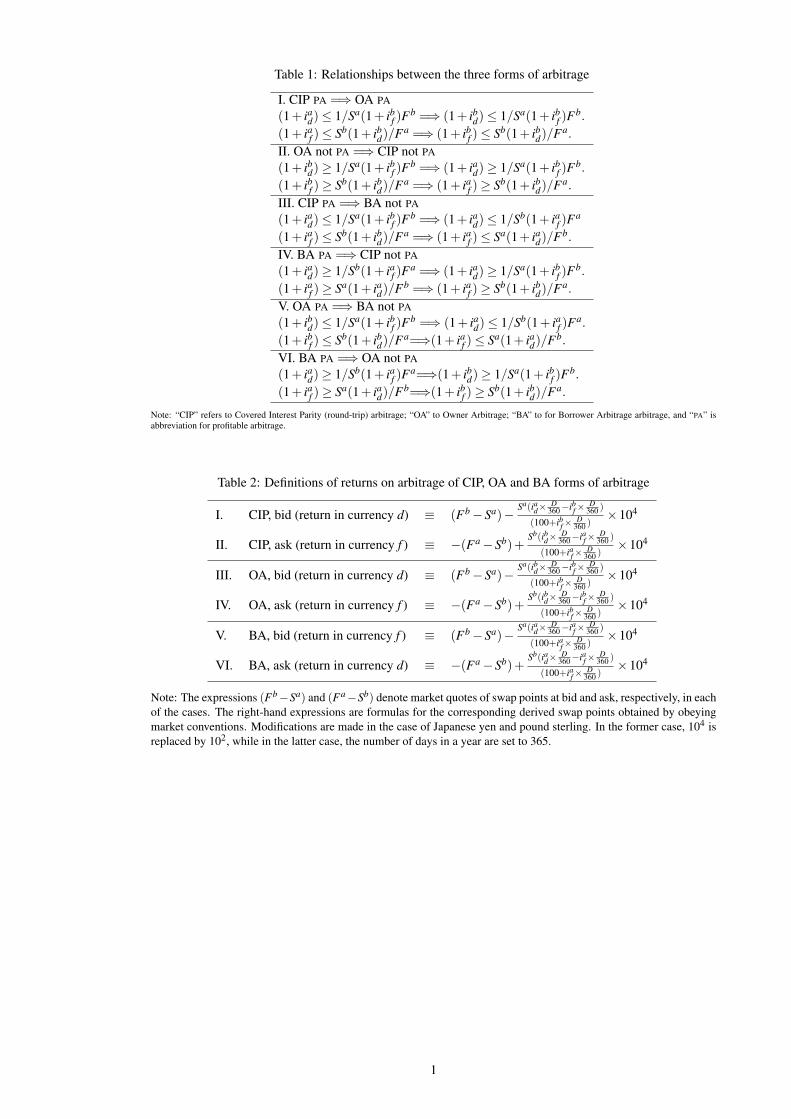
Table 1: Relationships between the three forms of arbitrage
I. CIP PA =⇒ OA PA
(1+ iad)≤ 1/Sa(1+ ibf )Fb =⇒ (1+ ibd)≤ 1/Sa(1+ ibf )F
b.
(1+ iaf )≤ Sb(1+ ibd)/Fa =⇒ (1+ ibf )≤ Sb(1+ ibd)/Fa.
II. OA not PA =⇒ CIP not PA
(1+ ibd)≥ 1/Sa(1+ ibf )Fb =⇒ (1+ iad)≥ 1/Sa(1+ ibf )F
b.
(1+ ibf )≥ Sb(1+ ibd)/Fa =⇒ (1+ iaf )≥ Sb(1+ ibd)/Fa.
III. CIP PA =⇒ BA not PA
(1+ iad)≤ 1/Sa(1+ ibf )Fb =⇒ (1+ iad)≤ 1/Sb(1+ iaf )F
a
(1+ iaf )≤ Sb(1+ ibd)/Fa =⇒ (1+ iaf )≤ Sa(1+ iad)/Fb.
IV. BA PA =⇒ CIP not PA
(1+ iad)≥ 1/Sb(1+ iaf )Fa =⇒ (1+ iad)≥ 1/Sa(1+ ibf )F
b.
(1+ iaf )≥ Sa(1+ iad)/Fb =⇒ (1+ iaf )≥ Sb(1+ ibd)/Fa.
V. OA PA =⇒ BA not PA
(1+ ibd)≤ 1/Sa(1+ ibf )Fb =⇒ (1+ iad)≤ 1/Sb(1+ iaf )F
a.
(1+ ibf )≤ Sb(1+ ibd)/Fa=⇒(1+ iaf )≤ Sa(1+ iad)/Fb.
VI. BA PA =⇒ OA not PA
(1+ iad)≥ 1/Sb(1+ iaf )Fa=⇒(1+ ibd)≥ 1/Sa(1+ ibf )F
b.
(1+ iaf )≥ Sa(1+ iad)/Fb=⇒(1+ ibf )≥ Sb(1+ ibd)/Fa.
Note: “CIP” refers to Covered Interest Parity (round-trip) arbitrage; “OA” to Owner Arbitrage; “BA” to for Borrower Arbitrage arbitrage, and “PA” isabbreviation for profitable arbitrage.
Table 2: Definitions of returns on arbitrage of CIP, OA and BA forms of arbitrage
I. CIP, bid (return in currency d) ≡ (Fb−Sa)−Sa(iad×
D360−ibf×
D360 )
(100+ibf×D
360 )×104
II. CIP, ask (return in currency f ) ≡ −(Fa−Sb)+Sb(ibd×
D360−iaf×
D360 )
(100+iaf×D
360 )×104
III. OA, bid (return in currency d) ≡ (Fb−Sa)−Sa(ibd×
D360−ibf×
D360 )
(100+ibf×D
360 )×104
IV. OA, ask (return in currency f ) ≡ −(Fa−Sb)+Sb(ibd×
D360−ibf×
D360 )
(100+ibf×D
360 )×104
V. BA, bid (return in currency f ) ≡ (Fb−Sa)−Sa(iad×
D360−iaf×
D360 )
(100+iaf×D
360 )×104
VI. BA, ask (return in currency d) ≡ −(Fa−Sb)+Sb(iad×
D360−iaf×
D360 )
(100+iaf×D
360 )×104
Note: The expressions (Fb−Sa) and (Fa−Sb) denote market quotes of swap points at bid and ask, respectively, in eachof the cases. The right-hand expressions are formulas for the corresponding derived swap points obtained by obeyingmarket conventions. Modifications are made in the case of Japanese yen and pound sterling. In the former case, 104 isreplaced by 102, while in the latter case, the number of days in a year are set to 365.
1

Table 3: Base and quoting currencies
Exchange rates Quoting currency (d) Base currency ( f ) Notation usedUSD/EUR USD EUR EURUSD/GBP USD GBP GBPJPY/USD JPY USD JPY
Note: The ‘base currency’ is the currency being priced in units of another currency, which would be the ‘quoting currency’. The base and quotingcurrencies correspond to the foreign (f ) and the domestic (d) currencies in Table 2. The final column shows the notation used for the three exchange rates(in the first column) in the paper.
2

Tabl
e4:
Rou
nd-t
rip,
cove
red
arbi
trag
e(C
IP).
Des
crip
tive
stat
istic
sof
devi
atio
ns
a)A
llde
viat
ions
b)Pr
ofita
ble
devi
atio
nsA
nn.
Inte
rquo
teA
nn.
Inte
rquo
teE
xcha
nge
rate
All
dev.
Mea
nt-
valu
eM
edia
nm
ean
time
(sec
)PA
dev.
Shar
eM
ean
Med
ian
mea
ntim
e(s
ec)
EU
R1M
Ask
2,03
7,92
3-0
.90
-4.2
-0.9
-11
2.9
1,97
50.
10%
0.26
0.24
32.
7B
id2,
037,
923
-1.0
0-4
.6-1
.0-1
22.
973
0.00
%0.
180.
132
25.0
3MA
sk2,
068,
143
-2.6
7-3
.3-2
.7-1
12.
930
,116
1.46
%0.
850.
393
2.8
Bid
2,06
8,14
3-2
.77
-3.7
-2.7
-11
2.9
3,50
00.
17%
0.88
0.66
42.
26M
Ask
2,30
9,19
7-5
.78
-3.1
-5.7
-12
2.6
12,8
440.
56%
1.44
1.30
31.
9B
id2,
309,
197
-5.3
1-3
.2-5
.3-1
12.
68,
559
0.37
%2.
582.
425
2.1
1YA
sk2,
560,
419
-12.
43-2
.9-1
2.4
-12
2.3
21,4
950.
84%
5.33
4.69
52.
0B
id2,
560,
419
-10.
64-2
.9-1
0.6
-11
2.3
8,96
60.
35%
3.29
2.14
32.
2G
BP
1MA
sk2,
445,
312
-1.3
6-2
.5-1
.4-1
62.
435
,110
1.44
%0.
350.
264
2.4
Bid
2,44
5,31
2-1
.72
-3.4
-1.7
-21
2.4
16,8
350.
69%
0.69
0.68
82.
83M
Ask
2,45
0,66
0-4
.06
-1.9
-4.1
-16
2.4
57,5
232.
35%
2.13
1.40
92.
5B
id2,
450,
660
-4.2
5-2
.0-4
.1-1
72.
424
,124
0.98
%2.
903.
0912
1.9
6MA
sk2,
594,
610
-7.9
1-2
.3-7
.9-1
62.
337
,820
1.46
%4.
913.
2710
2.0
Bid
2,59
4,61
0-9
.43
-2.8
-9.3
-19
2.3
5,95
00.
23%
1.70
1.38
32.
41Y
Ask
2,74
6,28
8-1
6.01
-2.6
-16.
2-1
62.
237
,987
1.38
%9.
097.
389
2.0
Bid
2,74
6,28
8-1
7.85
-2.8
-17.
4-1
82.
24,
593
0.17
%4.
522.
355
2.5
JPY
1MA
sk80
4,88
5-1
.04
-3.4
-1.0
-12
7.3
1,54
50.
19%
0.37
0.15
413
.8B
id80
4,88
5-1
.02
-3.5
-1.0
-12
7.3
2,06
80.
26%
0.23
0.18
36.
23M
Ask
818,
537
-2.6
6-3
.4-2
.6-1
17.
249
10.
06%
3.86
3.00
1510
.5B
id81
8,53
7-2
.85
-3.3
-2.9
-11
7.2
2,89
10.
35%
1.83
1.72
715
.66M
Ask
838,
047
-4.6
1-2
.9-4
.6-9
7.0
718
0.09
%4.
710.
909
15.0
Bid
838,
047
-5.6
9-3
.5-5
.6-1
17.
04,
140
0.49
%1.
451.
253
2.8
1YA
sk89
2,24
2-8
.37
-2.3
-8.3
-86.
63,
403
0.38
%6.
212.
006
10.9
Bid
892,
242
-13.
42-3
.4-1
3.6
-13
6.6
4,35
80.
49%
3.50
3.26
44.
6
Not
e:T
heco
lum
nhe
aded
by‘A
llde
v.’
pres
ents
the
num
bero
fall
profi
tabl
ean
dno
n-pr
ofita
ble
devi
atio
ns(c
f.de
finiti
ons
inTa
ble
2),w
hile
the
one
head
edby
‘PA
dev.
’re
cord
sth
enu
mbe
roft
hepr
ofita
ble
devi
atio
ns,i
.e.d
evia
tions
that
are
larg
erth
an1/
10of
api
p.E
ntri
esin
the
‘Sha
re’c
olum
nar
epr
ofita
ble
devi
atio
nsin
perc
ents
ofal
loft
hede
viat
ions
inco
lum
n‘A
llde
v.’.
The
‘Mea
n’an
d‘M
edia
n’co
lum
nspr
esen
tthe
aver
age
size
san
dm
edia
nva
lues
ofth
ede
viat
ions
,bot
hm
easu
red
inpi
ps.T
he‘A
nn.m
ean’
colu
mns
show
annu
aliz
edm
ean
valu
esof
the
peri
odre
turn
s(d
evia
tions
),re
port
edin
the
‘Mea
n’co
lum
ns.
Ann
ualiz
edva
lues
for
the
1-m
onth
,3-m
onth
and
the
6-m
onth
mat
uriti
esar
eob
tain
edby
mul
tiply
ing
the
(per
iod)
mea
nva
lues
by12
,4an
d2,
resp
ectiv
ely.
The
‘t-v
alue
issi
mpl
yth
e(p
erio
d)m
ean
valu
esdi
vide
dby
thei
rres
pect
ive
sam
ple
stan
dard
devi
atio
ns.T
he‘I
nter
quot
etim
e(s
ec)’
colu
mns
pres
entt
heav
erag
etim
ein
seco
nds
betw
een
two
cons
ecut
ive
devi
atio
ns.
Sam
ple:
Bas
edon
Reu
ters
tick
quot
es.F
eb.1
3–
Sep.
30,2
004,
wee
kday
s,be
twee
nG
MT
07:0
0an
d18
:00.
The
follo
win
gda
tes
have
been
rem
oved
:Apr
il2,
5–9,
12,M
ay3
and
31,J
une
17an
d18
,Aug
ust1
0,13
,24,
and
Sept
embe
r15.
3
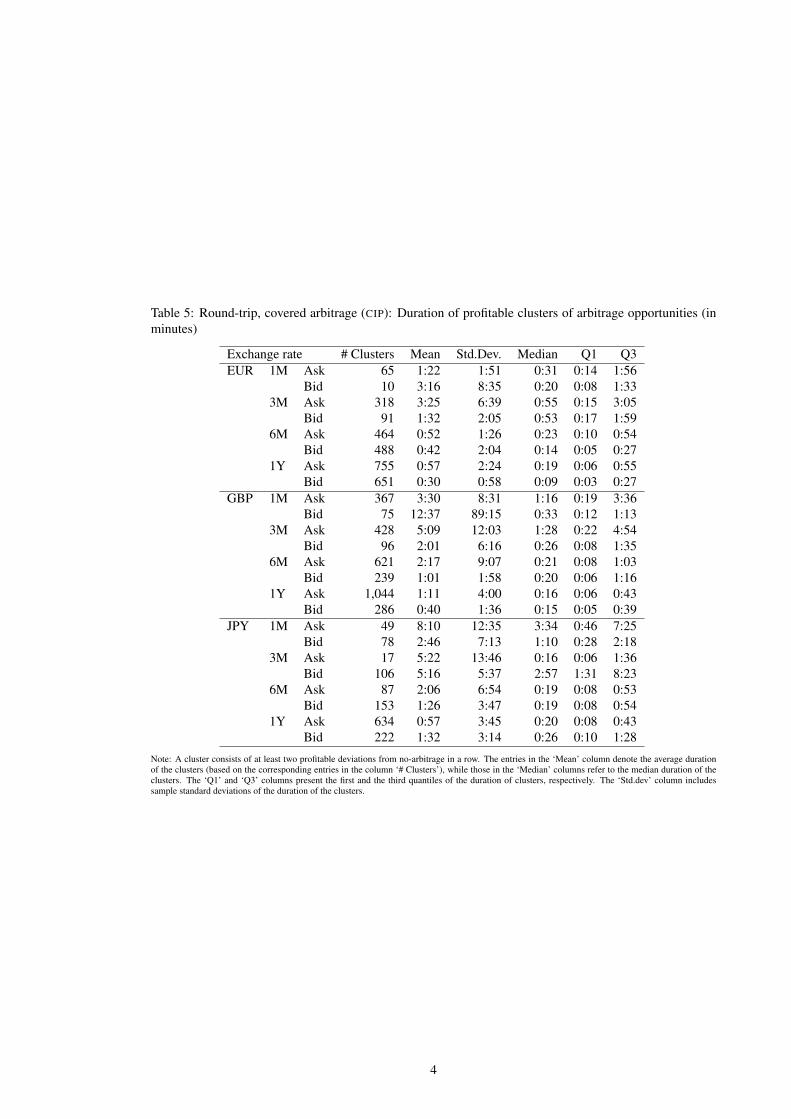
Table 5: Round-trip, covered arbitrage (CIP): Duration of profitable clusters of arbitrage opportunities (inminutes)
Exchange rate # Clusters Mean Std.Dev. Median Q1 Q3EUR 1M Ask 65 1:22 1:51 0:31 0:14 1:56
Bid 10 3:16 8:35 0:20 0:08 1:333M Ask 318 3:25 6:39 0:55 0:15 3:05
Bid 91 1:32 2:05 0:53 0:17 1:596M Ask 464 0:52 1:26 0:23 0:10 0:54
Bid 488 0:42 2:04 0:14 0:05 0:271Y Ask 755 0:57 2:24 0:19 0:06 0:55
Bid 651 0:30 0:58 0:09 0:03 0:27GBP 1M Ask 367 3:30 8:31 1:16 0:19 3:36
Bid 75 12:37 89:15 0:33 0:12 1:133M Ask 428 5:09 12:03 1:28 0:22 4:54
Bid 96 2:01 6:16 0:26 0:08 1:356M Ask 621 2:17 9:07 0:21 0:08 1:03
Bid 239 1:01 1:58 0:20 0:06 1:161Y Ask 1,044 1:11 4:00 0:16 0:06 0:43
Bid 286 0:40 1:36 0:15 0:05 0:39JPY 1M Ask 49 8:10 12:35 3:34 0:46 7:25
Bid 78 2:46 7:13 1:10 0:28 2:183M Ask 17 5:22 13:46 0:16 0:06 1:36
Bid 106 5:16 5:37 2:57 1:31 8:236M Ask 87 2:06 6:54 0:19 0:08 0:53
Bid 153 1:26 3:47 0:19 0:08 0:541Y Ask 634 0:57 3:45 0:20 0:08 0:43
Bid 222 1:32 3:14 0:26 0:10 1:28
Note: A cluster consists of at least two profitable deviations from no-arbitrage in a row. The entries in the ‘Mean’ column denote the average durationof the clusters (based on the corresponding entries in the column ‘# Clusters’), while those in the ‘Median’ columns refer to the median duration of theclusters. The ‘Q1’ and ‘Q3’ columns present the first and the third quantiles of the duration of clusters, respectively. The ‘Std.dev’ column includessample standard deviations of the duration of the clusters.
4
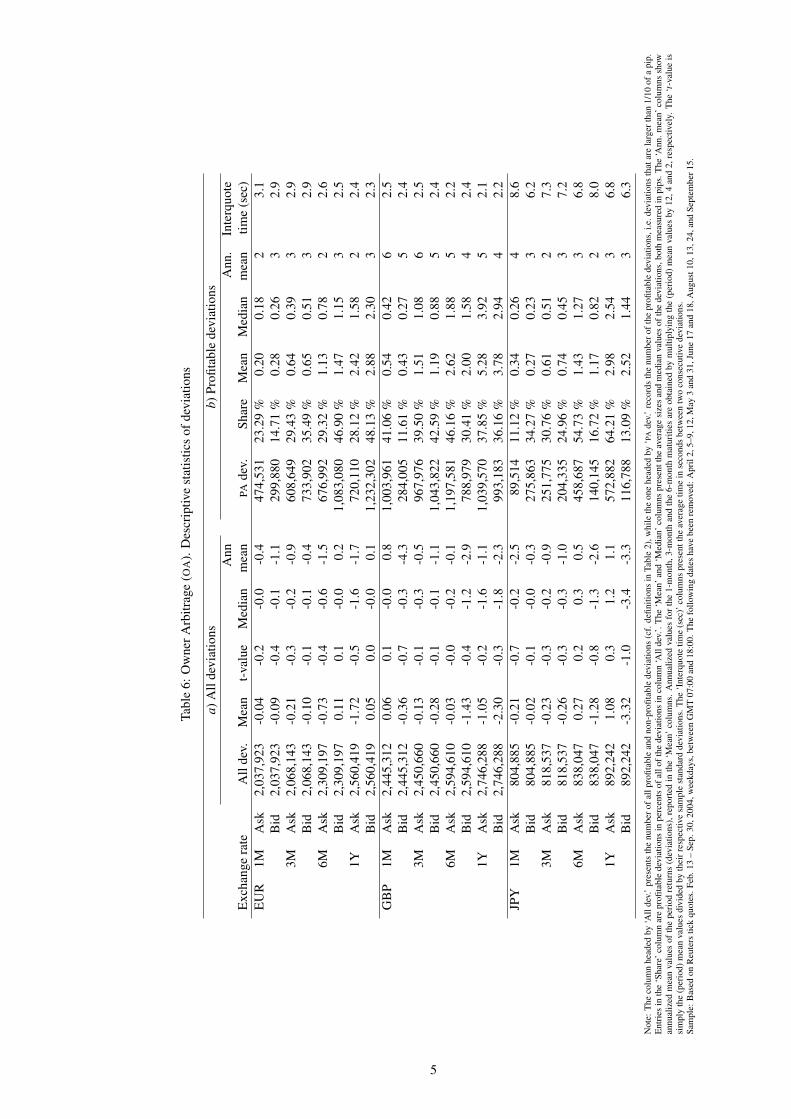
Tabl
e6:
Ow
nerA
rbitr
age
(OA
).D
escr
iptiv
est
atis
tics
ofde
viat
ions
a)A
llde
viat
ions
b)Pr
ofita
ble
devi
atio
nsA
nnA
nn.
Inte
rquo
teE
xcha
nge
rate
All
dev.
Mea
nt-
valu
eM
edia
nm
ean
PAde
v.Sh
are
Mea
nM
edia
nm
ean
time
(sec
)E
UR
1MA
sk2,
037,
923
-0.0
4-0
.2-0
.0-0
.447
4,53
123
.29
%0.
200.
182
3.1
Bid
2,03
7,92
3-0
.09
-0.4
-0.1
-1.1
299,
880
14.7
1%
0.28
0.26
32.
93M
Ask
2,06
8,14
3-0
.21
-0.3
-0.2
-0.9
608,
649
29.4
3%
0.64
0.39
32.
9B
id2,
068,
143
-0.1
0-0
.1-0
.1-0
.473
3,90
235
.49
%0.
650.
513
2.9
6MA
sk2,
309,
197
-0.7
3-0
.4-0
.6-1
.567
6,99
229
.32
%1.
130.
782
2.6
Bid
2,30
9,19
70.
110.
1-0
.00.
21,
083,
080
46.9
0%
1.47
1.15
32.
51Y
Ask
2,56
0,41
9-1
.72
-0.5
-1.6
-1.7
720,
110
28.1
2%
2.42
1.58
22.
4B
id2,
560,
419
0.05
0.0
-0.0
0.1
1,23
2,30
248
.13
%2.
882.
303
2.3
GB
P1M
Ask
2,44
5,31
20.
060.
1-0
.00.
81,
003,
961
41.0
6%
0.54
0.42
62.
5B
id2,
445,
312
-0.3
6-0
.7-0
.3-4
.328
4,00
511
.61
%0.
430.
275
2.4
3MA
sk2,
450,
660
-0.1
3-0
.1-0
.3-0
.596
7,97
639
.50
%1.
511.
086
2.5
Bid
2,45
0,66
0-0
.28
-0.1
-0.1
-1.1
1,04
3,82
242
.59
%1.
190.
885
2.4
6MA
sk2,
594,
610
-0.0
3-0
.0-0
.2-0
.11,
197,
581
46.1
6%
2.62
1.88
52.
2B
id2,
594,
610
-1.4
3-0
.4-1
.2-2
.978
8,97
930
.41
%2.
001.
584
2.4
1YA
sk2,
746,
288
-1.0
5-0
.2-1
.6-1
.11,
039,
570
37.8
5%
5.28
3.92
52.
1B
id2,
746,
288
-2.3
0-0
.3-1
.8-2
.399
3,18
336
.16
%3.
782.
944
2.2
JPY
1MA
sk80
4,88
5-0
.21
-0.7
-0.2
-2.5
89,5
1411
.12
%0.
340.
264
8.6
Bid
804,
885
-0.0
2-0
.1-0
.0-0
.327
5,86
334
.27
%0.
270.
233
6.2
3MA
sk81
8,53
7-0
.23
-0.3
-0.2
-0.9
251,
775
30.7
6%
0.61
0.51
27.
3B
id81
8,53
7-0
.26
-0.3
-0.3
-1.0
204,
335
24.9
6%
0.74
0.45
37.
26M
Ask
838,
047
0.27
0.2
0.3
0.5
458,
687
54.7
3%
1.43
1.27
36.
8B
id83
8,04
7-1
.28
-0.8
-1.3
-2.6
140,
145
16.7
2%
1.17
0.82
28.
01Y
Ask
892,
242
1.08
0.3
1.2
1.1
572,
882
64.2
1%
2.98
2.54
36.
8B
id89
2,24
2-3
.32
-1.0
-3.4
-3.3
116,
788
13.0
9%
2.52
1.44
36.
3
Not
e:T
heco
lum
nhe
aded
by‘A
llde
v.’
pres
ents
the
num
bero
fall
profi
tabl
ean
dno
n-pr
ofita
ble
devi
atio
ns(c
f.de
finiti
ons
inTa
ble
2),w
hile
the
one
head
edby
‘PA
dev.
’re
cord
sth
enu
mbe
roft
hepr
ofita
ble
devi
atio
ns,i
.e.d
evia
tions
that
are
larg
erth
an1/
10of
api
p.E
ntri
esin
the
‘Sha
re’c
olum
nar
epr
ofita
ble
devi
atio
nsin
perc
ents
ofal
loft
hede
viat
ions
inco
lum
n‘A
llde
v.’.
The
‘Mea
n’an
d‘M
edia
n’co
lum
nspr
esen
tthe
aver
age
size
san
dm
edia
nva
lues
ofth
ede
viat
ions
,bot
hm
easu
red
inpi
ps.T
he‘A
nn.m
ean’
colu
mns
show
annu
aliz
edm
ean
valu
esof
the
peri
odre
turn
s(d
evia
tions
),re
port
edin
the
‘Mea
n’co
lum
ns.
Ann
ualiz
edva
lues
for
the
1-m
onth
,3-m
onth
and
the
6-m
onth
mat
uriti
esar
eob
tain
edby
mul
tiply
ing
the
(per
iod)
mea
nva
lues
by12
,4an
d2,
resp
ectiv
ely.
The
‘t-v
alue
issi
mpl
yth
e(p
erio
d)m
ean
valu
esdi
vide
dby
thei
rres
pect
ive
sam
ple
stan
dard
devi
atio
ns.T
he‘I
nter
quot
etim
e(s
ec)’
colu
mns
pres
entt
heav
erag
etim
ein
seco
nds
betw
een
two
cons
ecut
ive
devi
atio
ns.
Sam
ple:
Bas
edon
Reu
ters
tick
quot
es.F
eb.1
3–
Sep.
30,2
004,
wee
kday
s,be
twee
nG
MT
07:0
0an
d18
:00.
The
follo
win
gda
tes
have
been
rem
oved
:Apr
il2,
5–9,
12,M
ay3
and
31,J
une
17an
d18
,Aug
ust1
0,13
,24,
and
Sept
embe
r15.
5

Table 7: Owner Arbitrage (OA): Duration of profitable clusters of arbitrage opportunities (in minutes)
Exchange rate # Clusters Mean Std.Dev. Median Q1 Q3EUR 1M Ask 9,059 2:29 6:44 0:48 0:14 2:25
Bid 5,715 2:24 4:38 0:50 0:10 2:553M Ask 11,936 2:15 7:58 0:37 0:13 1:59
Bid 12,784 2:34 5:35 0:40 0:09 2:496M Ask 21,834 1:17 3:45 0:24 0:08 1:14
Bid 25,454 1:40 3:32 0:29 0:08 1:411Y Ask 32,098 0:52 2:27 0:13 0:04 0:41
Bid 42,836 1:03 2:25 0:12 0:04 0:50GBP 1M Ask 6,824 5:16 19:59 1:03 0:18 3:17
Bid 4,880 2:05 5:57 0:32 0:12 2:013M Ask 7,217 5:44 25:38 0:53 0:15 3:32
Bid 8,327 4:34 10:52 1:18 0:16 4:576M Ask 20,819 2:11 9:03 0:29 0:09 1:29
Bid 18,310 1:38 5:25 0:28 0:09 1:281Y Ask 23,271 1:34 5:28 0:23 0:08 1:09
Bid 26,176 1:22 3:33 0:23 0:07 1:12JPY 1M Ask 2,461 4:08 8:42 1:51 0:29 4:40
Bid 4,079 5:40 17:08 1:32 0:23 3:463M Ask 6,562 4:35 13:39 1:41 0:27 4:44
Bid 5,483 3:45 11:02 0:45 0:14 2:406M Ask 8,283 6:24 48:33 1:55 0:31 5:56
Bid 5,486 2:59 9:34 0:36 0:12 2:011Y Ask 14,137 4:42 35:09 1:00 0:17 3:49
Bid 7,761 1:30 4:56 0:24 0:08 1:09
Note: A cluster consists of at least two profitable deviations from no-arbitrage in a row. The entries in the ‘Mean’ column denote the average durationof the clusters (based on the corresponding entries in the column ‘# Clusters’), while those in the ‘Median’ columns refer to the median duration of theclusters. The ‘Q1’ and ‘Q3’ columns present the first and the third quantiles of the duration of clusters, respectively. The ‘Std.dev’ column includessample standard deviations of the duration of the clusters.
6

Tabl
e8:
Bor
row
erA
rbitr
age
(BA
).D
escr
iptiv
est
atis
tics
ofde
viat
ions
a)A
llde
viat
ions
b)Pr
ofita
ble
devi
atio
nsA
nn.
Ann
.In
terq
uote
Exc
hang
era
teA
llde
v.M
ean
t-va
lue
Med
ian
mea
nPA
dev.
Shar
eM
ean
Med
ian
mea
ntim
e(s
ec)
EU
R1M
Ask
2,03
7,92
30.
010.
10.
00.
262
1,11
530
.48
%0.
220.
193
2.9
Bid
2,03
7,92
3-0
.14
-0.7
-0.1
-1.7
172,
451
8.46
%0.
240.
213
3.0
3MA
sk2,
068,
143
-0.0
1-0
.0-0
.0-0
.081
2,18
939
.27
%0.
580.
422
2.9
Bid
2,06
8,14
3-0
.31
-0.4
-0.3
-1.2
466,
835
22.5
7%
0.47
0.36
22.
96M
Ask
2,30
9,19
7-0
.37
-0.2
-0.2
-0.7
916,
229
39.6
8%
1.10
0.85
22.
5B
id2,
309,
197
-0.2
6-0
.2-0
.4-0
.583
8,83
736
.33
%1.
391.
053
2.5
1YA
sk2,
560,
419
-1.7
4-0
.4-1
.7-1
.779
8,02
531
.17
%2.
662.
023
2.3
Bid
2,56
0,41
90.
080.
00.
10.
11,
286,
227
50.2
4%
3.14
2.52
32.
3G
BP
1MA
sk2,
445,
312
-0.0
1-0
.0-0
.0-0
.186
9,16
635
.54
%0.
470.
336
2.5
Bid
2,44
5,31
2-0
.29
-0.6
-0.3
-3.5
325,
846
13.3
3%
0.42
0.24
52.
43M
Ask
2,45
0,66
0-0
.10
-0.0
-0.1
-0.4
1,02
2,27
941
.71
%1.
170.
785
2.4
Bid
2,45
0,66
0-0
.32
-0.2
-0.3
-1.3
864,
150
35.2
6%
1.08
0.75
42.
56M
Ask
2,59
4,61
00.
080.
00.
10.
21,
286,
415
49.5
8%
2.13
1.56
42.
3B
id2,
594,
610
-1.5
4-0
.5-1
.5-3
.161
4,68
023
.69
%1.
751.
314
2.3
1YA
sk2,
746,
288
-0.4
8-0
.1-0
.7-0
.51,
170,
922
42.6
4%
4.25
3.01
42.
2B
id2,
746,
288
-2.8
8-0
.5-2
.6-2
.973
6,58
726
.82
%3.
172.
413
2.2
JPY
1MA
sk80
4,88
5-0
.04
-0.1
-0.0
-0.5
224,
944
27.9
5%
0.28
0.24
39.
5B
id80
4,88
5-0
.20
-0.7
-0.2
-2.4
87,6
7910
.89
%0.
270.
203
7.1
3MA
sk81
8,53
7-0
.08
-0.1
-0.0
-0.3
332,
831
40.6
6%
0.56
0.43
28.
3B
id81
8,53
7-0
.42
-0.5
-0.5
-1.7
158,
389
19.3
5%
0.65
0.43
36.
46M
Ask
838,
047
-0.2
1-0
.1-0
.3-0
.433
9,89
340
.56
%1.
160.
942
7.1
Bid
838,
047
-0.8
0-0
.6-0
.8-1
.621
2,64
625
.37
%0.
960.
722
6.5
1YA
sk89
2,24
21.
710.
41.
91.
760
6,46
467
.97
%3.
673.
354
6.7
Bid
892,
242
-3.9
5-1
.1-4
.2-4
.012
7,66
814
.31
%2.
001.
512
6.6
Not
e:T
heco
lum
nhe
aded
by‘A
llde
v.’
pres
ents
the
num
bero
fall
profi
tabl
ean
dno
n-pr
ofita
ble
devi
atio
ns(c
f.de
finiti
ons
inTa
ble
2),w
hile
the
one
head
edby
‘PA
dev.
’re
cord
sth
enu
mbe
roft
hepr
ofita
ble
devi
atio
ns,i
.e.d
evia
tions
that
are
larg
erth
an1/
10of
api
p.E
ntri
esin
the
‘Sha
re’c
olum
nar
epr
ofita
ble
devi
atio
nsin
perc
ents
ofal
loft
hede
viat
ions
inco
lum
n‘A
llde
v.’.
The
‘Mea
n’an
d‘M
edia
n’co
lum
nspr
esen
tthe
aver
age
size
san
dm
edia
nva
lues
ofth
ede
viat
ions
,bot
hm
easu
red
inpi
ps.T
he‘A
nn.m
ean’
colu
mns
show
annu
aliz
edm
ean
valu
esof
the
peri
odre
turn
s(d
evia
tions
),re
port
edin
the
‘Mea
n’co
lum
ns.
Ann
ualiz
edva
lues
for
the
1-m
onth
,3-m
onth
and
the
6-m
onth
mat
uriti
esar
eob
tain
edby
mul
tiply
ing
the
(per
iod)
mea
nva
lues
by12
,4an
d2,
resp
ectiv
ely.
The
‘t-v
alue
issi
mpl
yth
e(p
erio
d)m
ean
valu
esdi
vide
dby
thei
rres
pect
ive
sam
ple
stan
dard
devi
atio
ns.T
he‘I
nter
quot
etim
e(s
ec)’
colu
mns
pres
entt
heav
erag
etim
ein
seco
nds
betw
een
two
cons
ecut
ive
devi
atio
ns.
Sam
ple:
Bas
edon
Reu
ters
tick
quot
es.F
eb.1
3–
Sep.
30,2
004,
wee
kday
s,be
twee
nG
MT
07:0
0an
d18
:00.
The
follo
win
gda
tes
have
been
rem
oved
:Apr
il2,
5–9,
12,M
ay3
and
31,J
une
17an
d18
,Aug
ust1
0,13
,24,
and
Sept
embe
r15.
7
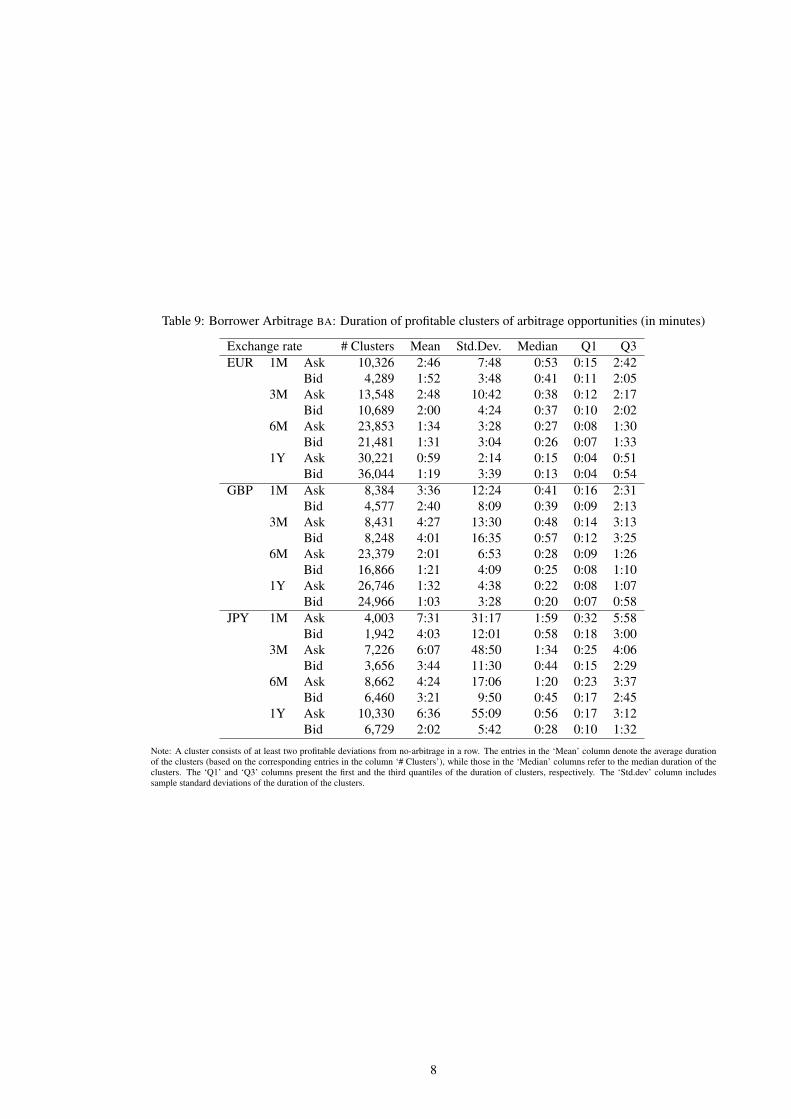
Table 9: Borrower Arbitrage BA: Duration of profitable clusters of arbitrage opportunities (in minutes)
Exchange rate # Clusters Mean Std.Dev. Median Q1 Q3EUR 1M Ask 10,326 2:46 7:48 0:53 0:15 2:42
Bid 4,289 1:52 3:48 0:41 0:11 2:053M Ask 13,548 2:48 10:42 0:38 0:12 2:17
Bid 10,689 2:00 4:24 0:37 0:10 2:026M Ask 23,853 1:34 3:28 0:27 0:08 1:30
Bid 21,481 1:31 3:04 0:26 0:07 1:331Y Ask 30,221 0:59 2:14 0:15 0:04 0:51
Bid 36,044 1:19 3:39 0:13 0:04 0:54GBP 1M Ask 8,384 3:36 12:24 0:41 0:16 2:31
Bid 4,577 2:40 8:09 0:39 0:09 2:133M Ask 8,431 4:27 13:30 0:48 0:14 3:13
Bid 8,248 4:01 16:35 0:57 0:12 3:256M Ask 23,379 2:01 6:53 0:28 0:09 1:26
Bid 16,866 1:21 4:09 0:25 0:08 1:101Y Ask 26,746 1:32 4:38 0:22 0:08 1:07
Bid 24,966 1:03 3:28 0:20 0:07 0:58JPY 1M Ask 4,003 7:31 31:17 1:59 0:32 5:58
Bid 1,942 4:03 12:01 0:58 0:18 3:003M Ask 7,226 6:07 48:50 1:34 0:25 4:06
Bid 3,656 3:44 11:30 0:44 0:15 2:296M Ask 8,662 4:24 17:06 1:20 0:23 3:37
Bid 6,460 3:21 9:50 0:45 0:17 2:451Y Ask 10,330 6:36 55:09 0:56 0:17 3:12
Bid 6,729 2:02 5:42 0:28 0:10 1:32
Note: A cluster consists of at least two profitable deviations from no-arbitrage in a row. The entries in the ‘Mean’ column denote the average durationof the clusters (based on the corresponding entries in the column ‘# Clusters’), while those in the ‘Median’ columns refer to the median duration of theclusters. The ‘Q1’ and ‘Q3’ columns present the first and the third quantiles of the duration of clusters, respectively. The ‘Std.dev’ column includessample standard deviations of the duration of the clusters.
8
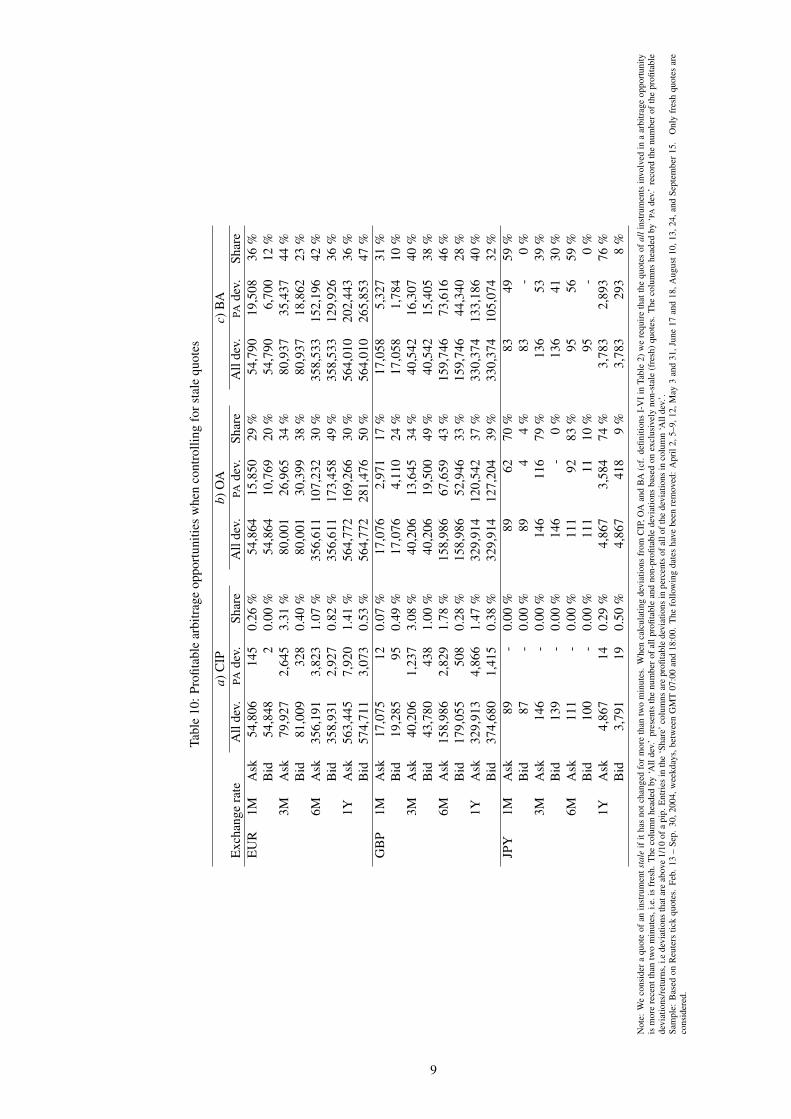
Tabl
e10
:Pro
fitab
lear
bitr
age
oppo
rtun
ities
whe
nco
ntro
lling
fors
tale
quot
es
a)C
IPb)
OA
c)B
AE
xcha
nge
rate
All
dev.
PAde
v.Sh
are
All
dev.
PAde
v.Sh
are
All
dev.
PAde
v.Sh
are
EU
R1M
Ask
54,8
0614
50.
26%
54,8
6415
,850
29%
54,7
9019
,508
36%
Bid
54,8
482
0.00
%54
,864
10,7
6920
%54
,790
6,70
012
%3M
Ask
79,9
272,
645
3.31
%80
,001
26,9
6534
%80
,937
35,4
3744
%B
id81
,009
328
0.40
%80
,001
30,3
9938
%80
,937
18,8
6223
%6M
Ask
356,
191
3,82
31.
07%
356,
611
107,
232
30%
358,
533
152,
196
42%
Bid
358,
931
2,92
70.
82%
356,
611
173,
458
49%
358,
533
129,
926
36%
1YA
sk56
3,44
57,
920
1.41
%56
4,77
216
9,26
630
%56
4,01
020
2,44
336
%B
id57
4,71
13,
073
0.53
%56
4,77
228
1,47
650
%56
4,01
026
5,85
347
%G
BP
1MA
sk17
,075
120.
07%
17,0
762,
971
17%
17,0
585,
327
31%
Bid
19,2
8595
0.49
%17
,076
4,11
024
%17
,058
1,78
410
%3M
Ask
40,2
061,
237
3.08
%40
,206
13,6
4534
%40
,542
16,3
0740
%B
id43
,780
438
1.00
%40
,206
19,5
0049
%40
,542
15,4
0538
%6M
Ask
158,
986
2,82
91.
78%
158,
986
67,6
5943
%15
9,74
673
,616
46%
Bid
179,
055
508
0.28
%15
8,98
652
,946
33%
159,
746
44,3
4028
%1Y
Ask
329,
913
4,86
61.
47%
329,
914
120,
542
37%
330,
374
133,
186
40%
Bid
374,
680
1,41
50.
38%
329,
914
127,
204
39%
330,
374
105,
074
32%
JPY
1MA
sk89
-0.
00%
8962
70%
8349
59%
Bid
87-
0.00
%89
44
%83
-0
%3M
Ask
146
-0.
00%
146
116
79%
136
5339
%B
id13
9-
0.00
%14
6-
0%
136
4130
%6M
Ask
111
-0.
00%
111
9283
%95
5659
%B
id10
0-
0.00
%11
111
10%
95-
0%
1YA
sk4,
867
140.
29%
4,86
73,
584
74%
3,78
32,
893
76%
Bid
3,79
119
0.50
%4,
867
418
9%
3,78
329
38
%
Not
e:W
eco
nsid
era
quot
eof
anin
stru
men
tsta
leif
itha
sno
tcha
nged
for
mor
eth
antw
om
inut
es.
Whe
nca
lcul
atin
gde
viat
ions
from
CIP
,OA
and
BA
(cf.
defin
ition
sI-
VI
inTa
ble
2)w
ere
quir
eth
atth
equ
otes
ofal
lins
trum
ents
invo
lved
ina
arbi
trag
eop
port
unity
ism
ore
rece
ntth
antw
om
inut
es,i
.e.i
sfr
esh.
The
colu
mn
head
edby
‘All
dev.
’pr
esen
tsth
enu
mbe
rof
allp
rofit
able
and
non-
profi
tabl
ede
viat
ions
base
don
excl
usiv
ely
non-
stal
e(f
resh
)qu
otes
.T
heco
lum
nshe
aded
by‘P
Ade
v.’
reco
rdth
enu
mbe
rof
the
profi
tabl
ede
viat
ions
/ret
urns
,i.e
devi
atio
nsth
atar
eab
ove
1/10
ofa
pip.
Ent
ries
inth
e‘S
hare
’col
umns
are
profi
tabl
ede
viat
ions
inpe
rcen
tsof
allo
fthe
devi
atio
nsin
colu
mn
‘All
dev.
’.Sa
mpl
e:B
ased
onR
eute
rstic
kqu
otes
.Fe
b.13
–Se
p.30
,200
4,w
eekd
ays,
betw
een
GM
T07
:00
and
18:0
0.T
hefo
llow
ing
date
sha
vebe
enre
mov
ed:
Apr
il2,
5–9,
12,M
ay3
and
31,J
une
17an
d18
,Aug
ust1
0,13
,24,
and
Sept
embe
r15
.O
nly
fres
hqu
otes
are
cons
ider
ed.
9

Tabl
e11
:Des
crip
tive
stat
istic
sof
profi
tabl
ear
bitr
age
oppo
rtun
ities
indu
ced
excl
usiv
ely
bych
ange
sin
mar
kets
wap
poin
ts
a)C
IPb)
OA
b)B
AE
xcha
nge
rate
PAde
v.Sh
are
ofde
v.M
ean
PAde
v.Sh
are
ofde
v.M
ean
PAde
v.Sh
are
ofde
v.M
ean
EU
R1M
Ask
303
15.3
%0.
2738
,661
8.1
%0.
2149
,249
7.9
%0.
22B
id17
23.3
%0.
2128
,636
9.5
%0.
2916
,669
9.7
%0.
243M
Ask
1,77
95.
9%
1.16
56,4
869.
3%
0.60
75,8
899.
3%
0.57
Bid
263
7.5
%0.
9671
,115
9.7
%0.
6445
,383
9.7
%0.
446M
Ask
2,49
119
.4%
1.34
130,
443
19.3
%1.
1418
1,38
319
.8%
1.13
Bid
1,74
020
.3%
2.38
217,
940
20.1
%1.
5116
4,65
619
.6%
1.40
1YA
sk3,
242
15.1
%4.
6217
5,30
724
.3%
2.27
200,
656
25.1
%2.
47B
id1,
756
19.6
%3.
3533
2,11
227
.0%
2.89
345,
188
26.8
%3.
13G
BP
1MA
sk81
72.
3%
0.36
24,8
652.
5%
0.53
20,3
822.
3%
0.47
Bid
498
3.0
%0.
688,
458
3.0
%0.
4310
,069
3.1
%0.
433M
Ask
1,44
52.
5%
5.47
28,4
522.
9%
1.67
29,1
772.
9%
1.28
Bid
689
2.9
%2.
9127
,917
2.7
%1.
1524
,012
2.8
%1.
076M
Ask
3,59
19.
5%
9.93
108,
035
9.0
%2.
8311
4,67
98.
9%
2.27
Bid
450
7.6
%1.
5473
,358
9.3
%2.
0158
,443
9.5
%1.
721Y
Ask
5,36
914
.1%
13.4
115
0,95
614
.5%
5.38
170,
678
14.6
%4.
32B
id59
913
.0%
2.48
150,
759
15.2
%3.
8011
4,05
915
.5%
3.10
JPY
1MA
sk75
4.9
%3.
226,
689
7.5
%0.
3521
,843
9.7
%0.
25B
id13
46.
5%
0.29
15,3
865.
6%
0.30
6,00
56.
8%
0.34
3MA
sk63
12.8
%14
.08
19,1
827.
6%
0.63
29,4
758.
9%
0.56
Bid
370
12.8
%1.
6516
,367
8.0
%0.
6710
,656
6.7
%0.
696M
Ask
132
18.4
%15
.13
41,8
089.
1%
1.45
28,9
078.
5%
1.25
Bid
188
4.5
%1.
5313
,495
9.6
%1.
1417
,945
8.4
%0.
891Y
Ask
806
23.7
%14
.36
77,0
0513
.4%
2.92
79,0
0113
.0%
3.64
Bid
557
12.8
%3.
6517
,206
14.7
%2.
3020
,152
15.8
%2.
01
Not
e:T
heco
lum
nshe
aded
by‘P
Ade
v.’
pres
entt
henu
mbe
rof
allp
rofit
able
devi
atio
nsth
atar
eex
clus
ivel
ydu
eto
chan
ges
inth
esw
appo
ints
quot
ed;c
f.th
ele
ft-h
and
side
sof
the
defin
ition
sI-
VI
inTa
ble
2.T
heir
num
bers
are
asu
bset
ofth
epr
ofita
ble
devi
atio
nsan
alyz
edin
Tabl
es4
(CIP
),6
(OA
)and
8(B
A).
The
colu
mns
head
edby
‘Sha
re’p
rese
ntth
epr
ofita
ble
devi
atio
ns(o
win
gex
clus
ivel
yto
chan
ges
inth
esw
appo
ints
)as
shar
esof
allo
fthe
profi
tabl
ede
viat
ions
anal
yzed
inTa
bles
4,6
and
8,re
spec
tivel
y.T
heen
trie
sin
the
‘Mea
n’co
lum
nsar
eav
erag
eva
lues
ofth
epr
ofita
ble
devi
atio
nsre
cord
edin
the
‘PA
dev.
’co
lum
ns.
Sam
ple:
Bas
edon
Reu
ters
tick
quot
es.
Feb.
13–
Sep.
30,2
004,
wee
kday
s,be
twee
nG
MT
07:0
0an
d18
:00.
The
follo
win
gda
tes
have
been
rem
oved
:A
pril
2,5–
9,12
,May
3an
d31
,Jun
e17
and
18,A
ugus
t10,
13,2
4,an
dSe
ptem
ber
15.
Onl
yde
viat
ions
whe
reon
lyth
esw
apis
quot
edis
cons
ider
ed.
10

Table 12: Estimation results for bivariate relationships between the characteristics of arbitrage opportunitiesand market pace
a) Frequency b) Size c) DurationIQ time Obs IQ time Obs IQ time Obs
CIP EUR 0.0045 834 0.0156 2,895 18.9986 2,895(5.47) (1.85) (25.16)
GBP 0.0025 894 0.0536 3,227 2.9681 3,227(2.87) (2.14) (1.84)
JPY 0.0025 386 0.0567 1,355 6.0933 1,355(8.67) (5.69) (20.24)
OA EUR -0.0001 11,341 0.0017 163,457 3.2868 163,457(-0.65) (4.75) (47.81)
GBP 0.0001 10,829 0.0011 117,518 0.5300 117,518(0.66) (2.17) (5.40)
JPY 0.0002 8,232 0.0002 55,250 2.2333 55,250(2.85) (0.73) (22.36)
CF EUR -0.0003 10,923 -0.0005 152,370 1.9772 152,370(-2.28) (-1.65) (30.13)
GBP 0.0002 10,523 0.0057 123,256 1.7557 123,256(1.35) (7.62) (11.42)
JPY 0.0002 7,569 0.0004 50,210 2.1745 50,210(2.64) (1.60) (17.35)
Note: OLS estimates of the intercept terms (positive, and statistically significant at the 5% level in all but one case) have not been reported for the sakeof brevity. Associated t-values are reported in parenthesis below the coefficient estimates. The column ‘Obs’ denotes the numbers of observations usedin estimation. Panel a) reports estimations for the bivariate relationship between frequency and interquote time (‘IQ time’). The dependent variable‘frequency’ is defined as the share of profitable deviations out of the total number of deviations in an business hour (containing profitable deviations)over the sample period, while ‘IQ time’, measured in seconds, is the average time between all of the (profitable and non-profitable) deviations used whencalculating the corresponding observation for the frequency. Panels b) and c) reports estimations for the bivariate relationships between the average sizeof profitable deviations (in pips) from clusters of profitable deviations and IQ-time, and duration of clusters of profitable deviations and IQ-time. Acluster consists of at least two profitable arbitrage opportunities in a row. The interquote time in the regressions for size and durations is the average timebetween the rows of profitable deviations constituting a profitable cluster.Sample: Based on Reuters tick quotes. Feb. 13 – Sep. 30, 2004, weekdays, between GMT 07:00 and 18:00. The following dates have been removed:April 2, 5–9, 12, May 3 and 31, June 17 and 18, August 10, 13, 24, and September 15.
11