arcgis data models: forestry data model -...
TRANSCRIPT

Forestry Data ModelForestry Data ModelForestry Data ModelForestry Data Model Data Model Workgroup June 2000
Forestry Spatial Interest Group
2
TABLE OF CONTENTSTABLE OF CONTENTSTABLE OF CONTENTSTABLE OF CONTENTSINTRODUCTION................................................................................................ 4
WHY INITIATE A DATA MODEL WORKGROUP?.................................. 4
WHAT WILL HAPPEN WITH THIS WHITE PAPER? .............................. 4
OBJECTIVE................................................................................................. 4
APPLICATION DESIGN OPTIONS.................................................................. 6
PROCESS .......................................................................................................... 6
FOREST MANAGEMENT FUNCTIONS AND DECISIONS .......................... 7
FOREST PATTERNS...................................................................................... 10
PACKAGE OVERVIEW............................................................................ 10
PATTERNS................................................................................................ 10
NOTATION ................................................................................................ 12
PLANIMETRY................................................................................................... 12
LAND RECORDS............................................................................................. 13
FEATURES................................................................................................ 13
OBJECTS .................................................................................................. 13
GROWING STOCK.......................................................................................... 15
FEATURES................................................................................................ 15
OBJECTS .................................................................................................. 17
SPATIAL ASSOCIATIONS....................................................................... 17
ACCESS MANAGEMENT............................................................................... 20
FEATURES................................................................................................ 20
OBJECTS .................................................................................................. 20
LOG PRODUCTION ........................................................................................ 22
FEATURES................................................................................................ 22
OBJECTS .................................................................................................. 22
SPATIAL ASSOCIATIONS....................................................................... 23

3
STEWARDSHIP............................................................................................... 24
FEATURES................................................................................................ 24
OBJECTS .................................................................................................. 25
SPATIAL ASSOCIATIONS....................................................................... 25
GROWING STOCK ALTERNATIVE .............................................................. 26
FEATURES................................................................................................ 26
OBJECTS .................................................................................................. 28
SPATIAL ASSOCIATIONS....................................................................... 28
APPENDIX........................................................................................................ 30
4
INTRODUCTION
WHY INITIATE A DATA MODEL WORKGROUP?
Forestry Users attending the 1999 ESRI Users Conference discussed presentations of Arc 8.0 and thegeodatabase technology. During those meetings, users expressed interest in forestry examples usingthe geodatabase model. Most forestry organizations have invested in the coverage data model and ithas been very successful. Because of that existing investment, several questions surfaced: How doesmy organization make the transition? When should we make the transition? How well are naturalresource requirements met in the geodatabase structure now? What can we do as a group tounderstand the technology and identify requirements? What are the potential benefits?
The Data Model Workgroup was formed to help address these questions as a concerted effort for theESRI user community in forest management organizations. The ESRI Olympia Office hosted the firstmeeting at their facility in May to begin the design process. This report documents the discussions andpreliminary design efforts.
WHAT WILL HAPPEN WITH THIS WHITE PAPER?
This document is an initial draft of data model concepts to support forest management. In this context,it is a preliminary report to further discussion and understanding of the new technology.
The Data Model Workgroup will distribute the White Paper for comment and discussion to the followingpeople:
• Members of the FSIG Data Model Workgroup, including those members unableto attend the first meeting.
• ESRI Software Development Staff
• General FSIG membership (following modifications based on discussions withESRI staff).
OBJECTIVE
ArcInfo 8.0 has introduced an object-oriented technology to support a new data model for geographicinformation. Geodatabase Data Access Objects, a subset of ArcObjects, provide the softwareframework for GIS database implementation. The ESRI software engineers have applied componentobject model standards to implement this framework. Through the ESRI software developmentprocess, engineers created a core set of software objects with properties and behaviors. The objectmodel diagrams document the software design patterns implemented to construct the new ArcInfo. Inobject engineering terminology, the patterns represent the software classes, their properties, theencapsulated functions (behaviors), and the association between the classes. In an operationalgeodatabase, the long-term properties of interest associated with the objects need to be retained (needto persist). The software architecture stores these properties in commercial relational database

5
management systems. Geodatabase data access objects in aggregate provide a framework1 to store,retrieve, manipulate, and modify the values of object properties. These objects are new tools availableto the GIS application architect.
From a user perspective, an application design is a decision process. In the older technology ofcoverages and map libraries, design options included tile structure, coverage type, and content offeature attribute tables. The geodatabase structure also supports construction of alternative datamodels with the framework defined by the core software. Design is a process to decide between datastructure options.
The results of the design decisions for an application are communicated through data model diagramsspecific to the problem. In this report, the diagrams are referred to as application design patterns, usingthe framework provided by ArcObjects. This term reinforces the fact that the applications work withinthe database structure of the geodatabase.
In addition to the benefit of communication, the data model diagrams created by CASE tools2 alsoprovide the mechanism to create a database schema in a relational database management system.The unified modeling language (UML) is an industry standard to support this process. One product ofthe workgroup will be an example schema designed for forest management.
The objectives of the FSIG Data Model Workgroup are:• Design an example geodatabase for forest management.• Document the example in a data model diagram (application design pattern).• Implement a physical representation of the model as a prototype created within a
personnel geodatabase.• Populate the geodatabase with data from an operational system.• Produce supporting documentation.• Encourage FSIG members to critique the prototype and identify needed
modifications.
The White Paper publication, and subsequent review, is a preliminary step in the development of theforest data model prototype.
1 Persistence framework2 CASE: computer assisted software engineering

6
APPLICATION DESIGN OPTIONS
The decisions addressed by an application design for a geodatabase are identified in Table 1.
• Table 1: Application Design Decisions
Functions What functions of the organization will be supported by the system?
Geodatabase One or many geodatabases?
Entities What entities will represent the operations of the organization?
Features Which entities are features (spatial objects)?
What is the spatial type of those features?
How will the features be represented in ArcInfo?
Is the feature an independent class or part of a dataset?
What are the fields and their data types?
Do the features have primary keys?
Do the features have subtypes?
Spatial ReferenceWhat is the spatial domain (coordinate minimum, maximum, elevation range,measure range)?
Objects What objects are defined (non-spatial)?
Does an object have a primary key? Subtypes?
What fields are included? What are the data types?
Is there an embedded foreign key?
Relationships What objects are related?
What is the type of relationship: simple, aggregation, composition, spatial?
Cardinality of the relationship?
Are there attributes for the relationship?
Custom Objects Are custom objects required to capture behavior or relationships?
PROCESS
The Data Model Workgroup is approaching the design as an iterative process, one of successiverefinement. In this context, the preliminary design focused on a specific organization context as a

7
starting point – an industrial forest management organization with financial and land stewardshipobjectives. The design process incorporates the steps identified as follows:
ANALYSIS
Identify Forest Management Functions & Decisions - What is the scope of functions tobe supported by the data model? What types of decisions are involved? Are therepriorities for the functional areas?Describe Forest Resource Geography - What are the essential entities (features andobjects) managed by the resource functions? What are the associations between theobjects? What are the unusual data characteristics that lead to distinct data modelpatterns for forest objects (compared to other applications)?DESIGN
Design a Logical Data Model, Forest Patterns - What is a conceptual data model,independent of implementation details?Design the Physical Implementation - How can the logical model be implemented incurrent geodatabase structure? Implement a Prototype in a personal geodatabase structure. Distribute a white paperand the personal geodatabase schema for evaluation.Revise and refine the model.
FOREST MANAGEMENT FUNCTIONS AND DECISIONS
Functions and decisions depend upon the management purpose of the organization. Whether anorganization is a government agency or a corporation (privately held or publicly owned) will influenceobjectives, functions and the criteria for decisions. GIS implementations will vary due to differences inorganizational context.
A forest products company is the organization context for the initial data model. The functions for thisorganization can be viewed as a production chain, with management constraints of space, time andresources (Figure 1). A company manages the forest resource as a business, with an emphasis on theefficient production of timber. Log sales (the upper right portion of the figure) generates the majority ofthe revenue for the business. Annual harvest and production levels are constrained by limiting factorswithin each of the resource functions. Over long periods of time (i.e., rotations for individual stands),land is acquired, trees grow, engineers design and construct roads, stands are harvested, logs aredelivered to customer destinations, and customers pay for the delivered product. The arrows betweenovals are increments of time; if these arrows were drawn to scale (with respect to time), the lengthwould vary from months in the upper portion of the figure, to decades for the management of growingstock

8
• Figure 1: Production Functions of an Industrial Forest Management Organization
.
Within this context, managers address three different types of decisions: operations, investment, andland stewardship.
1. Operations decisions: concerned with managing production costs within a 1-5year period, i.e. the operating expense to harvest a stand and deliver the logs to adestination.
2. Investment decisions: address the economic tradeoffs of investing in growingstock. Investments in growing stock include silvicultural activities and deferral ofharvest activity. Harvest is a divestment of the growing stock. The growing stocklevel determines future growth (shown in the figure with a recursive arrow).
3. Stewardship decisions: consider the ecosystem services that enable forests togrow. These services, although outside the pricing mechanism of a market, areinvaluable to the management of the resource.
The analysis identified map features that support the resource functions. In addition to the supportingmap features, the spatial measurements (area, length, distance) and associations were identified. Thefeatures, spatial measurements and associations address the question: What is so spatial about forestmanagement? The features were grouped in categories described below.
9
LOG PRODUCTION
Markets for log sales are geographic by definition. A market is a product price at a specific location andtime. Hauling costs from the stand to the mill or landing location impact influence market areas for logs.Distance is required to estimate costs, using two units of measure: road miles and round trip traveltime between the source and the destination. The source in this resource function is the stand and thedestination is the landing.
Operational planning for log production requires information on the appropriate equipment for the site.Slope, soil conditions, and stand structure contribute to the equipment allocation decision.
ACCESS MANAGEMENT
Log production requires road access and the maintenance of roads. A road inventory relies on location(absolute coordinates and relative location to specific locations) as well as the road length. Roadassessments use length and potential sediment per mile to estimate total sediment contribution in thewatershed by each of the roads.
GROWING STOCK MANAGEMENT
The timber resource is a valuable asset of a forest management organization. Inventory proceduresinclude methods to sample forest stands. Expansion factors for the statistical estimators aredetermined from the area defined by the inventory unit. Accurate area estimation is essential in an in-place inventory system.
Site productivity influences future growth of the stand and growth has a significant influence onmanagement plans. Physical site characteristics are one source to estimate forest productivity:relevant variables include geologic parent material, elevation, slope, aspect, and average annualprecipitation.
Harvest activity creates a requirement for effective forest regeneration. Matching an appropriate seedsource with the site conditions can improve the chances of plantation survival. Locations of seedsource trees, combined with spatial rules for their distribution, define geographic zones of seedsuitability.
LAND RECORDS
Land records identify the ownership of parcels within which inventory and management units areestablished.
SURVEYING AND MAPPING
Features in this category provide reference for timber stand delineation. These features are alsonecessary for base maps of the operating area.
10
STEWARDSHIP
Growing stock inventories are commodity-oriented surveys that measure existing vegetation. Otherrelatively stable characteristics that can describe the ecological structure of the forest are important. Anecological land classification combines multiple types of geographic data to characterize: solarexposure (derived form topography), soil nutrients, soil moisture, and potential natural vegetation.Management guidelines associated with the derived land classes can match a treatment regime withthe site and landscape conditions.
The Appendix includes a list of example map features in each of the resource function categories.
FOREST PATTERNS
PACKAGE OVERVIEW
The application design partitions the data model into subsets (packages in UML terminology). Thefigure below contains an overview of the model with dependencies (shown as arrows between thepackages). The features within each package comprise a feature dataset in the geodatabase. Thedependencies shown between the feature datasets indicate an order of precedence for databaseimplementation. The Growing Stock Package is the central hub of the data model. In order todelineate the growing stock management units within that package of the model, land records arerequired. The surveying and mapping package includes source features needed to produce landparcels.
Log Production depends upon inventory information from Growing Stock. This management functionalso requires the roads from Access Management to determine hauling distance between stands andthe customer destination.
The Access Management and Growing Stock models are dependent upon Stewardship features toassess the appropriate activities given the ecological structure and function of the landscape.
PATTERNS
In the world of object oriented software engineering, an understanding of patterns benefits the design ofan application. Resource management professionals work with patterns in forested landscapesthroughout the year. In this context, patterns reflect the spatial variation of a resource of interest. Ageographic database represents these patterns as one of several spatial types: point, line, polygon,surface, or raster.
For the software engineer, however, a pattern assumes a different meaning. Object oriented design isa method to assign responsibility to software classes. Which class should perform the functionspecified by the requirements analysis? UML notation is both a method to communicate the patternimplemented, and a software technology to assist with the implementation.
I could tell you how to make a dress by specifying the route of a scissors through a piece of cloth in terms of angles and lengthsof cut.
Or, I could give you a pattern. Reading the specification, you would have no idea what was being built or if you had built theright thing when you were finished.

11
The pattern foreshadows the product: it is the rule for making the thing, but it is also, in many respects, the thing itself.3
3 Software Patterns, Jim Coplien
Survey & Mapping
LandRecords
GrowingStock
Access
Log ProductionStewardship
Application Design Pattern Overview
12
Each of the packages in the data model contains a pattern that identifies the ‘thing’ we expect to make.The pattern foreshadows the geodatabase. The Data Model Workgroup anticipates that a catalog orknowledge base of patterns will be developed over time that solve database management andapplication problems within forest management GIS applications.
NOTATION
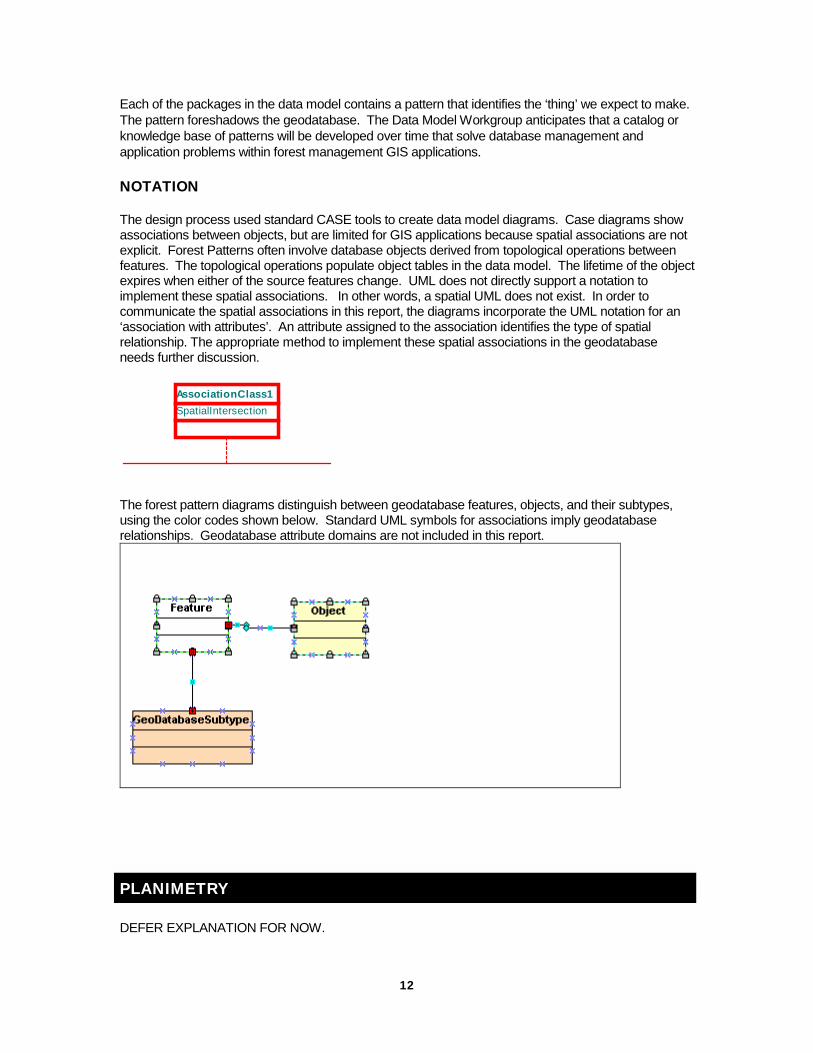
The design process used standard CASE tools to create data model diagrams. Case diagrams showassociations between objects, but are limited for GIS applications because spatial associations are notexplicit. Forest Patterns often involve database objects derived from topological operations betweenfeatures. The topological operations populate object tables in the data model. The lifetime of the objectexpires when either of the source features change. UML does not directly support a notation toimplement these spatial associations. In other words, a spatial UML does not exist. In order tocommunicate the spatial associations in this report, the diagrams incorporate the UML notation for an‘association with attributes’. An attribute assigned to the association identifies the type of spatialrelationship. The appropriate method to implement these spatial associations in the geodatabaseneeds further discussion.
Spatial IntersectionAssociationClass1
The forest pattern diagrams distinguish between geodatabase features, objects, and their subtypes,using the color codes shown below. Standard UML symbols for associations imply geodatabaserelationships. Geodatabase attribute domains are not included in this report.
PLANIMETRY
DEFER EXPLANATION FOR NOW.
13
LAND RECORDS
FEATURES
Parcels
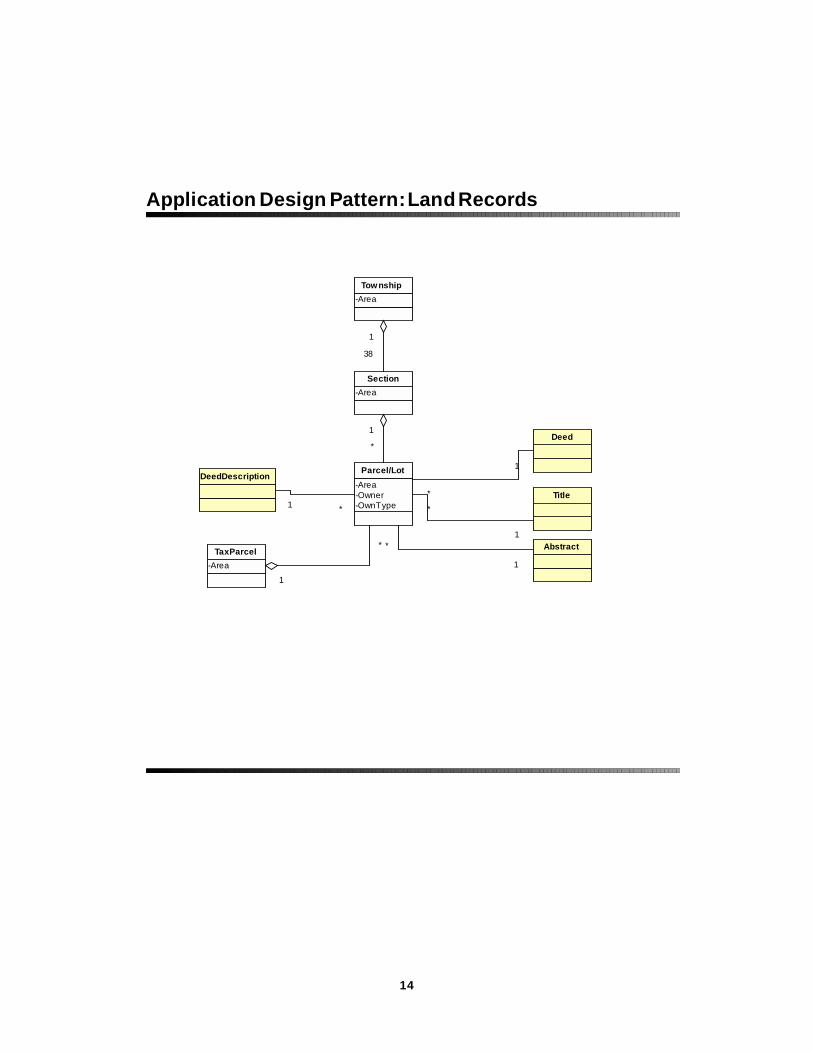
Legal parcels are the primary feature class of interest. Surveys provide the data source for parceldelineation. For those geographic regions covered by a public land survey system, the data structureincorporates a nested hierarchy of polygons. The hierarchy uniquely identifies individual parcels withinsurvey sections that reside within townships.
Tax Parcels
Local governments appraise land parcels for tax purposes. These features are aggregates of theindividual ownership parcels.
OBJECTS
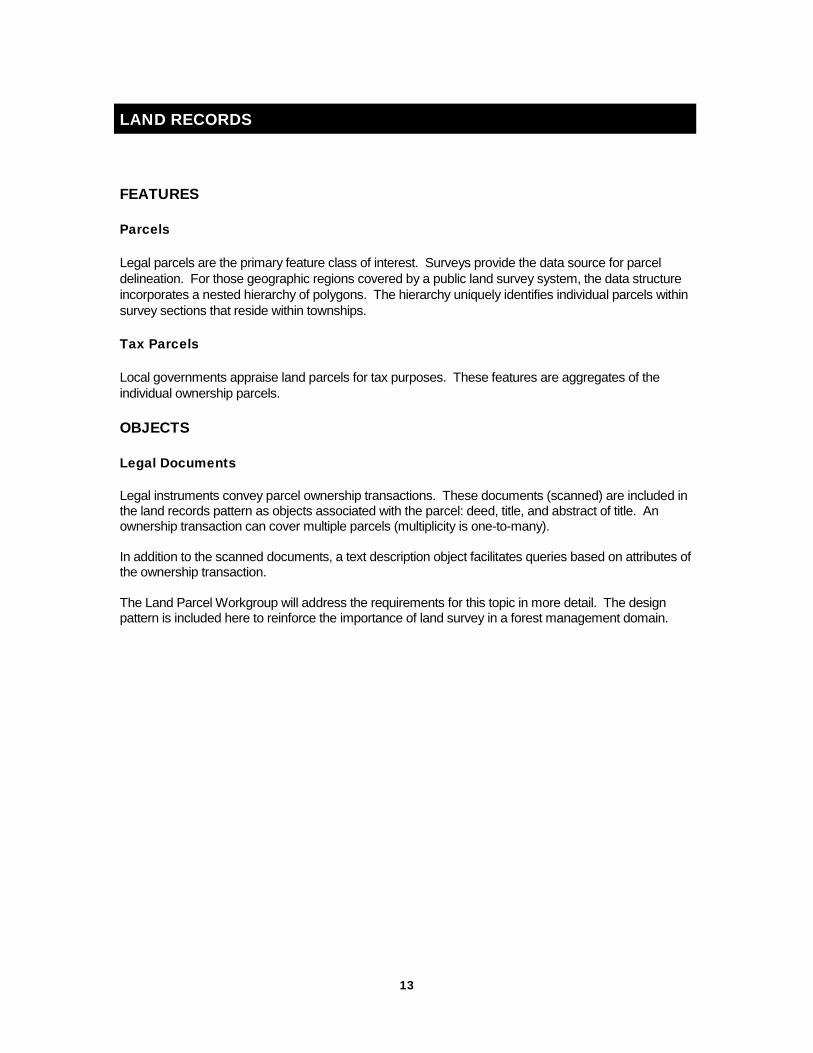
Legal Documents
Legal instruments convey parcel ownership transactions. These documents (scanned) are included inthe land records pattern as objects associated with the parcel: deed, title, and abstract of title. Anownership transaction can cover multiple parcels (multiplicity is one-to-many).
In addition to the scanned documents, a text description object facilitates queries based on attributes ofthe ownership transaction.
The Land Parcel Workgroup will address the requirements for this topic in more detail. The designpattern is included here to reinforce the importance of land survey in a forest management domain.
14
-AreaTownship
-AreaSection
1
38
-Area-Owner-OwnType
Parcel/Lot
1
*Deed
Title
Abstract
*
1
*
1*
1
DeedDescription
1 *
-AreaTaxParcel
1
*
Application Design Pattern: Land Records

15
GROWING STOCK
The growing stock model is the central feature dataset of importance for forest patterns. The patternfor the application model in forestry will vary depending upon organizational factors. In particular, thedefinition of forest inventory and management units will influence the design. In addition, the regulatoryenvironment will determine differences between implementations. For simplicity, the pattern describedin this report will follow an in-place inventory, stand management definition through all packages. Asubsequent section, however, describes an alternative pattern for the growing stock component of themodel.Three temporal perspectives are relevant in the growing stock data model: the current conditions asdescribed by recent inventories, past activities or stand history of silvicultural and harvest treatments,and future activities planned for the stand.FEATURES
Stand
Three stand delineation objectives for this example is:1. Sampling unit for the in-place inventory.2. A single next treatment for the stand.3. Field personnel are able to identify the feature on the ground.
This polygon feature class is the source for area (acres) that is the expansion factor applied to averagearea estimates produced from field surveys (see example stand delineation below).

16
• Figure 2 Example Stand Delineation
Activity
Activities reflect investment decisions that affect the growing stock. These investment projects do notalways coincide with stands. Fertilization projects, for example, may include multiple adjacent stands.Thinning activities frequently cover a sub area of the stand. The area of these polygon features isimportant information to evaluate project costs on a unit area basis. For these reasons, the data modelincludes activities as a feature class distinct from stands but within the same feature dataset.
Note also that geodatabase subtypes further classify the activities. 4
Administrative Hierarchy
Resource organizations with large land ownership typically administer the land within a hierarchy ofmanagement units. The units are polygon features, within a nested hierarchy. In other words, theresource geographer completely delineates the land area at the lowest common denominator (highestspatial resolution). This approach works well with a data structure that supports planar topologies.
4 Depending upon future software development direction, this approach may be sub optimal. Whenplanar topology is implemented in a future software release, an alternative structure should beevaluated.

17
Seed Tree
The annual cone collection work records point locations of seed trees. The seeds from these trees arethe source for future seedlings to regenerate the stands. The locations are important to determinesuitability of the seedlings on varying site conditions.
The seed tree also has a role to play in tracking plantation performance.
OBJECTS
Several descriptor objects characterize the current condition of the stand: growing stock volume andcruise status are two basic ones.
Growing Stock
The growing stock object describes stand structure and composition. Attribute values in this tabledescribe species composition and stand structure. The association between stand and growing stockis a multiplicity of one-to-many.
Cruise Status
The source for the stand structure and composition description is a cruise. The cruise status objectidentifies information about the field procedures: two example properties are date of the field sampleand the design selected by the field forester.
Planned Activities
This object describes the future treatments for the stand. It is an object associated with the stand, nota distinct map feature. The subtypes Harvest, Silviculture and Other further characterize the plannedactivities. The category named ‘other’ facilitates activity scheduling for tasks that may not directly affectthe growing stock in the stand (e.g., reconnaissance, running property lines).
Seed Inventory
The seed inventory object assists in planning greenhouse production based on forecasted harvestactivities. The association between stands and the seed inventory is a seedling request, or order,directed to the greenhouse.
Growth
Growth is a descriptor object that contains the predicted growth of the stand for a near-term planningperiod.SPATIAL ASSOCIATIONS
Stand and Physical Site
A spatial association between the stand and site description information allows the further description ofthe stand by physical factors influencing site productivity. Spatial associations derive thesecharacteristics of the stand from other map features (i.e., the data are not assigned by field personnel).A physical site model predicts productivity from these variables.

18
Stand and Historical Activity
The historical activities have a spatial association with the current stand features (intersection). Theassociation documents the investments in the stand by creating an object that tracks acres bytreatment.

19
-AreaStand
-Species-LogDiameter-Volume
GrowingStock
-Activity-PlannedYear
Planned Activities
-Type-Design-Date
CruiseStatus1
*
1
*
-Date-Area-TotalCost
Activity
-MethodFertilization
-MethodPCT
-MethodReleaseSpray
-MethodPlanting
-MethodSitePrep
Forest
Admin2
Admin1
1*
1*
1
*
AreaSpatialIntersect
StandActivity
Example hierarchy of administration.
Other
Silviculture
Harvest
SeedlingOrder
-Species-Year-Pounds
SeedInventory
«subsystem»CruiseProcessing
Estimated By
1
1
-Location-Species-Year
SeedTree
1*
-Elevation-Aspect-Slope-Geology-Precipitation
SiteDescription
StandSite
Application Design Pattern: Manage Growing Stock
PastPast
PresentPresent
FutureFutureGrowth
1
*
DependsOnExisting
***
**
**
**
** *
-MethodHarvestCompleted

20
ACCESS MANAGEMENT
FEATURES
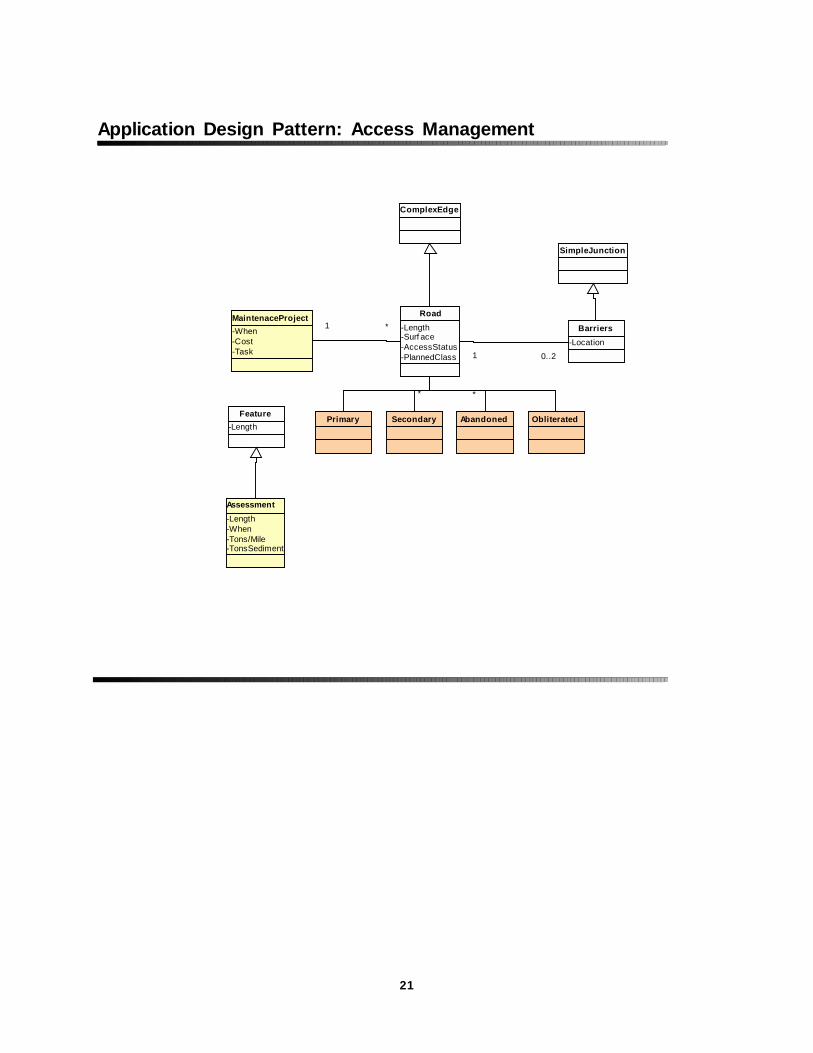
Road Subtypes
The road features are complex edges in a geometric network. Geodatabase subtypes discriminatebetween four classes of roads: primary, secondary, abandoned roads and obliterated roads. Additionalattributes describe road surface material, access status (controlled access or open), and any plannedchange in road class (planned construction, obliteration, or abandonment). This feature and the roadbarriers are components of a road inventory.
Barriers
Restricted access is necessary to minimize damage to road infrastructure and adjacent streams.Barriers are simple junctions connected geometrically by location to the road edges.
Road Assessment
Annual road assessments collect data to determine general condition and maintenance issues. Fieldsurvey crews collect the coordinates and descriptive attributes for this feature with a global positioningsystem receiver. Field crews repeat the assessment periodically to monitor progress on problemconditions. A model estimates sediment contribution in units of tons per mile. Total road lengthexpands this average to the total sediment contributed by the road feature.
OBJECTS
Maintenance/Budget
The road inventory and assessment work contributes background information for an annualmaintenance budget. This object defines the work to be completed, the cost, and the budget year.The object is also a record of completed maintenance. Road engineers plan maintenance onsegments of the road feature.
21
-Length-Surf ace-AccessStatus-PlannedClass
Road
-LocationBarriers
1 0..2
-When-Cost-Task
MaintenaceProject*1
ComplexEdge
SimpleJunction
-Length-When-Tons/Mile-TonsSediment
Assessment
-LengthFeature Primary Secondary Abandoned Obliterated
* *
Application Design Pattern: Access Management
22
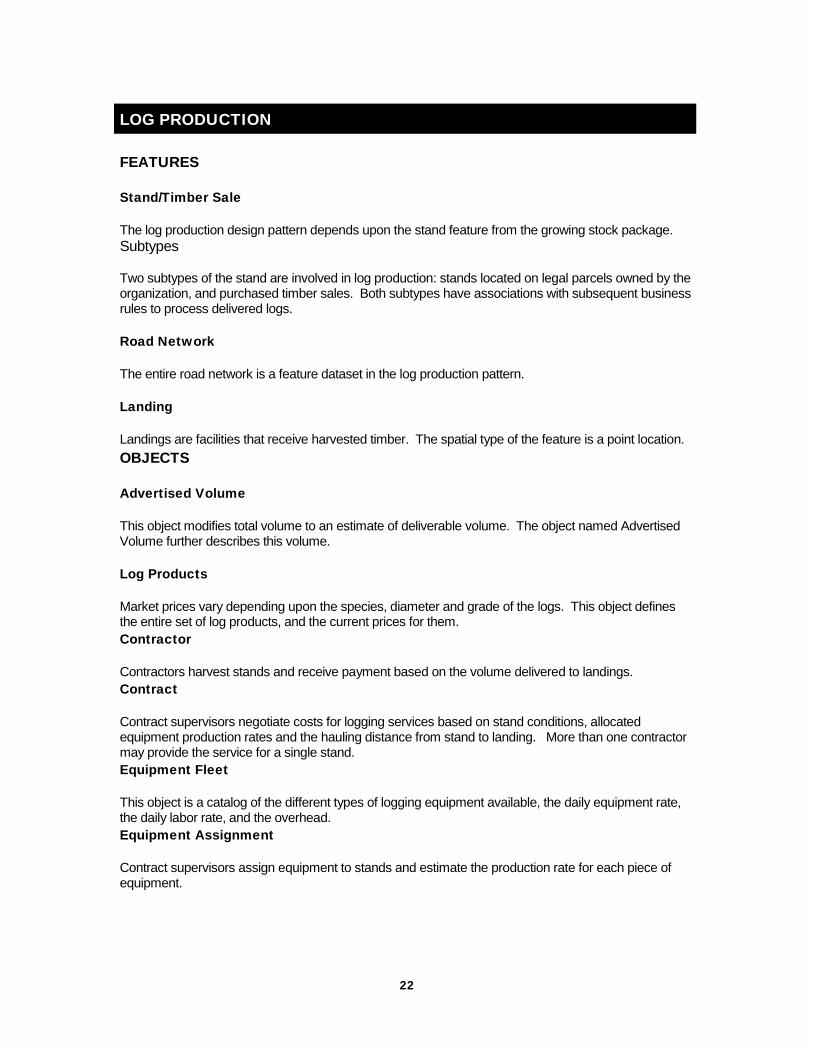
LOG PRODUCTION
FEATURES
Stand/Timber Sale
The log production design pattern depends upon the stand feature from the growing stock package.Subtypes
Two subtypes of the stand are involved in log production: stands located on legal parcels owned by theorganization, and purchased timber sales. Both subtypes have associations with subsequent businessrules to process delivered logs.
Road Network
The entire road network is a feature dataset in the log production pattern.
Landing
Landings are facilities that receive harvested timber. The spatial type of the feature is a point location.OBJECTS
Advertised Volume
This object modifies total volume to an estimate of deliverable volume. The object named AdvertisedVolume further describes this volume.
Log Products
Market prices vary depending upon the species, diameter and grade of the logs. This object definesthe entire set of log products, and the current prices for them.Contractor
Contractors harvest stands and receive payment based on the volume delivered to landings.Contract
Contract supervisors negotiate costs for logging services based on stand conditions, allocatedequipment production rates and the hauling distance from stand to landing. More than one contractormay provide the service for a single stand.Equipment Fleet
This object is a catalog of the different types of logging equipment available, the daily equipment rate,the daily labor rate, and the overhead.Equipment Assignment
Contract supervisors assign equipment to stands and estimate the production rate for each piece ofequipment.

23
SPATIAL ASSOCIATIONS
Distance
The three features (stands/timber sales, road network and landings) have a spatial relationship that is amajor component of the logging production pattern. The relationship is the distance across the roadnetwork from the stand to each feasible landing. Contractors can deliver log products to multiplelandings. Markets (manufacturing demands and available inventory) for species, size and gradeinfluence final destinations. Distance measures in units of travel time vary by road class and roadsurfacing.
-Location
Landing
Contractor
-Date-InspectionCategory-Rating
Inspection Report
1
*
-Function-EquipmentRate-LaborRate
EquipSpecifications
TypeProductionRatePercentArea
EquipmentAssigment
-Species-SeDIB-Volume-Year
AdvertisedVolume
1*
-Species-Diameter-Price
LogProductSpecs1*
TimberSale FeeOwnership
Distance* *
*
-Length-Surface-AccessStatus-PlannedClass
Access:: Road
-AreaGrowingStock::Stand
Application Design Pattern: Log Production
«subsystem»WoodProcurementSystem
Contract

24
STEWARDSHIP
Forest inventories in a business enterprise concentrate on the commodity-related characteristics of thestand. The structure (size classes) and composition (species) of the stand are important because oftheir economic value and growth potential. However, current vegetation is a relatively temporarycondition, a snapshot in the dynamics of the forest development. Inventory specialists generally did notdesign these surveys to characterize the ecological structure and function of the forest. The spatialpatterns and characteristics of forest stands are a reflection of past disturbance, management activity,and development stage.
• Figure 3 Components of Landscape Pattern
An ecological land classification describes the relatively stable land characteristics that are responsiblefor forest growth. An organization that understands the structure and function of their forest landscapescan benefit the long-term sustainability of their resource. The land class delineation captures thevariability between sites in terms of four ecological functions: solar exposure for photosynthesis, soilnutrient cycles (nutrient availability), water cycles (soil moisture), and community dynamics (potentialnatural vegetation). Spatial features that support ecological functions include digital elevation models,geologic parent material, soils, annual precipitation, and vegetation habitat type. The goal is to improveresource management decisions by incorporating guidelines based on land classification.FEATURES
Ecological Land Classification
The resource geographer represents the land classification as a nested hierarchy of polygon features.Researchers have suggested at least a three level system.

25
Regional climatic zones
Landscapes
Ecological management units
Stand
The stands (from the growing stock pattern) are an integral feature of the stewardship applicationpattern.OBJECTS
Guidelines
Knowing the land class is useful for management only if the land manager also has prescriptionguidelines for appropriate management activities. The land class provides the ecological framework toassess suitability of the stand for the intensity and frequency of activity. The object named Guidelinesdescribes appropriate treatment regimes for the land class.SPATIAL ASSOCIATIONS
Site Suitability
The spatial association between stand and the ecological land unit is a topological intersection. Theresult characterizes the stand by the percent area in the individual land classes. Combined with theGuideline object, this information describes suitable treatment regimes.
-Area-Landform-ParentMaterial
Landscape
-Area-SolarExposure(topography)-SoilNutrients-SoilMoisture-PotentialNaturalVegetation
EcologicalLandUnit
1
*
-AreaRegionalClimaticZone
1
* Over large geographic extents, the pattern extendsto entities larger than regional cl imatic zones.
-Area
GrowingStock::Stand
StandLandClass
ManagementGuidelines
1 *
Application Design Pattern: Stewardship

26
GROWING STOCK ALTERNATIVE
The second example for the growing stock pattern uses a photo type based inventory rather than an in-place inventory. In addition, this example includes multiple administrative units that represent ahierarchy, but not one of spatially nested polygons.
This example reflects the permitting and licensing situation for an operation in a Canadian province.
FEATURES
Growing Stock Activity Unit
The activity unit is a feature class with subtypes for different categories of activities. The activitiesshown are a subset of the total possible activities. The features are aggregated through relationshipclasses to features defined for administrative and reporting purposes.Harvest Unit
The harvest unit is a polygonal feature that may include several inventory units.
Inventory Unit
The inventory map feature is a polygon that contains relatively homogeneous timber. Approaches todefining these features vary. Vegetation classes of timber type, size, and density (derived from photointerpretation) are one method to delineate the features. The features collectively represent astratification of the forest for sampling. Inventory plots sample the features; field crews do not sampleall mapped units.
Planting Unit
Administrative or Reporting
A forest development plan (FDP) is an operational plan guided by the principles of integrated resourcemanagement (the consideration of timber and non-timber values), which details the logistics of timberdevelopment over a period of usually five years. There is a map product that is part of the FDP. Thisproduct represents an aggregate of cut blocks. Within an FDP, there may be multiple licenses. Eachlicense contains several cutting permits. The cutting permits are, in turn, comprised of one to severalcut blocks.
Within a cut block boundary, there are several internal boundaries specific to that cut block. Someexamples of internal boundaries are Treatment Units, Harvest Units & Planting Units. At the cut blocklevel the cut block boundary and some interior boundaries are used for Silviculture Prescription Maps.These maps give a detailed description of how the cut block will be harvested and treated post harvest.
A cut block boundary is comprised of an aggregate of interior units.

27
• Figure 4 Three Licenses within a Forest Development Plan
Figure 5 Two Cutting Permits Containing Multiple Cut Blocks

28
Figure 6 Cut Block with Interior BoundariesOBJECTS
Growing Stock
The sampling design provides estimates of the growing stock volume by the vegetation categoriesapplied to define the inventory units.
SPATIAL ASSOCIATIONS
Harvest Inventory Unit
The harvest unit growing stock volume is derived from the inventory units that are contained within it.The spatial association is an intersection between the features, producing a table of land area byinventory unit with the harvest unit.

29
-Area-Type-Size-Density
InventoryUnit
-Species-LogDiameter-Volume
GrowingStock
* 1
ForestPlanArea
-Year-Area-TotalCost
Harv estUnit
LicenseCuttingPermitCutBlock 1*1*1*
AreaSpatial Intersection
Harv estInventory
1
*
«subsystem»CruiseProcessing
Application Design Pattern Growing Stock Alternative
-Area-Date
GSActiv ity
-Year-Area-TotalCost
PlantingUnit

30
APPENDIX
Resource Function Category Entities
Land Stewardship Water Quality Stream Segments Road Assessment Road Segments Fisheries Stream Segments Game Management Game Unit Research/Monitoring Plot or Transect Forest Health Infested Sites Fire Control Dip ponds Pump sources Ecosystem Function Landscape Structures Mosaic Patches Corridors Ecological Land ClassLog Production Plan & Budget Administrative Units Landings/destinations EquipmentGrowing Stock Inventory Stand Silviculture History Project Harvest History Cutting Blocks Regeneration Seed Trees Greenhouse Productivity Land ClassesAccess Management Assessment Road segments Barriers/Gates Drainage Structures Permits, Easements Road Segments Cost Share Agreements Road segments Cost Share Area Road Inventory RoadsLand Records Taxes Tax Parcels Leases Grazing Allotments Mineral Other Permits Parcels Ownership ParcelsSurveying/Mapping Geology/Soils Map units Climate Precipitation Planimetry Survey Measures Survey Corners Utility Corridors Railroads Streams Rivers

31
Lakes Watersheds Ridges Special Sites Wetlands Buildings Control Points Elevation Aerial Photography