architectural wall systems safety and perception survey june 2008
DESCRIPTION
Architectural Wall Systems Safety and Perception Survey June 2008. Architectural Wall Systems Safety and Perception Survey Results Methodology. Perception Survey A tool to evaluate the effectiveness of AWS safety program and communication. Basis of Perception Survey - PowerPoint PPT PresentationTRANSCRIPT
Architectural Wall Systems Safety and Perception SurveyJune 2008

2
Architectural Wall SystemsSafety and Perception Survey ResultsMethodology
Perception Survey A tool to evaluate the effectiveness of AWS safety
program and communication.
Basis of Perception Survey A nine year study—“Using Behavioral Techniques to
Improve Safety Program Effectiveness” by Mr. Charles W. Bailey.
Study conclusion—This survey identifies major discrepancies in the perception of safety program elements between labor employees, supervisors and management.

3
Architectural Wall Systems Safety and Perception Survey ResultsMethodology con’t.
How was this administered? The survey was administered by Lockton Associate Brent
Mayhew with the assistance of AWS supervisors. Employees were surveyed at the Des Moines Location. 63 surveys were administered. In these meetings:
Employees were provided an explanation of the survey. Employees completed the surveys which were then collected
by the Lockton Associate to ensure confidentiality.
4
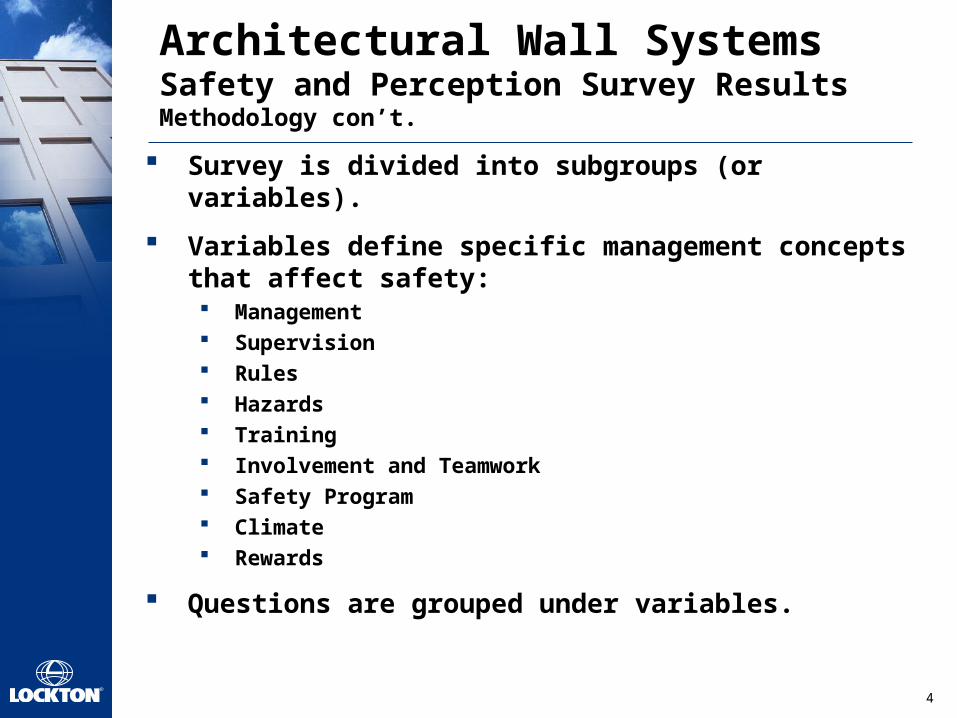
Architectural Wall Systems Safety and Perception Survey ResultsMethodology con’t.
Survey is divided into subgroups (or variables).
Variables define specific management concepts that affect safety: Management Supervision Rules Hazards Training Involvement and Teamwork Safety Program Climate Rewards
Questions are grouped under variables.

5
Architectural Wall Systems Safety and Perception Survey ResultsSurvey Sample

6
Architectural Wall Systems Safety and Perception Survey ResultsSurvey Demographics (Due to unanswered questions, Division Numbers will not sum to Overall Number)
Overall63
Manager11
Supervisor14
Non-Mgmt37
Overall63
Less than 613
6–1 YearNone
1-2 Years13
3-6 Years19
Over 6 Yrs18
Unanswered: 0
ByPosition
By Tenure
Unanswered: 1
Overall63
Full Time51
Temporary6
Part Time5
Unanswered: 1
By Status

7
Architectural Wall Systems Safety and Perception Survey Results Graph: Comparison By Position
.00 .07 .18 .02 .04 .07 .00 .07 .09

Transportation Presentation
Survey Results
9
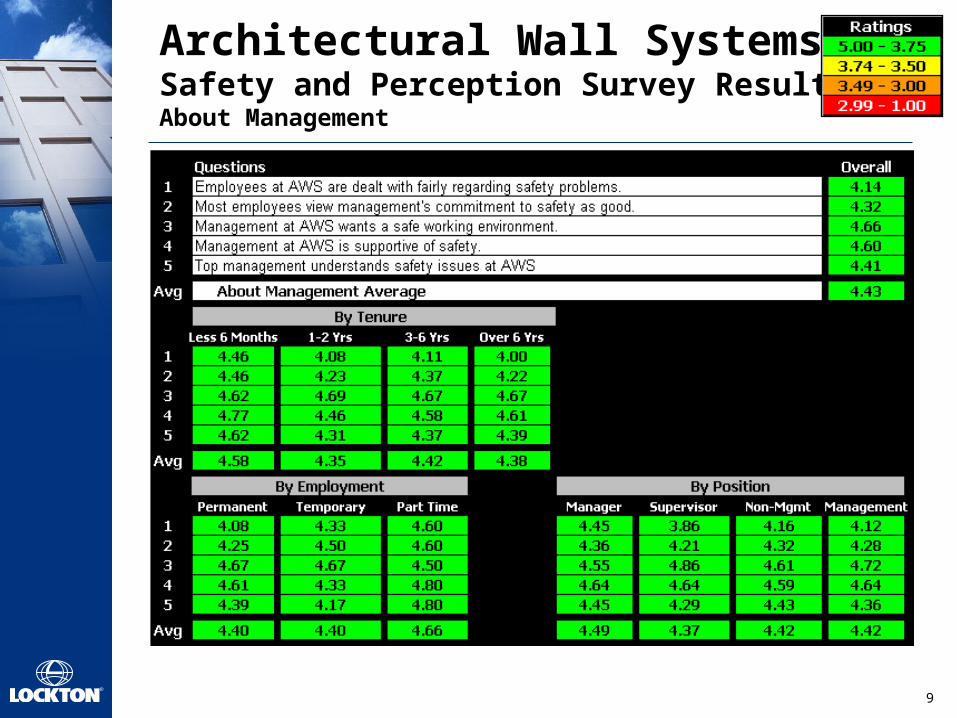
Architectural Wall Systems Safety and Perception Survey ResultsAbout Management

10
Architectural Wall Systems Safety and Perception Survey ResultsAbout Supervision

11
Architectural Wall Systems Safety and Perception Survey ResultsAbout Rules

12
Architectural Wall Systems Safety and Perception Survey ResultsAbout Hazards

13
Architectural Wall Systems Safety and Perception Survey ResultsAbout Training
14
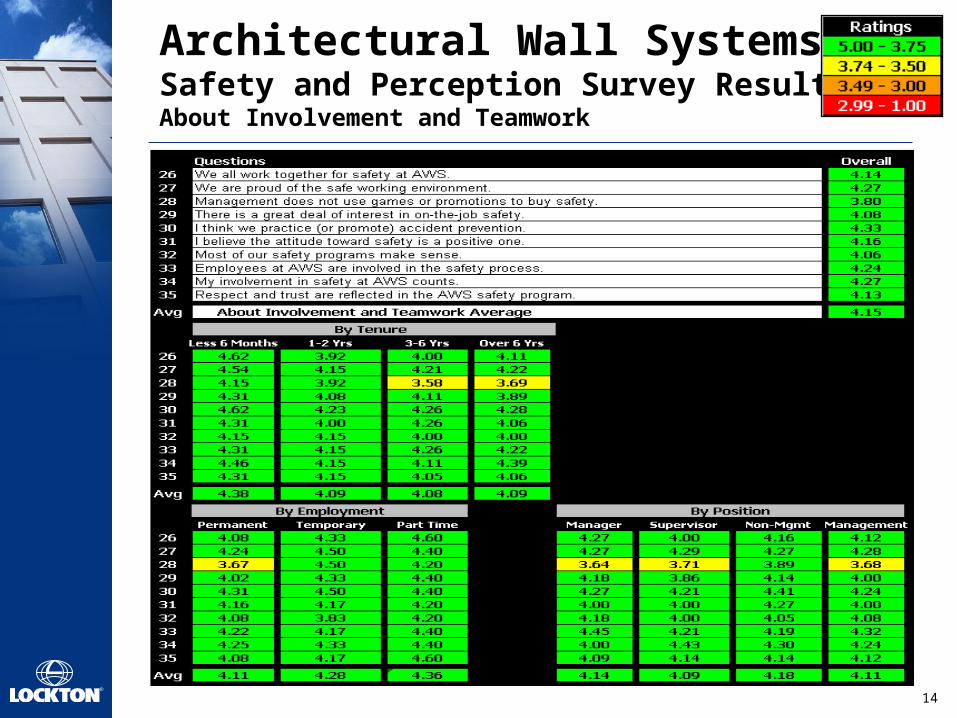
Architectural Wall Systems Safety and Perception Survey ResultsAbout Involvement and Teamwork

15
Architectural Wall Systems Safety and Perception Survey ResultsAbout The Safety Program

16
Architectural Wall Systems Safety and Perception Survey ResultsAbout Climate
17
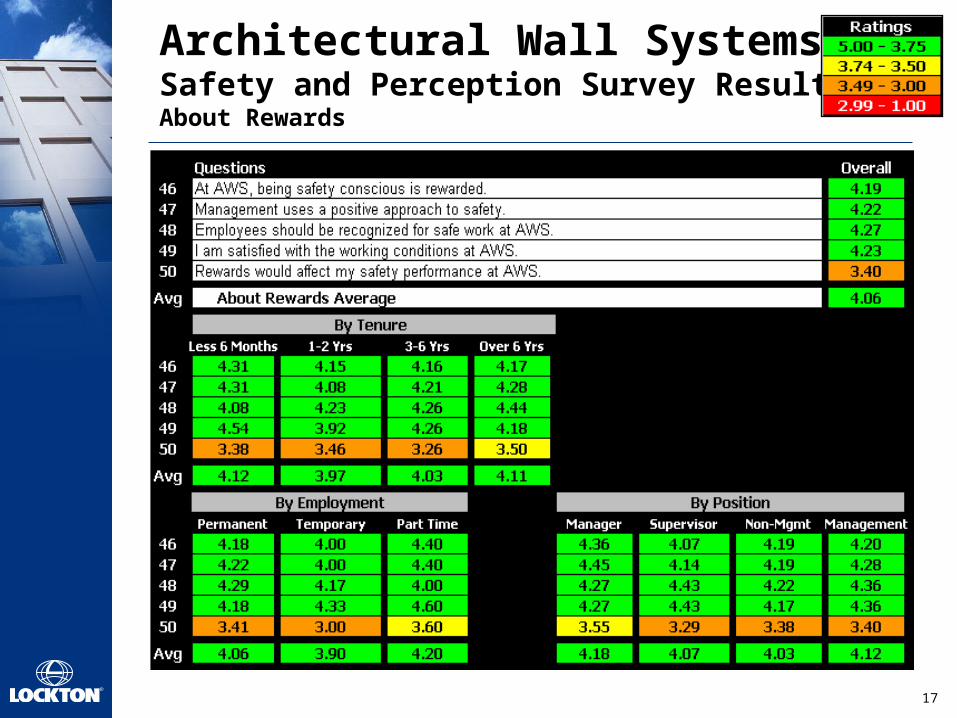
Architectural Wall Systems Safety and Perception Survey ResultsAbout Rewards
18
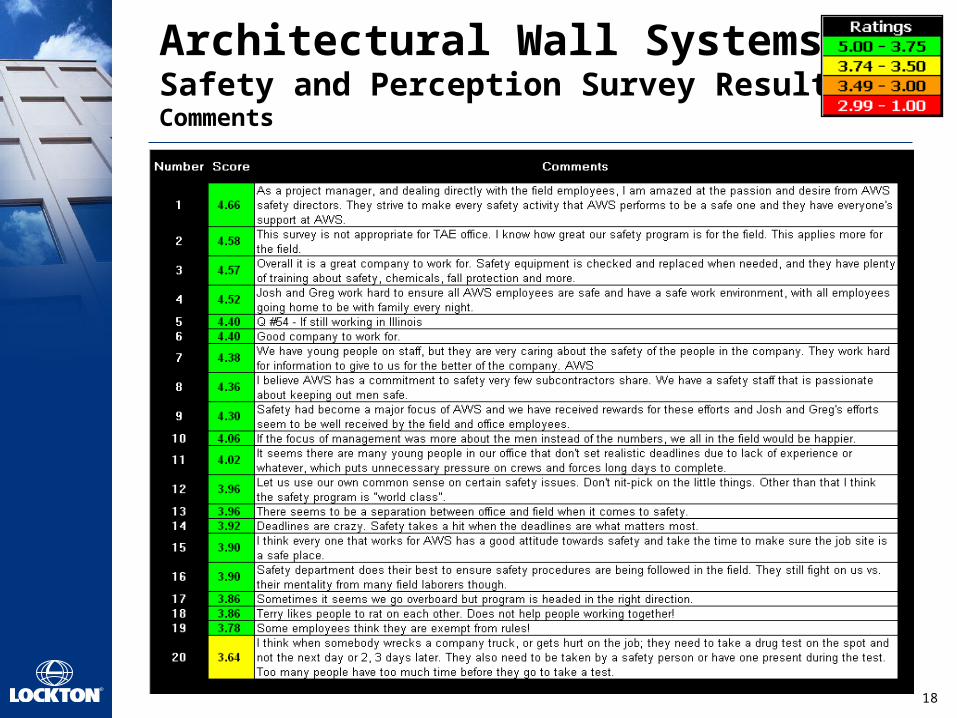
Architectural Wall Systems Safety and Perception Survey ResultsComments