architecture engineering & environmental services · aec industry overview across the industry,...
TRANSCRIPT
ARCHITECTURE ENGINEERING & ENVIRONMENTAL SERVICESEarnings Calls Synopsis – Results for Q2 2018 September 2018

7 Mile Advisors is a partner-led middle-market investment banking firm providing strategic M&A, private capital
transactions, and market insight for business owners, corporations, and private equity firms.
The 7MA team has completed over 120 transactions in professional and technical services. We provide pragmatic
advice, sector expertise, and innovative processes to help clients adeptly navigate the decision tree. Our high-touch
processes with senior-led deal teams is the cornerstone of the 7MA process.
Select Recent Transactions
ABOUT 7 MILE ADVISORS
2
We are pleased to present our review and synopsis of results and earnings
call commentary for Q2 2018. This summary includes the most recent
financial results for key publicly traded companies in the Architecture,
Engineering & Environmental Services sector for the period April – June
2018.
M&A & Industry Indicators:
+ Multiples remain strong – publicly traded AEC companies averaging
nearly 14.0x EBITDA. WSP's recent acquisition of Louis Berger Group at
nearly 9.0x EBITDA further supports market optimism.
+ Infrastructure funding referendums are on the ballot in multiple states.
Harris County, Texas' recent passing of $2.5B in bonds for flood control
projects signals commitment to funding infrastructure.
Trends to Watch – Relevant Articles:
+ Ten Years of AEC Industry Consolidation: How ENR's Top Design FirmsHave Changed
7 Mile Advisors appreciates the opportunity to present this confidential information to the Company. This document is meant to bedelivered only in conjunction with a verbal presentation, and is not authorized for distribution. Please see the Confidentiality Notice &Disclaimer at the end of the document. All data cited in this document was believed to be accurate at the time of authorship and camefrom publicly available sources. Neither 7 Mile Advisors nor 7M Securities make warranties or representations as to the accuracy orcompleteness of third-party data contained herein. This document should be treated as confidential and for the use of the intendedrecipient only. Please notify 7 Mile Advisors if it was distributed in error.
IN THIS ISSUE
Summary
7MA Deal Spotlight
Players in the Industry
SUMMARY
3
7MA DEAL SPOTLIGHT
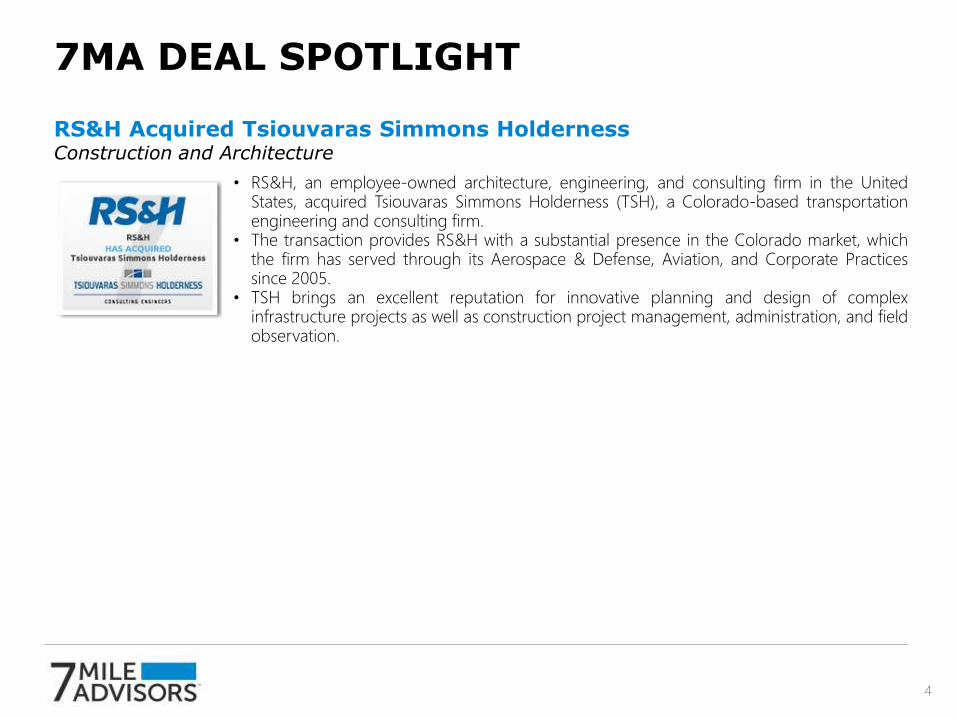
RS&H Acquired Tsiouvaras Simmons HoldernessConstruction and Architecture
• RS&H, an employee-owned architecture, engineering, and consulting firm in the UnitedStates, acquired Tsiouvaras Simmons Holderness (TSH), a Colorado-based transportationengineering and consulting firm.
• The transaction provides RS&H with a substantial presence in the Colorado market, whichthe firm has served through its Aerospace & Defense, Aviation, and Corporate Practicessince 2005.
• TSH brings an excellent reputation for innovative planning and design of complexinfrastructure projects as well as construction project management, administration, and fieldobservation.
4

PLAYERS IN THE INDUSTRY
5

AEC INDUSTRY OVERVIEWAcross the industry, AEC firms are looking at record levels of backlog andcontinue to see strong revenue growth year-over-year. Virtually all sectorsare contributing, including transportation, buildings, water, energy & power,environmental, and industrials. This performance has led to strong valuationfor publicly traded firms (nearly 14.0x EBITDA on average) and is translatingdown to healthy multiples in dealmaking among private firms. WSP's $400million deal for Louis Berger Group at nearly 9.0x EBITDA provided anothervaluation guidepost for industry dealmaking.
Industry firms remain focused on advancing their technology portfoliosthrough M&A, with firms like Arcadis, Jacobs, SNC-Lavalin, and Tetra Tech allrecently adding software, IT services, or technology-focused firms undertheir respective umbrellas.
Private equity remains keenly interested in the sector with continued activityboth in new portfolio companies and in add-on acquisitions to existingplatforms. Notably, Ardurra-King Engineering (backed by private equitygroup RTC Partners) added PCA Global, RTC's sixth transaction in theindustry.
6
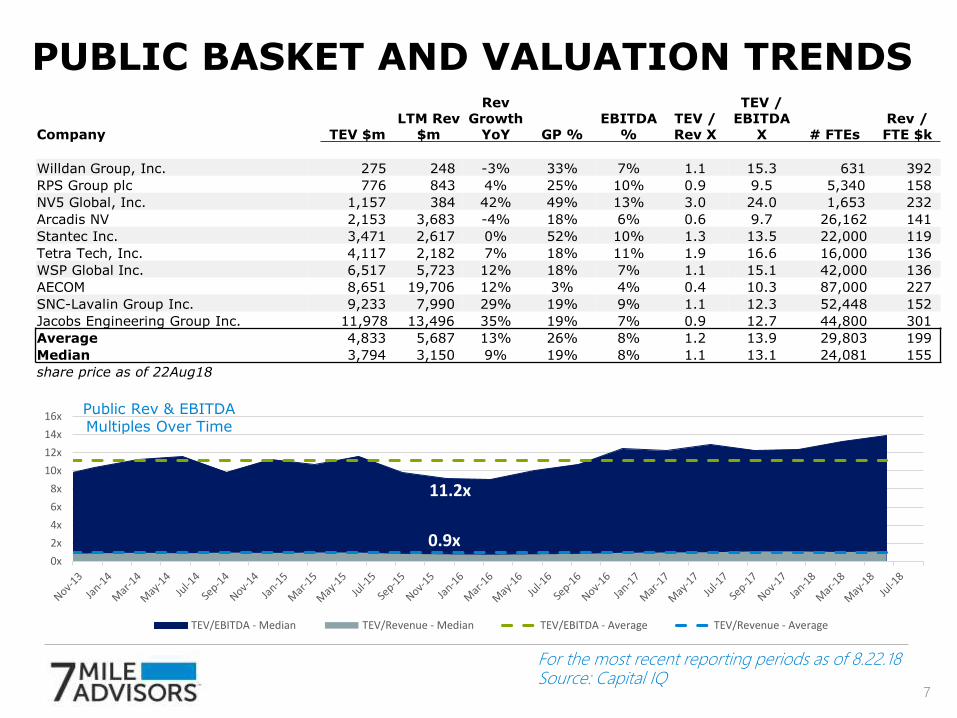
PUBLIC BASKET AND VALUATION TRENDS
For the most recent reporting periods as of 8.22.18Source: Capital IQ
Public Rev & EBITDA Multiples Over Time
7
Company TEV $mLTM Rev
$m
Rev Growth
YoY GP %EBITDA
%TEV / Rev X
TEV / EBITDA
X # FTEsRev / FTE $k
Willdan Group, Inc. 275 248 -3% 33% 7% 1.1 15.3 631 392
RPS Group plc 776 843 4% 25% 10% 0.9 9.5 5,340 158
NV5 Global, Inc. 1,157 384 42% 49% 13% 3.0 24.0 1,653 232
Arcadis NV 2,153 3,683 -4% 18% 6% 0.6 9.7 26,162 141
Stantec Inc. 3,471 2,617 0% 52% 10% 1.3 13.5 22,000 119
Tetra Tech, Inc. 4,117 2,182 7% 18% 11% 1.9 16.6 16,000 136
WSP Global Inc. 6,517 5,723 12% 18% 7% 1.1 15.1 42,000 136
AECOM 8,651 19,706 12% 3% 4% 0.4 10.3 87,000 227
SNC-Lavalin Group Inc. 9,233 7,990 29% 19% 9% 1.1 12.3 52,448 152
Jacobs Engineering Group Inc. 11,978 13,496 35% 19% 7% 0.9 12.7 44,800 301
Average 4,833 5,687 13% 26% 8% 1.2 13.9 29,803 199
Median 3,794 3,150 9% 19% 8% 1.1 13.1 24,081 155
share price as of 22Aug18
11.2x
0.9x0x
2x
4x
6x
8x
10x
12x
14x
16x
TEV/EBITDA - Median TEV/Revenue - Median TEV/EBITDA - Average TEV/Revenue - Average
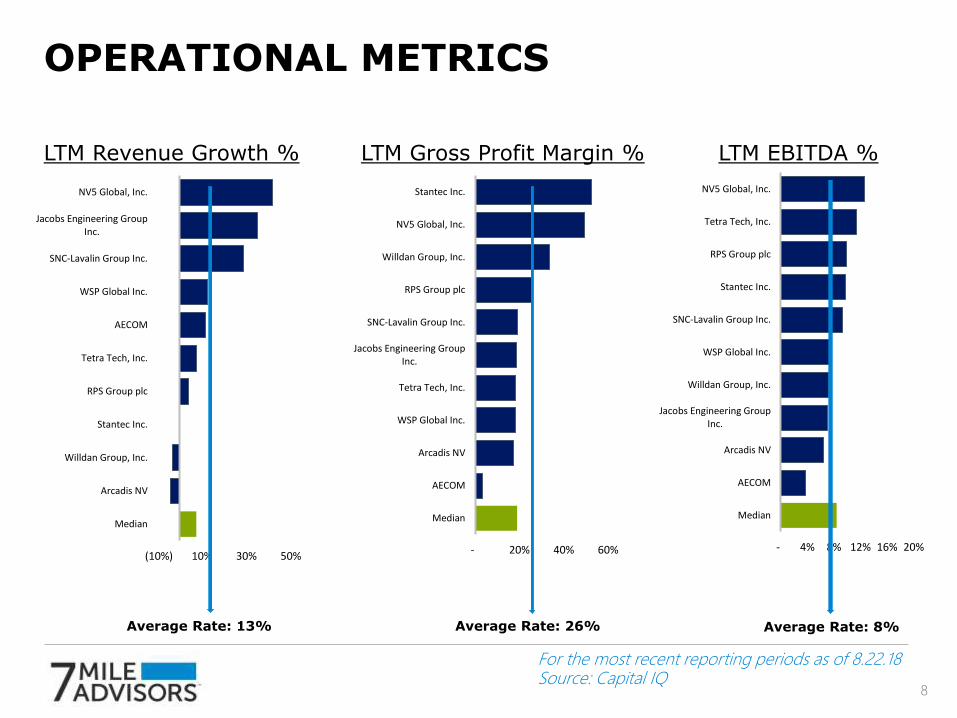
OPERATIONAL METRICS
For the most recent reporting periods as of 8.22.18Source: Capital IQ
Average Rate: 13% Average Rate: 26% Average Rate: 8%
LTM Gross Profit Margin % LTM EBITDA %LTM Revenue Growth %
8
(10%) 10% 30% 50%
Median
Arcadis NV
Willdan Group, Inc.
Stantec Inc.
RPS Group plc
Tetra Tech, Inc.
AECOM
WSP Global Inc.
SNC-Lavalin Group Inc.
Jacobs Engineering GroupInc.
NV5 Global, Inc.
- 4% 8% 12% 16% 20%
Median
AECOM
Arcadis NV
Jacobs Engineering GroupInc.
Willdan Group, Inc.
WSP Global Inc.
SNC-Lavalin Group Inc.
Stantec Inc.
RPS Group plc
Tetra Tech, Inc.
NV5 Global, Inc.
- 20% 40% 60%
Median
AECOM
Arcadis NV
WSP Global Inc.
Tetra Tech, Inc.
Jacobs Engineering GroupInc.
SNC-Lavalin Group Inc.
RPS Group plc
Willdan Group, Inc.
NV5 Global, Inc.
Stantec Inc.

VALUATION
For the most recent reporting periods as of 8.22.18Source: Capital IQ
Average: 1.2x Average: 13.9x Average: 26.9x
TEV / LTM EBITDA Price / LTM EarningsTEV / LTM Revenue
9
0x 1x 2x 3x
Median
AECOM
Arcadis NV
Jacobs EngineeringGroup Inc.
RPS Group plc
Willdan Group, Inc.
WSP Global Inc.
SNC-Lavalin GroupInc.
Stantec Inc.
Tetra Tech, Inc.
NV5 Global, Inc.
0x 10x 20x 30x
Median
RPS Group plc
Arcadis NV
AECOM
SNC-Lavalin Group Inc.
Jacobs Engineering GroupInc.
Stantec Inc.
WSP Global Inc.
Willdan Group, Inc.
Tetra Tech, Inc.
NV5 Global, Inc.
0x 10x 20x 30x 40x 50x
Median
Arcadis NV
Willdan Group, Inc.
Tetra Tech, Inc.
Stantec Inc.
SNC-Lavalin Group Inc.
NV5 Global, Inc.
Jacobs Engineering GroupInc.
WSP Global Inc.
AECOM

10
Commentary“Just one year since we announced the CH2M acquisition, our integration istracking ahead of our plan and we are increasing our cost synergies target to$175 million from $150 million.”—Steven J. Demetriou, CEO
HighlightsFor the quarter ended June 30, 2018:• Jacobs continues to experience strong demand across both its Aerospace,
Technology, Environmental and Nuclear line of business (ATEN); and itsBuildings, Infrastructure and Advanced Facilities business (BIAF). In addition,supply-demand fundamentals are strengthening in its Energy, Chemicals andResources (ECR) sector, where Jacobs is taking a disciplined approach tocapturing opportunities in an improving market.
• Jacobs saw an acceleration in field services backlog, which was driven by anincrease in major water infrastructure and life sciences design-build projects.
• Jacobs posted a strong quarter in ATEN with revenue reaching $1.2 billion, up24% YoY. The successful ramp-up of previously awarded major wins,including the Missile Defense Agency and Special Operations Command, arekey drivers to this double-digit revenue and profit growth.
• From an end market standpoint, Jacobs is benefiting from plus-ups across itsmajor government customers such as the Department of Defense,Department of Energy, intelligence community, and NASA. Within Jacobs’commercial markets, the 5G wireless build-out continues to provide a robustopportunity for growth with another AT&T win in the quarter.
• Overall, Jacobs is experiencing strong demand, driven by population growth,aging infrastructure and increased urbanization, with robust growth in theU.S., Middle East, and Asia markets. The U.K. is holding steady in spite ofuncertainty in that region. Specifically in the U.S., which makes up over half ofBIAF revenue, the company is seeing particular strength in the West Coast,Texas, and in the Southeast.
News• SATORP Awards Jacobs General Engineering
Services Contract, to provide general engineeringservices at SATORP's facilities in Jubail IndustrialCity 2 on the Arabian Gulf coast.
• Jacobs Signs Three-Year, Multi-Site Maintenanceand Construction Contract with Mosaic Fertilizer,LLC, to provide small capital construction andmaintenance services at its Uncle Sam and Faustinafacilities in St. James Parish, Louisiana.
Source: Q2 Earnings Report, CIQ, PR
Revenue ($Million)
Revenue by Segment ($Million)
ATEN
$1,221.3
BIAF
$1,707.1
Energy,
Chemicals &
Resources$1,228.3
$4,156.7
$2,514.8
$-
$500.0
$1,000.0
$1,500.0
$2,000.0
$2,500.0
$3,000.0
$3,500.0
$4,000.0
$4,500.0
Q2 2018 Q2 2017

11
Commentary“We are entering the third quarter of 2018 with a strong backlog, a number ofrecently signed master service agreements and a high quality prospects listacross our key sectors and geographies; poised for a strong second half of2018.”—Neil Bruce, CEO, President and Director
HighlightsFor the quarter ended June 30, 2018:• SNC-Lavalin's new awards were strong in the second quarter, mainly from
Infrastructure, which included the IDM project awards, as well from EDPM,which included many new reimbursable service contracts.
• SNC-Lavalin launched a process to potentially sell 6.76% of theirinvestment in Highway 407. The reason for the 6.76% is that SNC-Lavalinwishes to retain 10% under position as a strategic investor. The companybelieves that the value realized through this potential transaction willdemonstrate and augment the valuation of its capital investments and willconcurrently help the market to value SNC-Lavalin's E&C business moreaccurately.
• SNC-Lavalin recorded a net expense of $88 million as it settled the legacyclass action lawsuits brought back in 2012.
• The company also gained $63 million on the successful transfer of itsinvestment on the McGill hospital to the SNC-Lavalin InfrastructurePartnership.
• SNC-Lavalin sees a wide variety of attractive prospects and opportunitiesin copper, gold, fertilizer and commodities related to batteries for electricvehicles, mobile phones, and other electronic devices. It is currentlyworking on bids or awaiting responses on a significant portfolio ofprojects. Considering the current increase in market demand and apromising pipeline, this sector is poised for continued growth in the future.
News• SNC-Lavalin Group Inc. announced a private
placement of floating rate series 5 debentures due2019 for CAD 150,000,000 on June 1, 2018. Thedebentures will be issued at par and closing isexpected to occur on or about June 6, 2018,subject to customary closing conditions.
• Atkins, a member of the SNC-Lavalin Group, hasbeen appointed to provide Southern Water withenhanced Developer Services using the latesttechnology in robotic process automation.
Source: Q2 Earnings Report, CIQ, PR
Revenue (CAD Million)
Revenue by Segment (CAD Million)
Mining &
Metallurgy
$137.5 Oil & Gas
$657.1
Nuclear
$233.4
Clean Power
$76.3 Thermal Power
$7.5
Infrastructure
$551.4
Engineering,
Design and
Project Management
$806.8
Capital
$57.2
$2,527.1 $1,934.9
$-
$500.0
$1,000.0
$1,500.0
$2,000.0
$2,500.0
$3,000.0
Q2 2018 Q2 2017
12
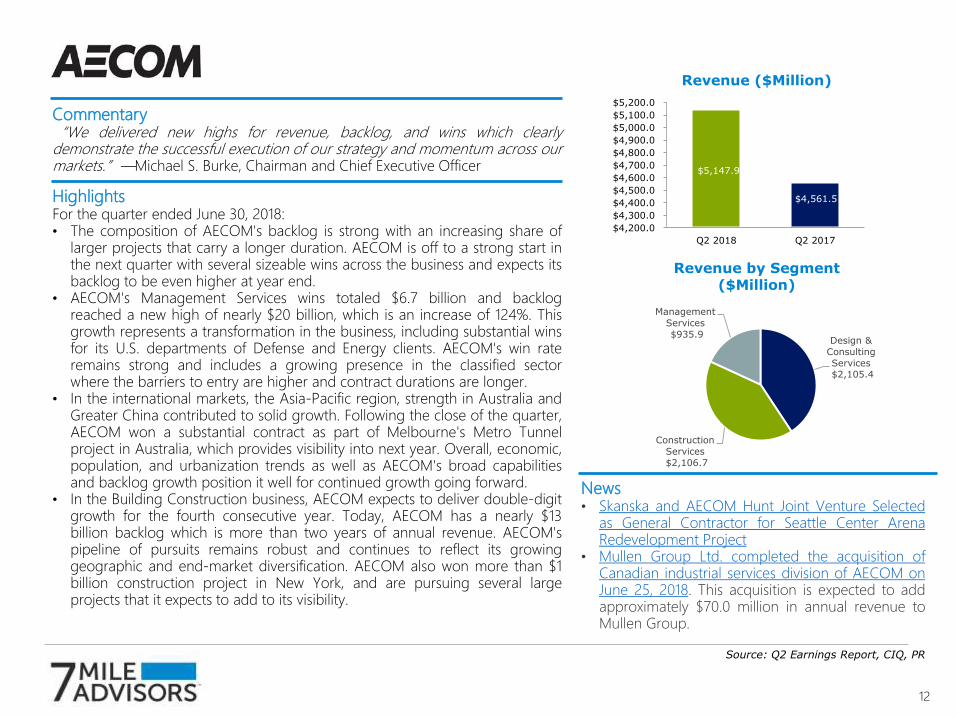
Commentary“We delivered new highs for revenue, backlog, and wins which clearlydemonstrate the successful execution of our strategy and momentum across ourmarkets.”—Michael S. Burke, Chairman and Chief Executive Officer
HighlightsFor the quarter ended June 30, 2018:• The composition of AECOM's backlog is strong with an increasing share of
larger projects that carry a longer duration. AECOM is off to a strong start inthe next quarter with several sizeable wins across the business and expects itsbacklog to be even higher at year end.
• AECOM's Management Services wins totaled $6.7 billion and backlogreached a new high of nearly $20 billion, which is an increase of 124%. Thisgrowth represents a transformation in the business, including substantial winsfor its U.S. departments of Defense and Energy clients. AECOM's win rateremains strong and includes a growing presence in the classified sectorwhere the barriers to entry are higher and contract durations are longer.
• In the international markets, the Asia-Pacific region, strength in Australia andGreater China contributed to solid growth. Following the close of the quarter,AECOM won a substantial contract as part of Melbourne's Metro Tunnelproject in Australia, which provides visibility into next year. Overall, economic,population, and urbanization trends as well as AECOM's broad capabilitiesand backlog growth position it well for continued growth going forward.
• In the Building Construction business, AECOM expects to deliver double-digitgrowth for the fourth consecutive year. Today, AECOM has a nearly $13billion backlog which is more than two years of annual revenue. AECOM'spipeline of pursuits remains robust and continues to reflect its growinggeographic and end-market diversification. AECOM also won more than $1billion construction project in New York, and are pursuing several largeprojects that it expects to add to its visibility.
News• Skanska and AECOM Hunt Joint Venture Selected
as General Contractor for Seattle Center ArenaRedevelopment Project
• Mullen Group Ltd. completed the acquisition ofCanadian industrial services division of AECOM onJune 25, 2018. This acquisition is expected to addapproximately $70.0 million in annual revenue toMullen Group.
Source: Q2 Earnings Report, CIQ, PR
Revenue ($Million)
Revenue by Segment ($Million)
Design &
Consulting
Services$2,105.4
Construction
Services
$2,106.7
Management
Services
$935.9
$5,147.9
$4,561.5
$4,200.0
$4,300.0
$4,400.0
$4,500.0
$4,600.0
$4,700.0
$4,800.0
$4,900.0
$5,000.0
$5,100.0
$5,200.0
Q2 2018 Q2 2017

13
Commentary“The acquisition of Louis Berger, once completed, will enable WSP to reach theobjectives of its 2015-2018 Strategic Plan since upon closing and integration ofthe acquisition, WSP anticipates headcount of approximately 48,000 employeesand surpassing the $6 billion mark in net revenues.”—Alexandre L'Heureux,President and Chief Executive Officer
HighlightsFor the quarter ended June 30, 2018:• The intent to acquire Louis Berger, a U.S.-headquartered leading international
professional services firm, fits in WSP's strategy both in terms of culturalvalues and business model. WSP pursues this acquisition in order to build aneven stronger and more diversified business that will create value for itsemployees, clients and shareholders. Once integrated, Louis Berger willenable WSP to strengthen its presence in the U.S. It will also strengthen WSPexpertise in sectors and services that it had targeted for growth, includingcritical mass in water and environment.
• In the Americas, infrastructure spending in the U.S. remains robust, and thePoch and ConCol acquisition-related synergies should lead to goodoperating margins. WSP expects organic growth in net revenues to remainsolid in Q3 2018. However, WSP also anticipates posting negative organicgrowth in net revenues in Q4 of '18 due to the nonrecurring nature of FEMAnet revenues recorded in Q4 of '17.
• In Chile, WSP was awarded the engineering environmental contract for theEolic Park Llanos del Viento project. This award is a direct result ofcollaboration between Poch and ConCol, which were acquired last year.
• Overall, the outlook for the APAC region remains positive. Australia, on thestrength of the Infrastructure & Transportation market segment, is tracking todeliver full-year organic growth in net revenues in the mid- to high singledigits. In Asia, the continuing—continued slowdown in the building marketwill likely lead to negative organic growth in net revenues.
News• WSP Global Inc. entered into an agreement to
acquire Berger Group Holdings, Inc. for $400million on July 28, 2018. WSP Global intends torestructure international operations of BergerGroup Holdings.
• WSP USA and Wood Thilsted have been awardedthe contract to provide detailed design offoundations for Vineyard Wind's offshore windproject off the Massachusetts coast.
Source: Q2 Earnings Report, CIQ, PR, Preseantation
Revenue (CAD Million)
Revenue Backlog (CAD Million)
$6,706.9
$5,864.6
$5,400.0
$5,600.0
$5,800.0
$6,000.0
$6,200.0
$6,400.0
$6,600.0
$6,800.0
Q2 2018 Q2 2017
$2,025.9
$1,717.2
$1,550.0
$1,600.0
$1,650.0
$1,700.0
$1,750.0
$1,800.0
$1,850.0
$1,900.0
$1,950.0
$2,000.0
$2,050.0
Q2 2018 Q2 2017

14
Commentary“We continue to see momentum in our broad-based growth, led by work for U.S.state and local clients, which has increased organically at a double-digit rate for eightconsecutive quarters, including 26% growth in the third quarter. Our other key end-markets, including U.S. Federal, Commercial, and International, grew 10% ormore.”—Dan Batrack, Chairman and CEO
HighlightsFor the quarter ended July 1, 2018:• Tetra Tech continues to focus its business on high-end services primarily by
expanding and investing in its consulting services. Tetra Tech is also reshaping itsportfolio slightly. At the end of the quarter, Tetra Tech completed the sale of anon-core unit that was focused on utility services.
• This quarter's performance was led by strong growth from Tetra Tech U.S. andlocal clients with additional significant contributions from U.S. commercial andfederal clients. Tetra Tech's state and local revenues continued to be up with a netrevenue growth of 26% YoY. This increase was a direct result of Tetra Tech waterinfrastructure work in high-growth states across the southern U.S., and therecovery, assessment, and engineering services that it provides for disasters thathave struck the U.S. in prior years.
• Also in this quarter, Tetra Tech won new programs for international developmentin the Ukraine for energy security at $85 million; and in Madagascar, for itscommunity programs at $22 million. Tetra Tech continues to build its capacity withthe Army Corps of Engineers, with the new $60 million IDIQ contract forengineering services for locks, dams, and inter-coastal waterways, for the PacificNorthwest region of the U.S.
• While the U.S. Federal, U.S., and local projects provide Tetra Tech with goodvisibility and continued momentum, the oil and gas market also provides it withboth revenue growth and margin expansion. As a firm that specializes inmidstream consulting and engineering services, Tetra Tech is well positioned tocapitalize on the build-out of the oil and gas pipeline-related infrastructure.
News• Hylan acquired Western Utility and Tetra Tech
Utility Construction of Tetra Tech, Inc. on June30, 2018. Under the terms of the agreement,TUC has rebranded as Hylan West.
• U.S. Army Corps of Engineers Awards TetraTech $60M Contract for Architect-EngineerServices
Source: Q2 Earnings Report, CIQ, PR
Revenue ($Million)
Revenue by Segment ($Million)
Government
Services Group
$423.9
Commercial/Intern
ational Services
Group$352.6
Remediation and
Construction
Management$3.3
Elimination of
Inter-Segment
Revenue$(15.1)
$570.4
$498.5
$460.0
$480.0
$500.0
$520.0
$540.0
$560.0
$580.0
Q2 2018 Q2 2017
15
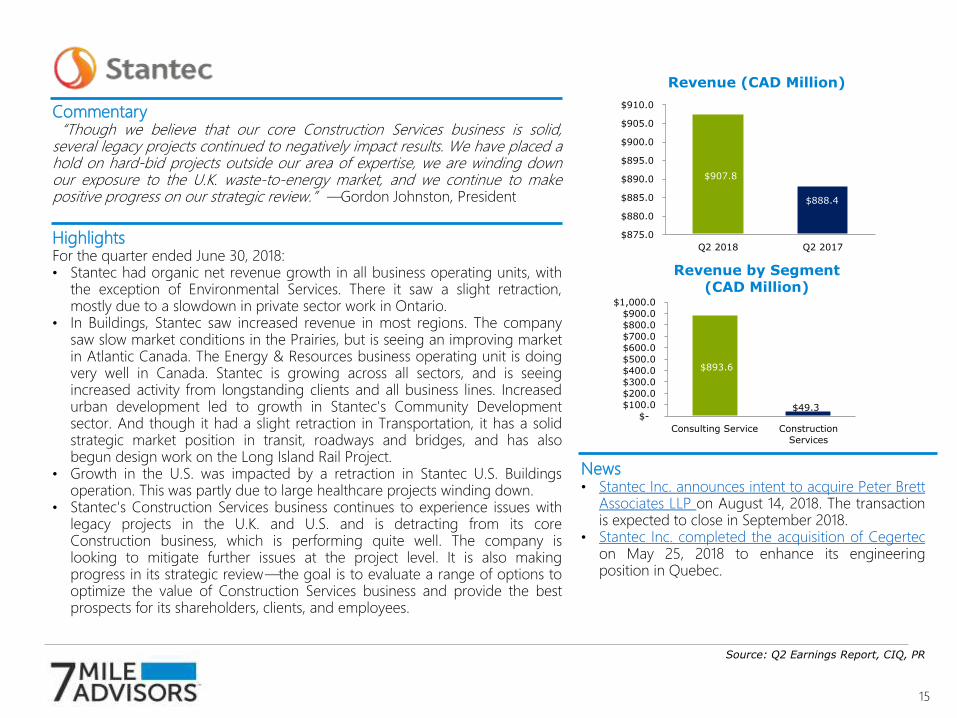
Commentary“Though we believe that our core Construction Services business is solid,several legacy projects continued to negatively impact results. We have placed ahold on hard-bid projects outside our area of expertise, we are winding downour exposure to the U.K. waste-to-energy market, and we continue to makepositive progress on our strategic review.”—Gordon Johnston, President
HighlightsFor the quarter ended June 30, 2018:• Stantec had organic net revenue growth in all business operating units, with
the exception of Environmental Services. There it saw a slight retraction,mostly due to a slowdown in private sector work in Ontario.
• In Buildings, Stantec saw increased revenue in most regions. The companysaw slow market conditions in the Prairies, but is seeing an improving marketin Atlantic Canada. The Energy & Resources business operating unit is doingvery well in Canada. Stantec is growing across all sectors, and is seeingincreased activity from longstanding clients and all business lines. Increasedurban development led to growth in Stantec's Community Developmentsector. And though it had a slight retraction in Transportation, it has a solidstrategic market position in transit, roadways and bridges, and has alsobegun design work on the Long Island Rail Project.
• Growth in the U.S. was impacted by a retraction in Stantec U.S. Buildingsoperation. This was partly due to large healthcare projects winding down.
• Stantec's Construction Services business continues to experience issues withlegacy projects in the U.K. and U.S. and is detracting from its coreConstruction business, which is performing quite well. The company islooking to mitigate further issues at the project level. It is also makingprogress in its strategic review—the goal is to evaluate a range of options tooptimize the value of Construction Services business and provide the bestprospects for its shareholders, clients, and employees.
News• Stantec Inc. announces intent to acquire Peter Brett
Associates LLP on August 14, 2018. The transactionis expected to close in September 2018.
• Stantec Inc. completed the acquisition of Cegertecon May 25, 2018 to enhance its engineeringposition in Quebec.
Source: Q2 Earnings Report, CIQ, PR
Revenue (CAD Million)
Revenue by Segment (CAD Million)
$893.6
$49.3 $-
$100.0
$200.0
$300.0
$400.0
$500.0
$600.0
$700.0
$800.0
$900.0
$1,000.0
Consulting Service Construction
Services
$907.8
$888.4
$875.0
$880.0
$885.0
$890.0
$895.0
$900.0
$905.0
$910.0
Q2 2018 Q2 2017
16
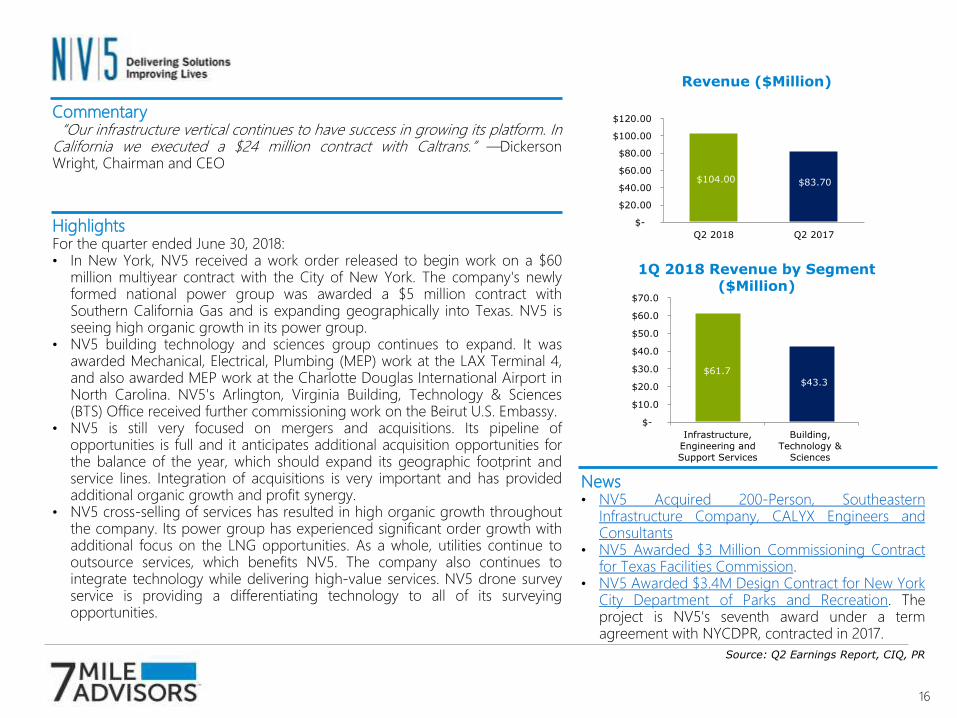
Commentary“Our infrastructure vertical continues to have success in growing its platform. InCalifornia we executed a $24 million contract with Caltrans.”—DickersonWright, Chairman and CEO
HighlightsFor the quarter ended June 30, 2018:• In New York, NV5 received a work order released to begin work on a $60
million multiyear contract with the City of New York. The company's newlyformed national power group was awarded a $5 million contract withSouthern California Gas and is expanding geographically into Texas. NV5 isseeing high organic growth in its power group.
• NV5 building technology and sciences group continues to expand. It wasawarded Mechanical, Electrical, Plumbing (MEP) work at the LAX Terminal 4,and also awarded MEP work at the Charlotte Douglas International Airport inNorth Carolina. NV5's Arlington, Virginia Building, Technology & Sciences(BTS) Office received further commissioning work on the Beirut U.S. Embassy.
• NV5 is still very focused on mergers and acquisitions. Its pipeline ofopportunities is full and it anticipates additional acquisition opportunities forthe balance of the year, which should expand its geographic footprint andservice lines. Integration of acquisitions is very important and has providedadditional organic growth and profit synergy.
• NV5 cross-selling of services has resulted in high organic growth throughoutthe company. Its power group has experienced significant order growth withadditional focus on the LNG opportunities. As a whole, utilities continue tooutsource services, which benefits NV5. The company also continues tointegrate technology while delivering high-value services. NV5 drone surveyservice is providing a differentiating technology to all of its surveyingopportunities.
News• NV5 Acquired 200-Person, Southeastern
Infrastructure Company, CALYX Engineers andConsultants
• NV5 Awarded $3 Million Commissioning Contractfor Texas Facilities Commission.
• NV5 Awarded $3.4M Design Contract for New YorkCity Department of Parks and Recreation. Theproject is NV5's seventh award under a termagreement with NYCDPR, contracted in 2017.
Source: Q2 Earnings Report, CIQ, PR
Revenue ($Million)
1Q 2018 Revenue by Segment ($Million)
$104.00 $83.70
$-
$20.00
$40.00
$60.00
$80.00
$100.00
$120.00
Q2 2018 Q2 2017
$61.7
$43.3
$-
$10.0
$20.0
$30.0
$40.0
$50.0
$60.0
$70.0
Infrastructure,
Engineering and
Support Services
Building,
Technology &
Sciences
17
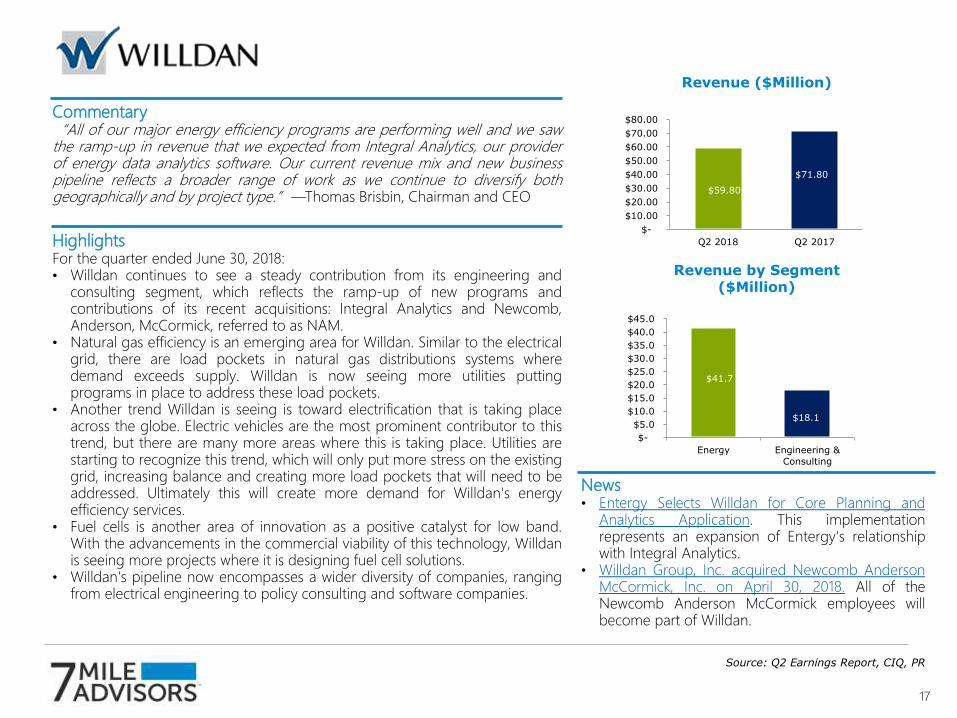
Commentary“All of our major energy efficiency programs are performing well and we sawthe ramp-up in revenue that we expected from Integral Analytics, our providerof energy data analytics software. Our current revenue mix and new businesspipeline reflects a broader range of work as we continue to diversify bothgeographically and by project type.”—Thomas Brisbin, Chairman and CEO
HighlightsFor the quarter ended June 30, 2018:• Willdan continues to see a steady contribution from its engineering and
consulting segment, which reflects the ramp-up of new programs andcontributions of its recent acquisitions: Integral Analytics and Newcomb,Anderson, McCormick, referred to as NAM.
• Natural gas efficiency is an emerging area for Willdan. Similar to the electricalgrid, there are load pockets in natural gas distributions systems wheredemand exceeds supply. Willdan is now seeing more utilities puttingprograms in place to address these load pockets.
• Another trend Willdan is seeing is toward electrification that is taking placeacross the globe. Electric vehicles are the most prominent contributor to thistrend, but there are many more areas where this is taking place. Utilities arestarting to recognize this trend, which will only put more stress on the existinggrid, increasing balance and creating more load pockets that will need to beaddressed. Ultimately this will create more demand for Willdan's energyefficiency services.
• Fuel cells is another area of innovation as a positive catalyst for low band.With the advancements in the commercial viability of this technology, Willdanis seeing more projects where it is designing fuel cell solutions.
• Willdan's pipeline now encompasses a wider diversity of companies, rangingfrom electrical engineering to policy consulting and software companies.
News• Entergy Selects Willdan for Core Planning and
Analytics Application. This implementationrepresents an expansion of Entergy's relationshipwith Integral Analytics.
• Willdan Group, Inc. acquired Newcomb AndersonMcCormick, Inc. on April 30, 2018. All of theNewcomb Anderson McCormick employees willbecome part of Willdan.
Revenue ($Million)
Revenue by Segment ($Million)
Source: Q2 Earnings Report, CIQ, PR
$59.80
$71.80
$-
$10.00
$20.00
$30.00
$40.00
$50.00
$60.00
$70.00
$80.00
Q2 2018 Q2 2017
$41.7
$18.1
$-
$5.0
$10.0
$15.0
$20.0
$25.0
$30.0
$35.0
$40.0
$45.0
Energy Engineering &
Consulting

18
Commentary“We are preparing for and planning to divest all the clean energy assets in2019. Following a strategic review we decided to operate CallisonRTKL as aseparate division within Arcadis and the focus is now on delivering on thebusiness plan, which was developed during the strategic review.”—PeterOosterveer, CEO
HighlightsFor the quarter ended June 30, 2018:• The company has completed the strategic review of CallisonRTKL, a global
architecture, planning and design firm. Arcadis has concluded that the bestvalue and the most value is being derived from keeping it within Arcadis.
• Arcadis has seen good performance in markets such as the U.K., continentalEurope, and Australia in particular. It has also collected a substantial amountof money in the Middle East, something which has been on many people'sradar screen for a long time, a total of EUR25 million out of Saudi Arabia,EUR6 million in the first quarter and another EUR19 million in the secondquarter.
• Arcadis continues to significantly invest in its digital capabilities, both throughpartnerships as well as in terms of improving its people skills.
• The large gas-to-gas plant, which is part of the ALEN joint venture, istechnically operational. Arcadis is now in the process of negotiating salescontracts for the gas plant. The intent is for Arcadis to sell all the assets in2019.
• Arcadis has great momentum in the U.S., and is planning to continue thatmomentum. There is strong margin improvement and organic growth inNorth America. There were strong results for Water and continued solidresults for Environment and Infrastructure.
News• Arcadis NV completed the acquisition of IBUe
GmbH, a 17-person engineering consultancy forenvironment and energy, on August 1, 2018.
• Arcadis and Techstars partner to bring innovativesolutions to the natural and built environment. Itwill allow Arcadis to bring smart city technologiesto its customers with the support of one of theworld's leading business accelerators.
Revenue (EUR Million)
Revenue by Geo/Operating Segment (EUR Million)
Source: Q2 Earnings Report, CIQ, PR
Americas
$276.2
Europe and
Middle East
$356.4
APAC
$93.8
CallisonRTKL
$71.7
Eliminations
$(5.2)
$792.8
$824.1
$775.0
$780.0
$785.0
$790.0
$795.0
$800.0
$805.0
$810.0
$815.0
$820.0
$825.0
$830.0
Q2 2018 Q2 2017
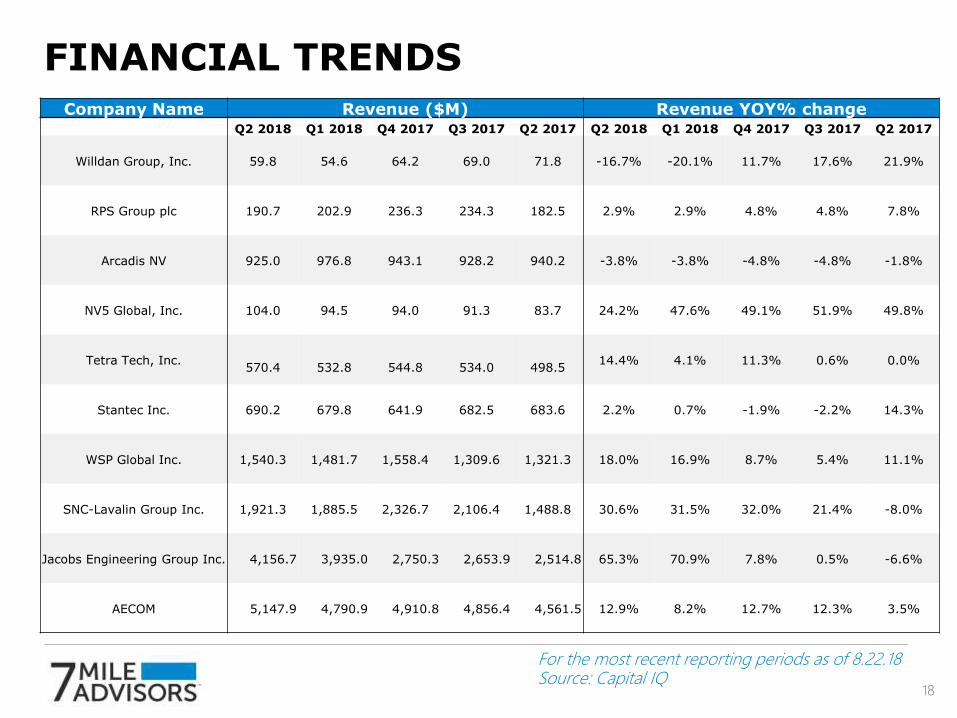
FINANCIAL TRENDS
For the most recent reporting periods as of 8.22.18Source: Capital IQ
Company Name Revenue ($M) Revenue YOY% changeQ2 2018 Q1 2018 Q4 2017 Q3 2017 Q2 2017 Q2 2018 Q1 2018 Q4 2017 Q3 2017 Q2 2017
Willdan Group, Inc. 59.8 54.6 64.2 69.0 71.8 -16.7% -20.1% 11.7% 17.6% 21.9%
RPS Group plc 190.7 202.9 236.3 234.3 182.5 2.9% 2.9% 4.8% 4.8% 7.8%
Arcadis NV 925.0 976.8 943.1 928.2 940.2 -3.8% -3.8% -4.8% -4.8% -1.8%
NV5 Global, Inc. 104.0 94.5 94.0 91.3 83.7 24.2% 47.6% 49.1% 51.9% 49.8%
Tetra Tech, Inc.570.4 532.8 544.8 534.0 498.5
14.4% 4.1% 11.3% 0.6% 0.0%
Stantec Inc. 690.2 679.8 641.9 682.5 683.6 2.2% 0.7% -1.9% -2.2% 14.3%
WSP Global Inc. 1,540.3 1,481.7 1,558.4 1,309.6 1,321.3 18.0% 16.9% 8.7% 5.4% 11.1%
SNC-Lavalin Group Inc. 1,921.3 1,885.5 2,326.7 2,106.4 1,488.8 30.6% 31.5% 32.0% 21.4% -8.0%
Jacobs Engineering Group Inc. 4,156.7 3,935.0 2,750.3 2,653.9 2,514.8 65.3% 70.9% 7.8% 0.5% -6.6%
AECOM 5,147.9 4,790.9 4,910.8 4,856.4 4,561.5 12.9% 8.2% 12.7% 12.3% 3.5%
18

FINANCIAL TRENDS
For the most recent reporting periods as of 8.22.18Source: Capital IQ
Company Name GM% EBITDA%Q2 2018 Q1 2018 Q4 2017 Q3 2017 Q2 2017 Q2 2018 Q1 2018 Q4 2017 Q3 2017 Q2 2017
Willdan Group, Inc. 38.7% 35.8% 31.1% 29.4% 26.2% 8.9% 5.6% 6.8% 7.8% 7.7%
RPS Group plc 10.4% 10.4% 37.6% 37.6% 10.8% 11.8% 11.8% 8.3% 8.3% 12.3%
Arcadis NV 17.1% 17.1% 18.0% 18.0% 17.5% 6.3% 6.3% 6.6% 6.6% 6.1%
NV5 Global, Inc. 48.7% 49.3% 48.3% 51.2% 49.4% 12.8% 10.9% 12.2% 14.3% 12.6%
Tetra Tech, Inc. 19.2% 17.2% 17.3% 18.9% 18.1% 12.2% 10.3% 10.8% 12.3% 11.4%
Stantec Inc. 51.2% 52.2% 52.9% 53.6% 53.5% 9.2% 10.2% 7.4% 12.1% 11.1%
WSP Global Inc. 18.1% 17.3% 16.5% 20.3% 17.4% 8.3% 6.9% 5.6% 9.4% 7.8%
SNC-Lavalin Group Inc. 8.8% 9.6% 23.2% 23.7% 8.0% 8.8% 9.5% 9.7% 9.4% 6.5%
Jacobs Engineering Group Inc. 18.7% 19.7% 17.7% 17.9% 18.3% 7.6% 7.4% 6.3% 5.9% 6.7%
AECOM 3.6% 2.9% 3.2% 3.5% 3.8% 4.2% 3.8% 3.8% 3.9% 4.6%
19

FINANCIAL TRENDS
For the most recent reporting periods as of 8.22.18Source: Capital IQ
Company Name EPSQ2 2018 Q1 2018 Q4 2017 Q3 2017 Q2 2017
Willdan Group, Inc. 0.36 0.24 0.35 0.31 0.36
RPS Group plc 0.05 0.05 (0.09) (0.09) 0.04
Arcadis NV 0.23 0.25 0.25 0.25 0.22
NV5 Global, Inc. 0.69 0.39 1.06 0.55 0.40
Tetra Tech, Inc. 0.59 0.51 0.81 0.60 0.52
Stantec Inc. 0.26 0.25 0.08 0.32 0.65
WSP Global Inc. 0.49 0.37 0.23 0.57 0.47
SNC-Lavalin Group Inc. 0.36 0.34 0.23 0.47 0.70
Jacobs Engineering Group Inc. 1.05 0.34 0.02 0.76 0.74
AECOM 0.37 -0.75 0.69 0.55 0.64
20

FINANCIAL TRENDS
For the most recent reporting periods as of 8.22.18Source: Capital IQ
Company Name Stock Price (USD Value) Stock Price % ChangeQ2 2018 Q1 2018 Q4 2017 Q3 2017 Q2 2017 Q2 2018 Q1 2018 Q4 2017 Q3 2017 Q2 2017
Willdan Group, Inc. 30.97 28.35 23.94 32.46 30.55 9.2% 18.4% -26.2% 6.3% -5.3%
RPS Group plc 3.37 3.58 3.68 3.87 3.40 0.2% -6.3% -5.6% 10.1% 6.3%
Arcadis NV 18.04 19.65 22.88 21.55 18.05 -3.1% -16.3% 4.5% 15.2% 7.1%
NV5 Global, Inc. 69.30 55.75 54.15 54.65 42.50 24.3% 3.0% -0.9% 28.6% 13.0%
Tetra Tech, Inc. 58.5 48.95 48.15 46.55 45.75 19.5% 1.7% 3.4% 1.7% 12.0%
Stantec Inc. 25.71 24.65 28.04 27.71 25.12 6.4% -9.6% 1.5% 6.1% -5.4%
WSP Global Inc. 52.63 46.02 47.77 41.53 41.40 16.6% -1.0% 15.4% -3.5% 14.6%
SNC-Lavalin Group Inc. 44.14 43.87 45.49 45.12 43.14 2.6% -0.8% 1.2% 0.6% 7.5%
Jacobs Engineering Group Inc. 63.49 59.15 65.96 58.27 54.39 7.3% -10.3% 13.2% 7.1% -1.6%
AECOM 33.03 35.63 37.15 36.81 32.33 -7.3% -4.1% 0.9% 13.9% -9.2%
21
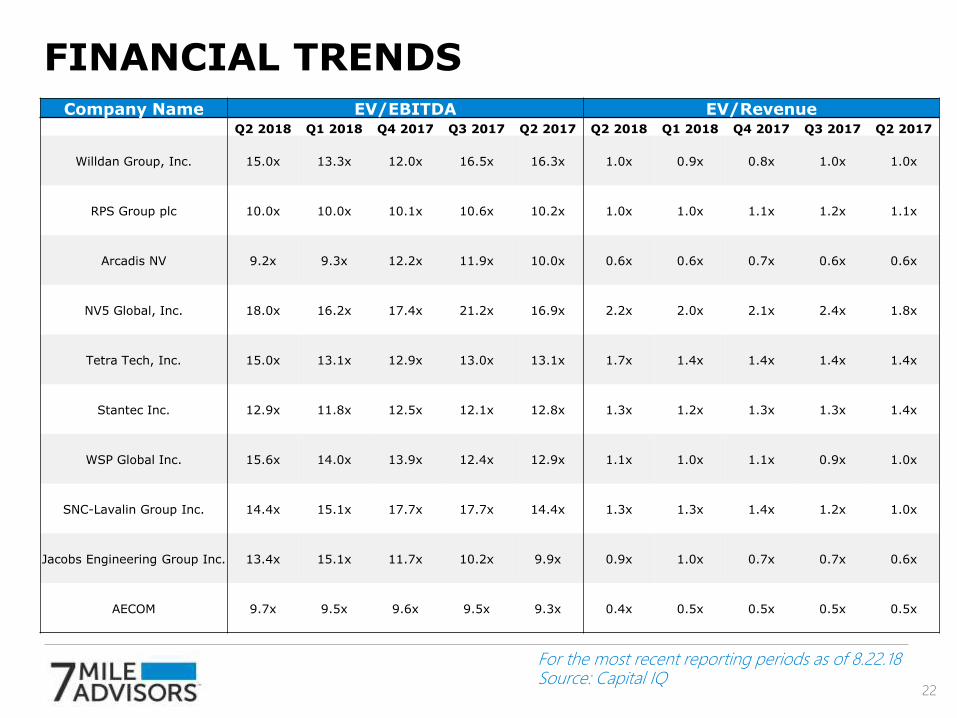
FINANCIAL TRENDS
For the most recent reporting periods as of 8.22.18Source: Capital IQ
Company Name EV/EBITDA EV/RevenueQ2 2018 Q1 2018 Q4 2017 Q3 2017 Q2 2017 Q2 2018 Q1 2018 Q4 2017 Q3 2017 Q2 2017
Willdan Group, Inc. 15.0x 13.3x 12.0x 16.5x 16.3x 1.0x 0.9x 0.8x 1.0x 1.0x
RPS Group plc 10.0x 10.0x 10.1x 10.6x 10.2x 1.0x 1.0x 1.1x 1.2x 1.1x
Arcadis NV 9.2x 9.3x 12.2x 11.9x 10.0x 0.6x 0.6x 0.7x 0.6x 0.6x
NV5 Global, Inc. 18.0x 16.2x 17.4x 21.2x 16.9x 2.2x 2.0x 2.1x 2.4x 1.8x
Tetra Tech, Inc. 15.0x 13.1x 12.9x 13.0x 13.1x 1.7x 1.4x 1.4x 1.4x 1.4x
Stantec Inc. 12.9x 11.8x 12.5x 12.1x 12.8x 1.3x 1.2x 1.3x 1.3x 1.4x
WSP Global Inc. 15.6x 14.0x 13.9x 12.4x 12.9x 1.1x 1.0x 1.1x 0.9x 1.0x
SNC-Lavalin Group Inc. 14.4x 15.1x 17.7x 17.7x 14.4x 1.3x 1.3x 1.4x 1.2x 1.0x
Jacobs Engineering Group Inc. 13.4x 15.1x 11.7x 10.2x 9.9x 0.9x 1.0x 0.7x 0.7x 0.6x
AECOM 9.7x 9.5x 9.6x 9.5x 9.3x 0.4x 0.5x 0.5x 0.5x 0.5x
22
DISCLOSURESAt the time this was published: 1) 7M Securities was not making a market in any of the securities listed herein, nor was 7M Securities or associated persons
selling or buying them from customers on a principal basis; 2) Neither 7M Securities, its officers nor its partners have a financial interest beyond a nominal
basis in any of the securities of the issuers listed herein; 3) 7M Securities was not a manager or co-manager of a public offering of any of the securities
listed herein within the past 12 months.
This report is for your information only and is not an offer to sell, or a solicitation of an offer to buy, the securities or instruments named or described in
this report. Interested parties are advised to contact the entity with which they deal, or the entity that provided this report to them, if they desire further
information. The information in this report has been obtained or derived from publicly available sources but neither 7 Mile Advisors, LLC nor 7M
Securities, LLC represents that this information is accurate or complete. Any information contained in this report is subject to change without notice.
23
25
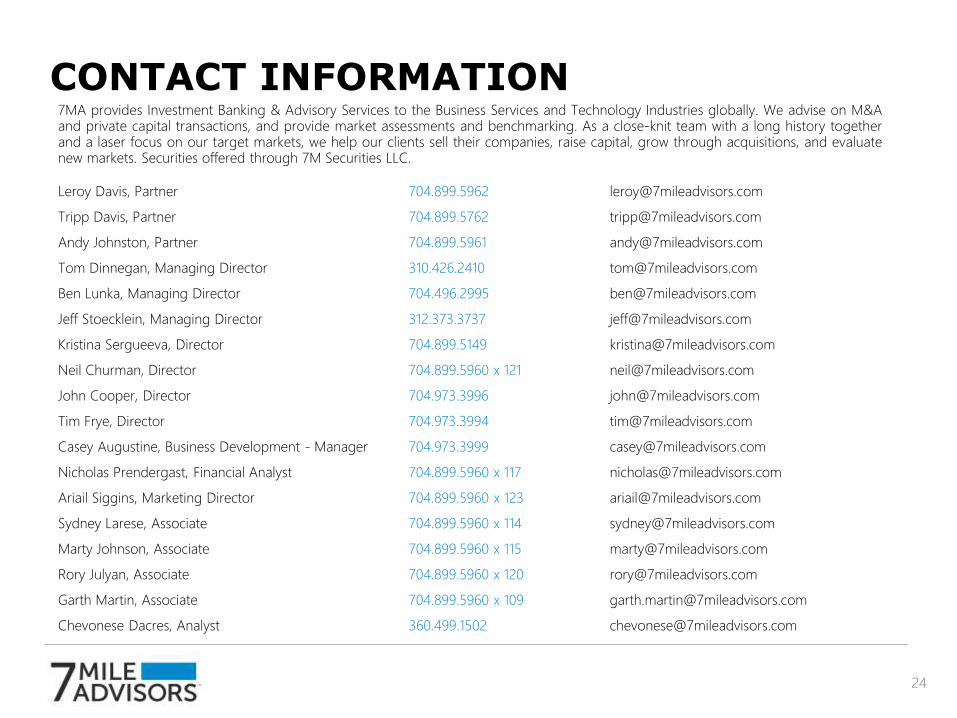
CONTACT INFORMATION7MA provides Investment Banking & Advisory Services to the Business Services and Technology Industries globally. We advise on M&Aand private capital transactions, and provide market assessments and benchmarking. As a close-knit team with a long history togetherand a laser focus on our target markets, we help our clients sell their companies, raise capital, grow through acquisitions, and evaluatenew markets. Securities offered through 7M Securities LLC.
Leroy Davis, Partner 704.899.5962 [email protected]
Tripp Davis, Partner 704.899.5762 [email protected]
Andy Johnston, Partner 704.899.5961 [email protected]
Tom Dinnegan, Managing Director 310.426.2410 [email protected]
Ben Lunka, Managing Director 704.496.2995 [email protected]
Jeff Stoecklein, Managing Director 312.373.3737 [email protected]
Kristina Sergueeva, Director 704.899.5149 [email protected]
Neil Churman, Director 704.899.5960 x 121 [email protected]
John Cooper, Director 704.973.3996 [email protected]
Tim Frye, Director 704.973.3994 [email protected]
Casey Augustine, Business Development - Manager 704.973.3999 [email protected]
Nicholas Prendergast, Financial Analyst 704.899.5960 x 117 [email protected]
Ariail Siggins, Marketing Director 704.899.5960 x 123 [email protected]
Sydney Larese, Associate 704.899.5960 x 114 [email protected]
Marty Johnson, Associate 704.899.5960 x 115 [email protected]
Rory Julyan, Associate 704.899.5960 x 120 [email protected]
Garth Martin, Associate 704.899.5960 x 109 [email protected]
Chevonese Dacres, Analyst 360.499.1502 [email protected]
24
THANK YOU