architecture for mitigation, adaptation and technology...
TRANSCRIPT

Architecture for Mitigation, Adaptation and Technology Transformation
for International Transport
“Global and Differentiated”
Paper for Climate 2008 Conference
Dr Andre Stochniol Founder of IMERS
London, UK, Sept 2008

Architecture for Mitigation, Adaptation and Technology Transformation for International Transport
DR ANDRE STOCHNIOL Page 2 of 31 [email protected]
The contents of this paper are the author’s sole responsibility.
Copyright © 2008 Andre Stochniol
All rights reserved.
This publication may be copied and distributed free of charge if appropriate citation is given.
This publication is made available subject to the condition that it shall not, by way of trade or otherwise, be lent, resold, hired out, or otherwise circulated without the publisher’s consent in any form or binding or cover other than that in which it is published and without similar condition including this condition being imposed on the subsequent purchaser.
For information about permission to reproduce selections from this publication, write to Dr Andre Stochniol at [email protected].
Acknowledgements
To my wife Halina and daughters, Nina and Kasia. This paper would not have been possible without their incredible support and patience during the last 2 years, as I switched from a successful business career to the public good initiative known as the International Maritime Emission Reduction Scheme.

Architecture for Mitigation, Adaptation and Technology Transformation for International Transport
DR ANDRE STOCHNIOL Page 3 of 31 [email protected]
Abstract This paper proposes an architecture to address emissions from international maritime transport and potentially from aviation in the post-2012 international climate regime.
Shipping emissions are large – more than double the emissions from aviation. Together they currently constitute about 5-6% of global greenhouse gas emissions from fossil fuels, and are growing fast. These emissions are not covered by the Kyoto Protocol and attempts to define a global policy to address them have so far failed.
Current financial mechanisms for adaptation to climate change aimed at helping the world’s poor deal with the consequences of global warming are inadequate, in both design and scale. The adaptation needs of developing countries are estimated at tens of $billions per annum – the funding gap is currently about 100 times higher than all anticipated contributions.
The main challenges for the architecture are identified. Most importantly: how to provide global uniform rules and policies for international transport while delivering on the differentiated approach embodied in the UNFCCC and the Kyoto Protocol.
To resolve the deadlock the proposed architecture links together adaptation, mitigation, technology and financing in one single scheme. Six architectural principles form the foundation of the scheme are proposed to ensure equity. The first principle is: Mitigation and adaptation will be treated as equally important, and therefore funds aggregated through an economic instrument will be split between the two. The remaining principles cover mitigation, adaptation, longer-term transformational changes, a long-term emission goal, and a supra-national approach. The impact of the architecture on the developing and developed countries is quantified based on import freight costs. Developed countries will bear most of the costs with little direct benefits. Conversely, developing countries will gain twice of what they put in – a benefit factor of 2. The Least Developed Countries will gain most, in total 15% of monies raised. The resulting distribution of costs is shown to fulfill the principle of common but differentiated responsibilities and respective capabilities.
A new cap-and-charge instrument is introduced to deliver the proposed architecture. It is based on an emission charge which is driven by a quantitative emission goal for the entire maritime sector, or part of it. The International Maritime Emission Reduction Scheme based on the cap-and-charge, simultaneously eliminates the methodological barriers of emission allocations and cap-and-trade, provides incentives to secure global participation, and is easy to implement within existing maritime legal frameworks. It is also flexible enough to differentiate between emission costs for importing subsistence versus merchant goods, bringing equity differentiation at the individual level. The cost impact for different stakeholders is provided with the end user impact estimated at 0.1% on prices of imported goods. The cost of inaction for the developing countries is quantified as $4bn annually of adaptation financing not made available to the most vulnerable countries.
The paper highlights that a precedent for supra-national charges already exists (IOPC Funds) and the existing MARPOL convention can provide a platform for early action. It also suggests ways in which similar approach could be applied to international aviation.
The paper concludes that the deadlock to address emissions from international maritime transport can be unlocked through the proposed architecture, balancing the interests of all parties.

Architecture for Mitigation, Adaptation and Technology Transformation for International Transport
DR ANDRE STOCHNIOL Page 4 of 31 [email protected]
CONTENTS
1. INTRODUCTION .................................................................................................................................. 5
1.1 POLICY DEADLOCK OR AN OPPORTUNITY? ...................................................................................... 5 1.2 CASE FOR ACTION ............................................................................................................................. 6 1.3 DEADLOCK BETWEEN GLOBAL APPROACH AND DIFFERENTIATED RESPONSIBILITIES .................... 7
2. UNLOCKING A COMMON BUT DIFFERENTIATED POLICY ................................................... 8
2.1 ARCHITECTURE PRINCIPLES .............................................................................................................. 8 2.1.1 Mitigation and adaptation will be treated as equally important. .............................................. 8 2.1.2 Mitigation costs will be minimized. ........................................................................................... 8 2.1.3 Funding for adaptation will be allocated to developing countries. ........................................... 9 2.1.4 Longer-term transformational changes are essential. ............................................................... 9 2.1.5 A long-term emission goal will be agreed for international transport. ..................................... 9 2.1.6 A supra-national approach will be adopted for global shipping. .............................................. 9
2.2 CONTRIBUTIONS TO FOUR BALI PILLARS ....................................................................................... 10 2.3 DIRECT BENEFITS ............................................................................................................................ 10 2.4 HISTORIC RESPONSIBILITY ............................................................................................................. 13 2.5 EQUITY BEYOND COUNTRY DIFFERENTIATION .............................................................................. 13
3. FEASIBLE INSTRUMENT ................................................................................................................ 14
3.1 FEASIBILITY, EFFECTIVENESS AND EFFICIENCY ............................................................................. 14 3.2 IMERS – A HYBRID CAP-AND-CHARGE SCHEME ............................................................................. 15 3.3 WHY HYBRID? COMPARISON OF TWO SCHEMES ............................................................................ 18 3.4 COSTS AND BENEFITS ..................................................................................................................... 20
3.4.1 Costs and Funds ...................................................................................................................... 20 3.4.2 Environmental Benefits ............................................................................................................ 21 3.4.3 Near- and Long-term Benefits ................................................................................................. 21 3.4.4 Cost of Inaction (delay) ........................................................................................................... 22
4. DISCUSSION AND PROGRESS ....................................................................................................... 22
4.1 LEGAL AND IMPLEMENTATION CONSIDERATIONS .......................................................................... 22 4.1.1 Checklist for International Charges ........................................................................................ 23 4.1.2 Governance .............................................................................................................................. 24 4.1.3 Incentives for Participation ..................................................................................................... 24 4.1.4 What is not Covered ................................................................................................................. 25 4.1.5 Improving Differentiation Further........................................................................................... 25
4.2 MULTILATERAL PROGRESS ............................................................................................................. 25 4.3 WHAT ABOUT AVIATION? ............................................................................................................... 26
5. CONCLUSION ..................................................................................................................................... 26
APPENDIX .................................................................................................................................................. 27
FEASIBILITY ............................................................................................................................................... 27 ATTRACTIVENESS ...................................................................................................................................... 28
BIBLIOGRAPHY ....................................................................................................................................... 29

Architecture for Mitigation, Adaptation and Technology Transformation for International Transport
DR ANDRE STOCHNIOL Page 5 of 31 [email protected]
1. Introduction Reducing Greenhouse Gas (GHG) emissions from fuels used for international maritime transport and aviation is perhaps the most challenging area for climate policy. Yet this area has received very little attention in the post-2012 policy discussions (Bodansky et al. 2004). Early discussions and more recent comprehensive studies focused primarily on the methodological issues of allocating emissions to countries, and on emissions trading (Bode et al. 2002, Faber et al., 2006).
This paper proposes how emission reductions from international maritime transport and potentially from aviation, neither of which are currently governed by emission targets for any Party to the Kyoto Protocol, can be addressed in the post-2012 international climate regime.
The paper is structured as follows. The remainder of the introduction discusses whether the existing policy deadlock presents an opportunity to address climate change in a holistic manner. Section 2 proposes six architectural principles which will be central to unlock common but differentiated responsibilities for international transport. It also quantifies benefits and costs to participating countries, and discusses equity issues. Section 3 builds a feasible instrument that could deliver the proposed architecture. Finally, Section 4 considers how the existing legal laws and precedents can enable early action.
1.1 Policy Deadlock or an Opportunity? The possibility of using harmonized charges to address international emissions has been mostly discounted, until very recently. Charges were seen to be too similar to unpopular taxes and incompatible with international agreements such as the Chicago convention. The possibility was conspicuously absent from the work done in Europe in the last 5 years or so. However, in mid 2007 Norway submitted a proposal to the International Maritime Organization (IMO) for a scheme based on implementing a CO2 charge which would raise funds for climate change mitigation and adaptation in developing countries, initiated by the author (IMO, 2007a). This has initiated discussions on market-based approaches in the IMO leading to follow-on submissions by parties in 2007 and 2008.1 In 2008 Mr J. Graichen, an expert representing the European Union (EU) at the UNFCCC Climate Change Talks in Bangkok, stated that the EU sees a global approach to maritime emissions as the preferred way forward. Two options were suggested; ship operator emission trading, and CO2 charges, as per the Norwegian proposal. Hereby, after years of deliberations, the previously preferred option was discounted. The EU experts arrived at the conclusion that including maritime emissions in national totals is not feasible due to data problems, evasion possibilities, competitiveness issues, fairness and the polluter pays principle.2
Current financial mechanisms for adaptation to climate change to help the world’s poor deal with the consequences of global warming, such as floods and droughts, are inadequate in both design and scale (UNFCC 2007). The adaptation needs of developing countries are estimated at tens of $billions per annum – the funding gap is about 100 times higher than all anticipated contributions. In June 2008 the Adaptation Fund had only $58 million available, an amount described as paltry when compared with the UN call for at least $86 billion in new financing by 2016.3 Many experts have argued that on equity grounds a levy on international maritime transport and/or aviation/air travel could contribute to reducing this significant funding gap (Müeller 2006, GLCA 2008).
Dealing with the financing gap for adaptation is not only a matter of need and equity, however. It also may be a condition for further progress in mitigation (Burton et al. 2006).
1 For details see: www.imers.org/buyin/achieve 2 http://unfccc.meta-fusion.com/kongresse/AWG_08/downl/0403_1000_p2/EU%20GHGs.pdf, Graichen (2008); a relevant webcast is also available 3 Climate change fund needs major boost - UN official, AlertNet, June 2008, http://www.alertnet.org/db/an_art/19216/2008/05/24-170738-1.htm

Architecture for Mitigation, Adaptation and Technology Transformation for International Transport
DR ANDRE STOCHNIOL Page 6 of 31 [email protected]
The above creates a three fold opportunity. First, the longstanding deadlock can be resolved through a new architecture that addresses international maritime emissions as a specific emission bubble outside of national agreements. Second, it can simultaneously reduce the significant gap in financing of adaptation to climate change for the most vulnerable developing countries. Thirdly, a maritime emission reduction scheme could be implemented as the first concrete step for the post-2012 agreement by augmenting existing maritime conventions.
Under the proposed scheme in this document, such early action will bring significant emission reductions and generate $4bn+ annually for adaptation to climate change in developing countries from as early as 2012. Moreover, it will contribute to measurable progress in international cooperation on tackling climate change.
1.2 Case for Action GHG emissions from fuel used for international transport are often referred to as emissions from “bunker fuels,” and consist mainly of carbon dioxide. They are fast-growing and currently constitute about 5-6% of global greenhouse gas emissions from fossil fuels. The global share of emissions from international maritime transport alone is estimated at 4%, exceeding 1 GtCO2/annually in 2005.4 This is around double the emissions from international aviation, and more than the entire emissions from the sixth most polluting country (Germany).
Emissions from bunker fuels were taken out of the Kyoto Protocol (KP) as no agreement could be reached on how to address them. Consequently, emissions from international transport are the only emission category that is not covered by national targets under the KP.
Within the last decade many discussions have taken place within the multilateral processes of the UNFCCC, International Civil Organization (ICAO) and International Maritime Organization (IMO) (IISD, 2007). Not much progress has been made and neither shipping nor aviation representatives have come up with an agreed way to allocate, regulate and reduce these emissions.
Politically, emissions from international transport have become an important topic in many developed countries due to significant public pressure to address them.
Shipping and aviation are arguably the world’s two most competitive and international industries. Shipping also forms the backbone of the global economy carrying 90% of worldwide trade by weight.
The ownership and management chain surrounding ship operation typically embraces entities from several countries. These include ship owners, ship managers, ship operators, charterers, cargo owners, and so on. Ships in international trade spend their economic life moving between different jurisdictions and outside of national jurisdictions on high seas, often far from the country of ownership or registry. The structure of shipping does not correlate with any division between developed and developing countries. For instance, an overwhelming portion (77% of the tonnage by Dead Weight) of all merchant vessels engaged in international trade are registered in non-Annex I countries (UNFCCC 2008a).
Industry stakeholders strongly prefer global regulations over local ones. The worst case scenario for them is a patchwork of different regulations in different parts of the world that would inevitably lead to competitive distortions and increased end-user prices. Moreover, local regulations aimed at reducing emissions will be ineffective as the ships can easily avoid them, by registering under a different flag thereby only adhering to that country’s regulations. Alternatively, they can deliver to a different port, or simply tank up a large amount of fuel in one of many countries along their route which does not participate in the regime.
Finally, to significantly reduce total shipping emissions new technological breakthroughs need to be developed and deployed. This is illustrated in Fig. 1.
4 1 GtCO2 – one Giga-ton of CO2 equals one billion tons of CO2 (metric tons). Estimate for 2005 is based on the bottom-up estimates for 2007 from the IMO, Dec 2007.

Architecture for Mitigation, Adaptation and Technology Transformation for International Transport
efficiency improvements(technical & operational measures)
technology enabled breakthroughs
(economic growth incentives)Em
issi
ons
(fuel
)
Fig. 1: Need for technology enabled breakthroughs in longer-term
Industry experts and stakeholders agree that efficiency improvements – from technical and operational measures – will likely only slow down the growth of maritime emissions in near-term. The growth of seaborne trade is forecast to lead to a significant increase of CO2 shipping emissions. (IMO 2000). This takes into account considerable efficiency improvements driven by expected increases in fuel prices. It is anticipated that by 2050 most transport will still be oil based. Given the long asset life of ships and ship engines, typically over 30 years, technology breakthroughs such as hydrogen will still require years to cut overall emissions. However, without the breakthroughs – which need to be encouraged by economic incentives – significant total emission reductions seem unlikely.
Therefore the only way to significantly reduce emissions in near-term – beyond efficiency improvements – is to allow acquiring emission reductions elsewhere. Longer-term technology transformation within shipping requires additional R&D investments, and appropriate incentives.
1.3 Deadlock between Global Approach and Differentiated Responsibilities The UNFCCC has provided a mandate for the IMO and ICAO through article 2.2 of Kyoto Protocol to address GHG emissions from bunker fuels by the parties included in Annex I to the UNFCCC.5
As non Annex-I countries, developing countries argue that discussing emission reduction policies for their ships or airlines is not aligned with the current global climate policy. The reality and the problem itself are however much more complex.
Emissions from bunker fuels are quite unique from legal, economic and political perspectives. Legally, most of the emissions happen outside national jurisdictions. Economically both maritime and aviation sectors are essential for international trade and travel. Politically, these emissions are discussed in several forums with different mandates, and with different agendas, negotiators and stakeholders.6
The gap between mandates and the principles for the different organizations is significant and manifested itself acutely during the recent negotiations in Bonn.7 The problem lies in the fact that the
5 Kyoto Article 2.2 states: “The Parties included in Annex I shall pursue limitation or reduction of emissions of greenhouse gases not controlled by the Montreal Protocol from aviation and marine bunker fuels, working through the International Civil Aviation Organization and the International Maritime Organization, respectively.” 6 These include the IMO and ICAO for maritime and aviation respectively, and the UNFCCC/SBSTA, the UNFCCC/SBI, and two UNFCCC working groups: the Ad Hoc Working Group on Further Commitments for Annex 1 Parties under the Kyoto Protocol (AWG-KP), and the Ad Hoc Working Group on Long-term Cooperative Action (AWG-LCA). 7 When the Marine Environment Protection Committee (MEPC) of the IMO at its 57th session approved through an “overwhelming majority” several principles for the future GHG regime it brought reservations from the major developing countries in the IMO (including China, Brazil). The key issue was a proposed principle 2 of “binding” commitments to all. The submission from the IMO to the UNFCCC Climate Change Talks in Bonn updating on the IMO progress (UNFCCC 2008a) has contributed to significant discussion of the bunker
DR ANDRE STOCHNIOL Page 7 of 31 [email protected]

Architecture for Mitigation, Adaptation and Technology Transformation for International Transport
DR ANDRE STOCHNIOL Page 8 of 31 [email protected]
regulations for international transport have a global scope. The principles driving negotiations in the IMO and ICAO predate the UNFCCC and do not make a distinction between developed and developing countries. For the UNFCCC, and especially the Kyoto Protocol, such a distinction is essential. The UNFCCC principle of common but differentiated responsibilities and respective capabilities is fundamental to developing countries.
The challenge seems as impossible as squaring a circle. Provide global uniform rules and policies as per the IMO (or ICAO for aviation) while delivering on the differentiated approach embodied in the UNFCCC and the KP. The secondary issue is that the UNFCCC requires the IMO/ICAO to deliver the mechanisms for emission reductions without specifying the policies, while IMO/ICAO requires the policies to deliver the mechanisms. A chicken-and-egg situation.
To break the impasse, a new radically different holistic architecture is proposed in this paper. The approach simultaneously eliminates the methodological barriers of emission allocations and cap-and-trade, provides incentives to secure global participation from developed and developing countries, and is easy to implement within existing legal frameworks.
2. Unlocking a Common But Differentiated Policy Several European advisors and negotiators8 have recently acknowledged that the only way out of the deadlock in addressing emissions from international maritime transport is to create common but differentiated policies for what is essentially the world’s most global sector. It has become clear that an easy uniform solution does not exist.
In creating a common but differentiated policy it is useful to establish guiding principles that will form the basis for initial negotiations. I begin by laying out the potential principles, before discussing in detail the instrument that can feasibly deliver on these principles, drawing attention to the legal details that make it robust.
I then use an instrument-independent cost benefit analysis to show how the architecture adheres to the UNFCCC principles. Finally, I provide further discussion and propose a method to distribute the costs equitably between the importers of subsistence and merchant goods, thereby expanding the concept of equity at the individual level.
2.1 Architecture Principles Experience with multi-party negotiations pertaining to the IMERS scheme have confirmed the benefits of having high level architecture principles established early on to help paint the big picture, build trust and accelerate negotiations, while providing a future proof framework for maritime emissions. The following potential principles form the backbone of the proposed architecture. Of course, any final principles will need to be negotiated by the contracting parties to the future deal. The only assumption made is that the architecture will generate funds to address climate change. The principles are shown with sample design policies. They are:
2.1.1 Mitigation and adaptation will be treated as equally important.
Policy 1.1 Funds aggregated through an economic instrument will be split between adaptation and mitigation of climate change.9
2.1.2 Mitigation costs will be minimized.
Policy 2.1 50% of mitigation funding will be used to reduce emissions from deforestation and forest degradation (REDD); the remaining funds will be used to acquire emission
emissions in all the four bodies meeting there (SBSTA, SBI, AWG-KP, AWG-LCA). Most discussions focused on the need to uphold the principles of the UNFCCC. 8 See: Faber (2008), Graichen (2007), Pettersen (2008). 9 A possible outcome could be an equal split between adaptation and mitigation (50:50). This is assumed for an illustrative example throughout the rest of this paper. However, the scheme is sufficiently flexible to facilitate any split agreed by the interested parties.

Architecture for Mitigation, Adaptation and Technology Transformation for International Transport
DR ANDRE STOCHNIOL Page 9 of 31 [email protected]
reduction credits from the CDM/JI10 mechanisms in the most cost effective manner, leveraging scale where appropriate.11
Policy 2.2 Savings will be maximized to fund adaptation, without increasing overall economic cost.
2.1.3 Funding for adaptation will be allocated to developing countries.
Policy 3.1 40% of adaptation funding will be for the Least Developed Countries (LDCs) and Small Island Developing States (SIDs); 80% of that will be for LDCs and 20% for SIDS .12
Policy 3.2 Funding will also be available to most vulnerable Economies in Transition (EITs).
2.1.4 Longer-term transformational changes are essential.
Policy 4.1 Additional funding for maritime technology will be raised on top of funding for climate change adaptation and mitigation.
Policy 4.2 The additional funding will be set initially at 20%; the level will be adjusted from time to time through cost-benefit analysis:13
a. 50% of funding will be for near-term technology transfer and cooperation, primarily for developing countries;14
b. 50% of funding will be for long-term transformational R&D, including bringing forward breakthroughs such as hydrogen transport.
2.1.5 A long-term emission goal will be agreed for international transport.
Policy 5.1 A long-term goal to reduce or mitigate GHG emissions from fuels used for international maritime transport will be agreed by the UNFCCC to enable the IMO to implement required policies and instruments.
Policy 5.2 The emission goal will drive the market-based instrument for shipping:
a. To enable detailed design and impact assessment a draft notional emission reduction goal will be used;
b. The following will be assumed: 20% reduction by 2020, and 50% reduction by 2050 from the level in 2005, until an international agreement is reached.15 If agreed in 2008-2009, this will enable early action by creating the scheme with planned operation from January 2012.
2.1.6 A supra-national approach will be adopted for global shipping.
Policy 6.1 A supra-national will be adopted under the governance of IMO, in cooperation with the UNFCCC, in order to deliver efficiency and cost effectiveness of the GHG regime for international shipping.
10 Clean Development and Joint Implementation Project Mechanisms. 11 Stretch target for cost will be to achieve 50% scale savings compared with the retail price for emission allowances on the OTC carbon market (over the counter). 12 Proposed distribution is practically identical to the one proposed during the UNFCCC COP 13 in the International Blueprint for Adaptation, FCCC/CP/2007/MISC.2, by Tuvalu. 13 As the funding will be international an impact multiplier of 3-4 could be used to take into account the pull-through effect for national and private financing. 14 A nearly 50:50 split between near-term and longer-term financing has been obtained by cost-benefit calculations aiming to maximize benefits from these two different investment policies. These included calculating the savings in avoided carbon emitted to the atmosphere from either (1) reducing the emission growth in the near term by a quarter per annum versus (2) bringing forward - by about 10 years - several technological breakthroughs, such as hydrogen transport, through longer-term investment in R&D. 15 Alternatively, a lower ambition might be to stabilize shipping emissions at the 2005 level.. Furthermore, two options might be proposed as was carried out by the EU for their 2020 ambition.

Architecture for Mitigation, Adaptation and Technology Transformation for International Transport
Policy 6.2 A market-based instrument will complement the IMO leadership on standard-based maritime regulations, with any revenue directed to climate change action:
a. A separate scheme will be institutionalized under the governance of the IMO, with the funding parameters adjusted with time to changing conditions and needs by the UNFCCC;
b. Existing multilateral institutions and funds will be leveraged, where appropriate.16
2.2 Contributions to Four Bali Pillars Principles 1-4 map the maritime contributions to the 4 Bali pillars: mitigation, adaptation, technology and financing.17 The proposed financing proportions are illustrated in Fig. 2.
REDD(forestry) CDM & JI
LDCs&
SIDS
Developing Countries
& EITs
Near Term Long Term
Adaptation(50%)
Mitigation (50%)
Technology(extra)
50%
40% Fig. 2: Financing proportions proposed for the 4 Bali pillars
Principle 5 links the proposal to the long-term collaborative goal while principle 6 proposes how and by whom the long-term collaborative action will be delivered for international maritime transport. A supra-national approach to collect international charges has been argued as superior. It avoids concerns on hypothecating revenues seen as national, transferring such revenues abroad when internal priorities change, and local fraud (Müller and Hepburn 2006).
Against the backdrop of the UNFCCC principles, the impact of the proposed principles will be quantified for the developed and developing countries, before I discuss an instrument that can feasibly deliver on these principles.
2.3 Direct Benefits Any economic instrument will lead to a transfer of monies between developed and developing countries, whether it is a cap-and-trade, a charge/levy or a tax, or a hybrid scheme. For international transport, under global rules, any scheme costs will be passed on to the end customer. For shipping, I attribute the cost impact therefore to the countries importing the cargo (goods).18
16 These funds might include the International Oil Pollution Compensation Funds (IOPC Funds) for collection of funding, and Adaptation Fund for distribution of adaptation financing. 17 There will be indirect contributions to technology from mitigation and adaptation projects. The technology element relates to direct funding for maritime technology. 18 At this level it is irrelevant what entities participate in the scheme and at what point in the supply chain the costs are applied, upstream or downstream.
DR ANDRE STOCHNIOL Page 10 of 31 [email protected]

Architecture for Mitigation, Adaptation and Technology Transformation for International Transport
Any analysis must consider as minimum Annex I and non-Annex I countries to the UNFCCC. To fully understand the distributional impact I divide the countries further into the following groups:
Developed (46 countries)
EIT (17 Economies in Transition, excluding Russia)
BRIC (Brazil, Russia, India, and China)
LDCs (47 Least Developed Countries)
SIDS (41 Small Island Developing States; excluding the ones that belong to LDCs)
Developing 2 (70+ developing countries excluding BRIC, LDCs, and SIDS)
I calculate the share of participation costs for a country from the freight costs of goods imported. It is important to note that share of freight costs in import value is higher for the developing countries than for the developed ones, further underlying the need for considering the impact of emission mitigation policies.19
At this stage I assume that all shipping is subject to the same global emitter pays principle, irrespective of who imports the cargo, what cargo is imported (subsistence versus luxury goods), and by what type of ship. This will be reviewed at a later stage. Therefore the participation costs are proportional to the maritime freight import costs.
The population and cost impact of a uniform economic policy for international maritime transport are shown in Fig. 3. The two groups of countries most vulnerable to climate change are shown at the top.
15%
59%
2%
2%
43%
16%30%
22%0%
1%10%
1%
0%
25%
50%
75%
100%
Population Costs
Shar
e
Population & Costs Distribution
LDCs (47)
SIDS (41; not LDCs)
Developing 2 (70+)
BRIC (4)
EIT (17; w/o RU)
Developed (46)
Fig. 3: World’s distribution of population and import freight costs
The developed countries’ share of world import freight costs is estimated at 59% even though by population they account for 15%. At other end of the spectrum the LDCs share of world import freights costs is less than 1%, as they import very little, while by population they account for 10% of world’s population.20 This disparity underscores the arguments for considering equity and differentiated responsibilities for international transport.
19 The share of freight costs in import value was in 2005: 4.8% for developing countries 7.7% for developed countries, and 7.7% for EITs (including insurance, together called c.i.f. costs). The share of freight costs for remote developing islands with small communities, such as SIDS in the South Pacific is higher at 10%. These differences are necessary to properly consider compensatory measures where global rules are put in place for emissions from international transport. Data source: UNCTAD RMT, 2007. 20 Population data is forecast for 2013 (UN Statistics Data, 2007).
DR ANDRE STOCHNIOL Page 11 of 31 [email protected]
Architecture for Mitigation, Adaptation and Technology Transformation for International Transport
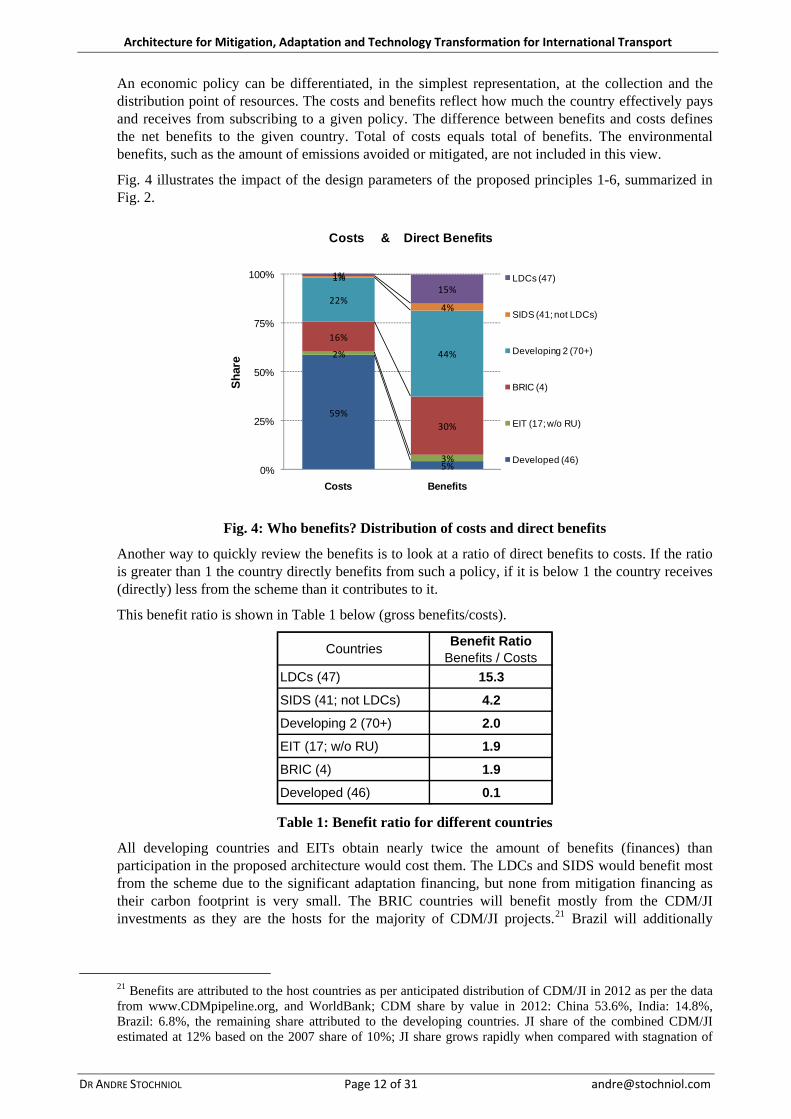
An economic policy can be differentiated, in the simplest representation, at the collection and the distribution point of resources. The costs and benefits reflect how much the country effectively pays and receives from subscribing to a given policy. The difference between benefits and costs defines the net benefits to the given country. Total of costs equals total of benefits. The environmental benefits, such as the amount of emissions avoided or mitigated, are not included in this view.
Fig. 4 illustrates the impact of the design parameters of the proposed principles 1-6, summarized in Fig. 2.
59%
5%
2%
3%
16%
30%
22%
44%
1%
4%
1%15%
0%
25%
50%
75%
100%
Costs Benefits
Shar
eCosts & Direct Benefits
LDCs (47)
SIDS (41; not LDCs)
Developing 2 (70+)
BRIC (4)
EIT (17; w/o RU)
Developed (46)
Fig. 4: Who benefits? Distribution of costs and direct benefits
Another way to quickly review the benefits is to look at a ratio of direct benefits to costs. If the ratio is greater than 1 the country directly benefits from such a policy, if it is below 1 the country receives (directly) less from the scheme than it contributes to it.
This benefit ratio is shown in Table 1 below (gross benefits/costs).
Countries Benefit Ratio Benefits / Costs
LDCs (47) 15.3
SIDS (41; not LDCs) 4.2
Developing 2 (70+) 2.0
EIT (17; w/o RU) 1.9
BRIC (4) 1.9
Developed (46) 0.1 Table 1: Benefit ratio for different countries
All developing countries and EITs obtain nearly twice the amount of benefits (finances) than participation in the proposed architecture would cost them. The LDCs and SIDS would benefit most from the scheme due to the significant adaptation financing, but none from mitigation financing as their carbon footprint is very small. The BRIC countries will benefit mostly from the CDM/JI investments as they are the hosts for the majority of CDM/JI projects.21 Brazil will additionally
21 Benefits are attributed to the host countries as per anticipated distribution of CDM/JI in 2012 as per the data from www.CDMpipeline.org, and WorldBank; CDM share by value in 2012: China 53.6%, India: 14.8%, Brazil: 6.8%, the remaining share attributed to the developing countries. JI share of the combined CDM/JI estimated at 12% based on the 2007 share of 10%; JI share grows rapidly when compared with stagnation of
DR ANDRE STOCHNIOL Page 12 of 31 [email protected]

Architecture for Mitigation, Adaptation and Technology Transformation for International Transport
DR ANDRE STOCHNIOL Page 13 of 31 [email protected]
benefit from significant portion of funding for REDD (forestry). The remaining developing countries will also obtain significant benefits. Their benefits will increase with time as more CDM/JI projects are started in these countries.
The potential for purchasing credits for programmatic CDM is not included in this estimate as the calculations are based on the current project pipeline. Programmatic CDM are anticipated in the revision of the CDM mechanisms for post-2012 framework.
The design parameters influence the distribution of benefits, and would need to be negotiated. The sample values combine adaptation, mitigation and technology in a single scheme and deliver benefits distribution that seems equitable.22
2.4 Historic Responsibility In the previous section I have outlined the disbursement proportions that qualitatively deliver on the common but differentiated responsibilities. The greatest amount of funding would be for the most vulnerable and most affected by climate change (LDCs and SIDS). The relevant proportions can be changed through party negotiations and agreement.
Arguably the above is a second best outcome in the absence of a precise assessment of the fairness of the distribution. The precise approach would require adaptation cost figures per each country and these do not generally exist, and the ones available are highly uncertain.
Regarding the cost burden, some studies calculated that Annex I countries should shoulder about 65%, and not less than half the burden for all emissions (Müller et al. 2007). I have shown that the burden on developed countries (Annex I) is about 55%, as they receive very little direct benefits from their contributions of 59%.
There is no direct net financial return for developed countries. However, the calculations have not considered the cost of inaction, benefits to climate change and benefits from reduced cost of transport due to improvements brought by the scheme.
Analyzing historical emissions from international shipping provides another perspective on responsibilities of Annex I countries. The total emissions over the last century from international shipping are very likely to be under 30 GtCO2.23 This “emission debt” could be paid by Annex I countries over the next 40 years. An initial payment could be equivalent to around 0.5 GtCO2/annually, increasing with time. This is broadly comparable with the net payments of Annex I in the proposed scheme, which is equivalent to around 0.6 GtCO2.24
This approach to differentiation seems consistent with the UNFCCC principles and reflects historical responsibility of developed countries. Furthermore, the difference in real terms, or when compared with GDP/capita, is highly affordable for the developed countries.
2.5 Equity Beyond Country Differentiation I now turn our attention back to the differentiation at the collection point. National differentiation at the collection point is very difficult. Many experts and countries argue that the unique and integrated
credits from the CDM projects. The JI projects split into three nearly equal shares between: Russia, remaining EITs and developed countries. 22 In the case that all financing is allocated to mitigation the BRIC countries would be the biggest winners, gaining because of the high concentration of CDM/JI projects in these countries. Conversely, if all financing was allocated to adaptation, LDCs and SIDS would secure a significantly higher proportion of the benefits, albeit at the cost of no emission reductions. A middle point on the mitigation-adaptation spectrum is most likely to provide the correct mix of interventions to secure long-term climate benefits. 23 Based on aggregating the data from Eyring et al, 2005.
Architecture for Mitigation, Adaptation and Technology Transformation for International Transport
DR ANDRE STOCHNIOL Page 14 of 31 [email protected]
global nature of the international aviation and maritime sectors means that there are no apparent equity grounds for discrimination based on the national origin of the carrier (UNFCCC 2008a).
Differentiating by type of ships offers one way to expand equity to the individual, or end customer level. This is important as it is the end customer that emission costs will be eventually passed on to.
In theory, it would be more economically efficient to levy the same charge across all shipping and provide direct financial support to the most vulnerable groups. However, implementing such a transfer may be well beyond capacities of many developing countries, and could prove prohibitive on cost grounds.
Commodities are transported by bulk ships. Subsistence goods, like grain, are transported by dry bulk ships. But high value merchant goods are transported by container ships. The net emissions from container ships grow more than twice as fast as from all the other ships.25 This trend is forecast to continue. In Europe till 2030 the annual transport increases are predicted as: dry bulk goods 2.4%, liquid bulk goods 0.4%, containerized goods 7.9% (Berenberg Bank, 2006).
Therefore it might seem inequitable if, for example, the costs of higher growth of emissions from containers will be passed on through average emission charges to the end customer importing subsistence goods. The impact of any policy on importing subsistence food needs careful consideration especially given rapid price growth in recent years.
An initial differentiation could be to treat emissions from container ships as one emission bubble and emissions from all other ships as another (international emissions only).
The proposed differentiation will not impact competition, as different types of ships do not compete against each other due to different cargo. It will allow more efficient linkage to the polluter pays principle while accounting for differences in ability to pay.
The ability to pay for customers importing merchant goods is higher not only because they can afford these goods in the first place. The share of freight cost in price of merchant goods is much lower than in the price of low value bulk goods.
If so decided, the IMO could feasibly expand the differentiation of charge beyond just the two categories containers and non-containers. This could allow aligning with the seven categories proposed in the IMO for a mandatory CO2 design index for new ships.26 However, the additional complexity might not be justified on cost-benefit analysis and at this stage is not recommended.
To implement the architecture a flexible instrument is needed and I describe and review my proposal for such an instrument.
3. Feasible Instrument
3.1 Feasibility, Effectiveness and Efficiency Against the backdrop of the architecture principles discussed in the previous section I now asses which instrument would best “fit” the architecture. As with most economic instruments, the key criteria to evaluate the potential value are feasibility, effectiveness and efficiency. I now introduce International Maritime Emission Reduction Scheme (IMERS) in the context of these criteria.
24 The Annex I share of around 0.6 GtCO2 is based on the import responsibility calculations, 59% of 1 GtCO2. The 59% share nearly matches the share of goods unloaded in developed countries, by weight: 58%. This is a useful validation of the methodology and parameters employed (source: UNCTAD, 2007). 25 Emissions are correlated to seaborne trade and following statistics show how fast the containerization trade is growing. Total maritime trade has doubled from 1985 to 2007, total containerized has grown eight-fold over the same period and currently represents 16% of all maritime trade by weight (and up to 70% by value, according to some estimates). Transport by container ships is projected to triple from 2000 to 2020. 26 These seven ship categories are: dry bulk carriers, tankers, gas carriers, container ships, general cargo ships, Ro-ro cargo ships (roll-on roll-off), and passenger ships.

Architecture for Mitigation, Adaptation and Technology Transformation for International Transport
I provide in-depth details as feasibility for a global scheme is essential, and I review costs as the scheme needs to provide significant funding.
3.2 IMERS – a hybrid cap-and-charge scheme The instrument is based on an emission charge to be applied to a defined group in international shipping. The charge is calculated based on the prevailing forward market price for CO2 and a negotiated emission reduction goal. This makes it an alternative to cap-and-trade. The emission charge is not a levy or a tax set at some arbitrary level. The goal (cap) together with the market dictates the level of emission charge, rather than any single body that may be subject to outside influence, and interest group pressure or capture.
A long-term emission reduction goal is the key measure employed in this proposal to enable shipping to equitably and effectively contribute to the reduction of total GHG emissions. To calculate the charge for emissions, IMERS uses a long-term notional emission reduction goal for CO2 for the ships under the scheme. The notional goal allows the unrealized reductions to be purchased from other sectors and projects, by acquiring emission credits. The setting of such a goal for international maritime transport is within the domain of the UNFCCC. The IMO can propose it together with an appropriate delivery mechanism. The goal could be established and subsequently adjusted with the changing climate change framework.
Shipping could contribute to climate stabilization and significant overall reductions of GHGs through an ambitious yet affordable goal. Two illustrative options are proposed:
1. 2005 level: notional emissions at the level of emissions in 2005
2. 20-50 from 2005: reductions of 20% in 2020 and 50% in 2050, from 2005 base
0
0.2
0.4
0.6
0.8
1
2005 2020 2035 2050
Nor
mal
ized
Em
issi
ons
Notional Long-term Goals
2005 level
20-50 from 2005
20-50 from 1990
Fig. 5: Potential emission reduction goals
Another option could be a 20-50 emission goal from 1990. In this even more ambitious option, the 20% and 50% emissions reductions in 2020 and 2050 respectively, are defined in reference to the 1990 base. These three different options are illustrated above with a common reference to 2005. I will use the middle option 2 as illustration.
The main elements of the proposed hybrid scheme include, as shown in Fig. 6:
1. A notional emission goal for international shipping
2. A group of ships greater than 400 GT (equivalent to up to 70,000 ships in 2007)
3. A group of fuel buyers accountable for emissions from the above ships (few thousands worldwide)
a. These are ship owners/operators or charterers, depending on business model27
27 An upstream version of the scheme would use fuel suppliers. Such version would be less aligned with polluter pays principle. Also, suppliers have no influence on emission reductions from ships. Fuel buyers do as they decide how quickly the ship sails and so on.
DR ANDRE STOCHNIOL Page 15 of 31 [email protected]

Architecture for Mitigation, Adaptation and Technology Transformation for International Transport
4. Emission markets for a variety of CO2 equivalent emission credits
5. A scheme entity (a new organization to be created)
6. A unit emission charge for the ships under the regime
7. Adaptation and technology funding
SCHEME ENTITY(NEW)
EMISSION MARKETS
C
B
A
…
FUELBUYERS
ADAPTATION & TECHNOLOGY
FUNDING
NotionalEMISSION
GOAL
UNIT EMISSIONCHARGE
2
…
SHIPS> 400GT
1
3
4
5
Fig. 6: Key elements and entities of IMERS
Unit emission charge. The unit emission charge for the ships under the regime is to deliver predictability. It is preferably calculated at least 1 year in advance. It is calculated from a cost formula based on emission growth above the notional emission goal and a market price for the emission credits, as illustrated in Fig. 7. This avoids the need to know the highly uncertain emission baseline.28
Emissions (E)
Goal (G)
(E-G)/E x CO2 price = Emission Charge
(excl. tech R&D)
Fig. 7: Calculating unit emission charge
A mark-up for technology needs is added to comply with the technology design principle of the proposed architecture. The value of the mark-up is derived from agreed near-term and long-term benefits to be achieved.
28 The estimates for total emissions from shipping vary significantly, by up to a factor of 2. However, the varied emission forecasts after normalization versus a given year are very close to each, thereby enabling the cap-and-charge approach, while avoiding the barrier of highly uncertain absolute emissions. See: Stochniol 2007.
DR ANDRE STOCHNIOL Page 16 of 31 [email protected]

Architecture for Mitigation, Adaptation and Technology Transformation for International Transport
DR ANDRE STOCHNIOL Page 17 of 31 [email protected]
The emission charges due are calculated based on the unit emission charge and amount of fuel purchased.29 These charges are collected from fuel buyers. These buyers are the business entities that pay for the fuel in given commercial circumstances, typically ship owners/operators or charterers. Ultimately though, the emission costs are paid by the end customers as the emission charges are passed through to them. The emission charges are collected centrally by the scheme entity, employing best business practices for direct payments, and billing and collection.30
An example scenario for a ship arriving at a port, participating in the scheme is as follows:
1. Validate data from the already mandatory fuel receipts with reports extracted automatically by the scheme31 a. Mismatch found: submit data on ship’s behalf.32
2. Check payment of emission charges for the period ended 3 months earlier a. For outstanding but not yet overdue charges: advise/remind on the direct payment option;
offer collecting the emission charges and submitting to the scheme for a small fee; b. Charges not paid: decline access to port until the charges and a penalty are fully paid.
3. Check for fraud when prompted by the central business intelligence tools.
The centrally collected monies are divided into three portions: mitigation fund, adaptation contribution, and technology fund. The mitigation fund purchases emission credits for the entire scheme. They are purchased on emission markets and can be acquired through national agreements. The adaptation contribution is provided to the UNFCCC funds for adaptation to climate change in developing countries. The technology fund invests in near-term and long-term technology development and transfer. To fulfill the mitigation-adaptation architectural principles without halving the mitigation goal or doubling the cost to shipping, a variety of efficiency gains will be leveraged. This will include acquiring the emission credits directly on the primary markets where the prices are much lower, and purchasing emission credits from REDD.
Additional differentiation at collection point. As described earlier, ships can be divided into two major groups: container ships and all other ships. Each group will be treated as a separate emission bubble. Containers would pay a higher unit emission charge due to greater emission growth. The containers charge would be around 40% higher than for the other ships.33 Additionally, bulk ships importing food may be exempt from the charges (subject to agreement).
Impact on direct benefits. The operational cost will be under 5% and will be more than covered by the additional economic benefits of the scheme. I therefore ignore these small costs.
The distribution of benefits will be practically identical to the generic architectural case. The distribution of costs will slightly change when the differentiated charges per container ships are implemented. The share of costs for developed countries will increase to 61% from 59%
29 Fuel used is another alternative; however it requires a data currently not easily available to external parties. 30 These practices will reward fuel buyers registered for direct billing, through reduced transactions costs, consolidated billing, reporting, and additional services. Additionally, fuel data might be extracted from transaction data and obsolete the need for fuel data reporting, as most fuel purchases are for hundreds of thousand of dollars. 31 The receipt is called Bunker Delivery Note (BDN); the BDN must be retained on board of ship for a period of three years after the fuel has been delivered. BDN includes the name and IMO number of the receiving ship, port of bunkering, contact information of the marine fuel supplier, and fuel quantity, as well as some other data, including a physical sample of fuel. 32 This will happen when the transaction data has not been automatically extracted by the central scheme nor reported voluntarily by the fuel buyer, or fuel seller. 33 The difference in charges depends on the emission growth and emission goal. For the default goal of 20% below 2005 and the current emission growth from containers more than double of other ships, the charge for containers will be about 40% higher than for the other ships.

Architecture for Mitigation, Adaptation and Technology Transformation for International Transport
DR ANDRE STOCHNIOL Page 18 of 31 [email protected]
(approximately 10% increased impact on the developed countries).34 The shares of cost for the remaining countries will decrease accordingly.
Structurally, the scheme will deliver on the benefits as per the generic architecture. The benefit ratios for the developing countries will slightly increase however for the case with differentiated charges for containers.
The scheme would have the following requirements:
1. Create a central administrative entity for collection of charges, and operation of central registry for fuel buyers and other stakeholders
a. In some way similar in concept to route charges in aviation;
b. No impact on flag states.
2. Make a legal requirement for ships above 400 GT to participate
a. Preferably through amendment of Annex VI and its tacit procedure of approval (16 months);
b. Leverage regulation 18 and Bunker Delivery Notes (BDNs).
3. Agree to a condition that parties found supporting evasion of the scheme might not be entitled to share in its benefits to avoid bypassing MARPOL Annex VI for fraudulent reasons.
Political and operational steps. The discussion and agreement of scheme principles could enable rapid progress within the IMO and the UNFCCC. This should include, inter alia, split of funds and the notional emission reduction goal to drive the scheme. Some of these could be completed in 2008. Amendments to MARPOL Annex VI and establishing of a governing could follow in 2009.
The earliest start date is therefore 2011. A minimum of 1 year is needed to build, test and deploy the central systems and processes (the same as for an alternative upstream approach to collect the charges).
3.3 Why hybrid? Comparison of Two Schemes Policy makers prefer to use quantity instruments to deliver emission reductions such as the European Emission Trading Scheme (EU ETS). The overriding reason, political acceptability arising from a clear emission goal, is so strong that the cost-benefit analysis is often not performed against price and hybrid instruments which display equivalent or better efficiency.35 Incorporating a quantity goal to reduce emissions in IMERS was the foundation of the scheme.
Discussions about the advantages and disadvantages of different market-based instruments to address climate change have led practitioners to the following pragmatic conclusion. The answer to two primary questions will help to determine which market-instrument is best. Namely, which instrument is:
1. Likely to be better designed? 2. More flexible?
In the context of the Bali Roadmap, I would add that the instrument should be flexible enough to accommodate adaptation to climate change and technology transfer to developing countries in a predictable, adequate and verifiable manner.
34 The calculations took into account that emissions from containers constitute more than 20% of total emissions from shipping, and the different proportions of container use for developed and developing countries. 35 Discussed by many economists, including: M. Weitzman, W. Nordhaus, C. Hepburn (2006), W. Pizer. The hybrid schemes are only recently receiving significant attention as they theoretically can be more complex, but politically are often superior for acceptability.

Architecture for Mitigation, Adaptation and Technology Transformation for International Transport
As described earlier, the proposed scheme is based on a unit emission charge derived from the quantitative emission reduction goal and the forward carbon price. I therefore call it “cap-and-charge”, or simply a hybrid scheme, for negotiators.36
Characteristics of cap-and-trade schemes are well known (Hepburn 2006). Practical difficulties of designing and implementing a cap-and-trade for shipping have been discussed in recent years.37 Scaling the quantity instruments (cap-and-trade) globally, even for a single industry, is without precedent (Kruger et al. 2007).
Nevertheless, I compare my cap-and-charge with a potential or hypothetical cap-and-trade for shipping to review which one is likely to be better designed and more flexible.
To convey the differences I adapt a so-called strategy canvas.38 It highlights the barriers eliminated, issues reduced, and value raised, and created (as shown in Fig. 8).
Barriers Value
DR ANDRE STOCHNIOL Page 19 of 31 [email protected]
Cap-and-Trade
Hybrid Cap-and-ChargeIMERS
Eliminate CreateRaiseReduce
1.Baseline
2. Allocation of emissions
3.Distribution of allowances
4.Impact on competition
5.Cost
6.Set up time
7.Effectiveness
8.Flexibility
9. Scale 11.Adaptation benefits
High
Level of Issues
or Value
Low
10.Technology benefits
Issues
Fig. 8: Strategy canvas for cap-and-charge (in blue) versus cap-and-trade (in red)
They are:
1. Barriers Eliminated: a. Baseline (need for reliable emission data) b. Allocation of emissions c. Distribution of allowances
2. Issues Reduced: a. Impact on competition b. Cost c. Set up time (down to 2 years)
3. Value Raised: a. Effectiveness b. Flexibility
36 It was presented also as “cap-charge-trade”, to signify the trading aspect, or “charge-and-cap” to signify that is based on prices (Pettersen 2007, IMO 2007b), and recently as “levy-cap-and-trade” combining the two aspects (IMO 2008b). 37 See CE Delft (2006), Faber (2006) 38 Adapted from techniques used to plan for new market space, as proposed by Chan Kim and Renée Mauborgne, in the Blue Ocean Strategy, HBS Press; http://www.blueoceanstrategy.com/

Architecture for Mitigation, Adaptation and Technology Transformation for International Transport
DR ANDRE STOCHNIOL Page 20 of 31 [email protected]
c. Scale (from regional to global)
4. Value Created: a. Technology benefits (near- and long-term improvements) b. Adaptation benefits (from contributions to the Adaptation Fund)
The well known barriers of cap-and-trade, namely the need for a reliable emission baseline, need to allocate emissions and distribute emission allowance are eliminated by cap-and-charge. These barriers are nearly insurmountable for international shipping, starting with very high uncertainty about the total emissions.
In a world of scarce resources, the more cost-effective the means, the more feasible is an ambitious goal (Aldy and Stavins, 2007). The major point of the strategy canvas is to show that resources saved on issues eliminated and reduced can be redeployed to raise and create value elsewhere. The new value of cap-and-charge is the technology and adaptation benefits created.
The cost element is therefore paramount. There are two aspects: how much would the participants of the scheme need to pay on average, and what are the operational and transactional costs.
The charges in IMERS are set only to have enough funding to purchase the relevant number of emission credits, plus additional contributions for technology. When compared with the cap-and-trade with auctioning of 10%, the unit emission costs are practically equal (28.5% and 27% of carbon price, for IMERS and cap-and-trade respectively). With auctioning of 65% of permits as planned for the EU from 2013, IMERS costs significantly less.39
I now consider the cost of establishing and operating the regime. Helm (2005) notes that the institutional burden of constructing a tradable-license scheme can exceed that of a tax. Such cost penalty is highly likely for the large number of small participating ships (dozens of thousands). Concerns that the operational burden for cap-and-trade would use up a significant part of any revenue generated while at the same time penalizing small participants appears to be justified.
Therefore, for the above two reasons the comparative cost in Fig. 8 for IMERS is significantly reduced when compared with cap-and-trade.40
Importantly, cap-and-trade only delivers on the mitigation while cap-and-charge delivers also on adaptation and technology through the economy of scale (this assumes that the auctioning revenue in cap-and-trade is not directed to such goals but used primarily for other domestic reasons).
From qualitative comparisons, I move now to quantitative assessment of IMERS, including cost and benefits, and cost of inaction.
3.4 Costs and Benefits 3.4.1 Costs and Funds
Impact of the scheme depends on the agreed notional goal and is estimated in 2012 as:41
1. Cost perspectives:
a. End customer:42 0.1% (equivalent to $1 for every $1,000 of imported goods)
39 See details and graphs at: www.imers.org/costs 40 It is estimated that the total operational costs of IMERS will be less than 5% of all revenue. 41 Assumptions used: participating vessels: all > 400 GT in international shipping, CO2 emissions in 2005 rounded to 1 GtCO2, emission growth 2.1% (aligned with the IMO MEPC 57/4), forward market CO2 price $30/tCO2, fuel price $500/t HFO. Note: the unit emission charge is equal to 29% of the carbon price due to the amount of emissions above the notional goal plus the additional contributions for the transformational technology funding, and operational costs. Cost impact for ships using purely MDO fuel is lower by about 50%, in relation to the higher price of such fuel. 42 The end customer impact is calculated by multiplying the freight cost increase by the average percentage of freight costs within the end user prices of 5% (5% of 2% = 0.1%). The impact on freight costs is calculated by

Architecture for Mitigation, Adaptation and Technology Transformation for International Transport
DR ANDRE STOCHNIOL Page 21 of 31 [email protected]
b. Freight cost: 2% increase
c. Emission charge: $27/ton of fuel (passed on to the end customers; equivalent to around 5% of cost of fuel)
2. Funds per annum just under $10bn, of which:
a. Technology: $1.6bn (of which $0.8bn for long-term, $0.8bn for near-term)
b. Mitigation: $4bn
c. Adaptation: $4bn
IMERS will not constrain the economic growth because of relatively low emission charges, equivalent to around 5% of fuel price. Moreover the opposite impact should occur as the investment in technology transfer and transformation will lead to efficiency improvements thereby reducing the cost of transport in developing countries.
3.4.2 Environmental Benefits
Environmental benefits stem from both the technology and mitigation funding. The emissions avoided from the market mechanism are assumed negligible.43 Global environmental benefits of the scheme are estimated at 26-44 GtCO2 by 2050.44 Table 2 below summarizes emissions avoided and mitigated. It also provides plausible estimates for 2051-2100, based on modelling future step-changes in technology for shipping. The ultimate benefits will depend on trade growth, market conditions, as well as scale and timing of technology transformation.45
By 2050, GtCO2 2051-2100, GtCO2
Emission avoidance (technology): 8 32
Emission mitigation: 18 – 36 24
Total environment: 26 – 44 56 – 80
Table 2: Environmental benefits
3.4.3 Near- and Long-term Benefits
The importance of balancing investment in mitigation and technology is shown visually in Fig. 9. The graph illustrates emissions avoided (top area, in blue) and minimum range of emissions mitigated (next area below, in yellow). The next area (in green) represents adaptation funding to simultaneously illustrate the effect of equally dividing the funding between adaptation and mitigation. At the bottom the notional emission reduction goal that drives the scheme is shown.
multiplying the percentage of emission charges in the fuel bill ($27/$500 = 5.4%) by the percentage of the fuel bill in the total cost of shipping (about 1/3). Therefore impact on freight costs = 1.8% (%5.4/3) 43 The small charge estimated at 5% of the fuel price will not significantly reduce the demand or impact economic drivers for ships. 44 The range of emission mitigation is related to proactive investment policy of the scheme. The mitigation funding should deliver around double of the emission reductions as they will be purchased on the primary markets and on the markets for REDD. The lower range shows the “guaranteed” reductions as per over the counter (OTC) prices. The higher range is the target to the mitigation fund managers, corresponding to emissions acquired at average of half of the OTC price. 45 Scale includes an emission reduction per ship (ER), and a portion of fleet affected (FA). Timing is defined by a switch-over period (SOP), where SOP is the time it takes for each transformation to be fully deployed. The presented model assumes three (3) technological step changes. Each step assumes a combination of alternative fuels and new ships. Parameters used are shown as step, ER, FA, SOP: (1) 40%, 30%, 2050-2070; (2) 95%, 40%, 2070-2100; (3) 97%, 30%, 2080-2100. ER covers the entire fuel cycle, including its production. This is to avoid crediting emission reductions in shipping while creating increase in upstream production for instance.

Architecture for Mitigation, Adaptation and Technology Transformation for International Transport
Not investing in near-term improvements and technology transfer will lead to an increased emission peak while not investing in longer-term will delay the future technological breakthroughs and their rapid deployment.46
0
1
2
3
2005 2020 2050 2100
Benefits (for 20-50 notional goal from 2005)
8
18+ GtCO2
32 GtCO2avoided
24+ GtCO2mitigated
Adaptation to Climate Change
Notional Emission Goal
2011
EmissionsGtCO2
Do nothing(optimistic)
Cooperative action
Fig. 9: Environmental benefits of cooperative action in shipping, IMERS
3.4.4 Cost of Inaction (delay)
Delay could be caused by a variety of factors including prolonged discussions of the proposed scheme, and long implementation time for alternative proposals that are conditional on availability of reliable data, as is the case for a cap-and-trade scheme, for instance. The environmental cost of a 3 year delay to act is estimated at 1.4-1.8 GtCO2 by 2050 alone. The cost of delay to the developing countries is $12bn in financing for adaptation to climate change not being made available ($4bn annually).
In summary, this proposal could stimulate increased efficiency of ships and infrastructure by providing necessary incentives in the most cost-effective manner, while simultaneously contributing to adaptation to climate change in developing countries, and addressing capacity building, technology development and transfer.
4. Discussion and Progress
4.1 Legal and Implementation Considerations The legal basis for IMERS can be summarized as follows:
• WTO rules do not contradict a harmonized emission charge
• IOPC Funds form a precedent for direct collection of funds bypassing national systems
• MARPOL convention could regulate GHG emissions from shipping
WTO and the UNFCCC have sustainable development as one of their objectives. This is referenced in the WTO preamble,47 while international trade is cross-referenced in article 3.5 of the UNFCCC.48
46 The technology funding will deliver emissions avoided through reduced emission till 2050, and contribute to emissions avoided after 2050 as the peak of emissions will be lower. The long term funding will bring significant emissions avoidance after 2050 thanks to bringing forward, by a number of years up to 10, the technical breakthroughs to dramatically reduce emissions. 47 WTO: “Recognizing that their relations in the field of trade and economic endeavour should be conducted with a view to […] allowing for the optimal use of the world's resources in accordance with the objective of sustainable development, seeking both to protect and preserve the environment and to enhance the means for
DR ANDRE STOCHNIOL Page 22 of 31 [email protected]

Architecture for Mitigation, Adaptation and Technology Transformation for International Transport
DR ANDRE STOCHNIOL Page 23 of 31 [email protected]
Within the maritime industry there is already a legal precedent for a supra-national fund organization in the International Oil Pollution Compensation Funds.49 The importance of the precedent is that the contributions to the funds are direct, bypassing the national tax systems.
The IMO develops and promulgates international regulation on air emissions from shipping. As it is typical for other IMO regulations the legal subject for the GHG regulation will be the ship, with physical enforcement in Port States.
Taking into account the urgency of the matter, the most straightforward approach to implement legislation on the GHGs from shipping is to amend Annex VI to the MARPOL Convention50 with a part II on GHG emissions (IMO 2008a). Time to enter into force of such amendment is likely to be only 16 months. A route through a new convention would take many years. However, as the MARPOL is mostly a technical and standards driven convention it might be advisable to limit the additions to similar content and rules (IMO 2008c).
Therefore, it seems advisable that some of the elements of legislations could be left to the business best practices and economics of low-cost compliance. Nearly all bunker fuel is bought on credit terms.51 Emission charges could therefore leverage credit terms practices. Enforcing bunker claims can provide a wealth of experiences, relevant laws and best practices.52
4.1.1 Checklist for International Charges
The lessons learned from the ICAO where the subject of environmental charges has been discussed for many years are useful to consider. The rules and recommendations are clear that any charge to be seen as not contravening international conventions and bilateral regulations should fulfill three criteria (ICAO 2007):
• Transparency
• Be related directly to costs
• Cannot be used as a fiscal instrument (to raise national revenue)
The IMERS proposal clearly defines how the unit emission charge is calculated, and relates it directly to the emission mitigation as defined by the market costs. Furthermore, IMERS bypasses the national fiscal systems. In fact it will implement the Rio Principle 16 on internalizing the costs of environmental damage by relating the charge to the maritime emissions and market costs for carbon.
doing so in a manner consistent with [members’] respective needs and concerns at different levels of economic development” 48 “The Parties should cooperate to promote a supportive and open international economic system that would lead to sustainable economic growth and development in all Parties, particularly developing country Parties, thus enabling them better to address the problems of climate change. Measures taken to combat climate change, including unilateral ones, should not constitute a means of arbitrary or unjustifiable discrimination or a disguised restriction on international trade.” 49 IOPC Funds are three intergovernmental organisations which provide compensation for oil pollution damage resulting from spills of persistent oil from tankers. The organisations are: the 1971 Fund, 1992 Fund and the Supplementary Fund. www.iopcfund.org 50 MARPOL 93/97 Annex VI was ratified in 2004, and entered into force on 19 May 2005. It applies to emissions of nitrogen oxides (NOx), sulphur oxides (SOx). Volatile organic compounds (VOCs) and addresses fuel oil quality, particularly record keeping, fuel sampling and the issues of Bunker Delivery Notes (BDNs). Including GHGs or just the CO2 within Annex VI has the additional advantage of reuse of other regulations, notably the regulation 18 on BDNs. 51 These transactions are for hundreds of thousand of dollars each, as typical bunkering is for few hundred tons of fuel costing in excess of $500/ton in 2008. 52 It might be legally easier to implement an electronic emission certificate for each BDN through a central database. Adding a sequence number to the BDN per ship and/or fuel supplier is a legally simple amendment needed for efficiency. This will be also an effective route to prevent charge avoidance and detect potential fraud. For enforcing bunker claims see Chua & Gan, 2006.

Architecture for Mitigation, Adaptation and Technology Transformation for International Transport
DR ANDRE STOCHNIOL Page 24 of 31 [email protected]
The basis and formula for the calculating the charge should therefore be included or referenced in the appropriate regulation.
4.1.2 Governance
Establishing a separate Administrative Entity (AE) accountable to the IMO is preferable (IMO 2008b). The AE will be responsible for collection of the emission charges from fuels used in international maritime transport and disbursements of funds generated.
Adjustments for New Realities
I propose that periodic governance mechanisms would allow for adjustment of charges and funding policy to new realities.
• Every 4-8 years, the UNFCCC should undertake a review of the funding policy and adjust the top level structure, or portions of the different funds for mitigation, adaptation and technology.
• Every 2-4 years, the IMO should undertake a review and potential adjustment of the emission parameters and goals, and priorities for the technology fund.
• Every year, the Administrative Entity should undertake a market price review and setting of the new emission unit charge, within the rules established for its operations.
Decisions will be valid from the year after next, for the next relevant period. This approach will guarantee predictability and long-term investment signals for the industry.
4.1.3 Incentives for Participation
To complete the description, I review in brief the incentives for participation and compliance. Barrett and Stavins (2003) identify three positive incentives: explicit side payments, issue linkage and the allocation of entitlements.
IMERS fulfills the first by providing a benefit factor in excess of 2 to developing countries. For developed countries the benefits stem from reducing these emissions at low cost and gaining politically from getting them resolved effectively.
The second criterion is achieved through the portfolio approach by linking mitigation, adaptation and technology to the benefits of three stakeholder groups: developed countries, developing countries and the industry.
The last incentive category is not delivered by a charge-based scheme, as no allocation of emission allowances is implanted.
The benefits to industry participants are summarized as follows:
• Hassle free solution for CO2 emissions with minimal administration costs (no allowances to manage, no individual cap to comply with, services provided, no set-up costs)
• No impact on international competitiveness (level playing due to global implementation)
• Increased cash flow (EBIDTA) as a result of improved operations and reduced fuel (important as share of fuel costs approaches 50% of operational costs for container ships)
• Reduced risk of fuel disputes
• Low cost of compliance
• Reduced risk of multiple regulations
• Benefits of better image for no cost (clean transport, social responsibility)
Finally, the compliance will be easily verifiable via already available fuel and voyage data, and additional analytical tools that will automate the relevant checks.

Architecture for Mitigation, Adaptation and Technology Transformation for International Transport
DR ANDRE STOCHNIOL Page 25 of 31 [email protected]
4.1.4 What is not Covered
The proposed architecture does not deal with large scale projects that could bring significant emission reductions to the entire shipping sector, such as the widening of the Panama Canal, opening the Northern Route and so on.
The proposed technology fund could indeed invest some seed financing to initiate such infrastructure-type projects. However, for incentives a new CDM methodology for large maritime projects should be developed in the post-2012 regime. This could contribute to improving the shipping infrastructure between developing countries, for instance in Malacca Strait or in Africa.
For additional IMERS’ details please refer to the Appendix.
4.1.5 Improving Differentiation Further
Even though the architecture provides significant direct benefits and several differentiation mechanisms it may be seen by some as not fully delivering on differentiated responsibilities.
Providing a flexible instrument is deployed, additional differentiation could be added at the collection point. Emission charges may be differentiated based on point of origin, destination point, or both. IMERS additional differentiation could be as follows, in a given period of time:
• Ships transporting goods only to Annex I countries pay 100% of emission charges;
• Ships transporting goods only to non-Annex I countries pay zero (0);
• Ships transporting goods to both types of countries pay a variable charge based on relevant mix of transport work (world average just under 60%).
The cost of emissions would most likely be recovered through increased freight prices on imports to Annex I countries only, thereby resolving the differentiation issue at hand.
A narrower scope could reduce the environmental effectiveness and amount of funding aggregated. This would depend on the stringency of the goal applied. For the goal staying the same, the total benefits would be around 60% of the numbers provided earlier. For instance the amount of adaptation funding would be $2.4bn rather than $4bn annually.
A binary differentiation may even be replaced with country-specific obligation factors. These are typically defined in relation to responsibilities and capabilities,53 but so far have been only proposed to address equity of emission allocations.
4.2 Multilateral Progress Within one year of its creation IMERS has gained significant traction.54 It is perhaps one of the most promising proposals to fill the adaptation “funding chasm”.55 It is novel, ambitious but affordable, and legally feasible.
It has been well received and further shaped at dedicated UNFCCC side events56. Importantly, it has been followed by state submissions to the multilateral process at the IMO and discussed within the UNFCCC.57
However, even the best proposals require vision and leadership at the highest level when billions of dollars of innovative financing can be generated by them. Some of the judgments on fulfilling the common but differentiated responsibilities are political and perhaps should be addressed at a higher decision making level than they are currently.
53 See for example, The Greenhouse Development Rights Framework, www.ecoequity.org/GDRs 54 See: www.imers.org/buyin/achieve 55 See: the most recent report for G8 (Grubb 2008). 56 See: Stochniol & Müller 2007, Stochniol 2008 57 These include: IMO 2007a, IMO 2007b, IMO 2008b. Within the UNFCCC, the hybrid scheme has been brought up and discussed in each session from the COP 13 in Bali, 2007 onwards.

Architecture for Mitigation, Adaptation and Technology Transformation for International Transport
DR ANDRE STOCHNIOL Page 26 of 31 [email protected]
This policy paper aims to increase the momentum to that goal.
4.3 What about Aviation? International aviation shares many characteristics with international maritime transport. At the same time, the number of stakeholders is much greater and there is a solution being pursued in Europe. Aviation is planned to be included in the EU ETS from 2012 for all incoming and outgoing flights.
The market-based schemes for aviation and maritime could, and perhaps should be different, to increase the chances of success and learn from experiences. A cap-and-charge for aviation, although theoretically possible, is perhaps unlikely due to the amount of political capital engaged in bringing aviation to the EU ETS.
However the overall architecture could still apply to aviation. It will increase the incentives for developing countries to participate in the aviation ETS that they currently oppose on equity grounds. Auctioning of some of emission allowances will be the source of revenue rather than charges. Alternatively, a levy on air tickets, such as the International Air Travel Adaptation Levy (IATAL), could be implemented (Müller and Hepburn 2006).
5. Conclusion In conclusion, the deadlock to address emissions from international maritime transport can be resolved through the proposed architecture, balancing the interests of all parties.
The cap-and-charge instrument has been shown to be flexible, efficient and effective. Importantly, it has already gained support from several states.
The legal precedence for supra-national charges already exists in shipping through the IOPC Funds. The process to implement amendments to existing maritime environmental regimes can be as quick as 16 months.
The proposed architecture can be used to hammer out the maritime deal on the right political level - and in time for the key Copenhagen Climate Change Talks in 2009. Otherwise, the risk of inaction is twofold: repeat Kyoto’s failure to address international transport emissions, and fail to provide financing for adaptation to climate change crucially needed for the most vulnerable.
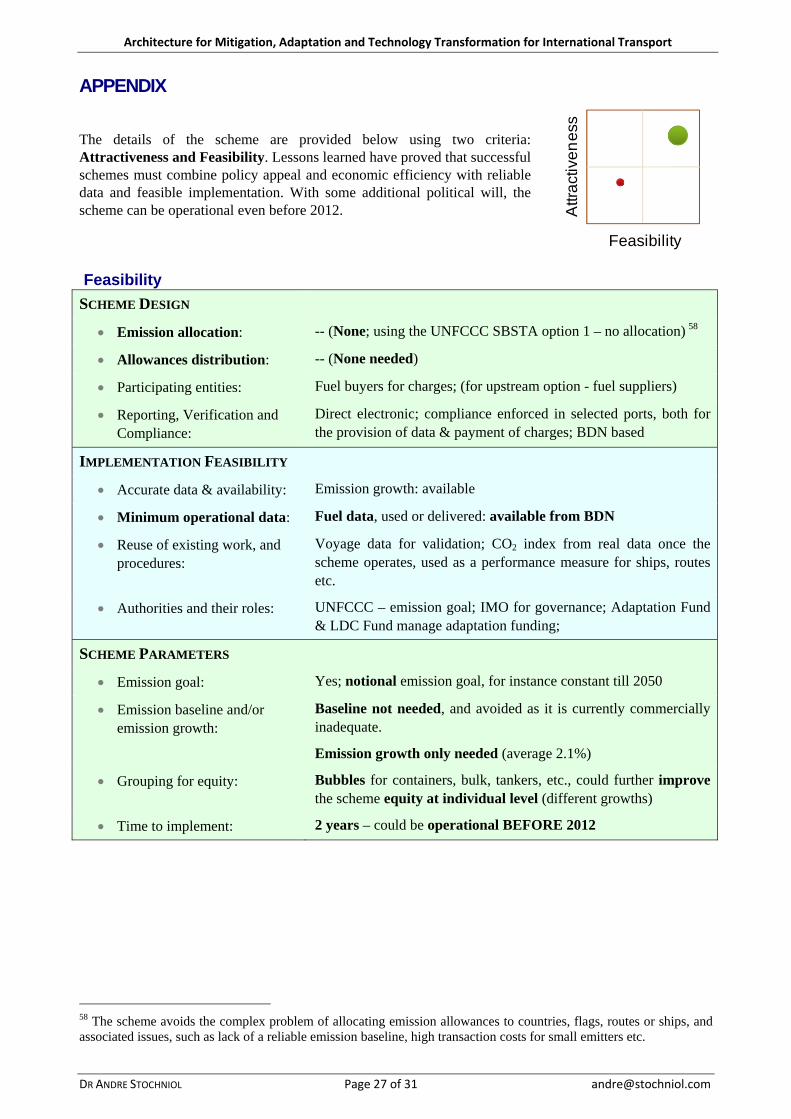
Architecture for Mitigation, Adaptation and Technology Transformation for International Transport
APPENDIX
The details of the scheme are provided below using two criteria: Attractiveness and Feasibility. Lessons learned have proved that successful schemes must combine policy appeal and economic efficiency with reliable data and feasible implementation. With some additional political will, the scheme can be operational even before 2012.
Feasibility
Feasibility
Attr
activ
enes
s
SCHEME DESIGN
• Emission allocation: -- (None; using the UNFCCC SBSTA option 1 – no allocation) 58
• Allowances distribution: -- (None needed)
• Participating entities: Fuel buyers for charges; (for upstream option - fuel suppliers)
• Reporting, Verification and Compliance:
Direct electronic; compliance enforced in selected ports, both for the provision of data & payment of charges; BDN based
IMPLEMENTATION FEASIBILITY
• Accurate data & availability: Emission growth: available
• Minimum operational data: Fuel data, used or delivered: available from BDN
• Reuse of existing work, and procedures:
Voyage data for validation; CO2 index from real data once the scheme operates, used as a performance measure for ships, routes etc.
• Authorities and their roles: UNFCCC – emission goal; IMO for governance; Adaptation Fund & LDC Fund manage adaptation funding;
SCHEME PARAMETERS
• Emission goal: Yes; notional emission goal, for instance constant till 2050
• Emission baseline and/or emission growth:
Baseline not needed, and avoided as it is currently commercially inadequate.
Emission growth only needed (average 2.1%)
• Grouping for equity: Bubbles for containers, bulk, tankers, etc., could further improve the scheme equity at individual level (different growths)
• Time to implement: 2 years – could be operational BEFORE 2012
58 The scheme avoids the complex problem of allocating emission allowances to countries, flags, routes or ships, and associated issues, such as lack of a reliable emission baseline, high transaction costs for small emitters etc.
DR ANDRE STOCHNIOL Page 27 of 31 [email protected]
Architecture for Mitigation, Adaptation and Technology Transformation for International Transport
DR ANDRE STOCHNIOL Page 28 of 31 [email protected]
Attractiveness SCOPE AND GOALS
• Geography: Worldwide
• Participants: All vessels > 400 GT (gross tonnage)
• Emission goal: Global, or per vessel bubbles (containers & non-containers, …)
• Additional goal: Adaptation to climate change in developing countries
• Emissions: International, CO2 only
POLITICAL APPEAL
• Common but differentiated responsibility:
Both at collection and distribution points; country obligation and/or individual level at collection point (subsistence versus merchant goods); financing policy for adaptation at the point of distribution
• Impact on competitiveness: None in sector; negligible outside shipping
• Benefits to participants: A hassle-free long-term solution, increased cash flow, compliance easily verifiable, long term investment clarity, better image of shipping
• Legal basis & precedents: Ideally under MARPOL; IOPCF - a precedent for a direct fund
COSTS (for 2011, key assumed prices: fuel $500/tHFO, carbon $30/tCO2)
• Price impact: Low: 0.1%, equivalent to adding $1 to price of $1,000 of imported goods
• Participant costs: Negligible (no negative impact on small participants)
• Unit emission charge: $9/tCO2 or $27/tFuel (linked to emissions and carbon price)
• Operational costs: Under 5% (a centralized solution)
EFFECTIVENESS (using 1 GtCO2 baseline in 2005)
• Emission mitigation: Mitigation of 26+ GtCO2 by 2050
• Improvements: 0.5% annually, $2bn+/pa Technology Fund
• Adaptation: $4bn/pa, for developing countries (e.g. contribution to the Adaptation Fund and the LDC Fund)
• Market linkages: Cost-effective through usage of carbon markets, REDD, and a dedicated maritime emission registry
FLEXIBILITY
• Mechanisms used: CDM, CERs without limits; also programmatic CDM for increased quality; REDD (forestry)
• New and existing ships; and new entrants:
Applies to both existing and new ships; no problems with including new entrants as scheme is based solely on charges, rather than allowances
• Adjusting to new realities: Charge/levy annually; funding policy reviewed and adjusted periodically by IMO
• Starting small, and learning by doing:
Can be limited to ship type or size threshold; easy scaling up thanks to the harmonized charge that does not vary with the number of participants

Architecture for Mitigation, Adaptation and Technology Transformation for International Transport
DR ANDRE STOCHNIOL Page 29 of 31 [email protected]
Bibliography Aldy, Joseph E., and Robert N. Stavins, (2007), Architectures for an International Global Climate Change
Agreement: Lessons for Policy Community, Architectures for Agreement: Addressing Global Climate Change in the Post-Kyoto World. Ed. Joseph E. Aldy and Robert N. Stavins. Cambridge University Press, 350-367.
Barrett, S., Stavins, R. (2003), Increasing Participation and Compliance in International Climate Change Agreements, International Environmental Agreements: Politics, Law and Economics, 3, 349-76.
Berenberg Bank (2006), HWWI: Strategy 2030 – Maritime Trade and Transport Logistics, Forecast by HWWI Hamburg Institute of International Economics
Bodansky, D., Chou, S., Jorge-Tresolini, C. (2004), International Climate Efforts Beyond 2012: A Survey of Approaches, Pew Center on Global Climate Change, Dec
Bode, S., J. Isensee, K. Krause and A. Michaelowa (2002), ‘Climate Policy: Analysis of Ecological, Technical and Economic Implications for International Maritime Transport’, International Journal of Maritime Economics 4, 164–184.
Burton I., Diringer E., Smith J. (2006), Adaptation to Climate Change: International Policy Options, Pew Center on Global Climate Change, Nov, http://www.pewclimate.org/docUploads/PEW_Adaptation.pdf
CE Delft, Germanischer Lloyd, MARINTEK, Det Norske Veritas (2006), Greenhouse Gas Emissions for Shipping and Implementation of the Marine Sulphur Directive, December, http://ec.europa.eu/environment/air/pdf/transport/final_report.pdf
Chua D., Gan S.A. (2006), Enforcing Bunker Claims, WorldBunkering, May 2006, http://www.worldbunkering.com/may_2006/p_22.php
Eyring, V., H. W. Köhler, J. van Aardenne, and A. Lauer (2005), Emissions from international shipping: 1. The last 50 years, J. Geophys. Res., 110, D17305, doi:10.1029/2004JD005619.
Faber, Jasper (CE), Bart Boon (CE), Marcel Berk (MNP), Michel den Elzen, (MNP), Jos Olivier (MNP), David Lee (MMU) (2006), Aviation and maritime transport in a post 2012 climate policy regime, Delft, CE
Faber, Jasper (2008), Developing Bunker Fuel Policies, Mitigating Impact for developing countries, European Commission side event at the UNFCCC Climate Change Talks on Addressing emission from international aviation and maritime transport, Bonn, June 2008, http://regserver.unfccc.int/seors/file_storage/zegxs2jlstoxy7l.ppt
Global Leadership for Climate Action (GLCA 2008), Framework for Post-2012, Agreement on Climate Change, www.GlobalClimateAction.com
Graichen, Jacob (2008), European Community, EU views on greenhouse gases and global warming potentials and options for addressing GHG emissions from international aviation and maritime transport, In-session workshop on means to reach emission reduction targets, AWG 5.1, Bangkok, April, http://unfccc.meta-fusion.com/kongresse/AWG_08/downl/0403_1000_p2/EU%20GHGs.pdf
Grubb, Michael et al., (2008), Climate Strategies, Energy and Climate: Opportunities for the G-8, http://www.climate-strategies.org/uploads/2_ClimateStrategiesG8report.pdf
Hepburn, C. (2006), Regulating by prices, quantities or both: an update and an overview, 22:2 Oxford Review of Economic Policy, 226-247.
ICAO (2007), ICAO Environmental Report 2007
IISD (2007), A summary report of the Technical Workshop on Emissions from Aviation and Maritime Transport, International Institute for Sustainable Development, Vol. 146, No.1, Oct 2007; http://www.iisd.ca/download/pdf/sd/ymbvol146num1e.pdf
IMO (2000), Study on Greenhouse Gas Emission from Ships, MEPC 45/8

Architecture for Mitigation, Adaptation and Technology Transformation for International Transport
DR ANDRE STOCHNIOL Page 30 of 31 [email protected]
IMO (2007a), MEPC 56/4/9, by Norway, Elements of a possible market-based CO2 emission reduction scheme, May.
IMO (2007b), MEPC 57/4/5, section 5.11, by Australia and the Netherlands, Report of the Intersessional Correspondence Group on Greenhouse Gas Related Issues, Dec.
IMO (2008a), Denmark, Intersessional Meeting of the GHG Working Group, Development of a global levy on marine bunkers for the acquisition of CO2 allowances, GHG-WG 1/5/1, Oslo, May
IMO (2008b), Norway, Intersessional Meeting of the GHG Working Group, A levy-cap-and-trade system for reducing GHG emissions from shipping, GHG-WG 1/5/4, Oslo, May
IMO (2008c), Norway, Intersessional Meeting of the GHG Working Group, A consideration of elements needed in market mechanism to reduce GHG emissions from international shipping, GHG-WG 1/5/5, Oslo, May
Kruger J., Oates W., Pizer W. (2007), Decentralization in the EU Emissions Trading Scheme and Lessons for Global Policy, Resources For The Future, RFF DP 07-02, http://www.rff.org/rff/Documents/RFF-DP-07-02.pdf
Müller B., Hepburn C. (2006), IATAL – An outline proposal for an International Air Travel Adaptation Levy, Oxford Institute for Energy Studies, EV 36, October, http://www.oxfordenergy.org/pdfs/EV36.pdf
Müller B., Höhne N., Ellermann C. (2007), Differentiating (Historic) Responsibilities for Climate Change, Summary Report, October, To be published as an OIES Energy and Environment Paper, www.oxfordenergy.org
Stochniol, A. (2007a), Data requirements and reporting in a charge-and-cap approach, Technical workshop meeting in emissions from aviation and maritime transport, Oslo, Norway, Oct. http://www.eionet.europa.eu/training/bunkerfuelemissions/ http://imers.org/files/docs/Oslo_IMERS_data_requirements.pdf
Stochniol, A., Müller, B. (2007b), Bunker Fuel Emission and Adaptation Funding, UNFCCC COP 13 Side Event, Bali, Dec 2007, http://imers.org/files/docs/IATAL_IMERS_COP13.pdf
Stochniol, A. (2008a), Bunker Fuel Emissions, Adaptation Funding, and Technology Transformation, UNFCCC Bonn Climate Change Talks, June, http://imers.org/files/docs/IMERS_4_Bali_pillars_in_1_maritime_scheme.pdf
Pettersen, Marit Viktoria (2007), GHG emissions – Norwegian proposal to the IMO, UNFCCC COP 13, side event, December, http://regserver.unfccc.int/seors/file_storage/bcu84lic3cn2jkt.ppt
Pettersen, Marit Viktoria (2008), Norway, International aviation and maritime transport, Roundtable, UNFCCC AWG KP, Bonn, June, http://unfccc.int/files/meetings/ad_hoc_working_groups/kp/application/pdf/ghg_awg_kp_5_norway.pdf
UNCTAD (2007), Review of Maritime Transport, UNCTAD.
UNFCCC (2007), Investment and Financial Flows to Address Climate Change.
UNFCCC (2008a), FCCC/KP/AWG/2008/MISC.1/Add.4, Submission from Australia, Aviation and maritime emissions (bunkers) and the Ad Hoc Working Group on Further Commitments for Annex I Parties under the Kyoto Protocol, UNFCCC SB28, Bonn, Germany, April, http://unfccc.int/resource/docs/2008/awg5/eng/misc01a04.pdf
UNFCCC (2008b), FCCC/SBSTA/2008/MISC.9, Submission from the IMO, UNFCCC SB28, Bonn, Germany
UNFCCC (2008c), FCCC/AWGLCA/2008/MISC.1, Views regarding the work programme of the Ad Hoc Working Group on Long-term Cooperative Action under the Convention. Submissions from Parties. March 2008, pg. 54.

Architecture for Mitigation, Adaptation and Technology Transformation for International Transport
DR ANDRE STOCHNIOL Page 31 of 31 [email protected]
UNFCCC (2008d), FCCC/KP/AWG/2008/MISC.1, Views and information on the means to achieve mitigation objectives of Annex I Parties, Submissions from Parties, March 2008, pg. 46-50, pg. 74-76.