architecture support for intrusion detection...
TRANSCRIPT

Architecture Support for Intrusion DetectionSystems
A Thesis
Submitted For the Degree of
Doctor of Philosophy
by
Govind Sreekar Shenoy
Advisers
Antonio Gonzalez
Jordi Tubella Murgadas
UPC
Department d’Arquitectura De Computadors
Universitat Politecnica De Catalunya
Barcelona – 08034
JULY 2012

:
hEr �F mhAgZpty� nm,।
aEv]nm-t� ॥
i

Acknowledgements
I would like to express my sincere gratitude towards Antonio for selecting me
as a PhD student to the ARCO research group. Further, Antonio arranged for
my scholarship, and always has had kind and motivating words. I am also very
grateful to Jordi, my thesis co-director, who has been an active contributor and a
patient listener in the course of this thesis. Back in 2007 and at the start of this
dissertation, I was a novice in the area of network security. Today, in 2012, I have
to admit that I have developed reasonable proficiency in this area. This clearly
would not have been possible without the trust and encouragement provided by
Antonio and Jordi. My heartfelt gratitude to both of them.
In the course of this thesis we deployed a Honeypot in the University. A note of
thanks to Prof Jordi Domingo Pascual, Albert Lopez, Marc Dacier, and Corrado
Leita for helping us to deploy the Honeypot. I would also like to thank Josep
Sole Pareta, Pere Barlet, and Josep Sanjuas for providing us access to the network
traces from the university. The system administrators in the DAC department
ii

have helped when required, so thanks to all the sys-ads. A PhD not only involves
research, there is also plenty of paper work. Thanks to the personnel in the
administration, and Trini in particular, for providing good administrative support
during these 5 years.
Barcelona is a beautiful Mediterranean city. But Barcelona is not just about
architecture, landscape and Catalan food, there is also this game called football.
I have been privileged to be a close witness in of the most glorious era of FC
Barcelona. A note of thanks to Guardiola and his band of footballers. Barcelona is
a very cosmopolitan city, and I had the opportunity to experience it at Prestigious
Speakers Barcelona (PSB). A role in PSB has always been a welcome challenge
and an opportunity, and to top it all with a very lively audience, has resulted in
so many fantastic, memorable, and fun-filled meetings. A big thank you to all
the members of PSB and the parent organization of PSB, namely, Toastmasters
International. During these years in my stay here in Barcelona, Sister Saveria of
Hospital Sant Joan de Deu has always provided ready and almost instant help.
Thank you Hermana.
Last, but not the least, I have to thank all the members of my family. I personally
am lost for words to the unflinching support and encouragement provided by my
father, mother, brother, and Hema during the course of this dissertation.
Architecture Support for Intrusion Detection Systems iii

ToMy Family
iv

Abstract
System security is a prerequisite for efficient day-to-day transactions. As a conse-
quence, Intrusion Detection Systems (IDS) are commonly used to provide an effective
security ring to systems in a network. An IDS operates by inspecting packets flowing in
the network for malicious content. To do so, an IDS like Snort[49] compares bytes in a
packet with a database of prior reported attacks. This functionality can also be viewed
as string matching of the packet bytes with the attack string database.
Snort commonly uses the Aho-Corasick algorithm[2] to detect attacks in a packet.
The Aho-Corasick algorithm works by first constructing a Finite State Machine (FSM)
using the attack string database. Later the FSM is traversed with the packet bytes. The
main advantage of this algorithm is that it provides a linear time search irrespective of
the number of strings in the database. The issue however lies in devising a practical
implementation. The FSM thus constructed gets very bloated in terms of the storage
size, and so is area inefficient. This also affects its performance efficiency as the memory
footprint also grows. Another issue is the limited scope for exploiting any parallelism
due to the inherent sequential nature in a FSM traversal.
This work explores hardware and software techniques to accelerate attack detec-
tion using the Aho-Corasick algorithm. In the first part of this work, we investigate
techniques to improve the area and performance efficiency of an IDS. Notable among
our contributions, includes a pipelined architecture that accelerates accesses to the most
frequently accessed node in the FSM. The second part of this work studies the resilience
of an IDS to evasion attempts. In an evasion attempt an adversary saturates the per-
formance of an IDS to disable it, and thereby gain access to the network. We explore
v

an evasion attempt that significantly degrades the performance of the Aho-Corasick al-
gorithm used in an IDS. As a counter measure, we propose a parallel architecture that
improves the resilience of an IDS to an evasion attempt. The final part of this work
explores techniques to exploit the network traffic characteristic. In our study, we observe
significant redundancy in the payload bytes. So we propose a mechanism to leverage
this redundancy in the FSM traversal of the Aho-Corasick algorithm. We have also
implemented our proposed redundancy-aware FSM traversal in Snort.
Architecture Support for Intrusion Detection Systemsvi

Contents
1 Introduction 11.1 Our Contributions . . . . . . . . . . . . . . . . . . . . . . . . . . . 3
1.1.1 Improving the Efficiency of an IDS . . . . . . . . . . . . . . 41.1.2 Improving the Resilience of an IDS . . . . . . . . . . . . . . 51.1.3 Exploiting the Network Traffic Characteristic . . . . . . . . 6
1.2 Book Organization . . . . . . . . . . . . . . . . . . . . . . . . . . . 7
2 Background 82.1 Introduction . . . . . . . . . . . . . . . . . . . . . . . . . . . . . . . 82.2 Snort IDS Overview . . . . . . . . . . . . . . . . . . . . . . . . . . 10
2.2.1 Snort Execution Overview . . . . . . . . . . . . . . . . . . . 122.3 The Aho-Corasick Algorithm . . . . . . . . . . . . . . . . . . . . . . 152.4 Related Work . . . . . . . . . . . . . . . . . . . . . . . . . . . . . . 17
3 Improving the Efficiency of an IDS 213.1 Introduction . . . . . . . . . . . . . . . . . . . . . . . . . . . . . . . 213.2 Background . . . . . . . . . . . . . . . . . . . . . . . . . . . . . . . 223.3 Improving Area Efficiency . . . . . . . . . . . . . . . . . . . . . . . 23
3.3.1 Fan-out Reduction . . . . . . . . . . . . . . . . . . . . . . . 263.3.2 Root-Node Storage . . . . . . . . . . . . . . . . . . . . . . . 273.3.3 Area Comparison . . . . . . . . . . . . . . . . . . . . . . . . 29
vii

3.4 Improving the Performance Efficiency . . . . . . . . . . . . . . . . . 303.4.1 Rearranging Edges . . . . . . . . . . . . . . . . . . . . . . . 303.4.2 Accelerating Root-Node Accesses . . . . . . . . . . . . . . . 323.4.3 Hardware Architecture . . . . . . . . . . . . . . . . . . . . . 37
3.5 Simulation Methodology . . . . . . . . . . . . . . . . . . . . . . . . 403.6 Results . . . . . . . . . . . . . . . . . . . . . . . . . . . . . . . . . . 44
3.6.1 Cache Exploration Study . . . . . . . . . . . . . . . . . . . . 443.6.2 Performance Comparison . . . . . . . . . . . . . . . . . . . . 473.6.3 Sensitivity Analysis . . . . . . . . . . . . . . . . . . . . . . . 503.6.4 Scalability Analysis . . . . . . . . . . . . . . . . . . . . . . . 52
3.7 Summary and Future Directions . . . . . . . . . . . . . . . . . . . . 54
4 Improving the Resilience of an IDS 554.1 Introduction . . . . . . . . . . . . . . . . . . . . . . . . . . . . . . . 554.2 Background . . . . . . . . . . . . . . . . . . . . . . . . . . . . . . . 564.3 Motivation . . . . . . . . . . . . . . . . . . . . . . . . . . . . . . . . 594.4 Proposed Counter-measure . . . . . . . . . . . . . . . . . . . . . . . 62
4.4.1 Hardware-based Mechanism . . . . . . . . . . . . . . . . . . 634.4.2 Software-based Mechanism . . . . . . . . . . . . . . . . . . . 71
4.5 Simulation Methodology . . . . . . . . . . . . . . . . . . . . . . . . 724.6 Results . . . . . . . . . . . . . . . . . . . . . . . . . . . . . . . . . . 74
4.6.1 Sensitivity Analysis . . . . . . . . . . . . . . . . . . . . . . . 814.6.2 Scalability Analysis . . . . . . . . . . . . . . . . . . . . . . . 83
4.7 Related Work . . . . . . . . . . . . . . . . . . . . . . . . . . . . . . 844.8 Summary and Future Directions . . . . . . . . . . . . . . . . . . . . 87
5 Exploiting Redundancy in Network Traffic 905.1 Introduction . . . . . . . . . . . . . . . . . . . . . . . . . . . . . . . 905.2 Capturing the Redundancy . . . . . . . . . . . . . . . . . . . . . . . 91
5.2.1 Winnowing . . . . . . . . . . . . . . . . . . . . . . . . . . . 935.2.2 Systematic Sampling . . . . . . . . . . . . . . . . . . . . . . 95
5.3 Evaluation Methodology . . . . . . . . . . . . . . . . . . . . . . . . 965.3.1 Data-Sets . . . . . . . . . . . . . . . . . . . . . . . . . . . . 96
5.4 Characterizing the Redundancy . . . . . . . . . . . . . . . . . . . . 975.5 Exploiting Redundancy . . . . . . . . . . . . . . . . . . . . . . . . . 1005.6 Our Contribution . . . . . . . . . . . . . . . . . . . . . . . . . . . . 103
Architecture Support for Intrusion Detection Systemsviii

5.6.1 Redundancy Identification . . . . . . . . . . . . . . . . . . . 1045.6.2 Accelerating Processing of Redundant Bytes . . . . . . . . . 106
5.7 Results . . . . . . . . . . . . . . . . . . . . . . . . . . . . . . . . . . 1095.7.1 Performance Metric . . . . . . . . . . . . . . . . . . . . . . . 1095.7.2 Performance Results . . . . . . . . . . . . . . . . . . . . . . 110
5.8 Related Work . . . . . . . . . . . . . . . . . . . . . . . . . . . . . . 1195.9 Summary and Future Directions . . . . . . . . . . . . . . . . . . . . 121
6 Conclusions 1236.1 Future Directions . . . . . . . . . . . . . . . . . . . . . . . . . . . . 125
Bibliography 128
Architecture Support for Intrusion Detection Systems ix

List of Figures
2.1 An Example of a Snort Rule. . . . . . . . . . . . . . . . . . . . . . 112.2 Snort Functioning Overview. . . . . . . . . . . . . . . . . . . . . . . 122.3 Example of the Aho-Corasick State Machine. . . . . . . . . . . . . . 15
3.1 Fan-out Distribution. . . . . . . . . . . . . . . . . . . . . . . . . . . 243.2 Node 5 Revisited. . . . . . . . . . . . . . . . . . . . . . . . . . . . . 243.3 Our Proposed Storage . . . . . . . . . . . . . . . . . . . . . . . . . 253.4 Fan-out Reduction for Node 5. . . . . . . . . . . . . . . . . . . . . . 273.5 Root Node Storage. . . . . . . . . . . . . . . . . . . . . . . . . . . . 283.6 Data Structure Used for Comparison Schemes. . . . . . . . . . . . . 293.7 Area Comparison for Various Proposals. . . . . . . . . . . . . . . . 303.8 Fine Tuning for node 5. . . . . . . . . . . . . . . . . . . . . . . . . 313.9 Mapping of Incoming Bytes . . . . . . . . . . . . . . . . . . . . . . 333.10 Root Node Access Split . . . . . . . . . . . . . . . . . . . . . . . . . 343.11 Storage of the Outgoing Edge e. . . . . . . . . . . . . . . . . . . . . 353.12 Pipelined Root-node Memory Access . . . . . . . . . . . . . . . . . 363.13 Proposed Hardware Architecture . . . . . . . . . . . . . . . . . . . 373.14 Root-node Processing Engine . . . . . . . . . . . . . . . . . . . . . 383.15 Processing Flow-charts . . . . . . . . . . . . . . . . . . . . . . . . . 393.16 Architecture of BS-FSM. . . . . . . . . . . . . . . . . . . . . . . . . 413.17 Architecture of Baseline. . . . . . . . . . . . . . . . . . . . . . . . . 42
x

LIST OF FIGURES
3.18 Cache Exploration Study . . . . . . . . . . . . . . . . . . . . . . . . 453.19 Performance Comparison for September 2007 Snort database. . . . 473.20 Performance Comparison for the April-2010 Release. . . . . . . . . 493.21 Sensitivity Analysis . . . . . . . . . . . . . . . . . . . . . . . . . . . 513.22 Scaling Nodes in the FSM . . . . . . . . . . . . . . . . . . . . . . . 523.23 Scalability Analysis . . . . . . . . . . . . . . . . . . . . . . . . . . . 53
4.1 Example of the Aho-Corasick State Machine. . . . . . . . . . . . . . 574.2 Storage Space Optimization using Failure Pointers. . . . . . . . . . 584.3 Node 6 Storage Using Failure Pointers. . . . . . . . . . . . . . . . . 584.4 Impact of Failure chain . . . . . . . . . . . . . . . . . . . . . . . . . 604.5 CDF of Processing time per Byte . . . . . . . . . . . . . . . . . . . 614.6 Impact of Failure chains on Performance . . . . . . . . . . . . . . . 624.7 Node 6 Signature Storage. . . . . . . . . . . . . . . . . . . . . . . . 644.8 Node 6 FSM Storage and Signature Access. . . . . . . . . . . . . . 654.9 Hardware Architecture. . . . . . . . . . . . . . . . . . . . . . . . . . 664.10 FSM Traversal Engine. . . . . . . . . . . . . . . . . . . . . . . . . . 674.11 Signature Matching Engine . . . . . . . . . . . . . . . . . . . . . . . 684.12 Bloom-filter Signature Generation. . . . . . . . . . . . . . . . . . . 694.13 Impact of Parameters on the False-positive Rate. . . . . . . . . . . 704.14 Software-based Mechanism. . . . . . . . . . . . . . . . . . . . . . . 724.15 Synthetic Trace Comparison Result for Hardware-based Mechanism 754.16 Synthetic Trace Comparison Result for Software-based Mechanism . 764.17 Defcon Trace Comparison Results . . . . . . . . . . . . . . . . . . . 774.18 Comparison Results for Week2 Trace . . . . . . . . . . . . . . . . . 774.19 Comparison Results for Week3 Trace . . . . . . . . . . . . . . . . . 784.20 Comparison Results for Honeypot Trace . . . . . . . . . . . . . . . 784.21 Comparison Results for the Hybrid Mechanism for Synthetic Trace 794.22 Storage Space Comparison (Normalized to Baseline). . . . . . . . . 804.23 Cache Miss Latency Sensitivity . . . . . . . . . . . . . . . . . . . . 824.24 Processing Engine Latency Sensitivity . . . . . . . . . . . . . . . . . 834.25 Scalability Comparison for Improving the Worst-case . . . . . . . . 85
5.1 An Example of Winnowing. . . . . . . . . . . . . . . . . . . . . . . 945.2 An Example of Systematic Sampling. . . . . . . . . . . . . . . . . . 955.3 PoR for Various Traces and for Various Sampling Techniques . . . . 98
Architecture Support xiSystemsDetectionIntrusionfor

LIST OF FIGURES
5.4 Table Size Variation for Various Traces. . . . . . . . . . . . . . . . . 1005.5 Example of the Aho-Corasick State Machine. . . . . . . . . . . . . . 1015.6 FSM Traversal with Datagram Bytes. . . . . . . . . . . . . . . . . . 1025.7 Redundancy Identification . . . . . . . . . . . . . . . . . . . . . . . 1055.8 Thread Functionalities and Interactions . . . . . . . . . . . . . . . . 1075.9 Execution Time Comparison for Various Traces . . . . . . . . . . . 1105.10 Redundancy Results for Various Traces . . . . . . . . . . . . . . . . 1115.11 Table Look-up Overhead . . . . . . . . . . . . . . . . . . . . . . . . 1135.12 Execution Time Comparison for the Dynamic Heuristic . . . . . . . 117
Architecture Support for Intrusion Detection Systemsxii

List of Tables
2.1 Time Spent in the Aho-Corasick Algorithm by Snort. . . . . . . . . 14
3.1 Summary of Traces used in Evaluation. . . . . . . . . . . . . . . . . 403.2 Simulation Parameters. . . . . . . . . . . . . . . . . . . . . . . . . . 443.3 Processing Clock-Cycles for Comparison Schemes. . . . . . . . . . . 44
4.1 Summary of Traces used in Evaluation. . . . . . . . . . . . . . . . . 73
5.1 Trace Used. . . . . . . . . . . . . . . . . . . . . . . . . . . . . . . . 975.2 Datagram Characteristic of Traces. . . . . . . . . . . . . . . . . . . 103
xiii

1Introduction
System security is critical to day-to-day transactions. System security is built on
three guiding principles, namely, confidentiality, integrity and availability. Confi-
dentiality refers to the mechanisms deployed to prevent data theft or compromis-
ing the privacy of data. A common example of a breach of confidentiality is in
a phishing attempt by an intruder to steal the personal data. A system security
infrastructure also needs to provide integrity, and thus prevent unauthorized mod-
ification of the data. The integrity is violated for example in a man-in-the-middle
class of attacks, where data is changed on transit by an adversary. The third re-
quirement in effective system security is the availability of system resources. An
attacker can throttle a system resource, and thus bring down the system infras-
tructure. Denial-of-Service (DoS) attacks are examples that target the availability
of a system resource. In summary, a system security environment need to be built
on these principles.
System security can be provided for individual systems and is referred as host
security. A commonly example of host security is an anti-Virus software like the
1

CHAPTER 1. Introduction
proprietary McAfee or ClamAV anti-Virus suites that are commonly deployed in
hosts. The open-source, ClamAV[60], operates using a database of past reported
attacks. So for instance, ClamAV detects a phishing attempt[21] by extracting
the URL from the web page. The extracted link is compared with the phishing
database, and checked if the domain is reported in the past as a phishing target.
If the domain is indeed a target, then ClamAV performs further analysis on the
URL to filter out the phishing attempt. In a similar manner, ClamAV also detects
other attacks that compromise the integrity/confidentiality of a host.
Security can also be provided at the network for an entire LAN. A firewall is an
example of providing security at the network. It is typically configured to allow or
block certain services from outside the LAN. For example, a firewall in a production
network can be configured to block SSH/FTP/Telnet connection attempts by an
external (to the LAN) system. To do so, a firewall inspects the IP/TCP header in
a packet, and takes a decision depending on the configured firewall policy. Network
security need not only be restricted to inspecting the packet header, the packet
payload can also be checked for attack patterns. An Intrusion Detection System
(IDS) inspects the entire packet, header and payload, for attack patterns. An
IDS either inspects the packet for an anomalous behaviour or for a prior reported
attack. The former is referred to as an anomaly detection IDS, and the latter is a
misuse detection IDS. We discuss the working of these systems in Chapter 2. In
this work we focus on a misuse detection IDS, as it has gained popularity with
commercial deployment[42, 49] over the years.
A misuse detection IDS operates by scanning the bytes in a packet, and com-
paring it with a database of prior reported attacks. This attack database can be
2 Architecture Support for Intrusion Detection Systems

CHAPTER 1. Introduction
viewed as attack strings. Hence, a misuse detection IDS performs pattern match-
ing of attack strings on the packet payload. This is computationally very intensive
due to the huge and growing attack database, and also the large packet size. So
an IDS like the popular Snort[49] uses the Aho-Corasick algorithm[2] to detect
attacks in a packet. This algorithm functions by first constructing a Finite State
Machine (FSM) using the attack string database, and later traversing the FSM
using the payload bytes. Further, we observe that the attack detection in Snort
using the Aho-Corasick algorithm consumes more than 60% of the execution time.
So clearly it is bottleneck, and numerous earlier works[6, 7, 9, 17, 25, 29, 32, 33,
43, 44, 45, 59, 61, 68, 70] have explored techniques to accelerate this algorithm.
The main advantage in using this algorithm is that it guarantees linear time
search, irrespective of the number of strings. However, the challenge lies in devis-
ing an efficient implementation. The base implementation is relatively inefficient
in terms of area, due to the large storage space needed for the FSM. This also
affects its performance as the memory footprint grows. Another issue with the
Aho-Corasick algorithm is that the bytes in a packet need to traverse the FSM
sequentially. Thus, the scope of exploiting any parallelism is limited.
1.1 Our Contributions
In this work we explore the following hardware and software techniques to accel-
erate attack detection using the Aho-Corasick algorithm.
Architecture Support for Intrusion Detection Systems 3

CHAPTER 1. Introduction
1.1.1 Improving the Efficiency of an IDS
In the first part of the work, we concentrate on improving the performance and
area efficiency for detecting attacks using the Aho-Corasick algorithm. The area
inefficiency in the base Aho-Corasick algorithm is due to the huge size of the FSM.
So we propose a compact and a hybrid FSM storage that is specifically tuned for
the Snort attack strings. We further explore techniques to improve the perfor-
mance efficiency. We observe that the root-node in the FSM is very frequently
accessed by the input bytes. Hence, we propose a pipelined FSM traversal that
accelerates accesses to the root-node. We compare our proposed architecture with
the popular BS-FSM based approaches[44, 45, 68]. The performance results indi-
cate that Our Proposal reduces the area required to store the FSM by a factor of
2.2X. Furthermore, on comparing the performance, Our Proposal outperforms
by up-to 73% the BS-FSM based approaches.
Our Proposal is a Deep Packet Inspection (DPI) architecture that uses spe-
cialized hardware to search for attacks in packets. We observe that the hardware
requirements of Our Proposal can be implemented with relatively simple chip
complexity. Furthermore, our proposed architecture is not restricted to attack de-
tection using the Aho-Corasick algorithm. It can also be adapted to detect attacks
specified as regular expressions1. Note that regular expressions are commonly con-
verted to Non-deterministic Finite Automata (NFA) or Deterministic Finite Au-
tomata (DFA), and the Aho-Corasick FSM resembles a Finite Automata. Hence
our proposed architecture is directly applicable to detecting attacks specified as
1As opposed to fixed strings in the Aho-Corasick algorithm.
4 Architecture Support for Intrusion Detection Systems

CHAPTER 1. Introduction
regular expressions.
1.1.2 Improving the Resilience of an IDS
In the second part of the work, we focus on improving the resilience of an IDS to
an evasion attempt by an adversary. An adversary can throttle an IDS by carefully
crafting packets that severely drops its performance. Once the IDS is unable to
process packets at the line-rate, then in order to prevent a network breakdown,
the IDS gets disabled. In this manner, the network becomes vulnerable. Such
attempts by an adversary to circumvent an IDS are broadly referred to as evasion
attempts. So in these attacks, an adversary exploits weaknesses in some part of
the IDS processing.
We observe that a packet byte needs, on an average, to traverse 1 FSM state
in the Aho-Corasick algorithm. However, we also observe that there are packet
bytes that traverse up-to 31 FSM states for the processing of a single byte. This
clearly results in a drastic performance drop, and we observe a 22X performance
degradation. Hence, as a counter measure we propose a parallel architecture, with
one engine performing the regular FSM traversal, while other engine identifies the
candidate FSM state to traverse. Our evaluation shows that our proposed parallel
architecture provides over 3X improvement in the processing of these performance
throttling bytes.
As noted earlier, an IDS commonly specifies attacks using regular expressions,
and they are converted to Finite Automata. The Snort IDS converts regular ex-
pressions to NFA. Note that in an NFA multiple states can be active at any given
instance, and so a heuristic is used to accelerate NFA traversal. This heuristic
Architecture Support for Intrusion Detection Systems 5

CHAPTER 1. Introduction
in Snort is similar to the chain of FSM states traversed in the worst-case by the
Aho-Corasick algorithm. Hence, the hardware/software mechanisms proposed in
this work can be extended to accelerate detection of attacks specified as regular
expressions. Furthermore, note that our proposed parallel architecture can be im-
plemented in an application specific processor (ASIPs) like network processors[26].
A network processor typically has a high degree of parallelism with multiple pro-
cessors and multiple threads.
1.1.3 Exploiting the Network Traffic Characteristic
In the final part of the work, we explore techniques to accelerate IDS processing
by exploiting the network traffic characteristic. Redundancy in the packet header
is well known and well studied over the years. For instance, specialized caches for
packet forwarding are as a consequence of this redundancy. However, to the best
of our knowledge, there have been no significant studies exploring the redundancy
in the packet payload. In this work, we study and observe significant redundancy
(up-to over 80%) in the packet payload. So we investigate techniques to exploit
this redundancy in an IDS.
Packet bytes traverse the FSM, and so redundant packet bytes result in re-
dundant FSM traversal. This redundant processing can be skipped, if these
bytes are identified. So we propose a mechanism to identify the redundant bytes
and skip their FSM traversal. Furthermore, we have implemented our proposed
redundancy-aware FSM traversal in the Snort IDS, and evaluated it on an Intel
Core i3. We observe important performance benefits in using our redundancy-
aware FSM traversal, in comparison to the standard FSM traversal used in Snort.
6 Architecture Support for Intrusion Detection Systems

CHAPTER 1. Introduction
1.2 Book Organization
The remainder of this book is organized as follows:
• Chapter 2 provides a background on Intrusion Detection Systems, and
detecting attacks using the Aho-Corasick algorithm.
• Chapter 3 discusses our proposed mechanisms to improve the performance
efficiency of an IDS. This work has been published in IPDPS-2011[62].
• We explore hardware and software techniques to improve the resilience of an
IDS in Chapter 4. These mechanisms to improve the IDS resilience have
been published in STDN-2012[64] and SecureComm-2012[66].
• Chapter 5 discusses techniques to exploit the network traffic characteristics
to accelerate IDS processing. This work has been published in ISPASS-
2012[63] and MASCOTS-2012[65].
• Chapter 6 concludes this dissertation and provides future directions.
Architecture Support for Intrusion Detection Systems 7

2Background
2.1 Introduction
Intrusion Detection Systems (IDS) have emerged as one of the most promising
alternatives to secure the network. So in order to secure the network, an IDS
analyzes the network traffic. This analysis can be broadly classified into the two
following categories: anomaly-based detection and misuse detection. We provide
a brief overview of these systems.
An anomaly-based IDS, as the name indicates, detects anomalous system be-
haviour using the following general approach. It first classifies the system be-
haviour under observation into normal and abnormal system behaviour. Based on
this classification, the anomaly detector identifies deviation from the normal sys-
tem behaviour. Finally, it takes the needed action based on the system analysis.
For instance, Lee et al[30] explore an anomaly detector for the sendmail program.
They use the execution sequence of system calls as the system behaviour to be
analyzed. So a database of normal sequence of system calls is built using a set of
8

CHAPTER 2. Background
training sendmail execution traces. Then the evaluated sendmail execution traces
are compared with the database thus built. If in a sequence of calls, a system
call is not present in the database, then it is labeled as abnormal. However, there
may exist rarely invoked system calls that are part of normal sendmail execu-
tion. So in order to filter out such outliers, they examine a window of system
calls. If in case in the window more than a threshold number of calls are ab-
normal, then it is an anomaly. Thus in this manner, Lee et al classify sendmail
execution as either benign or malign. System calls need not be the only system be-
haviour to detect an anomaly. An anomaly detector can also use other control-flow
information[67, 73, 74].
The main advantage of an anomaly detector is its potential to adapt to system
dynamics. For instance, an anomaly detector can detect zero-day attacks. These
are attacks that are hitherto unknown. So it is important to thwart such attacks
due to the ease of spread of these attacks. A heuristic leveraging the observed
traffic anomaly on the zero-day[54] is an interesting defense mechanism to zero-
day attacks.
However, there are issues with effective anomaly detection. Anomaly detection
requires a wide variety of training data in order to accurately predict the system
behaviour. For example, Lee et al[30] observe that when the sendmail anomaly
detector heuristic is applied to network traffic, the strong temporal variations in
network traffic result in a very high error rate. So the anomaly detector needs
to keep pace with the system input and the system response. Sommer et al.[58]
discuss in depth the various issues to effective anomaly detection.
In this work we concentrate on misuse detection IDS. But it is important to
Architecture Support for Intrusion Detection Systems 9

CHAPTER 2. Background
stress that anomaly detection is important and very relevant to network security.
In contrast to an anomaly detector, a misuse detection IDS functions by using a
database of prior attacks. So a misuse detection IDS compares the packet bytes
with the attack database. In case the packet bytes match the database, then the
IDS flags it as an intrusion attempt. The database of prior attacks can also be
viewed as rules. An IDS like the popular Snort[49] uses these rules to accurately
model an attack. Below we provide an overview of the Snort IDS.
2.2 Snort IDS Overview
Snort is a misuse detection IDS created in 1999 by Martin Roesch. It is an open-
source software that is actively developed by a vast online community, and also has
a large user base. Snort is commonly deployed in production networks. It models
attacks using the Snort rules. Snort rules are specifications typically indicating
byte patterns within a class of traffic, for instance HTTP traffic. Over the years,
Snort has developed rules for different classes of traffic, and also different types of
attacks. For example, Snort has rules for detecting attacks in the web, streaming,
mail traffic and additionally a wide range of network traffic. It also has rules
to detect Denial-of Service (DoS) attacks, back-door entries, phishing attempts,
shell-code and other exploits. So Snort rules forms the core in the execution of
Snort IDS.
Figure 2.1 shows a sample Snort rule. This rule detects email attachments
sent from a host in the Snort protected network to an external web server. Below
we discuss the various fields in this rule. The field, HOME NET, represents
10 Architecture Support for Intrusion Detection Systems

CHAPTER 2. Background
alert tcp $HOME_NET any −> $EXTERNAL_NET $HTTP_PORTS (
msg:"WEB−CLIENT access"; flow: from_client, established;
content : ".eml"; http_uri;
reference: nessus, 10767; sid:1233;rev:13
)
Figure 2.1: An Example of a Snort Rule.
the set of hosts in the network that is protected by the Snort IDS. Similarly,
EXTERNAL NET refers to any host outside the protected network. So this rule
checks for TCP packets between theHOME NET and the EXTERNAL NET.
Within the TCP packets, Snort checks if the session between the HOME NET
and the EXTERNAL NET is an HTTP session. To do so, it compares the
port number within the TCP header with the standard HTTP port numbers[27].
Furthermore, within the HTTP session it checks if the URI field in the HTTP
header contains an EML1 file extension. If Snort detects the email attachment
in a HTTP session, then it alerts the system administrator by writing into the
system log. The remaining fields provide the unique Snort identifier for this rule,
and further references on this exploit.
There are various execution stages involved in the operation of an IDS. So
below we provide an overview of the various stages in Snort execution.
1Microsoft Outlook internally saves email attachments in EML format.
Architecture Support for Intrusion Detection Systems 11

CHAPTER 2. Background
2.2.1 Snort Execution Overview
PACKETS
PACKET DECODE
PREPROCESS
DETECTION ENGINE
POST PROCESSING
SNORT EXECUTION STAGES
Figure 2.2: Snort Functioning Overview.
Figure 2.2 shows the various stages in the execution of Snort. Packets from
the network are read and decoded by the Packet Decoder. The Packet Decoder
extracts the various header fields in the packet. The decoder first extracts the
Ethernet header fields and then it reads the IP and the transport (TCP/UDP)
header. These header fields, that correspond to the various layers in the network
stack, and they are read into memory buffers.
Once the packet is decoded and the lower-layer protocols are identified, then the
high-level application needs to be identified. This is performed by the Preprocessor.
So for instance the HTTP Inspect preprocessor, used for HTTP packets, reads the
HTTP header. Further, it also checks for anomalies. The URI fields of a HTTP
request is heavily exploited by attackers. A common method used by attackers is
12 Architecture Support for Intrusion Detection Systems

CHAPTER 2. Background
to distort the URI field and trick the web-server to provide access to files in the
root/super-user privileges. Such attempts are referred to as Evasion attempts[48],
and an IDS normalizes[23] the HTTP traffic to thwart such attempts.
In addition, to the high level application header that is being read, this stage
also reassembles and re-fragments the packets. Packet can be fragmented in the
transmission when the packet size is greater than the maximum transmission unit
(MTU) of a link. Packets can also be purposefully fragmented by an adversary
to cleverly split the attack string into multiple packets. So to avoid this evasion,
Snort re-fragments the packets. The re-fragmentation is done for the IP layer in
the network stack. Packet re-assembly, is similar to packet re-fragmentation, and
an adversary cleverly spreads the attack string across various TCP/UDP packets in
order to evade the IDS. So Snort uses preprocessors to re-fragment and reassemble
packets before the check of attack strings is done. We refer to the reassembled and
re-fragmented packets as a datagram.
The Detection Engine forms the third stage in the Snort execution. In this
stage, the datagram is inspected and primarily checked for any attack strings from
the attack string database. If so, then an alert is generated in the Post-processing
stage, or it can also involve dropping the packet. These are policies that are site
specific and determined by the network administrator.
The Detection Engine forms the core of Snort execution, and the efficiency
and effectiveness of Snort is directly related to that of the Detection Engine. As
mentioned earlier, the main functionality of the Detection Engine is to check if
a datagram contains any attack strings. One way of specifying attack strings, is
with the content field in the Snort rule (refer to Figure 2.1). In this example, the
Architecture Support for Intrusion Detection Systems 13

CHAPTER 2. Background
URI in a HTTP packet is checked for the specified string. However, a rule can also
inspect the entire payload and check if it contains any attack strings. Furthermore,
with Snort using a datagram instead of packet, the payload can be up-to 64 KB2.
This is, clearly, computationally very intensive.
The comparison of the datagram bytes with the attack strings is done by a
pattern matching algorithm. Snort commonly uses the Aho-Corasick algorithm[2]
for pattern matching. Table 2.1 shows the percentage of execution time spent by
Data-sets % Time SpentWeek-1 64.64Week-2 65.28Week-3 65.11
Local Honeypot 61.44
Table 2.1: Time Spent in the Aho-Corasick Algorithm by Snort.
Snort in the Aho-Corasick algorithm. This is obtained using the GNU profiler
(gprof)[41], and for the IDS evaluation traces and a Honeypot trace. We clearly
observe that the string matching module dominates the execution time. So it is
a performance bottleneck. In this work we concentrate on accelerating the Aho-
Corasick algorithm used by Snort. We provide an overview of the Aho-Corasick
algorithm in the following section.
2The maximum datagram size in Snort.
14 Architecture Support for Intrusion Detection Systems

CHAPTER 2. Background
2.3 The Aho-Corasick Algorithm
Snort uses the Aho-Corasick algorithm for string matching [2]. This algorithm
works by constructing a finite state machine (FSM) based on the set of strings
that need to be matched. Once this FSM is constructed, incoming bytes from
packets are used to traverse through it. The main advantage using this algorithm,
in contrast to other string matching algorithms, is that it guarantees linear-time
search irrespective of number of strings. We provide a brief overview of the Aho-
Corasick algorithm with an example.
Consider the set of strings: ha, he, she, his, him shed. Figure 2.3 shows
the corresponding Aho-Corasick FSM constructed from these strings. The FSM
9
h s
i h
e
s
h
0
1 2
3 4 5
7
i
s
6
m
8
a
ae
10
d
Figure 2.3: Example of the Aho-Corasick State Machine.
is built in two stages. In the first stage, characters from strings are added to the
Architecture Support for Intrusion Detection Systems 15

CHAPTER 2. Background
FSM. This is done in a way that strings that share a common prefix also share the
same set of parents in the FSM. The edges corresponding to this stage are shown
as thick lines. Also note that nodes 3, 6, 7, 8, 9, 10 indicate a match for strings
he, his, she, him, ha, shed respectively. These nodes also store a pointer to
a list of matched strings. For example, node 7 stores a pointer to the list of its
matched strings namely he, she.
The second stage in building the FSM consists of inserting failure edges. When
a string match is not found, it is possible for the suffix of one string to match the
prefix of another, so failure edges need to be inserted. Failure edges are shown
with dotted lines. For figure clarity, only a few failure edges are shown. Once this
FSM is built, the algorithm traverses it with bytes from packet. In case the byte
does not correspond to any of the examined edges, then the traversal is restarted
from the root-node.
A few terminology clarifications. Henceforth, the number of outgoing edges
from a node is referred to as fan-out. For example, fan-out of node 5 is 3. Also,
any reference to database or string database refers to the Snort string database.
The main advantage of this algorithm is that it runs in linear time to the input
string, regardless of number of strings. However, the problem with this algorithm
lies in devising a practical implementation. This is again due to the large fan-out
of each and every node. Implementing this requires a great deal of next pointers,
256 for each and every node to be exact. This consequently increases the size
of the FSM. For example, the FSM built using the September-2007 Snort string
database contains more than 42,000 nodes and requires 44 MB of storage space. So
if a specialized hardware is used for attack inspection then the Aho-Corasick FSM
16 Architecture Support for Intrusion Detection Systems

CHAPTER 2. Background
is stored in a slower off-chip memory, rather than the faster on-chip memory. For
example, the Intel IXP 2400 network processor has an aggregate on-chip memory
less than 1 MB.
The large size of the FSM also results in a larger memory footprint, and so it
affects the cache hit rate. Additionally, with new attacks being created all the time,
the database needs to be regularly updated. This, in turn, results in a growing
string database. Thus the storage space requirements keeps growing. So one of
the implementation issues with Aho-Corasick algorithm is the growing memory
area required to store the FSM. Another implementation issue is the sequential
nature of traversal. The determination of the next state is strictly dependent on
the current state. So, multiple bytes from a packet can only be processed in a
strict sequential order.
2.4 Related Work
The literature in this field has focused either on reducing the FSM size or on
accelerating the FSM traversal. Furthermore, earlier works have also explored
specialized engines, often referred to as deep packet inspection engines, or alter-
natively used commodity CPUs. Below we discuss some of these works in detail.
Tuck et al [70] study different optimizations to reduce the size of each node in
the state machine. They use a 256 bit bitmap which is used in place of 256 next-
node pointers. A bit is set in the bitmap if the corresponding character has a valid
next-node. They also use path compression to compress the bitmap structure.
While they reduce the storage size, a disadvantage is the additional computational
Architecture Support for Intrusion Detection Systems 17

CHAPTER 2. Background
complexity due to compression.
Tan et al [68] reduce the high fan-out by maintaining a bit-level state machine
for every bit in the byte. These independent bit-level state machines are traversed
concurrently. A bit vector is used to synchronize the partial matches of the bit-
level state machines. The advantage is that it reduces the storage size, and also
provides parallelism - as these state machines can be traversed concurrently. The
use of parallelism together with a reduced storage size improves the performance
and area efficiency.
Piyachon et al (ANCS 2006) [43] exploit parallelism available in network pro-
cessors. For example, the Intel IXP-2800 network processor has 16 RISC cores,
with each core executing 8 threads. They partition the Snort database among
these cores. This approach provides an efficient way of utilizing on-chip memory
in a network processor. However, with the string database growing non-linearly,
and limited on-chip memory available in network processor, this approach may not
be scalable.
Piyachon et al (DAC 2007) [44] observe that a large percentage (>59%) of
states do not have any matched pattern. They further observe that in [68], the
bit-vector dominates the storage space. So they propose heuristics to store bit-
vectors only for states with matching pattern. Additionally, they also decouple
the storage of the state machine from the bit-vector.
Piyachon et al (DAC 2008) [45] extend [68] by using a translation table and
a CAM instead of bit-vectors. They propose a relabeling algorithm that assigns
identical state labels to various states that match the same pattern. Note that
these states are on different bit slices of the bit-split state machine in [68]. A
18 Architecture Support for Intrusion Detection Systems

CHAPTER 2. Background
translation table is used to obtain the matched pattern. If states with different
labels match a pattern, then a CAM is used. Both the CAM and the translation
table are indexed using the state labels.
Lin et al [32] observe that there are numerous equivalent nodes in the state
machine. Two nodes are defined as equivalent if they have identical incoming
edges, failure edges and outgoing edges. They propose merging these equivalent
nodes by adding a bit-vector to the base structure. Sourdis et al [61] propose
pre-filtering for string matching. They observe that it is very rare for a single
incoming packet to fully or partially match more than a few tens of strings. Based
on this observation, they select a small portion from each string to be used in the
pre-filtering step. The result of pre-filtering step is a reduced set of strings that
are candidates for a full match. Given this reduced set, the second stage is an
entire packet matching using the reduced set of strings. Pre-filtering improves the
throughput of IDS at no additional cost.
Some earlier works also use specialized hardware structures that accelerates
string matching. Dharmapurikar et al [17] use parallel bloom filters. They first
cluster the strings based on their length. Subsequently the bloom filter signature
is generated for each cluster. Yu et al [72] use TCAMs to perform the pattern
matching of attack strings. The TCAM pattern table is filled with attack strings.
Further, the input payload bytes are used to index into the TCAM pattern table.
The main advantage of this approach is the use of TCAMs that provides the ability
to search the attack strings in parallel.
Earlier works have also explored using FPGAs for string matching of attack
Architecture Support for Intrusion Detection Systems 19

CHAPTER 2. Background
strings. The primary advantage in using FPGAs is the feature of reconfigurabil-
ity. This is useful when updating the attack string database regularly. The FPGA
based approaches have explored heuristics to exploit the redundancy present in the
attack strings. Clark et al [13] observe that multiple attack strings use identical
characters. So they propose character encoding techniques to efficiently implement
the string matching algorithm in FPGAs. Sidhu et al [52] use FPGAs to efficiently
traverse the Non-deterministic Finite Automata (NFA). They propose specific cir-
cuit implementations that enables multiple NFAs to be traversed concurrently.
Intrusion Detection Systems also use regular expression for specifying attack
strings. Regular expressions are again converted either to Non-deterministic Finite
Automata (NFAs) or Deterministic Finite Automata (DFAs). Note that a DFA
is very similar to the Aho-Corasick FSM, and so the optimizations used in a
DFA is equally applicable. Earlier works on optimizing the DFA have focused on
compacting the automata or accelerating its traversal. Smith et al [56] propose
heuristics to compress redundant paths in DFAs. These redundant paths arise
due to interaction between different regular expressions[71]. In order to reduce
the impact of this interaction, [35, 50, 71] consider clustering regular expressions.
Kumar et al [29] remove redundant transitions in the DFA. Becchi et al [7] further
optimize the transitions in [29]. Luchaup et al [33] use speculation techniques to
accelerate the DFA traversal. Brodie et al [9] build the FSM so that multiple bytes
can be traversed at a time.
20 Architecture Support for Intrusion Detection Systems

3Improving the Efficiency of an IDS
3.1 Introduction
Intrusion Detection Systems (IDS) have emerged as one of the most promising
ways to protect systems in a network against suspicious activities. An IDS com-
monly detects misuse by scanning packets for signatures. Signatures are byte
patterns that have commonly occurred in earlier reported attacks. Since attacks
are vast and diverse so there are plenty of signatures. For example, Snort[49] uses
a database of more than 40,000 signatures for detecting misuse. So to detect these
attack strings in the packet, Snort commonly uses the Aho-Corasick algorithm.
This algorithm first builds a Finite State Machine (FSM) from the database of
signatures. Later the FSM is traversed with bytes from the packet. The main
advantage in using this algorithm is that it provides a linear-time search irrespec-
tive of the number of signatures in the database. However, the challenge lies in
designing an efficient implementation.
So in this chapter, we investigate a novel architecture for the IDS. We propose
21

CHAPTER 3. Improving the Efficiency of an IDS
a compact storage that leverages the characteristic of the Snort database. Fur-
thermore, we propose a hardware architecture that is suitable for IDS processing.
We evaluate the efficiency of our proposed approach.
The rest of this chapter is organized as follows. Section 3.2 briefly revisits
the Aho-Corasick Algorithm. We present our mechanisms to improve the area
efficiency in Section 3.3. In Section 3.4 we present various mechanisms to improve
the performance efficiency. The simulation methodology used in obtaining the
results is discussed in Section 3.5. Section 3.6 presents the performance results.
Section 3.7 concludes this work.
3.2 Background
Snort uses the Aho-Corasick algorithm[2] for string matching. This algorithm
works by constructing a state machine based on the set of attack strings. Once
the state machine is constructed, incoming bytes from the packet are used to
traverse the state machine. We have provided in Section 2.3 an example of string
matching using the Aho-Corasick algorithm. In the following discussion, we use
this FSM (Figure 2.3) as an example.
The main advantage of this algorithm is that it runs in linear time to the
input string. However, the problem with this algorithm lies in devising a practical
implementation. The base algorithm is relatively inefficient in terms of area, due
to the large storage space needed for the FSM. This also consequently degrades its
performance inefficiency. So broadly earlier works in this direction have focused on
compacting the FSM, and improving its performance efficiency. Earlier works in
22 Architecture Support for Intrusion Detection Systems

CHAPTER 3. Improving the Efficiency of an IDS
this direction can be classified either as hardware or software approaches. Software
approaches optimize the data-structure, thereby reducing the size of the state
machine. While, hardware approaches accelerate string matching with specialized
structures. In Section 2.4, we have discussed in detail the related work in this
area.
We first discuss our proposed techniques to improve the area efficiency. Later
we investigate techniques to improve the performance.
3.3 Improving Area Efficiency
The bloated size of the state machine is due to the large size of each node in the
FSM. We observe that the fan-out of nodes in the state machine varies widely.
Figure 3.1 shows the fan-out distribution of nodes in the FSM. We observe that
70% of the nodes have a fan-out less than 20, while the root-node has a fan-out
of 103. So clearly there is a wide variance in the fan-out of nodes. We propose
a novel hybrid storage with one type of storage for the root-node, and a different
storage for other-level nodes. We first explain the other-level node storage.
In our proposed storage, we store a node as the set of its outgoing edges. Each
outgoing edge has the following: the corresponding byte, the fan-out of next node,
the offset to the next node, and rule offset of next node. The size of each edge
using this storage is: 1 B for byte, 1 B for fan-out, 3 B each for next node and
rule offsets, thus making a total of 8 B per edge. A collection of all these outgoing
edges forms a node. We illustrate this more clearly with an example.
Figure 3.2 shows the next nodes of node 5. Figure 3.3(a) shows the storage of
Architecture Support for Intrusion Detection Systems 23

CHAPTER 3. Improving the Efficiency of an IDS
Figure 3.1: Fan-out Distribution.
e i a
5
7 4 9
Figure 3.2: Node 5 Revisited.
this part of the state machine. The outgoing edges of this node are e, i, a. Consider
edge e. This edge points to node 7 and so its fan-out is stored. The next node
offset of e, NS Offset 7, points to node 7. The rule offset of e, Rule Offset 7,
points to a list of matched strings. In this manner, the entire state machine is
24 Architecture Support for Intrusion Detection Systems

CHAPTER 3. Improving the Efficiency of an IDS
stored contiguously in memory. So we use offsets instead of pointers.
Before we proceed, a terminology clarification. Hereafter, a reference to edge
information refers to the following: next node fan-out, next node offset and rule-
offset. For example, the edge information of edge e in the above example is 2,
NS Offset 7, Rule Offset 7. The string matching algorithm at node 5 is as
StorageNode 5
Mem_Addr_Node_5 + 8 Mem_Addr_Node_5 + 16
2eRule
i 0Rule
aRule NS_Offset_4 NS_Offset_9
Offset_9
Mem_Addr_Node_5
2NS_Offset_7
Offset_7 Offset_4
(a)
Node 1 Storage
Mem_Addr_Node_1 + 8 Mem_Addr_Node_1 + 16
Rule e
Rule 0
Rule aNS_Offset_3
Offset_3i NS_Offset_9
Offset_90
Mem_Addr_Node_1
2 NS_Offset_4Offset_4
(b)
Figure 3.3: Our Proposed Storage
follows. The incoming byte is compared with its edges namely, e, i, a. In case of
a match with any edge, the corresponding edge information is read.
Architecture Support for Intrusion Detection Systems 25
CHAPTER 3. Improving the Efficiency of an IDS
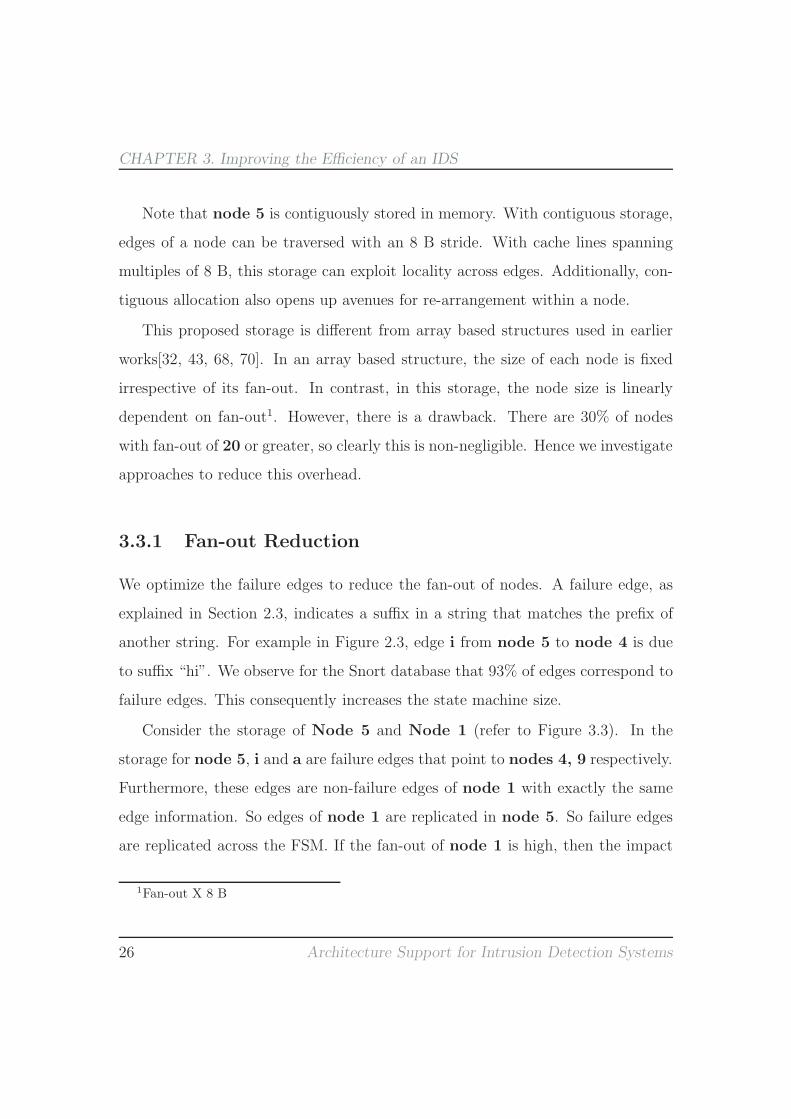
Note that node 5 is contiguously stored in memory. With contiguous storage,
edges of a node can be traversed with an 8 B stride. With cache lines spanning
multiples of 8 B, this storage can exploit locality across edges. Additionally, con-
tiguous allocation also opens up avenues for re-arrangement within a node.
This proposed storage is different from array based structures used in earlier
works[32, 43, 68, 70]. In an array based structure, the size of each node is fixed
irrespective of its fan-out. In contrast, in this storage, the node size is linearly
dependent on fan-out1. However, there is a drawback. There are 30% of nodes
with fan-out of 20 or greater, so clearly this is non-negligible. Hence we investigate
approaches to reduce this overhead.
3.3.1 Fan-out Reduction
We optimize the failure edges to reduce the fan-out of nodes. A failure edge, as
explained in Section 2.3, indicates a suffix in a string that matches the prefix of
another string. For example in Figure 2.3, edge i from node 5 to node 4 is due
to suffix “hi”. We observe for the Snort database that 93% of edges correspond to
failure edges. This consequently increases the state machine size.
Consider the storage of Node 5 and Node 1 (refer to Figure 3.3). In the
storage for node 5, i and a are failure edges that point to nodes 4, 9 respectively.
Furthermore, these edges are non-failure edges of node 1 with exactly the same
edge information. So edges of node 1 are replicated in node 5. So failure edges
are replicated across the FSM. If the fan-out of node 1 is high, then the impact
1Fan-out X 8 B
26 Architecture Support for Intrusion Detection Systems

CHAPTER 3. Improving the Efficiency of an IDS
of replication will be severe.
The failure edges of node 5 can also be traversed by jumping to node 1 from
node 5. So node 1 can be viewed as a failure-pointer of node 5. The advantage
with this traversal is that failure edges are not replicated in node 5. A unique
character, uchar, is used to indicate the presence of a failure-pointer in the node.
This unique character is not present in the Snort string database. Figure 3.4 shows
the modified storage for node 5. The edge information corresponding to uchar
is the edge information of node 1. Now the traversal is as follows. The incoming
eRule
uchar2 NS
Offset_7 Offset_7NS
Offset_1Rule
Offset_1
Mem_Addr
3
Mem_Addr + 8
Figure 3.4: Fan-out Reduction for Node 5.
byte is first compared with e and in case it doesn’t match, the existence of uchar
is checked in node 5. If a failure-pointer exists (and it does in this case), it is
traversed and the above outlined steps are again repeated for node 1 . Note that
each node has at most one failure-pointer.
3.3.2 Root-Node Storage
The very high fan-out (103) of the root-node together with its very high access
frequency motivates us to explore a different structure for root-node. We use
Architecture Support for Intrusion Detection Systems 27

CHAPTER 3. Improving the Efficiency of an IDS
an array structure for the root-node. Each element in the array stores the edge
information of the corresponding edge. In the example used, the edge, s, of the
root-node stores the edge information of node 2. Figure 3.5 shows the root-node
storage. So with this storage, the root-node needs 2 KB (256X8). The traversal
s1 NS_Offset_2 Rule_offset_2
8 B
Figure 3.5: Root Node Storage.
using this root-node structure consists of indexing the incoming byte into the root-
node array structure Since the root-node is frequently accessed and it is only a few
KBs, we store it on-chip. The other-level nodes is stored in an off chip SRAM.
An interesting case arises with failure edges. Consider, for example the failure
edge, s, from node 7 to node 2. Note that the optimized storage stores failure-
pointers instead of failure edge, and in this case all these failure-pointers point to
the root-node. Hence, the failure-pointers to root-node themselves are replicated.
We remove these root-node failure-pointers, and directly index the root-node array
if there are no matching edges.
28 Architecture Support for Intrusion Detection Systems

CHAPTER 3. Improving the Efficiency of an IDS
3.3.3 Area Comparison
Figure 3.7 shows the area needed for storing the state machine for the various
schemes. The area results are obtained using CACTI [69] and for the SRAM
memory technology. Baseline refers to the state machine built using the base
implementation of 256 next node pointers. BS-FSM2 refers to the state machine
built using [68]. Note that both these schemes use an array structure for storing
struct fsm_node{
struct fsm_node * next_node[MAX_NUM_EDGES];
struct rule * rule_list;
}
Figure 3.6: Data Structure Used for Comparison Schemes.
nodes in the FSM. Figure 3.6 shows the array structure used for these schemes.
While Baseline needs 256 next node pointers (MAX NUM EDGES = 256), BS-
FSM requires only 4 next node pointers.
We observe that the Baseline requires two order of magnitude of additional
area in comparison. So it is not relatively area efficient. In comparing BS-FSM
and Our Proposal, we observe a 2.2X reduction in area for Our Proposal. The
BS-FSM requires 6.33 mm2 (2435 KB) for storing the state machine, while our
proposed storage needs 2.86 mm2 (1034 KB).
2Bit-Split FSM - the name used in [68]
Architecture Support for Intrusion Detection Systems 29

CHAPTER 3. Improving the Efficiency of an IDS
Figure 3.7: Area Comparison for Various Proposals.
3.4 Improving the Performance Efficiency
Having investigated techniques to improve the area efficiency, we now present
mechanisms to improve the performance efficiency. In this section, we first present
enhancements for accelerating other-level nodes. Subsequently we investigate tech-
niques to accelerate the root-node access.
3.4.1 Rearranging Edges
The number of memory accesses to read all edges of a node is dependent on the
fan-out. For example in Figure 3.4, two memory accesses are needed for reading
all the edges (e, uchar) of node 5. This is again a performance penalty and we
30 Architecture Support for Intrusion Detection Systems

CHAPTER 3. Improving the Efficiency of an IDS
investigate ways to reduce this penalty.
The traversal of a node can be split into two phases namely, edge scanning,
comparing the incoming byte with all edges; and reading the edge information.
Edge scanning needs to be performed for all incoming bytes, and so this is a
potential performance penalty. We investigate a technique to reduce it. If all
eOffset_1
Rule3
Offset_7
Rule 2
Mem_Addr Mem_Addr + 16
uchar NS_Offset_7
Mem_Addr + 8
NS_Offset_1
Figure 3.8: Fine Tuning for node 5.
edges of a node are stored contiguously, then fewer memory accesses are needed.
Consider node 5 (refer to Figure 3.4), we re-arrange this node so that edges are
grouped together (refer to Figure 3.8). With this re-arrangement, all edges of node
5 are read in just one memory access. In case the incoming byte matches any of
these edges, the corresponding edge information is obtained with another memory
access. In our simulations, we perform 8 B memory read operations, so only fan-
out MOD 8 memory accesses are needed. Additionally, note that comparison of
edges with the incoming byte proceeds first with e and then with uchar. This
operation can be parallelized with a vector comparator, which can further reduce
the computational overhead. We assume the support of an 8 B vector equal-
to comparison operation in our simulated architecture. An 8 B vector equal-to
comparator primarily consists of 64 AND gates.
Architecture Support for Intrusion Detection Systems 31

CHAPTER 3. Improving the Efficiency of an IDS
Note that this re-arrangement would not guarantee memory alignment for edge
information. So we pad the data-structure so that memory accesses are aligned to
the nearest 8 B boundary. The area results presented in Section 3.3 are obtained
with this aligned storage. Algorithm 1 summarizes the state machine traversal
using our proposed storage.
Algorithm 1 Traversal Using Our Proposed Storage.
1: j ← 02: while j < fanout do3: Get Edges {8 B Memory Read}4: if Edge exists in Incoming Byte {Edge scanning} then5: Get Edge Info {Read the Edge Information}6: if Rule Offset 6= 0 then7: Alert {Signal System Alert}8: end if9: end if
10: j ← j + 811: end while12: if Failure Ptr Exists then13: Get Fail Node Edge Info {Read the Fail Node Info}14: if Rule Offset 6= 0 then15: Alert {Signal System Alert}16: end if17: else18: Root Node Access19: end if
3.4.2 Accelerating Root-Node Accesses
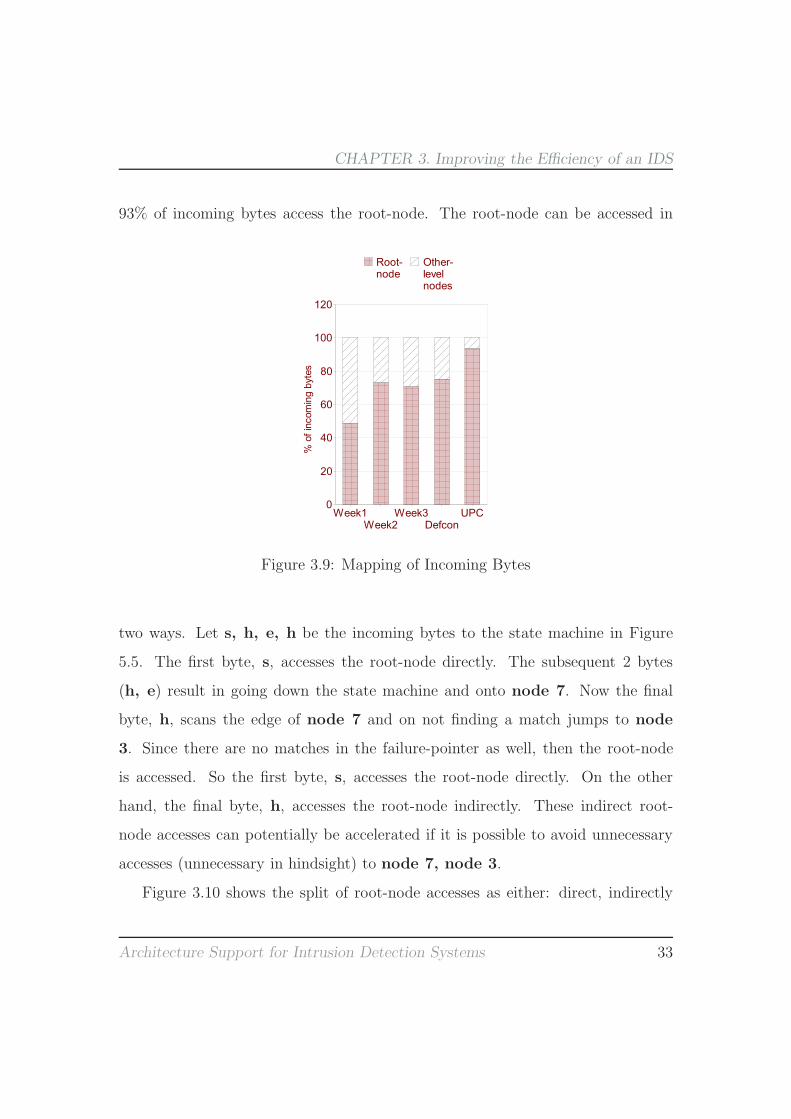
Figure 3.9 shows the mapping of incoming bytes to root-node and other-level
nodes for various traces. We observe that, for the various traces evaluated, up-to
32 Architecture Support for Intrusion Detection Systems
CHAPTER 3. Improving the Efficiency of an IDS
93% of incoming bytes access the root-node. The root-node can be accessed in
Figure 3.9: Mapping of Incoming Bytes
two ways. Let s, h, e, h be the incoming bytes to the state machine in Figure
5.5. The first byte, s, accesses the root-node directly. The subsequent 2 bytes
(h, e) result in going down the state machine and onto node 7. Now the final
byte, h, scans the edge of node 7 and on not finding a match jumps to node
3. Since there are no matches in the failure-pointer as well, then the root-node
is accessed. So the first byte, s, accesses the root-node directly. On the other
hand, the final byte, h, accesses the root-node indirectly. These indirect root-
node accesses can potentially be accelerated if it is possible to avoid unnecessary
accesses (unnecessary in hindsight) to node 7, node 3.
Figure 3.10 shows the split of root-node accesses as either: direct, indirectly
Architecture Support for Intrusion Detection Systems 33

CHAPTER 3. Improving the Efficiency of an IDS
from first-level nodes (nodes 1, 2), or indirectly from lower-level nodes (levels
lower than the first-level). A significant percentage (at least 50.14%) of the in-
coming bytes access the root-node indirectly. We observe that up-to 42% (UPC
trace) of root-node accesses, access the root-node indirectly from the first-level. So
we concentrate on accelerating indirect root-node accesses arising from first-level
nodes.
Figure 3.10: Root Node Access Split
As discussed in Section 3.3.2, the root-node is an array of edge information. In
addition to this edge information, we store a bit-vector of 256 bits alongside the
edge information. A bit in the bit-vector is set for all outgoing edges of that node.
Figure 3.11 shows the storage of the outgoing edge, h, of the root-node. The bits
in the bit vector are set for all outgoing edges of node 1, namely, a, e, i. The
34 Architecture Support for Intrusion Detection Systems

CHAPTER 3. Improving the Efficiency of an IDS
Edge Info
Node 1
8 B
<256 Bit Vector>
32 B
Figure 3.11: Storage of the Outgoing Edge e.
traversal using this enhancement is as follows. Let h, a be incoming bytes. The
first byte, h, results in a direct root-node memory access. The second byte, a, also
reads the root-node memory and checks if the bit in the bit-vector of the edge h
(also the previous byte) is set. If it is set, then the other-level node structure is
accessed as previously. If the bit is not set, then this is a root-node access and
the corresponding edge information is read. In this way, we completely eliminate
indirect root-node accesses from the first-level. Note that in order to access the
bit-vector we only need the current and previous byte.
The edge information that is read on a root-node access is used to process the
next byte. This is root-node edge information. However, if the next byte also
accesses the root-node then the root-node edge information is not needed. We
observe that there are up-to 14 consecutive bytes that access in this manner. So
these bytes do not need the root-node edge information. For these bytes we only
need to check if the bit is set in the bit-vector. If the bit is not set then it is a
root-node access. We accelerate these consecutive root-node accesses by pipelining
them. Figure 3.12 shows the various steps in the root-node access. These are the
following:
• Address Generation. Compute the memory address of the bit-vector. The
Architecture Support for Intrusion Detection Systems 35

CHAPTER 3. Improving the Efficiency of an IDS
EdgeInfo
Bit Vector
fn (cur_byte, prev_byte)Generation
Address
Cur_byte
Memory
Read
Root−node Memory
Bit−set Check Bit−set Comparison
Figure 3.12: Pipelined Root-node Memory Access
current byte and the previous byte are used to compute this index.
• Root-Node Memory Read. Read the bit-vector from root-node memory.
• Bit-set Check. Check if the bit is set in the bit-vector for the current byte.
The pipeline latency is that of accessing the root-node memory and is 3 clock-cycles
(obtained from CACTI [69]). Thus, for consecutive bytes directly accessing the
root-node, the throughput will be 3 clock-cycles per byte. Note that the bit-vector
enhancement requires an additional 8 KB (32 B X 256) of root-node memory. The
pipeline is flushed in case the bit is set, then the other-level node structure needs
to be accessed.
36 Architecture Support for Intrusion Detection Systems
CHAPTER 3. Improving the Efficiency of an IDS
3.4.3 Hardware Architecture
Input Queue
Root−node
Cache
Other−node Processing Engine
MemoryRoot−node
Other_Level_Node_Access
Processing Engine
ReadEdge−Info
EdgeScan
Other−level−node memory
Figure 3.13: Proposed Hardware Architecture
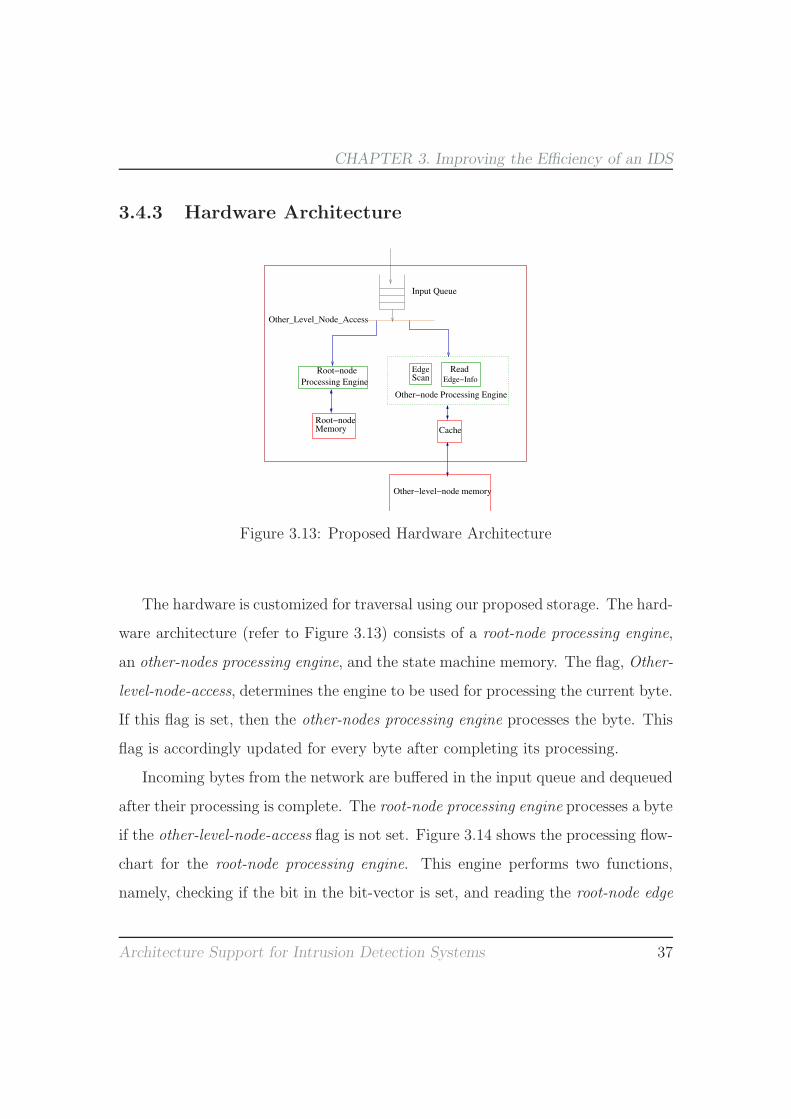
The hardware is customized for traversal using our proposed storage. The hard-
ware architecture (refer to Figure 3.13) consists of a root-node processing engine,
an other-nodes processing engine, and the state machine memory. The flag, Other-
level-node-access, determines the engine to be used for processing the current byte.
If this flag is set, then the other-nodes processing engine processes the byte. This
flag is accordingly updated for every byte after completing its processing.
Incoming bytes from the network are buffered in the input queue and dequeued
after their processing is complete. The root-node processing engine processes a byte
if the other-level-node-access flag is not set. Figure 3.14 shows the processing flow-
chart for the root-node processing engine. This engine performs two functions,
namely, checking if the bit in the bit-vector is set, and reading the root-node edge
Architecture Support for Intrusion Detection Systems 37

CHAPTER 3. Improving the Efficiency of an IDS
Is Bit set ?
Yes
No
Root−node memory read
Index = fn (cur_byte, prev_byte)
Dequeue
Update Next−node info
Read root−node Edge Info
Figure 3.14: Root-node Processing Engine
information. The bit set check is performed by the 3 staged pipeline unit as
discussed in the previous section (Section 3.4.2). Note that the first 3 steps of
root-node processing are also the 3 pipeline stages. The hardware logic needed for
this unit are: an 8 B Equal-to comparator and a shift-and-add logic block. In case
the bit in the vector is set, then the root-node edge information is read, and the
flag is also set.
The other-nodes processing engine traverses the state machine using the Algo-
rithm 1. The traversal operations consists of: scanning all the edges of a node,
and reading the associated edge information of the matching edge. So we split
this engine into these operations (refer to Figure 3.15). In edge scanning, all edges
of a node are read - 8 at a time - and compared (vector comparison) with the
current byte. This is iterated over all edges until a matching edge is obtained. If
38 Architecture Support for Intrusion Detection Systems

CHAPTER 3. Improving the Efficiency of an IDS
Mem_Addr = fn (fanout, index)
Mem Read (Edge Info)
Update Next−node info
Signal Alert
Dequeue
Yes
No
Matches
If Rule
(a) Edge Information Processing
Dequeue
Compute Mem_Address
Mem Read (Node Edges)
Yes
No
No
Edge−info
Reading Yes
Fanout<=Index
Edge Exists ?
Index = Index + 8
(b) Other node Processing Engine - EdgeScanning
Figure 3.15: Processing Flow-charts
a matching edge or a failure-pointer exists, then the associated edge information
is read. Otherwise, the root-node is accessed and Other-level-node-access is re-set.
For edge scanning the hardware needed is: an 8 B vector equal-to comparator,
a shift-and-add, and a less-than-equal-to comparator. While for reading the edge
information, the hardware required is a shift-and-add and an equal-to comparator.
Note that identical steps (edge scanning and reading edge information) are also
followed for failure-pointers. We assume that each of the arithmetic processing
blocks need 1 clock-cycle, and if comparisons need 2 clock-cycles.
Architecture Support for Intrusion Detection Systems 39

CHAPTER 3. Improving the Efficiency of an IDS
3.5 Simulation Methodology
We evaluate the performance of our proposed architecture and compare it with
the base Aho-Corasick and BS-FSM[44, 45, 68]. We have used 5 network traces
in our evaluation. This includes 3 publicly available traces from Lincoln Labs[37],
an attack trace[16], and an in-house University trace. Table 3.1 summarizes the
traces used.
Data-sets Mean Packet Size (B) Num Packets (M)Week 1 344.3 6.07Week 2 160.51 13.18Week 3 200.01 14.91Defcon 71.9 15.64UPC 535.87 15.89
Table 3.1: Summary of Traces used in Evaluation.
Week 1, 2 and 3 data-sets refers to the respective Lincoln Labs 1999 week traces,
and these are five day aggregates. The in-house traces (referred to as UPC) were
collected from the university router on November 7, 2007 at 18:00 hrs. This trace
was collected on a 1 Gbps link. The Defcon trace[16] is an attack trace captured
in the course of the Capture the Flag (CTF) game in Defcon conference[14]. The
objective of this game is to break in fellow competitors system, while at the same
time preventing others from doing so. We have inspected TCP, ICMP and UDP
packets from these traces. We have used the Snort database released on September-
2007, which contains 23,653 strings. We also later report results for the April-2010
Snort database containing 40,678 strings.
We use average number of clock-cycles per incoming byte as the metric
40 Architecture Support for Intrusion Detection Systems

CHAPTER 3. Improving the Efficiency of an IDS
for performance comparison. This is computed by dividing the total number of
clock-cycles by the total number of bytes. Total number of clock-cycles is the sum
of total processing time and total memory access time. Total process-
ing time comprises of: edge scanning, reading edge information and root-node
processing. Note that the processing times for edge scanning, edge information
and root-nodes processing are obtained as explained in Section 3.4.3. The to-
tal memory access time is obtained from the trace driven cache simulator[20],
which was modified to model cache access times and processing times. The cache
miss penalty is the other-level node memory access latency and is obtained from
CACTI[69]. The cache hit time is 2 clock-cycles (also from CACTI). The core
frequency is assumed to be 3 GHz. Figure 3.16 shows the architecture used for
Cache Cache Cache Cache
Core 1 Core 2 Core 4Core 3
Vector comparison unit
Off−chip
SRAM
Figure 3.16: Architecture of BS-FSM.
evaluating BS-FSM[68]. We have compared our proposed architecture with the
Architecture Support for Intrusion Detection Systems 41

CHAPTER 3. Improving the Efficiency of an IDS
SRAM
Off−chip
Cache
Core
Figure 3.17: Architecture of Baseline.
base Aho-Corasick and with bit-split FSM (BS-FSM) based approaches[44, 45, 68].
BS-FSM uses state machines constructed from bits instead of bytes. There are mul-
tiple state machines, each constructed using a set of bits from the byte. Further,
they observe that 2 bits, and therefore 4 (8b/2b) state machines is the optimal
point. These state machines are traversed in parallel. We simulate using 4 in-
dividual cores for the 4 state machines. We assume that the 4 cores also have
their private caches, and the state machine memory has 4 memory banks. Each
of these cores emit partial string match vectors for every byte and an intersection
of these vectors indicates a string match. This intersection is a synchronization
operation across the cores and is done by another core. Further, this intersection
is done using a vector comparator of vector-length equal to the number of strings
in the Snort database. The four partial match vector intersection is performed us-
ing 3 vector AND operations each of 1 clock-cycle latency. Piyachon et al[44, 45]
propose memory-efficient storage for these bit vectors. However, these techniques
42 Architecture Support for Intrusion Detection Systems

CHAPTER 3. Improving the Efficiency of an IDS
need additional memory accesses. Hence, we have simulated and compared with
the upper bound of BS-FSM based approaches. Figure 3.17 shows the Baseline ar-
chitecture that executes the base Aho-Corasick algorithm. Note that the Baseline
traverses the FSM by indexing an array.
Algorithm 2 Traversal Using Baseline and BS-FSM
Baseline
1: cur node← cur node[inp byte]2: if cur node→rule 6= NULL then3: Alert {Signal System Alert}4: end if
BS-FSM
1: shift amt[]← {192, 96, 48, 24}2: slicei ← 1{V alues : 0, 1, 2, 3}3: index ← (inp byte &
shift amt[slicei])4: cur node← cur node[index]5: if cur node→rule 6= NULL then6: Alert {Signal System Alert}7: end if
We obtain the total processing times for these comparison schemes by executing
their respective traversal algorithm on an in-order single-issue processor (processor
parameters in Table 3.2 ), and further simulated using Simplescalar[10]. Algorithm
2 provides the kernel to obtain these processing times. Additionally, we minimize
the impact of cold start misses by executing the kernel with an outer infinite
loop. Table 3.3 shows the processing clock-cycles needed per byte obtained in
this manner. In our evaluation, we have used SRAM memory double the state
machine memory size. This is driven by the fact that the SRAM needs to be
sufficiently provisioned for the exponentially growing database.
Architecture Support for Intrusion Detection Systems 43

CHAPTER 3. Improving the Efficiency of an IDS
Processor Frequency 3 GHzfetch/issue/decode width 1
Branch Predictor 2048 entry, bimodFunctional Units 4 Int ALU, 1 Int Mult
Technology 45 nmSRAM CACTI parameters LOP, semi-global wires,
conservative interconnectcache hit time 2 cc
Our Proposal cache miss latency 7 ccBS-FSM cache miss latency 11 ccBaseline cache miss latency 37 cc
Table 3.2: Simulation Parameters.
Schemes Clock-cycles per BBase Aho-Corasick 11.93
BS-FSM[68] 18.82
Table 3.3: Processing Clock-Cycles for Comparison Schemes.
3.6 Results
3.6.1 Cache Exploration Study
We vary the cache size and associativity for all the three considered schemes. The
cache size is varied from 16 KB to 64 KB, while the associativity is varied from
direct-mapped to a 4-way associative cache. Cache lines are 16B and an LRU
replacement is used. The Defcon trace is used for this study.
Figure 3.18 shows the cache exploration study for Our proposal, Baseline,
and BS-FSM. In case of Our proposal, we observe that the miss-rate with a
44 Architecture Support for Intrusion Detection Systems

CHAPTER 3. Improving the Efficiency of an IDS
(a) Our Proposal (b) BS-FSM
(c) Baseline
Figure 3.18: Cache Exploration Study
Architecture Support for Intrusion Detection Systems 45

CHAPTER 3. Improving the Efficiency of an IDS
16KB Direct-mapped cache is 10%. The miss-rate decreases with an increasing
cache-size and associativity, and for a 64 KB, 4-way cache the miss-rate is less
than 1%. The low miss-rate of a 16KB direct-mapped cache and its low circuit
complexity, motivates us to use this configuration. Further, we also observe that
for any given configuration, Our proposal incurs the least misses out of the three
schemes. This is due to the relatively smaller working set size of Our proposal
wrt Baseline and BS-FSM.
In BS-FSM there are four caches corresponding to the four cores. So in order
to capture the miss-rate of the four cores, we use the global miss-rate and define
it as follows. If one of the four cores incur a cache miss, then the processing of
the incoming byte is stalled. This stalls occurs as an intersection of partial match
vectors needs to be performed for every incoming byte. However, if multiple cores
incur cache misses, the byte processing is stalled only for a single cache miss. This
is due to multiple banks that simultaneously process misses from different cores.
Figure 3.18(b) shows the impact of cache exploration on the global miss-rate. We
observe a very high miss-rate for all configurations considered. For example, with
a 16 KB Direct-mapped cache the miss-rate is 78%. It reduces on increasing the
cache size and associativity. However, the miss-rate even with a 64 KB 4-way cache
is very high (40%). Since this configuration incurs the least number of misses, we
use it for the rest of our study. Note that in BS-FSM there are four caches with
the same configuration.
Figure 3.18(c) shows the cache exploration study for Baseline. We observe
that the miss-rate for 16 KB direct-mapped cache is 20%, and reduces to 4% for a
64 KB 4-way cache. So for Baseline we use a 64 KB 4-way cache for the remaining
46 Architecture Support for Intrusion Detection Systems

CHAPTER 3. Improving the Efficiency of an IDS
study.
3.6.2 Performance Comparison
Figure 3.19: Performance Comparison for September 2007 Snort database.
Figure 3.19 shows the performance of various proposals for all traces. We
observe that Our proposal outperforms other schemes in 4 of the 5 traces. For
the UPC trace, Our proposal needs only 6.88 clock-cycles per byte. On the
other hand, the Baseline and BS-FSM need 19.48 and 26.4 clock-cycles per
byte respectively. For this trace, we obtain a performance improvement of 73% in
Architecture Support for Intrusion Detection Systems 47

CHAPTER 3. Improving the Efficiency of an IDS
comparison to BS-FSM. A similar performance behaviour is observed in Defcon
trace with a 48% improvement over BS-FSM. For these traces, we observe that
more than 80% of bytes access the root-node. Furthermore, >80% result in direct
root-node accesses. Our proposed pipelined architecture accelerates these multiple
consecutive direct root-node accesses, thus providing the benefits.
It is interesting to note that the Week1 trace has a different performance be-
haviour. The Baseline performs better than Our proposal. This behaviour can
be explained as follows. Only 48% of bytes in week1 trace result in direct root-
node accesses. Additionally, more than 30% of the byte content in week1 trace is
0. There exists a string of 20 consecutive 0’s in the Snort database. This results in
the frequent traversal of this string’s node at level 20, and its predecessor at level
19. This node is the failure-pointer of the level 20 node. We observe that close to
30% of bytes in this trace access only these nodes. Since the failure-pointer traver-
sal needs additional processing, so it causes this performance degradation. We
also observe a similar, albeit less frequent, behaviour in week2 and week3 traces as
well. In these traces though Our proposal outperforms Baseline and BS-FSM.
Figure 3.20 shows the performance results for the April-2010 release. We
again observe a similar behaviour, Our Proposal outperforms both BS-FSM
and Baseline in 3 of the 4 traces. For example, in week2 trace Our Proposal
needs 17.55 cycles per B, while Baseline and BS-FSM need 20.85 and 26.12 cy-
cles per byte respectively. A similar performance behaviour is also observed in the
Defcon and week3 trace. However, for the week1 traceOur Proposal outperforms
BS-FSM, but there is a performance degradation wrt Baseline.
We have used the throughput metric as average number of clock-cycles
48 Architecture Support for Intrusion Detection Systems

CHAPTER 3. Improving the Efficiency of an IDS
Figure 3.20: Performance Comparison for the April-2010 Release.
per B (cpB). We can also obtain throughput in terms of byte processing rate
(Gbps) by a simple arithmetic (processor clock frequency/(cpB/8)). For example,
the throughput of Our proposal with the UPC trace is 3.4 Gbps.
It is interesting to observe that BS-FSM, even with additional hardware re-
sources (4 additional cores, 4 banked memory, and a 23653 long vector unit),
provides no performance improvement. The performance suffers due to the high
global miss rate of the caches in BS-FSM as explained in Section 3.6.1.
The hardware needed for traversal using our storage can be summarized to
Architecture Support for Intrusion Detection Systems 49

CHAPTER 3. Improving the Efficiency of an IDS
consists of: an 8-B vector EQUAL-TO comparator (64 AND gates), 3 shift-and-
add operators, 3 mask operations, an adder, and 2 less-than-equal-to comparators.
These are not complex logic blocks and can be incorporated without significantly
increasing the chip complexity. Note that our proposed state machine storage gives
43X area improvement in comparison to the baseline, and over 2x in comparison
to BS-FSM. Additionally, these schemes also need 64k 4-way assoc cache (in case of
BS-FSM there are 4 such caches), while Our proposal needs a 16k direct-mapped
cache. In case of BS-FSM, the on-chip area also consists that of 4 additional cores
and a very long vector comparison unit. Given the area savings obtained, the chip
area for our proposal will not be significant.
3.6.3 Sensitivity Analysis
We study the sensitivity of the results with respect to the processing time and the
cache miss latency. So we vary the cache miss latency and the arithmetic processing
time latency. The synthetic trace is used for this analysis. It is generated by
randomly selecting Snort strings and combining multiple such strings to create
minimum-sized packets (64 B). In this manner, more than 20,000 Snort strings
were added and this process is repeated 30 times.
Figure 3.21(a) shows the sensitivity of the arithmetic processing blocks. In
this analysis we scale the latency of the processing blocks. So a scale factor of 2
scales the edge scanning (refer to Figure 3.15(b)) to 12 cycles (from 6 cycles) plus
the memory access time. We have similarly applied scaling to Baseline and BS-
FSM. We observe that Our Proposal and Baseline scale better in comparison
50 Architecture Support for Intrusion Detection Systems

CHAPTER 3. Improving the Efficiency of an IDS
(a) Processing Engine Latency Sensitivity (b) Cache Miss Latency Sensitivity
Figure 3.21: Sensitivity Analysis
to BS-FSM. This is due to the larger per byte processing time needed by BS-
FSM in comparison to the other schemes. Additionally, Baseline provides the
best scaling in comparison.
Figure 3.21(b) shows the sensitivity of cache miss latency. We vary the cache
miss latency from 5 cycles to 100 cycles. We observe that Baseline and BS-
FSM scale better on increasing cache miss latencies. Furthermore, Baseline
scales the best with increasing cache miss latency. We observe in Our Proposal
a very high miss-rate (34%), and hence scaling the cache miss latency degrades
the performance. Note that the trace used for this study is generated by randomly
Architecture Support for Intrusion Detection Systems 51
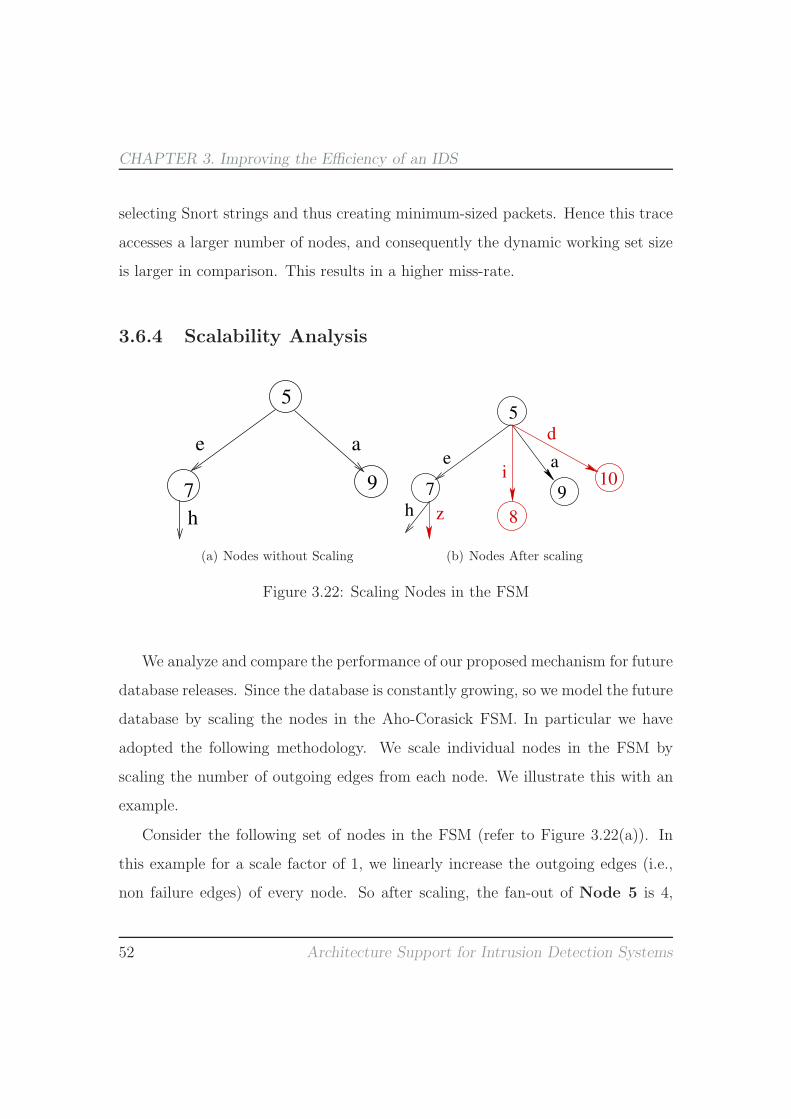
CHAPTER 3. Improving the Efficiency of an IDS
selecting Snort strings and thus creating minimum-sized packets. Hence this trace
accesses a larger number of nodes, and consequently the dynamic working set size
is larger in comparison. This results in a higher miss-rate.
3.6.4 Scalability Analysis
e a
5
7
h
9
(a) Nodes without Scaling
h z
ei
a
7
d5
8
910
(b) Nodes After scaling
Figure 3.22: Scaling Nodes in the FSM
We analyze and compare the performance of our proposed mechanism for future
database releases. Since the database is constantly growing, so we model the future
database by scaling the nodes in the Aho-Corasick FSM. In particular we have
adopted the following methodology. We scale individual nodes in the FSM by
scaling the number of outgoing edges from each node. We illustrate this with an
example.
Consider the following set of nodes in the FSM (refer to Figure 3.22(a)). In
this example for a scale factor of 1, we linearly increase the outgoing edges (i.e.,
non failure edges) of every node. So after scaling, the fan-out of Node 5 is 4,
52 Architecture Support for Intrusion Detection Systems

CHAPTER 3. Improving the Efficiency of an IDS
(a) Storage Size Scaling (b) Performance Scaling
Figure 3.23: Scalability Analysis
and that of Node 7 is 2. The scaled edges are chosen randomly and added for
every node other than the root-node. Additionally, leaf nodes are not scaled since
there are no outgoing edges. Note that scaling done in this manner only fattens
the FSM, but it does not increase the height of the FSM. In our study we vary
the scale factor from 1 to 4. Furthermore, we use the synthetic trace.
Figure 3.23(a) shows the impact of scaling on the storage size. The storage
size needed for Baseline scales at a much higher rate than Our proposal and
BS-FSM. This is due to the data-structure used for a node in the FSM, which is
an array of 256 pointers. Furthermore, we observe that Our proposal needs the
least storage space in all the scale factors considered. Figure 3.23(b) shows the
Architecture Support for Intrusion Detection Systems 53

CHAPTER 3. Improving the Efficiency of an IDS
impact of scaling on performance. We observe that the performance of Baseline
degrades at a higher rate in comparison to the other schemes. Furthermore, we
observe that BS-FSM provides the best performance on scaling. This is due
to the lower miss-rate (global miss-rate) of BS-FSM in comparison to the other
schemes.
3.7 Summary and Future Directions
In this chapter we have investigated various mechanisms to improve the area and
performance efficiency of an IDS. In our proposal for improving the area efficiency,
we have investigated a novel type of storage for storing the state machine. Using
this novel storage, we reduce the area needed by 2X magnitude in comparison to
BS-FSM[68]. We investigate mechanisms to improve the performance efficiency
of the IDS. Most notably, we observe that consecutive bytes in the trace directly
access the root-node. Based on this observation, we propose a pipelined archi-
tecture for processing these multiple consecutive bytes. We compare the perfor-
mance of our proposed architecture with BS-FSM based approaches. Our perfor-
mance results indicate that our proposed architecture outperforms BS-FSM based
approaches[44, 45, 68].
One way to further improve the efficiency of our proposed architecture is to
dynamically determine frequently accessed nodes (similar to the root-node) and
modify the layout at run time. It will also be interesting to study the behaviour
of this architecture under performance attacks.
54 Architecture Support for Intrusion Detection Systems

4Improving the Resilience of an IDS
4.1 Introduction
An IDS detects suspicious activities by monitoring the network traffic in real time.
So in order to be effective, an IDS must be able to inspect packets at wire speed.
The consequences of not doing so can result either in undetected malicious packets
or expensive packet drops. An adversary can also bring the IDS to this state of
not being able to process packets at wire speeds. Such attempts are commonly
referred to as evasion[15, 23, 48]. These attempts exploit weaknesses in some part
of IDS processing.
Evasion can come in various flavors. An example of evasion is clever packet frag-
mentation at “malicious content” boundaries, thus tricking the IDS from inspect-
ing malicious content. Other examples include deliberate packet header corruption
and stream re-assembly. The nature and ease of evasion makes it very appealing
for malicious hosts to bypass the IDS. Evasion can also occur by throttling the
performance of an IDS. Throttling the performance prevents the system to keep up
55

CHAPTER 4. Improving the Resilience of an IDS
with wire speed. So the IDS gets disabled, and thus the network is susceptible to
attacks. For this to occur, an adversary commonly exploits the wide performance
gap between average case and the worst-case processing time[15, 38, 55]. This can
also be viewed as a class of Denial-of-service (DoS) attacks that targets system re-
source utilization[36]. Earlier works in this direction investigate attack and defense
mechanisms for hash tables[15]. Additionally, other works exploit weaknesses due
to synctatics of signature specifications[55]. So in this chapter we investigate the
resilience of the Aho-Corasick algorithm used in an IDS. We present defense mech-
anisms to improve its resilience. Further, we evaluate our defense mechanisms, and
observe important benefits in deploying them.
The rest of this chapter is organized as follows. Section 4.2 provides the back-
ground. Section 4.3 presents the attack model. Section 4.4 details our proposed
counter-measure and our architecture. The simulation methodology used is dis-
cussed in Section 4.5, and Section 4.6 presents the performance results. Section
4.7 discusses the related work in this area. Section 4.8 provides possible future
directions in the context of this work.
4.2 Background
Snort[49] uses the Aho-Corasick algorithm for multiple string matching. This
algorithm works by constructing a FSM using the set of strings. Once this FSM
is constructed, incoming bytes from packets are used to traverse this FSM.
Figure 4.1 shows the Aho-Corasick FSM constructed from the following strings:
abcdee, bcdeg, cdeh, dei, ek. Failure edges are depicted in the figure with
56 Architecture Support for Intrusion Detection Systems

CHAPTER 4. Improving the Resilience of an IDS
dotted lines. For figure clarity, only a few failure edges are shown.
a
b
c
d
e
b
c
d
e
c
e
d
d
e
e 1
2
3
4
5
6
7
8
9
10
11
12
13
14
15
16
eg
h
i
k
17
18
g
k
19
20
21
h
i
Figure 4.1: Example of the Aho-Corasick State Machine.
As observed in the previous chapter, an important issue with the FSM is the
need for a large storage space. So in the previous chapter, we reduced the FSM
storage space by optimizing the failure edges as follows. Consider node 6 and
its edge g. This is a failure edge and is identical to the edge from node 10 to
node 18. In fact, all failure edges reveal a similar characteristic, and thus they
increase the FSM storage space. Node 10 can also be viewed as a failure pointer
of node 6. So this traversal can also be done by jumping to node 10. In this way
all failure edges can be eliminated. We observe that 93% of the edges in a FSM
are failure edges. Hence, replacing the failure edges with failure pointers provides
important area benefits as we observed earlier in Section 3.3.3. Additionally, earlier
Architecture Support for Intrusion Detection Systems 57

CHAPTER 4. Improving the Resilience of an IDS
a
b
c
d
e
b
c
d
e
c
e
d
d
e
e 1
2
3
4
5
6
7
8
9
10
11
12
13
14
15
16
g
h
i
k
17
20
21
e
19
18
Figure 4.2: Storage Space Optimization using Failure Pointers.
works[6, 29, 56, 59, 70] have also optimized the failure edges in an identical manner.
Figure 4.2 shows the FSM built using failure pointers. For the rest of the paper,
we consider this optimized FSM, and specifically use the FSM storage proposed in
the previous chapter. Figure 4.3 shows the storage of node 6 as discussed in the
previous chapter. The FSM constructed using the Aho-Corasick algorithm is very
e uchar 0 NS_Offset_19 Rule_Offset_19 1 NS_Offset_10 Rule_Offset_10
Figure 4.3: Node 6 Storage Using Failure Pointers.
similar to a deterministic finite automata (DFA). In fact Snort and other IDSs[42]
increasingly use regular expressions mainly due to their rich expressive powers.
58 Architecture Support for Intrusion Detection Systems

CHAPTER 4. Improving the Resilience of an IDS
These regular expressions are again normally converted to DFAs. So this work is
equally applicable to regular expressions and DFAs.
4.3 Motivation
The optimization of failure chains significantly compacts the data structure. How-
ever this has a drawback. A node with failure pointers may need additional pro-
cessing when there are no matching edges. In some cases we observe that this
additional processing is a significant overhead.
We illustrate this more clearly with an example. Let the input bytes to the
optimized FSM in Figure 4.2 be a, b, c, d, e, k. The first 5 bytes lead up-
to node 6. For the final byte, k, the failure pointer needs to be traversed as
there are no matching edges at node 6. Hence, node 10 - the failure pointer of
node 6- is accessed. Here again there are no matching edges, and so the failure
pointer of node 10 is accessed. This is repeated until a matching edge is found,
or the traversal is restarted from the root-node. Note that these chain of failure
pointers are accessed sequentially and sometimes wastefully as well. This can lead
to significant performance degradation when large such failure chains are visited.
We define failure chain length of a node as the maximum number of failure
pointers that can be traversed starting from that node. For example, the failure
chain length of node 6 is 4. Figure 4.4 shows the failure chain length distribu-
tion for Snort database releases. It is very interesting to observe that there are
nodes with failure chain lengths greater than 20 for all Snort releases. Thus for
bytes accessing failure edges of these nodes, the processing time can be high. We
Architecture Support for Intrusion Detection Systems 59

CHAPTER 4. Improving the Resilience of an IDS
Figure 4.4: Impact of Failure chain
investigate the performance impact of traversing failure chains.
Figure 4.5 shows the CDF of processing time per byte. The processing time
per byte is measured as the total number of clock cycles (cc) needed to complete
the processing of an input byte. This CDF plot is for the Snort April-2010 release.
We see that 95% of input bytes need less than 31 cc, thus leading to an average
processing time of 23.5 cc/B. However it is interesting to note that there are
bytes that need up-to 516 cc. This clearly indicates that there is a wide variation
in processing time.
We investigate the cause of this wide variation, by examining the processing of
the ten most clock consuming bytes (refer to Figure 4.6(a)). This is also the tail
60 Architecture Support for Intrusion Detection Systems

CHAPTER 4. Improving the Resilience of an IDS
0
0.2
0.4
0.6
0.8
1
0 100 200 300 400 500
Pro
babili
ty P
(X<
=x)
Clock-cycles per Byte
CDF of Proccessing time per Byte
Figure 4.5: CDF of Processing time per Byte
end (beyond 0.95 probability) of the CDF. As seen in Figure 4.6(a), we observe
that these bytes need at-least 495 cc. The cause of the enormous processing time
is unsurprisingly due to the traversal of a chain of failure pointers as observed in
Figure 4.6(b). In contrast, on examining of the relatively lesser clock consuming
bytes, we observe that these bytes traverse at most 3 failure pointers. This clearly
shows the significant impact of traversing a large chain of failure pointers. Note
that some bytes (in Figure 4.6(a)) traverse fewer failure pointers but incur a higher
processing time overhead. This is due to relatively fewer cache misses incurred in
these bytes.
The dependency of processing time on the failure chain length makes the IDS
vulnerable to algorithmic complexity attacks. Hence it is important to accelerate
failure pointer traversal and we study techniques to do the same.
Architecture Support for Intrusion Detection Systems 61
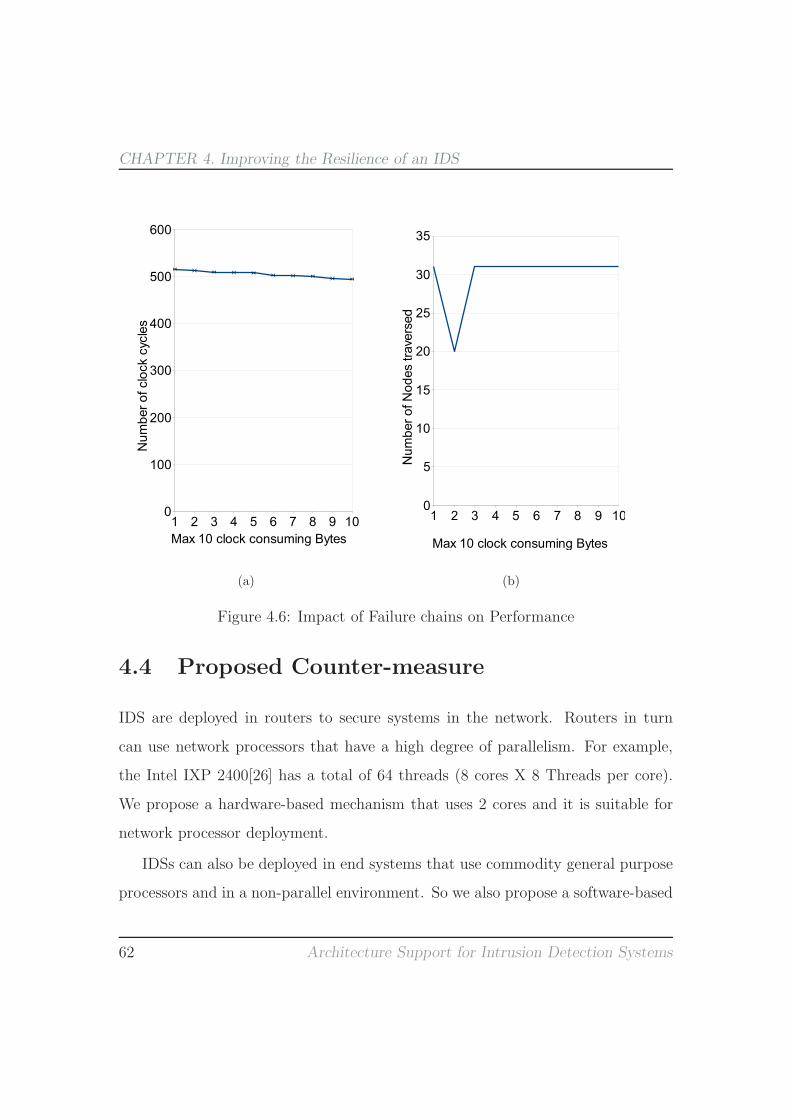
CHAPTER 4. Improving the Resilience of an IDS
(a) (b)
Figure 4.6: Impact of Failure chains on Performance
4.4 Proposed Counter-measure
IDS are deployed in routers to secure systems in the network. Routers in turn
can use network processors that have a high degree of parallelism. For example,
the Intel IXP 2400[26] has a total of 64 threads (8 cores X 8 Threads per core).
We propose a hardware-based mechanism that uses 2 cores and it is suitable for
network processor deployment.
IDSs can also be deployed in end systems that use commodity general purpose
processors and in a non-parallel environment. So we also propose a software-based
62 Architecture Support for Intrusion Detection Systems

CHAPTER 4. Improving the Resilience of an IDS
mechanism targeted for such an environment. We first present the hardware-based
mechanism.
4.4.1 Hardware-based Mechanism
The processing of a chain of failure pointers takes a performance hit due to the
sequential nature of its traversal. Our proposal performs a parallel traversal. One
engine performs the regular FSM traversal, while another engine concurrently
finds the candidate failure pointer. We first describe a mechanism to identify
the candidate failure pointer. Later, we present the parallel architecture used for
the traversal.
Candidate Failure Pointer Identification
The traversal of a chain of failure pointers can be viewed as a comparison of the
edges of a node to the input byte. Further, this process is repeated for the chain
of failure nodes. So we break this chain of traversal into a chain of comparing
outgoing edges.
We illustrate this more clearly with an example. Let the input bytes to the
FSM in Figure 4.2 be a, b, c, d, e, k. The first 5 bytes lead up-to node 6. For
the final byte, k, since there are no matching edges the failure pointer is traversed.
Node 10, the failure pointer of node 6, is accessed, and its outgoing edge (g) is
compared with the input byte (k). Since it is a mismatch, the failure pointer of
node 10 is accessed and it follows the failure chain until node 16.
So we see that the main operation that is performed is the comparison of the
Architecture Support for Intrusion Detection Systems 63

CHAPTER 4. Improving the Resilience of an IDS
input byte with all outgoing edges of a node. This operation can also be viewed
as checking for membership in a set of outgoing edges. Each set corresponds to
a failure pointer. Bloom filters[8] offer a convenient and efficient way to check -
without incurring any false negatives - for set memberships. We use bloom filters
to do the membership check. We create a hash for each failure pointer by using
its set of outgoing edges. We term this a bloom filter signature. We illustrate
this with an example. Consider node 6 (from Figure 4.2), we create and store
bloom filter signatures for all its failure chains, namely, nodes 10, 13, 15, and
16. Each of these signatures are generated using outgoing edges of each node.
Node 10
Sig
Node 13
Sig
Node 15
Sig
Node 16
Sig
fn(g) fn(h) fn(i) fn(k)
Node 16Node 15Node 13Node 10
fan−out)
(offset,(offset,(offset,
fan−out) fan−out) fan−out)
(offset,
Figure 4.7: Node 6 Signature Storage.
Figure 4.7 shows the signature storage of node 6 generated using this way. In
addition to signatures, we also store offset and fan-out of the corresponding failure
pointer. This is done so that when a signature matches, we can directly jump to
the matching failure pointer.
The traversal using bloom filter signatures is as follows. Consider traversing
node 6 with input byte as k. Since there are no matching edges in node 6, we
check if there are any matching edges in the failure chain. A signature is generated
using k, and compared against all the failure chain signatures of node 6. Since
node 16 has a matching signature, we directly traverse to node 16 with k and
64 Architecture Support for Intrusion Detection Systems

CHAPTER 4. Improving the Resilience of an IDS
obtain the pointer to node 17.
Note that in case of multiple matches, the matches are traversed sequentially
(from left to right in the Figure 4.7). This preserves traversal correctness, as the
signatures are stored in the way they are originally encountered.
Signature Storage
Node 6 Signature
Failconventional node 6 storage
signature
offset Chain
Num
Figure 4.8: Node 6 FSM Storage and Signature Access.
The failure chain signature matching can be performed independently and in
parallel with the conventional node processing. The failure chain is traversed
sequentially and only after checking for matching edges in a node. But it can be
accelerated by performing the failure pointer identification concurrently with the
conventional node processing. If there is no need to traverse the failure pointer,
then the failure pointer computation can be discarded.
The bloom filter signature database is stored in a separate memory bank. Our
memory architecture consists of two memory banks, with one containing the FSM
and the other containing signatures. This helps us in decoupling the FSM traversal
from the failure chain computation. Additionally, we also need to store a pointer
Architecture Support for Intrusion Detection Systems 65

CHAPTER 4. Improving the Resilience of an IDS
to the node signature in the FSM data structure. So every node also stores a
pointer to the signature database and its failure chain length. Figure 4.8 shows
the storage for node 6. Note that in the figure, conventional node 6 storage refers
to Figure 4.3.
Hardware Architecture
Engine
Cache Cache
Storage Storage
State Machine Signature
Traversal
Signature
EngineMatching
FSM
Figure 4.9: Hardware Architecture.
Figure 4.9 shows our proposed hardware architecture. The hardware consists
of a FSM traversal engine and a signature processing engine. The FSM traversal
engine performs the regular state-machine traversal and is identical to the FSM
traversal engine in Section 3.4.3. We summarize below the functionality of the
FSM traversal engine. The FSM traversal essentially consist of two operations.
Firstly, all edges of a node are scanned and compared with the input byte. If
there is any matching edge, the associated edge information is read. So we split
66 Architecture Support for Intrusion Detection Systems

CHAPTER 4. Improving the Resilience of an IDS
this engine into these operations (refer to Figure 4.10(a), 4.10(b), 4.11). In edge
scanning, the set of edges are read and compared with the input byte. This is
iterated over all edges until a matching edge is obtained. If a matching edge or
a failure pointer exists, then the associated edge information is read. Otherwise,
the traversal is restarted from the root-node.
Dequeue
Compute Mem_Address
Mem Read (Node Edges)
Yes
No
No
Edge−info
Reading Yes
Fanout<=Index
Edge Exists ?
Index = Index + 8
(a) Edge Scanning
Mem_Addr = fn (fanout, index)
Mem Read (Edge Info)
Update Next−node info
Signal Alert
Dequeue
Yes
No
Matches
If Rule
(b) Reading Edge Information
Figure 4.10: FSM Traversal Engine.
Figure 4.11 shows the flow-chart for the signature matching engine. This engine
generates the bloom filter signature using the input byte. Further, it compares the
generated signature with the stored signatures. Signatures are of length 4 B and
are generated using two hash functions. Since the signature comparison is an AND
operation, so we use 16 B AND operators for signature comparison. Thus allows
us to compare four signatures at a time. If a signature matches, then the matched
Architecture Support for Intrusion Detection Systems 67

CHAPTER 4. Improving the Resilience of an IDS
Mem_Read − Offsets, Failchain
failchain
exists
Generate Signature (gen_sig)
Mem_Read (Stored_Sig)
No
Yes
Yes Rootnodeaccess
Yes
compare signature
If no match
Yes
inc index
No
Yes
Mem read (offset, fanout)
get_failstate(offset,fanout)
Yes
No
Processing complete
No
index<=
failchain
If Sig set
Failstate==NULL
index<=
failchain
increment index
ExitNo
No
Exit
Figure 4.11: Signature Matching Engine
failure pointer is traversed. In the figure, the signature comparison operations are
shown in dark red text-boxes, while the failure pointer traversal is shown in blue.
In the design of bloom filters, false positive rate is a critical parameter that affects
the performance of the bloom-filer. So we discuss below the hash function used
for bloom filter generation, and the various parameters affecting the design of a
bloom filter.
68 Architecture Support for Intrusion Detection Systems

CHAPTER 4. Improving the Resilience of an IDS
Bloom-filter Signature Generation
The bloom filter is on the critical path since a signature needs to be generated for
every input byte in the payload. So the bloom filter signature generation needs
to be computationally simple and efficient. Hence we select bits from the failure
edge for generating the bloom filter signature.
We select 5-bits from the failure edge and use it to index a 4B word. The bit
thus indexed is also set. This process is repeated with a different 5-bit patterns
for subsequent hashes. These steps are also similarly repeated for all the failure
edges in failure pointer. The 4B word thus created is the signature for the failure
pointer. Figure 4.12 outlines the steps in the signature generation for a failure edge.
b7b5b3b2b1b5b3b2b1b0
b4b3b2b1b0 b5 b6 b7
GENERATED
HASHES
b2b1b0 b3 b4 b31
1 1
BLOOM−FILTER SIGNATURE
...............................................................................................................
A FAILURE EDGE
Figure 4.12: Bloom-filter Signature Generation.
In order to check whether the input byte matches a failure edge, this signature
Architecture Support for Intrusion Detection Systems 69

CHAPTER 4. Improving the Resilience of an IDS
generation is repeated for the input byte. Further, the signature thus generated
is compared with the signature stored for the failure pointer. If the signature
matches, then the failure pointer is traversed.
The main advantage in using bloom filters is the absence of false negatives. So
if signatures do not match then no matching failure edge exists. However, bloom
filters do encounter false-positives. So we explore the impact of various parameters
on the false-positive rate of the bloom filter. We have varied the number of hashes
(1 to 6) and also the signature size (4B and 8B signatures). Further, we use
the Synthetic trace for this study. Figure 4.13 shows the impact on the false-
Figure 4.13: Impact of Parameters on the False-positive Rate.
positive rate. We observe that the false positive rate is consistently below 15%.
Furthermore, on examining the impact of the number of hashes, the false-positive
rate increases with the number of hashes (more than 2 hashes). We also observe
70 Architecture Support for Intrusion Detection Systems

CHAPTER 4. Improving the Resilience of an IDS
that 8B wide signature has negligible impact on the false-positive rate. So these
reasons motivate us to use 2 hash functions and 4B wide signature in our study.
Our architecture concurrently performs signature comparison and the regular
FSM traversal. So if the input byte matches an edge, then the signature processing
is flushed. However, if there are no matching edges, then the candidate failure
pointer is obtained from the signature matching engine. Subsequently, this node
is traversed by the FSM traversal engine. Synchronization between the two engines
is performed after the processing of a payload byte. So if the FSM traversal engine
completes its processing and there are no matching edges. It waits for the signature
matching engine to identify the failure pointer. The processing of the next byte is
started only after the engines have completed their processing.
4.4.2 Software-based Mechanism
In this mechanism, the Aho-Corasick FSM is constructed so that there is an upper-
bound on the failure chain length. This upper-bound is as a threshold value. For
nodes with failure chain lengths equal to the threshold value, all its failure edges
are inserted. So there is no need to further traverse any failure pointers.
We illustrate this more clearly with an example. Consider the failure pointer
optimized FSM shown in Figure 4.2. If we use a threshold failure chain length
of 3, then failure edges are inserted for nodes with failure chain length of 3. So
with this scheme, failure edges are inserted for node 10 (as shown in Figure 4.14
with fine-dotted red lines). In this way we limit the failure chain traversal to a
threshold. In our simulations, we explore different values of the threshold in order
to find an optimal point.
Architecture Support for Intrusion Detection Systems 71

CHAPTER 4. Improving the Resilience of an IDS
a
b
c
d
e
b
c
d
e
c
e
d
d
e
e 1
2
3
4
5
6
7
8
9
10
11
12
13
14
15
16
ea
h
i
k
17
g
k
20
21
h
i
Figure 4.14: Software-based Mechanism.
4.5 Simulation Methodology
We evaluate the performance of our proposed mechanisms and compare it with
the conventional method of sequential failure pointer traversal. The conventional
method is the FSM traversal in the the previous chapter.
We have used three public traces, a synthetically generated trace, and a Hon-
eypot trace. The public traces are from the Lincoln labs [37] and Defcon[16]. For
the Lincoln labs we have used two weeks of traces (referred to by their respective
week) from 1999. In the Defcon trace, we use the trace captured for the Capture
the flag (CTF) game[16]. CTF is a hacking contest in the Defcon conference[14].
The objective of this contest is to break into computers of other teams, while at
the same time preventing others from doing so.
We have deployed a low-interaction Honeypot running in collaboration with
72 Architecture Support for Intrusion Detection Systems

CHAPTER 4. Improving the Resilience of an IDS
the Leurrecom project[46]. This Honeypot has been running for 3 months, and
the logs indicate that there has been an interaction with the outside world for
at-least 61 days. We have used the traces collected from this Honeypot.
We also include a synthetically generated trace. The synthetic trace was gen-
erated by randomly selecting strings from the Snort rule database and further
combining multiple strings. This was done to ensure minimum-sized packet (64
B). Further, this process was repeated 30 times.
Table 4.1 summarizes the traces used. Note that we have inspected TCP, ICMP
and UDP packets from these traces. We have used the Snort database released on
April 2010 and containing 40,678 strings.
Data-sets Mean Packet Size (B) Num Packets (M)Defcon 71.9 15.64synthetic 73.64 0.120Week 2 160.51 13.18Week 3 200.01 14.91
Honeypot 205 0.46
Table 4.1: Summary of Traces used in Evaluation.
We use average number of clock cycles per incoming byte as the metric
for performance comparison. This is computed by dividing the total number of
clock-cycles by the total number of bytes. Total number of clock-cycles is the sum
of total processing time and total memory access time.
The total processing time comprises of: edge-scanning, reading edge-information,
signature comparison, and signature offset computation. These processing times
are obtained by assuming each of the arithmetic processing blocks need 1 cycle
Architecture Support for Intrusion Detection Systems 73

CHAPTER 4. Improving the Resilience of an IDS
and branches need 2 cycles (refer to Figure 4.10(a), 4.10(b), 4.11). With this
assumption, edge scanning needs 6 cc plus the memory access latency.
The total memory access time is obtained from the trace-driven cache sim-
ulator [20], which was modified to model cache access times and processing times.
The cache miss penalty is obtained from CACTI [69] by plugging the FSM memory
size into the SRAM model of CACTI. We have used a 16k direct-mapped cache-
configuration for the caches. Note that in case of the hardware-based mechanism,
there are two caches each of 16k size. The cache hit time of 2 cc is used (also
obtained from CACTI). The core frequency is assumed to be 3 GHz.
4.6 Results
We compare the performance of our proposed architecture with the Baseline. The
Baseline performs traversal using the conventional way of sequentially following
failure pointers.
For the hardware-based mechanism, we have varied the minimal failure chain
length. So signatures are kept only for those nodes with a failure chain length
greater than threshold. We have used threshold values of 1, 3, 5. A threshold value
of 1 indicates that nodes with failure chain lengths >= 2 have stored signatures.
For the software-based mechanism, we have similarly varied the failure chain length
threshold. So in this scheme, nodes with a given threshold failure chain length will
have all its failure edges in place. We have used threshold values of 3, 5, 7.
In order to evaluate the worst-case performance, we compare the clock cycles
(cc) needed for the 10 most clock consuming bytes. Note that a byte that performs
74 Architecture Support for Intrusion Detection Systems

CHAPTER 4. Improving the Resilience of an IDS
badly in one scheme may not do so in another scheme. Additionally, we compare
the average-case performance. We initially report results for the synthetic trace
to determine the optimal points for the hardware and software-based mechanism.
Later we report results for the remaining traces.
A few terminology clarifications. Sig-1 refers to the use of bloom filter signa-
tures of threshold value 1. Similarly, Sw-3 refers to the failure chain length of 3
used in the software-based mechanism.
(a) Worst-case performance (b) Average-case Performance
Figure 4.15: Synthetic Trace Comparison Result for Hardware-based Mechanism
We now present results for the synthetic trace. Figure 4.15(a) shows the 10
most clock consuming bytes for the hardware-based mechanism. While Baseline
needs at least 495 cc, in these bytes the use of signatures brings it down to at most
119 cc. Additionally, on a closer examination of various threshold values, we see
that Sig-1 gives the best performance. For Sig-1 we see a worst-case performance
Architecture Support for Intrusion Detection Systems 75

CHAPTER 4. Improving the Resilience of an IDS
(a) Worst-case performance (b) Average-case Performance
Figure 4.16: Synthetic Trace Comparison Result for Software-based Mechanism
of 111 cc - a 4.33X improvement over the Baseline. Figure 4.15(b) shows the
average-case performance, and we see that it remains unaffected.
Figure 4.16 shows the comparison results for the software-based mechanism.
We again observe that keeping an upper-bound of failure chain lengths significantly
brings down the worst-case performance. While Baseline needs at least 495
cc in these bytes, the software-based mechanism reduces it to at most 219 cc.
Figure 4.16(b) shows the average-case performance and we again see that it remains
largely unaffected.
We also observe that Sig-1 performs the best for the hardware-based mecha-
nism. While Sw-3 performs best for the software-based mechanism. So for the
remaining traces we compare the performance of Sig-1, Sw-3 and Baseline. For
Defcon trace we observe a similar performance behaviour (refer to Figure 4.17).
76 Architecture Support for Intrusion Detection Systems

CHAPTER 4. Improving the Resilience of an IDS
(a) Worst-case performance (b) Average-case Performance
Figure 4.17: Defcon Trace Comparison Results
(a) Worst-case performance (b) Average-case Performance
Figure 4.18: Comparison Results for Week2 Trace
Architecture Support for Intrusion Detection Systems 77

CHAPTER 4. Improving the Resilience of an IDS
(a) Worst-case performance (b) Average-case Performance
Figure 4.19: Comparison Results for Week3 Trace
(a) Worst-case performance (b) Average-case Performance
Figure 4.20: Comparison Results for Honeypot Trace
78 Architecture Support for Intrusion Detection Systems

CHAPTER 4. Improving the Resilience of an IDS
Comparing the worst-case performance, the hardware-based mechanism reduces
the worst-case performance to 139 cc - over 3X improvement over the Base-
line. On the other hand, the software-based mechanism reduces the worst-case
performance to 147 cc. On comparing the hardware-based and software-based
mechanisms, we observe that the hardware-based mechanism moderately outper-
forms the software-based mechanism.
Figures 4.18, 4.19 and 4.20 show the performance results for week2, week3,
and Honeypot respectively. We again observe a similar behaviour, with Sig-1
providing the best performance for the worst-case. Note however that there is a
mild average-case performance degradation (in comparison to the Baseline) for
the software-based mechanism.
(a) Worst-case performance (b) Average-case Performance
Figure 4.21: Comparison Results for the Hybrid Mechanism for Synthetic Trace
It is interesting to note that our proposed mechanisms - hardware based and
Architecture Support for Intrusion Detection Systems 79

CHAPTER 4. Improving the Resilience of an IDS
software based mechanisms - are orthogonal. These mechanisms can also be
combined using an FSM constructed with an upper bound failure chain length
(software-based mechanism), and a parallel FSM traversal (hardware-based mech-
anism). Figure 4.21 shows the performance of this hybrid mechanism. We observe
no significant performance improvement in comparison to both these mechanisms.
Further, the combined scheme also needs the combined storage space of both the
mechanisms. The worst-case performance of the hybrid mechanism almost over-
laps with Sig-1. Hence is not distinctly visible in the figure.
Figure 4.22: Storage Space Comparison (Normalized to Baseline).
Both the software and hardware based mechanisms incur additional storage
space in comparison to the Baseline. So we evaluate the additional storage
space needed (measured in KBs) for our proposal. Figure 4.22 shows the storage
space required for various schemes. The memory required has been normalized
to the Baseline(706 KB). In case of the hardware-based mechanism, the addi-
tional storage space is between 34% and 84% to that of the Baseline. In case of
80 Architecture Support for Intrusion Detection Systems

CHAPTER 4. Improving the Resilience of an IDS
software-based mechanism, the additional storage space is between 1% to 140%
in comparison to the Baseline. This drastic increase in storage space in both
the mechanisms is due to the following reason. For both the mechanisms, as the
threshold failure chain length is reduced, the number of nodes that need failure
pointer also exponentially increases. So Sig-1 and Sw-3 need the maximum stor-
age space. Note that the hybrid mechanism needs the maximum storage space as
it incurs the combined storage space overhead.
4.6.1 Sensitivity Analysis
We study the sensitivity of our results to the cache miss latency and processing
time latency. So the following configurations have been considered: Sig-1,Sw-3,
and Baseline. The worst-case performance reported in this study is the most
clock consuming byte. Further, we use the synthetic trace for this study.
Figure 4.23 shows the impact of varying cache miss latency. The worst-case
performance of Baseline degrades at a very high rate with increasing cache miss
latency. Note that the worst-case performance of Sw-3 and Sig-1 almost overlap
and so are not visible distinctly. In case of average-case performance we see that
with increasing cache miss latency, the performance of Sw-3 degrades slightly. For
example for a miss latency of 100 cc, the performance of Sw-3 is 92.94 cc/B. In
contrast that of Baseline and Sig-1 are 87.49 and 86.35 cc/B respectively. Since
Sw-3 has the largest working set size, and so it results in more misses. Thus
the average-case performance of Sw-3 degrades faster on scaling the cache miss
latency.
As explained in the simulation methodology, each of the arithmetic processing
Architecture Support for Intrusion Detection Systems 81

CHAPTER 4. Improving the Resilience of an IDS
(a) Worst-case performance (b) Average-case Performance
Figure 4.23: Cache Miss Latency Sensitivity
blocks need 1 cycle and branches requires 2 cycles. We have studied the sensitivity
of these processing blocks by using a scaling factor. The scaling factor scales all the
processing latencies. For example, a scale factor of 2 indicates that edge scanning
needs 12 cc. This scaling is similarly done for all processing blocks.
Figure 4.24 shows the sensitivity of processing latencies. We observe that
the worst-case performance for the Baseline degrades at a higher rate with an
increasing processing latency. This is because the Baseline traverses a chain of
30 nodes. Thus it requires 30 edge scanning and 30 edge information processing
latencies. In contrast, Sig-1 and Sw-3 incur much lesser processing latencies. We
82 Architecture Support for Intrusion Detection Systems

CHAPTER 4. Improving the Resilience of an IDS
(a) Worst-case performance (b) Average-case Performance
Figure 4.24: Processing Engine Latency Sensitivity
also see that the average-case performance for Sig-1 and Sw-3 is unaffected with
respect to the Baseline.
4.6.2 Scalability Analysis
We use the Scalability analysis methodology discussed in Section 3.6.4 in this
study. Further, we have considered the following configurations: Sig-1,Sw-3,
and Baseline. We report the maximum clock consuming byte as the worst-case
performance for each configuration. We use the synthetic trace for this study.
Architecture Support for Intrusion Detection Systems 83
CHAPTER 4. Improving the Resilience of an IDS
Figure 4.25 shows the scalability comparison results.
We clearly observe that the performance of the Baseline, Hardware-based, and
Software-based mechanism scales (degrades) linearly with the scale factor. The
worst-case performance of both Baseline and the Hardware-based mechanism (Sig-
1) scales at a similar rate. In comparison, however, we observe that the worst-case
performance of Sw-3 degrades at a higher rate. This is due to the larger working
set size of Sw-3 which results in larger number of cache misses. The larger working
set size of Sw-3 is again due to the high degree of replication of high fan-out nodes
(nodes close to the root-node). For this configuration, these high fan-out nodes
are replicated at intervals of failure chain length equal to 3.
In case of the average-case performance, we again observe a similar behaviour.
Figure 4.25(c) shows the scalability of the storage size for the configurations con-
sidered. We again observe a similar behaviour with memory requirements for Sw-3
scaling at a higher rate than both Baseline and Sig-1.
4.7 Related Work
To the best of our knowledge, Crosby et al[15] were the first to introduce attacks
exploiting the algorithmic complexity. They exploited weaknesses in hash tables
used for port scanning in Bro IDS[42]. A hash table needs O(n) time for insertion
on an average and O(n2) in the worst-case. They carefully construct packets that
cause collisions in the hash table, and thereby approaching the worst-case perfor-
mance. As a counter-measure, they proposed the use of universal hash functions
which significantly reduces collisions.
84 Architecture Support for Intrusion Detection Systems
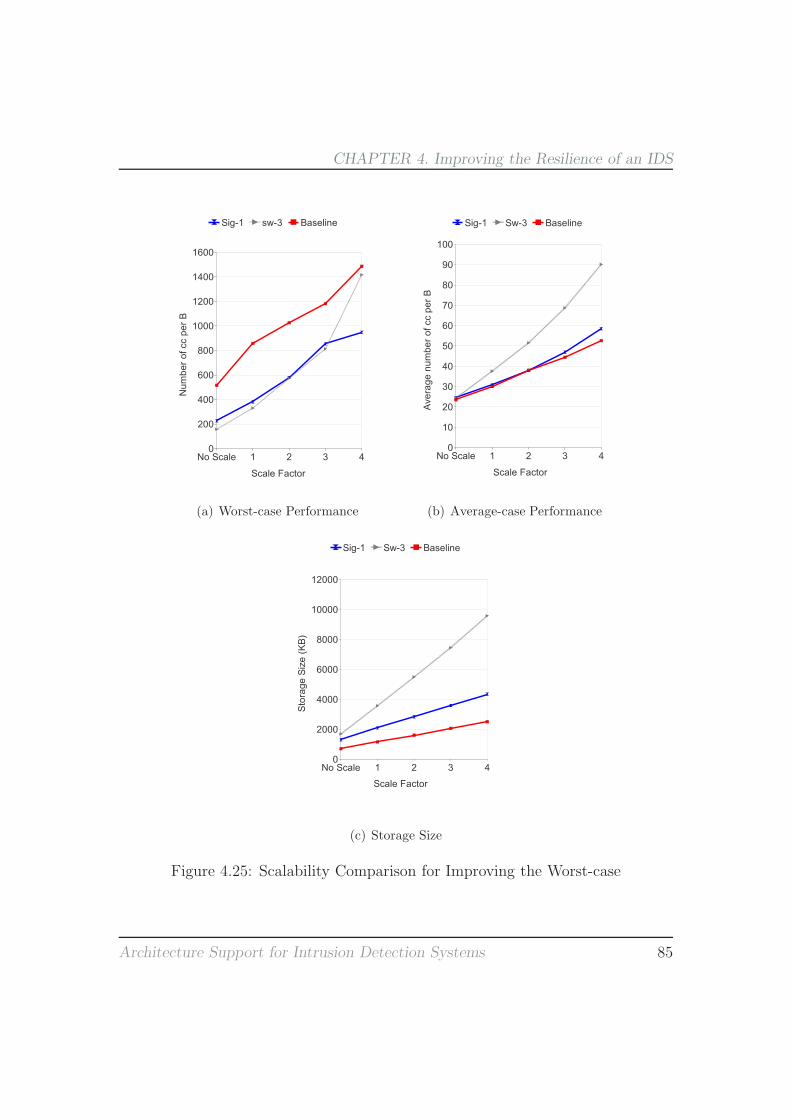
CHAPTER 4. Improving the Resilience of an IDS
(a) Worst-case Performance (b) Average-case Performance
(c) Storage Size
Figure 4.25: Scalability Comparison for Improving the Worst-case
Architecture Support for Intrusion Detection Systems 85

CHAPTER 4. Improving the Resilience of an IDS
Smith et al[55] present algorithmic complexity attacks that exploit syntactics
of rule specification. There are rules in Snort that are dependent on the relative
position of bytes in the packet. They exploited this dependency to create pack-
ets that lead to multiple repeated and often redundant processing of the same
byte. They observed that the performance degrades significantly. They propose a
memoization based technique to prevent such redundant processing of bytes.
Earlier works on FSM for IDS have focused on compacting the FSM and also
on improving the system performance. To compact the FSM, Kumar et al[29] used
a Delayed input DFA (D2FA). A DFA is very similar to the FSM studied in this
work. They observed that a DFA typically has numerous states with identical
outgoing transitions. So they removed this redundancy using a default transition.
This transition is very similar to the failure pointer studied in this paper. So
our proposed architecture and traversal complements the D2FA in improving its
worst-case performance.
Tuck et al[70] studied different optimizations to reduce the size of each node
in the FSM. They used a 256 bit bitmap for each node in the FSM. A bit is set
in the bitmap if the corresponding character is an outgoing edge. They further
compact the FSM using the failure pointer optimization as discussed earlier. So
our proposed traversal and architecture is directly applicable to this work.
Becchi et al[6] propose state merging for reducing the storage space. Two
states are similar if they have multiple common output states. They combine
such states to form a compact FSM. Interestingly, they use the bit mapped based
implementation of Tuck et al (that used failure pointers) for representing states.
So, again, our work directly complements this compact FSM.
86 Architecture Support for Intrusion Detection Systems

CHAPTER 4. Improving the Resilience of an IDS
Song et al[59] propose using a cached DFA (CDFA) for efficient traversal. In a
CDFA, a cached state is used to eliminate 1-step transitions. Among the mecha-
nisms they investigate for compacting the FSM, also includes failure pointer opti-
mization as discussed earlier.
In addition, there have been numerous works that study a rich variety of DoS
attacks. We list a few, a taxonomy of DoS attacks is given in[36].
Moscibroda et al[38] study DoS attacks against DRAM scheduling in multi-
cores. They observe that a malicious application can starve other benign appli-
cations, thus leading to significant performance degradation. They identify the
reason being due to the inherently unfair scheduling policy of the DRAM. So they
propose a memory architecture that provides fairness to all executing applications.
Cai et al[11] study algorithmic complexity attacks against the Unix file system. A
malicious process can trick the operating system to access system files that are not
in its access privileges. They propose a defense mechanism that is provably secure.
Hasan et al[24] study DoS attacks that forcefully heats up certain resources in a
SMT. In this attack, a malicious thread creates a hot spot in a shared resource by
repeatedly accessing it. Since the resource is shared, this can affect all threads in
the chip. They study several mechanisms to mitigate it by selectively throttling
the hot thread.
4.8 Summary and Future Directions
In this chapter, we have presented a counter-measure for an algorithmic complex-
ity attack against the string matching algorithm in an IDS. Our study reveals
Architecture Support for Intrusion Detection Systems 87

CHAPTER 4. Improving the Resilience of an IDS
that with certain input bytes, the algorithm can end up traversing a chain of up-
to 30 pointers. Our results indicate a massive performance degradation, a 22X
fall in comparison to the average case performance. We investigate two mecha-
nisms for countering this performance degradation - hardware-based mechanism
and software-based mechanism.
In the hardware-based mechanism we identify the candidate pointer from the
chain of pointers and directly jump to it. We propose a parallel architecture for
FSM traversal. The signature matching engine identifies the pointer to jump to,
while the FSM engine performs the regular FSM traversal. In the software-based
mechanism, we propose a modified FSM that restricts this chain of sequential
pointer traversal to a fixed upper bound. Both these schemes result in over 3X
improvement in worst-case performance.
A potential applicability of this work is in detecting tampering of the Snort
signature database. If an adversary corrupts the memory stack of the IDS using
buffer overflow attempts, then the pattern matching module can be compromised.
In order to detect such tampering, the hardware-based mechanism needs to be
extended for detecting FSM traversal violations. A potential issue could be the
increased synchronization time required between the FSM traversal and Signature
matching engine.
Algorithmic complexity attack is an example of an evasion attempt, there are
other ways of evasion including packet re-assembly and packet fragmentation. In
both of these attacks, the adversary can force the IDS to maintain an infinite
number of states (TCP connections) that exhausts the memory. Under this cir-
cumstance, even benign packets suffer massively. It will be interesting to study
88 Architecture Support for Intrusion Detection Systems

CHAPTER 4. Improving the Resilience of an IDS
defense mechanisms against such attacks.
Architecture Support for Intrusion Detection Systems 89

5Exploiting Redundancy in Network Traffic
5.1 Introduction
Network-layer applications like packet forwarding are computationally very inten-
sive. At the network-layer, packets can be operated on independently and, hence
packet level parallelism is a unique and common feature among network-layer
applications. This feature is aggressively exploited in network processors with
multi-cores and multiple threads. For example, Intel IXP 2400 has eight cores and
eight threads per cores. Network-layer applications also exhibit temporal locality
in packet headers. This locality is well exploited using application specific caches
like for IP-Lookups and packet classification [5, 12, 39].
While locality in header fields is intuitive and well studied, to the best of our
knowledge there have not been studies on locality in packet payload. In fact, the
first generation of Intel network processor (Intel IXP 2400) only use caches tar-
geted for lookups in packet headers. Recently, however, there have been works [1, 4]
90

CHAPTER 5. Exploiting Redundancy in Network Traffic
investigating temporal locality in the packet payload. They observe significant lo-
cality and use it for efficient data transmission. Temporal locality can also be
viewed as redundancy, and they propose mechanisms to compress the transmis-
sion of these redundant bytes. In contrast, in this work we focus on exploiting
redundancy to accelerate the processing time. The possibility of significant redun-
dancy in payload along with the criticality of pattern matching of payload bytes,
has motivated this work.
This chapter is organized as follows. Section 5.2 discusses possible ways to
characterize the redundancy in the network. We discuss the simulation method-
ology adopted in Section 5.3. Section 5.4 characterizes and reports the payload
redundancy in the traces evaluated. Section 5.5 provides the background to ex-
ploit the payload redundancy. We discuss our proposed redundancy-aware FSM
traversal in Section 5.6. Section 5.7 provides a detailed evaluation of our proposal.
We review the related work in this area, and place our work in the overall context
in Section 5.8. Section 5.9 concludes this chapter.
5.2 Capturing the Redundancy
Redundancy in network traffic is a common and an intuitive characteristic. An
example is when a web page (or any web object) is accessed by multiple users.
Redundancy is not just restricted to web objects, other high-level applications
also display redundancy. For example, multiple data or file transfers between hosts
also contribute to redundancy. These are instances of redundancy at higher-layer
applications, and observed at the end points (hosts). However, the focus of this
Architecture Support for Intrusion Detection Systems 91

CHAPTER 5. Exploiting Redundancy in Network Traffic
work is at the network-layer where the router operates, so we study redundancy
at the packet level granularity.
Redundancy at the packet-level granularity is different from the application
level redundancy. The application level redundancy is a characteristic of the ap-
plication like in web page retrieval. In contrast, at the packet level it maybe due to
different applications. So for example string of bytes may be present in a web-page
and FTP file transfer. So in this work, we initially study the extent of redundancy
present at the network-layer.
The broad approach we use in our study is as follows. We use a redundancy
table to capture the redundant payload bytes. This table is looked-up using a
chunk of payload bytes. If the table look-up is successful, then the payload chunk
that is examined is redundant. Further, the table is continuously updated using
payload bytes.
Network traffic typically contains several giga-bytes of payload. So for a de-
tailed exploration, we use only a subset of the payload bytes in the network traf-
fic. Hence we sample the payload bytes with the following sampling techniques.
Winnowing[51] is a sampling technique that samples based on the content in the
payload. It is also a commonly used technique in network traffic studies[1, 4, 25].
On the other hand, Systematic Sampling samples based on the byte position in
the payload, and is independent of the payload content. Below we provide brief
overview of these techniques.
92 Architecture Support for Intrusion Detection Systems

CHAPTER 5. Exploiting Redundancy in Network Traffic
5.2.1 Winnowing
Winnowing was originally developed to detect plagiarism in documents. So to
detect plagiarism, Winnowing first creates a fingerprint of the document. Finger-
prints are hash values and they can be viewed as encoding the document. Next
these fingerprints are checked with a database of fingerprints, which were again
created from other documents. If the fingerprint matches entries in the database,
then the document is reported to be plagiarized1. The main feature of Winnowing
is that the fingerprints are created in manner that they compactly and efficiently
encode the document.
It is very interesting to note that plagiarism detection involves searching for
redundant set of strings in a document. Additionally, the fingerprint database
is identical to the redundancy table as discussed earlier. So earlier works[1, 4]
have used Winnowing for analyzing the redundancy in network traffic, and also
for string matching in IDS[25].
Figure 5.1 shows the various steps in Winnowing for the payload: s h i a b
c s h i i. Initially the hash values are computed for chunk of payload bytes in
the payload. Note that chunk of payload bytes is the unit of redundancy, and we
term the chunk length as the redundancy length (RL). We have chosen RL = 3
in this example. Afterwards, a minimum hash value is chosen from a window of
hashes. In the example, we have used a window size of 4. The window is a sliding
window, and so it is likely that the same hash value is chosen across multiple
windows (as is the case in the example). The final sampled hash values are the
1False Positives theoretically are present in Winnowing, though [51] reports it in their studiesto be non-existent.
Architecture Support for Intrusion Detection Systems 93

CHAPTER 5. Exploiting Redundancy in Network Traffic
210 201
270 297297 275 201284210 325
a sh cbi hs ii
REDUNDANCY
TABLE
{Bytes} Stat Info {Frequency}
1{ c s h }
{ s h i } 1
VALUES
PACKET
PAYLOAD
HASH
SAMPLED
HASH
VALUES
Figure 5.1: An Example of Winnowing.
fingerprints that encode the payload bytes. These fingerprints are looked-up in the
redundancy table, and since there is no matching entry they are inserted into the
table. In this manner, we winnow the payload bytes to a smaller subset of bytes.
Winnowing provides the following advantages. Since Winnowing selects from
a window of hashes, so it guarantees that a window is represented in the final
fingerprint. This is an important property in plagiarism detection, and Schleimer
et al. [51] refer to it as the local property. Additionally, the minimum hash value
criteria helps Winnowing to reduce the final fingerprint size. This is because the
minimum hash value changes less frequently between adjacent windows, and so
minimum hash value gets carried over across multiple windows. So in the example
considered (refer to Figure 5.1), though there are 5 windows, but only 2 hash
94 Architecture Support for Intrusion Detection Systems

CHAPTER 5. Exploiting Redundancy in Network Traffic
values are selected in the final fingerprint.
5.2.2 Systematic Sampling
Systematic Sampling is a standard statistical sampling technique in the litera-
ture. In this sampling an element at regular intervals. This interval length is the
sampling frequency. We illustrate it more clearly with an example.
Consider the payload: s h i a b c s h i i. Figure 5.2 shows the systematic
sampling of this payload with the sampling interval set to 3. Initially a hash
value is computed over the sampling interval. Further, this hash value is used
to perform a look-up in the redundancy table. If no matching entry exists, then
the redundancy table is subsequently updated. In this example the bytes, s h i,
when encountered the second time are redundant. So it is detected by Systematic
Sampling.
a sh cbi hs ii
REDUNDANCY
TABLE
{Bytes} Stat Info {Frequency}
1
{ s h i } 2
PACKET
PAYLOAD
SAMPLED
HASH
VALUES
{ a b c }
297270297
Figure 5.2: An Example of Systematic Sampling.
Architecture Support for Intrusion Detection Systems 95

CHAPTER 5. Exploiting Redundancy in Network Traffic
In contrast to Winnowing, Systematic Sampling is independent of the content.
The sampling is solely dependent on the byte position in the payload. So the
advantage of Systematic Sampling is that its computational complexity is very
minimal. However, note that Systematic Sampling detects redundancy only when
the redundant bytes are aligned at regular intervals in the payload. If the redun-
dant bytes are not aligned, then it cannot detect the redundancy.
In order to characterize the payload redundancy we have adopted the following
methodology.
5.3 Evaluation Methodology
We use Percentage of Redundancy (PoR) to characterize the redundancy. As
the name implies, PoR is the percentage of redundant bytes captured. For example,
the PoR captured by Systematic Sampling (refer to Figure 5.2) is (3/10) ∗ 100 =
30%, and it is due to s h i bytes. Note that the inherent redundancy present can
be higher than the captured redundancy, as is also the case in this example with
an inherent redundancy of 40%.
5.3.1 Data-Sets
We have used 4 traces in our evaluation. These traces can be classified into a
Honeypot trace and IDS evaluation traces.
We have deployed a low-interaction Honeypot in collaboration with the Leur-
recom project[46]. This Honeypot is in the De-Militarized-Zone (DMZ) of our uni-
versity LAN. An issue with low-interaction honeypots is that there is hardly any
96 Architecture Support for Intrusion Detection Systems
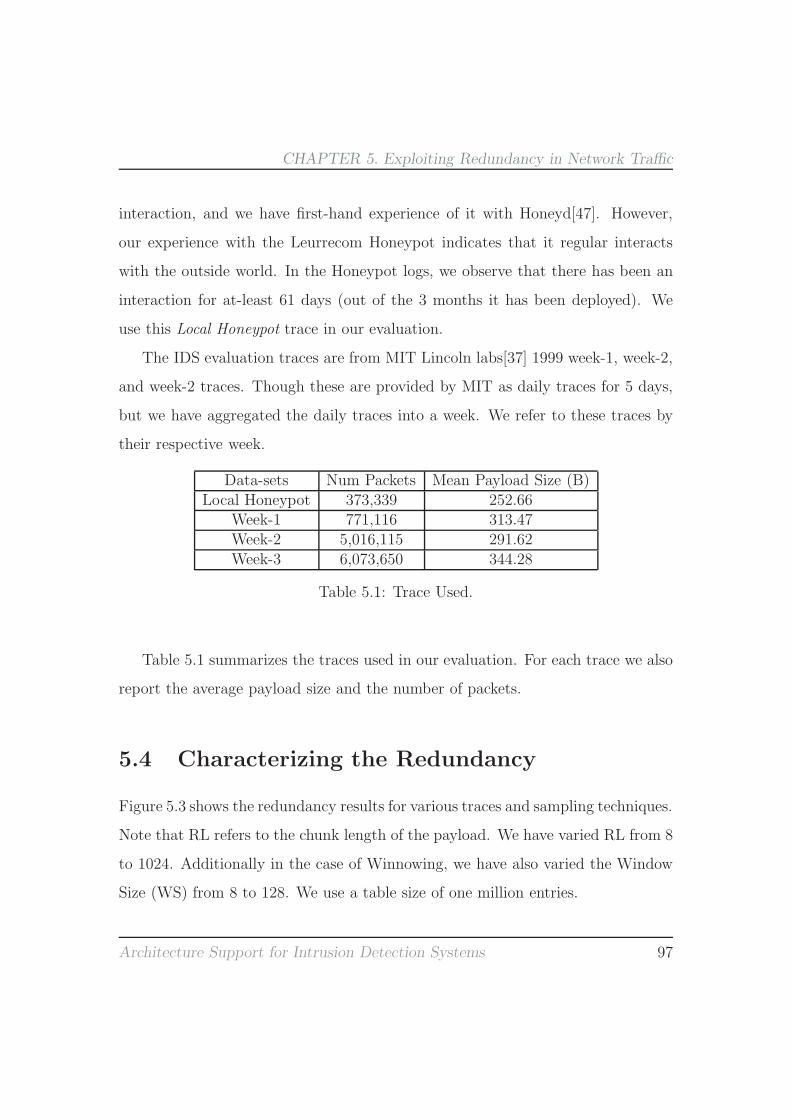
CHAPTER 5. Exploiting Redundancy in Network Traffic
interaction, and we have first-hand experience of it with Honeyd[47]. However,
our experience with the Leurrecom Honeypot indicates that it regular interacts
with the outside world. In the Honeypot logs, we observe that there has been an
interaction for at-least 61 days (out of the 3 months it has been deployed). We
use this Local Honeypot trace in our evaluation.
The IDS evaluation traces are from MIT Lincoln labs[37] 1999 week-1, week-2,
and week-2 traces. Though these are provided by MIT as daily traces for 5 days,
but we have aggregated the daily traces into a week. We refer to these traces by
their respective week.
Data-sets Num Packets Mean Payload Size (B)Local Honeypot 373,339 252.66
Week-1 771,116 313.47Week-2 5,016,115 291.62Week-3 6,073,650 344.28
Table 5.1: Trace Used.
Table 5.1 summarizes the traces used in our evaluation. For each trace we also
report the average payload size and the number of packets.
5.4 Characterizing the Redundancy
Figure 5.3 shows the redundancy results for various traces and sampling techniques.
Note that RL refers to the chunk length of the payload. We have varied RL from 8
to 1024. Additionally in the case of Winnowing, we have also varied the Window
Size (WS) from 8 to 128. We use a table size of one million entries.
Architecture Support for Intrusion Detection Systems 97

CHAPTER 5. Exploiting Redundancy in Network Traffic
0
20
40
60
80
100
8 32 64 128 512 1024
% o
f R
ed
un
da
ncy
RL
Winnowing WS:8 Winnowing WS:16 Winnowing WS:64
Winnowing WS:128 Systematic Sampling
(a) Local Honeypot
0
20
40
60
80
100
8 32 64 128 512 1024
% o
f R
ed
un
da
ncy
RL
Winnowing WS:8 Winnowing WS:16 Winnowing WS:64
Winnowing WS:128 Systematic Sampling
(b) Week-1
0
20
40
60
80
100
8 32 64 128 512 1024
% o
f R
ed
un
da
ncy
RL
Winnowing WS:8 Winnowing WS:16 Winnowing WS:64
Winnowing WS:128 Systematic Sampling
(c) Week-2
0
20
40
60
80
100
8 32 64 128 512 1024
% o
f R
ed
un
da
ncy
RL
Winnowing WS:8 Winnowing WS:16 Winnowing WS:64
Winnowing WS:128 Systematic Sampling
(d) Week-3
Figure 5.3: PoR for Various Traces and for Various Sampling Techniques
98 Architecture Support for Intrusion Detection Systems

CHAPTER 5. Exploiting Redundancy in Network Traffic
We observe that all traces interestingly have moderate to significant redun-
dancy. For example in the Local Honeypot trace, we see that for RL = 8 almost
96% of the payload bytes are redundant. Further in all traces, an increase in RL
has varied impact depending on the sampling technique. While in the case of
Winnowing, an increase in RL captures more redundancy up-to RL = 128. On
the other hand, in Systematic Sampling we observe that the redundancy drops
consistently for increasing RLs. The reason for this varied behaviour is due to
the following. We observe for small RLs (RL ≤ 128) that Winnowing has more
samples (2X) than Systematic Sampling. So Winnowing updates the redundancy
table more frequently, and hence there are more table evictions. So these highly
frequent table evictions leads to the redundancy loss in Winnowing.
Further, we observe in all traces that moderate redundancy is present for RL ≤
128. On increasing RL beyond 128, we observe that the redundancy drops steadily.
Finally, for RL = 1024 the redundancy is negligible. This is also an expected
behaviour that of decreasing redundancy with an increase in RL.
We also observe that Systematic Sampling captures more redundancy than
Winnowing. Additionally, note that the computational complexity in Systematic
Sampling is minimal. So these reasons motivate us to prefer Systematic Sampling
over Winnowing. Figure 5.4 shows the impact of table size on the redundancy.
Here we use Systematic Sampling and RL = 128. We observe that the redundancy
is largely unaffected on using larger table sizes. So this clearly motivates us to use
smaller table sizes. Further, a table with fewer entries also significantly speeds up
the execution time.
Our redundancy results clearly indicates the presence of significant redundancy
Architecture Support for Intrusion Detection Systems 99

CHAPTER 5. Exploiting Redundancy in Network Traffic
0
20
40
60
80
100
120
100000 300000 500000 1e+06
% o
f R
ed
un
da
ncy
RL
Week-1Week-2Week-3
Local Honey
Figure 5.4: Table Size Variation for Various Traces.
in all traces. This motivates us to explore mechanisms to exploit redundancy in the
processing of packet payload. Intrusion Detection Systems (IDS) are an obvious
example of payload processing applications and is the focus of this work. So we
focus on accelerating stages of IDS processing by exploiting the redundancy in
payload.
5.5 Exploiting Redundancy
An IDS detects malicious activities by inspecting packet payload for attack strings.
This can also be viewed as pattern matching of attack strings on payload bytes. As
observed and reported in Chapter 2, the pattern matching module dominates the
execution time in the Snort IDS. So we concentrate on accelerating this module in
100 Architecture Support for Intrusion Detection Systems

CHAPTER 5. Exploiting Redundancy in Network Traffic
the IDS.
9
h s
h
e
h
0
1 2
3 4 5
7
i
s
6
m
8
a
ae
10
d
i
s
Figure 5.5: Example of the Aho-Corasick State Machine.
Snort uses the Aho-Corasick algorithm for pattern matching of attack strings
on the packet payload [2]. Chapter 2 provides the background on pattern matching
in IDS using the Aho-Corasick algorithm, and the various issues associated with it.
To summarize the algorithm, it builds a FSM using attack strings. Next, this FSM
is traversed using bytes from the payload. Figure 5.5 shows the Aho-Corasick FSM
built using the following strings: ha, he, she, his, him shed. For figure clarity,
we only show failure transitions from the second-level (states 3, 4, 5, 9) onwards.
Additionally note that states 3, 6, 7, 8, 9 , and 10 also correspond to string matches
of their respective strings. Once this FSM is built, then it is traversed with bytes
from the payload.
Architecture Support for Intrusion Detection Systems 101

CHAPTER 5. Exploiting Redundancy in Network Traffic
Our aim is to eliminate the redundant processing of datagram bytes. In par-
ticular we attempt to eliminate the FSM traversal due to redundant bytes. We
illustrate this more clearly with an example. Consider the following bytes: s h i a
b c s h i i as input to the FSM in Figure 5.5. Datagram bytes traverse the FSM
from an input state to its output state. Figure 5.6 shows the input and output
states for traversing these bytes.
2 5 4 0 0 0 2 5 4 0
0 2 5 4 0 0 0 2 5 4
s h i a b c s h i iDATAGRAM
STATES
INPUT
BYTES
OUTPUT
STATES
Figure 5.6: FSM Traversal with Datagram Bytes.
We observe in the figure that s h i are redundant bytes and they lead to
redundant FSM traversal. Our goal is to eliminate this redundant processing in
the FSM traversal.
Note that attack strings in IDS are also written as regular expressions. This is
in contrast to fixed strings like in the Aho-Corasick algorithm. In order to traverse
these regular expressions, they need to be converted to Finite Automatas (NFA
or DFA). These automatas are again very similar to the Aho-Corasick FSM. In
fact, the Aho-Corasick FSM can even be viewed as a DFA. We have concentrated
on the Aho-Corasick algorithm since it dominates the execution time in the Snort
IDS. However, it is important to stress that the mechanism we have developed in
102 Architecture Support for Intrusion Detection Systems

CHAPTER 5. Exploiting Redundancy in Network Traffic
this chapter is directly applicable to regular expressions.
The pattern-matching module in Snort operates not on the packet payload,
but on a larger granularity of datagram. This is due to the following reason. The
execution flow of packets in Snort consists of many stages, and pattern matching
is the final stage. In the prior stages to pattern matching, among the many steps
Snort performs also includes packet re-assembly [18]. Re-assembly is needed as
attack strings may be cleverly spread across packets by an adversary to evade an
IDS. So IDSs commonly reassembles a packet and then performs pattern matching
on the reassembled chunk. We term this reassembled chunk of payload used by the
pattern matching module as a datagram. Table 5.2 reports the average datagram
size in the traces used in our evaluation.
Data-sets Avg Datagram(B) Num Datagrams(M)Local Honeypot 197 0.69
Week-1 421 2.04Week-2 433 12.31Week-3 479 22.96
Table 5.2: Datagram Characteristic of Traces.
5.6 Our Contribution
Our goal is to eliminate the redundant FSM traversal arising out of redundant
bytes. In order to do so, we first need to identify the redundant bytes in a data-
gram. Once we identify these redundant bytes, then we can skip past the FSM
traversal. So our proposal consists of the following:
Architecture Support for Intrusion Detection Systems 103

CHAPTER 5. Exploiting Redundancy in Network Traffic
• Dynamically identifying redundant bytes
• Accelerating their processing
We first present a mechanism to dynamically identify redundant bytes.
5.6.1 Redundancy Identification
We skip the redundant FSM traversal using the redundancy table. The redundancy
table is indexed using a chunk of datagram bytes. A chunk of bytes is the unit of
redundancy, and Redundancy Length (RL) is the length of this chunk. RL is
a key design factor and significantly affects the performance. A higher RL results
in larger strides when we traverse the FSM, and this translates into performance
gains. On the contrary, it also capture fewer redundant bytes.
Redundant bytes alone are not sufficient for eliminating redundant processing,
the input state is also important. If the input states are different, then there is no
guarantee in FSM traversal correctness when we skip the intermediate states. So
the table is indexed using a combination of redundant bytes and the input state.
Table entries store the final state of redundant bytes and match states if any.
Figure 5.7 shows an example of the redundancy-aware FSM traversal. In this
example, the FSM built in Figure 5.5 is traversed with datagram bytes. At the
first datagram byte, we look-up the table using the datagram bytes (s h i) and the
initial state (0). Since there is no matching entry, we continue with the regular
FSM traversal of the next byte. The redundancy table is updated subsequently
for this entry: {(s h i), (0)}. Since the FSM traversal of datagram bytes s h i,
leads to the output state 4. Hence we store this output state corresponding to the
104 Architecture Support for Intrusion Detection Systems

CHAPTER 5. Exploiting Redundancy in Network Traffic
s h i a b c s h i i
TABLE
REDUNDANCY
4
0 {(a b c),(4)}
{(s h i),(0)}
OUTPUT
STATES
BYTES
DATAGRAM
LOOK−UP
TABLE
2 5 4 0 0 0 0
O/p States{(Bytes),(i/p States)}
4
Figure 5.7: Redundancy Identification
entry ({(s h i), (0)}) in the table.
The FSM traversal proceeds for the remaining bytes. Note that when the data-
gram bytes s h i are encountered the second time, the table look-up is successful.
The output state (4) is retrieved from the table, and so the intermediate bytes
are skipped. Thus the FSM is traversed with the final byte, i, and with the input
state set to 4. This way we try to eliminate the redundant FSM traversal.
The redundancy table is implemented in software using standard libraries. In
our evaluation we notice that table operations (look-ups and updates) significantly
impact the performance. Hence, table operations i.e., look-ups and updates, are
performed not for every byte but at regular intervals. This is Systematic Sampling
of datagram bytes. We use it due to the benefits observed earlier in Section 5.4.
Architecture Support for Intrusion Detection Systems 105

CHAPTER 5. Exploiting Redundancy in Network Traffic
5.6.2 Accelerating Processing of Redundant Bytes
In our redundancy-aware FSM traversal, table look-ups and updates are performed
in tandem with the regular FSM traversal. So in Figure 5.7, there are three
table look-ups and updates performed along with the FSM traversal. These are
overheads that add to the execution time of the regular FSM traversal. So we
investigate mechanisms to minimize these overheads.
If we examine table operations a bit more closer, we observe the following. The
aim of table updates is to identify and capture redundancy, while table look-ups
exploits redundancy. So only table look-ups are needed with the regular FSM
traversal. We can delay table updates after the FSM traversal.
Further, notice that updating the redundancy table is completely independent
of any IDS processing. So table updates can be performed simultaneously with
other IDS functionalities. This can also be viewed as two parallel threads. The
Snort thread which is also the main thread, performs the regular IDS processing,
while the Redundancy thread identifies and captures redundancy.
We explain briefly the functionalities and interactions of these threads with
an example. Figure 5.8 shows the execution of Snort and Redundancy threads.
When a packet arrives to the system, Snort decodes and reassembles the packet.
These are standard functionalities performed by Snort in order to improve the
effectiveness of IDS. Subsequently, the pattern matching module is called where
the FSM is traversed using the datagram bytes. Note that the redundancy-aware
FSM traversal is performed, with table look-ups at regular intervals. Once pattern
matching is complete for the datagram, a signal is sent to the Redundancy thread.
On receiving this signal, the Redundancy thread starts updating the redundancy
106 Architecture Support for Intrusion Detection Systems

CHAPTER 5. Exploiting Redundancy in Network Traffic
Packet Decode
Other Stages (Reassembly etc)Table Update (Redundancy Identification)
Signal Snort Thread
Wait for Signal (Redundancy Thread)
Pattern Matching with redundancy info
Signal Redundancy Thread
Post Processing (Generate Alerts/Drops)
Wait for Signal (Snort Thread)
Snort Thread Redundancy Thread
Figure 5.8: Thread Functionalities and Interactions
table.
The Snort thread meanwhile continues with its regular functionalities. This
is the post pattern matching phase where action needs to be taken depending on
the pattern matching outcome. Actions are site specific and can include alerting
the system administrator or dropping packets. This completes the processing of a
packet by Snort and it moves to the next packet. In the meantime, the Redundancy
thread may still be updating the redundancy table using the, now, previous packet.
Architecture Support for Intrusion Detection Systems 107

CHAPTER 5. Exploiting Redundancy in Network Traffic
So a packet lag in processing can occur between the two threads.
The two threads need thread synchronization as there are data structures
shared between them. The redundancy table is the obvious example used by
both the threads. The Snort thread uses it for FSM traversal while the Redun-
dancy thread uses it for table updates. These table operations need to be atomic
and hence thread synchronization is needed. So the Snort thread only enters the
pattern matching module, only when the Redundancy thread signals it. The re-
dundancy thread only signals the Snort thread after completing the table update.
Similarly, the reverse also holds w.r.t signaling by the Snort thread.
The Redundancy thread also requires the datagram buffer and output states
for performing table updates. The output state array is generated with the FSM
traversal by the Snort thread. Subsequently, this array is used by the Redundancy
thread. The datagram buffer cannot be shared in a similar manner, as it can result
in sharing violation. Consider the scenario when the Snort thread is reassembling
a packet. So it overwrites the datagram buffer which contained the reassembled
packet. At the same time, the Redundancy thread may be updating the redun-
dancy table with the now previously reassembled packet. So it results in a sharing
violation of the datagram buffer. In order to avoid this scenario, we make the
datagram buffer private for each thread. Hence a copy of the datagram buffer is
created by the Snort thread just before it signals the Redundancy thread.
We have implemented the redundancy table in software using Unordered Maps
of the Boost Library [31]. Boost Unordered Maps have O(1) complexity for ta-
ble look-ups. It is in contrast to C++ Standard STL map which has O(log n)
complexity. This further motivates us to use Boost Unordered maps.
108 Architecture Support for Intrusion Detection Systems

CHAPTER 5. Exploiting Redundancy in Network Traffic
5.7 Results
We have evaluated our proposal and measured the benefit of skipping the redun-
dant processing. We outline the performance metrics used in our evaluation.
5.7.1 Performance Metric
We have used the metric, Percentage of FSM Traversals Skipped, to measure
the redundant processing. It is the number of redundant bytes skipped in the
FSM traversal, and is normalized to the total number of datagram bytes in the
trace. For instance, the Percentage of FSM traversals skipped in Figure 5.7 is
(2/10)*100=20%. The FSM traversal of s h are skipped due to the redundant s
h i bytes.
We have measured the performance as the time taken for the FSM traver-
sal by the pattern matching module. In order to measure it we use the POSIX
clock gettime() [40]. It has a resolution of 1 nano-second. We report the execution
time on a per byte basis. This is obtained by dividing the total execution time by
the total number of datagram bytes. We have compared our redundancy-aware
FSM traversal with that implemented in the Snort Version 2.9.0.5, March 2011
release. For the evaluation, we have used a Fujitsu Notebook running Ubuntu
11.04 (Linux kernel version 2.6.38-11). It is an Intel Core i3 with 4 cores and 4 GB
RAM. Additionally, all configurations are simulated three times and we report the
average of three runs.
Architecture Support for Intrusion Detection Systems 109

CHAPTER 5. Exploiting Redundancy in Network Traffic
0
5
10
15
20
25
30
35
40
8 64 256 512 1024 1280 1664 2048
Clo
ck-C
ycle
s p
er
Byte
RL
Table:40000 Table:80000
Table:120000 Baseline
(a) Week-1
0
5
10
15
20
25
30
35
40
8 64 256 512 1024 1280 1664 2048
Clo
ck-C
ycle
s p
er
Byte
RL
Table:40000 Table:80000
Table:120000 Baseline
(b) Week-2
0
10
20
30
40
50
60
70
80
90
8 64 256 512 1024 1280 1664 2048
Clo
ck-C
ycle
s p
er
Byte
RL
Table:120000 Baseline
(c) Week-3
0
5
10
15
20
25
30
35
40
8 64 256 512 1024 1280 1664 2048
Clo
ck-C
ycle
s p
er
Byte
RL
Table:40000 Table:80000
Table:120000 Baseline
(d) Local Honeypot
Figure 5.9: Execution Time Comparison for Various Traces
5.7.2 Performance Results
Figure 5.9 shows the execution time of the redundancy-aware mechanism for vary-
ing RL and table sizes. The table size has been varied from 40K entries to 120K
entries. In this Figure we also compare the performance of our proposal with the
base Snort implementation (referred to as Baseline).
The execution time results for all traces shows an interesting trend, namely,
110 Architecture Support for Intrusion Detection Systems

CHAPTER 5. Exploiting Redundancy in Network Traffic
0
20
40
60
80
100
8 64 256 512 1024 1280 1664 2048
% F
SM
Tra
ve
rsa
ls S
kip
pe
d
RL
Table:40000 Table:80000
Table:120000
(a) Week-1
0
20
40
60
80
100
8 64 256 512 1024 1280 1664 2048
% F
SM
Tra
ve
rsa
ls S
kip
pe
d
RL
Table:40000 Table:80000
Table:120000
(b) Week-2
0
20
40
60
80
100
8 64 256 512 1024 1280 1664 2048
% F
SM
Tra
ve
rsa
ls S
kip
pe
d
RL
Table:40000 Table:80000
Table:120000
(c) Week-3
0
20
40
60
80
100
8 64 256 512 1024 1280 1664 2048
% F
SM
Tra
ve
rsa
ls S
kip
pe
d
RL
Table:40000 Table:80000
Table:120000
(d) Local Honeypot
Figure 5.10: Redundancy Results for Various Traces
that an increase in RL speeds up the pattern matching. For example in the Week-
1 trace, RL = 8 requires 32.84 cycles per Byte while RL=2048 needs only 10.28
cycles. In all traces, RL = 8 is the most clock consuming configuration. It is also
interesting to note that RL = 8 also captures a very high redundancy (refer to
Figure 5.10). For example in the above considered trace RL = 8 skips 52% of
datagram bytes in the FSM traversal. This very unusual behaviour of a very high
redundancy with a very low performance is due to the overhead in table look-up.
Architecture Support for Intrusion Detection Systems 111
CHAPTER 5. Exploiting Redundancy in Network Traffic
Note that in our redundancy-aware FSM traversal, table look-ups are performed
in addition to the regular FSM traversal.
We investigate the table look-up operation in more detail. Internally the table
look-up in the Boost library is performed in the following manner. Consider the
example in Figure 5.7, when {(s h i),(0)} is encountered the second time. For
a table look-up, first a hash value of {(s h i),(0)} is computed using the in-built
Boost Hash library. Next this hash value is indexed into the table, and since there
is a matching entry, it is retrieved. Further, this entry is checked for hash collisions
(false positives). To do so, {(s h i),(0)} are compared with their equivalents in
the table entry. Since they match, the table look-up is successful. The steps out-
lined above are clearly non-trivial in performance. For example, the hash collision
checking is a memory comparison operation (memcmp in C String Library).
We now study the overhead due to table look-ups. In order to meaningfully
compare the look-up overhead for different RLs, we report it on a per indexed byte
basis. We explain it clearly with an example. Consider the datagram in Figure
5.7 with RL = 3 and RL = 6 and table look-up time of T3 and T6 respectively.
We report the look-up overhead incurred for these RLs as T3/9 (due to 3 look-
ups) and T6/6 respectively. Figure 5.11 shows the look-up overhead for different
RLs. We clearly see that the table look-up overhead is high for low RL values
and the highest for RL=8. Since RL = 8 incurs the maximum overhead, its
performance is relatively the worst. However, it reduces on increasing the RL, so
the table look-up overheads gets amortized with large RL values. We have used
this indirect method of inferring the table look-up overhead due to the following
reason. If a direct break-down of various operations (like table look-up, thread
112 Architecture Support for Intrusion Detection Systems

CHAPTER 5. Exploiting Redundancy in Network Traffic
0
5
10
15
20
25
30
35
40
45
8 64 256 512 1024 1280 1664 2048
Clo
ck-C
ycle
s p
er
Byte
RL
Week-1Week-2Week-3
Local Honeypot
Figure 5.11: Table Look-up Overhead
synchronization etc) in the FSM traversal is attempted, then we observe that the
clocks thus inserted significantly dominate the performance. So it does not provide
a realistic impact of various operations in the FSM traversal.
The table look-up overhead results clearly indicate that larger RLs incur rel-
atively lesser overhead, and so provide better performance. Additionally on an-
alyzing the redundancy results (refer to Figure 5.10), we observe that moderate
to significant redundancy exists at large RLs. For instance in the Week-2 trace,
RL = 1280 skips 46% of the datagram bytes in the FSM traversal. For this trace,
Architecture Support for Intrusion Detection Systems 113

CHAPTER 5. Exploiting Redundancy in Network Traffic
we also observe for 256 ≤ RL ≤ 1280, the redundancy-aware FSM traversal out-
performs the Baseline (refer to Figure 5.9). This performance gain is due to the
large fraction of bytes being skipped with relatively lesser table look-up overhead.
Note that for RL > 1280 very few bytes are skipped of FSM traversal, and so
there is no performance gain. The performance of the Week-1 and Week-3 trace
also shows a similar behaviour as the Week-2 trace. However, note that in case
of the Week-1 trace the redundancy at large RLs is not as significant as Week-2
and Week-3 traces. So the performance improvement in the Week-1 trace is not
as noticeable as the other traces.
In case of the Local Honeypot trace, 64 ≤ RL ≤ 512 outperforms the Base-
line. But for RL > 512, there is a drop in performance due to fewer table
look-ups. This is due to the relatively smaller datagrams in the Local Hon-
eypot trace. For such datagrams, large RLs results in fewer table look-ups,
Numlook−ups = ⌈(Datagram Size−RL+ 1)/RL⌉. So for this trace at RL = 512,
68% of datagram bytes are looked-up. However for RL = 1024 only 14% of data-
gram bytes are looked-up. So large RL values do not provide any performance
benefit for the Local Honeypot trace.
In our results we have also varied the table size from 40K entries to 120K
entries. As can be noticed from the results, there is no significant gain in using
larger sized redundancy table.
Our results can be summarized as follows. The redundancy-aware mechanism
provides performance benefits when moderate to significant redundancy is present
in a trace at large RL values. Furthermore, performance improvement is obtained
when the overhead in the table look-up is not high. So the trace characteristic
114 Architecture Support for Intrusion Detection Systems

CHAPTER 5. Exploiting Redundancy in Network Traffic
governs the redundancy and hence the performance. Hence, we explore a scheme
to dynamically adapt the RL value depending on the trace characteristic.
Dynamic Heuristic
Algorithm 3 Dynamic Algorithm to Set the RL.
1: if Total Num Datagram Bytes mod 107 then2: if PerfCur RL − PerfPrev RL < 1 then3: if RL Increased then4: RL = RL - DEC STRIDE {Perf↑ when RL↓}5: RL Increased = 06: else7: RL = RL + INC STRIDE {Perf↑ when RL↑}8: RL Increased = 19: end if
10: PerfCur RL = PerfPrev RL
11: end if12: else13: if PerfPrev RL − PerfCur RL < 1 then14: if RL Increased then15: RL = RL + INC STRIDE {Perf↑ when RL↑}16: RL Increased = 117: else18: RL = RL - DEC STRIDE {Perf↑ when RL↓}19: RL Increased = 020: end if21: end if22: PerfCur RL = PerfPrev RL
23: end if
Our earlier results indicate that the best performing RL is dependent on the
trace characteristic. For instance, 256 ≤ RL ≤ 512 provides performance gains
in the Local honeypot trace. On the other hand, 256 ≤ RL ≤ 1280 provides
Architecture Support for Intrusion Detection Systems 115

CHAPTER 5. Exploiting Redundancy in Network Traffic
performance improvement for the remaining traces. So the dynamic heuristic must
be able to dynamically identify these RL ranges and set the RL value accordingly.
Algorithm 3 outlines the steps of our proposed dynamic heuristic. The dynamic
heuristic analyzes the performance of the FSM traversal at every 10M datagram
bytes. It compares the performance of the current RL(PerfCur RL) with the pre-
viously set RL(PerfPrev RL). The performance is measured as the average number
of clock-cycles for the FSM traversal of a datagram byte. If the dynamic heuris-
tic observes a performance drop then the RL is accordingly modified. So if at
the last epoch, RL was increased then RL needs to be decreased and vice-versa.
The RL value is also set in a similar manner on a performance gain. In our
evaluation, we have varied the stride for increasing (INC STRIDE) and decreas-
ing (DEC STRIDE) the RL. Our study shows that INC STRIDE = 256 and
DEC STRIDE = 128 provides the best performance. We have also explored the
interval for invoking the dynamic algorithm. We observe that polling at every 107
datagram bytes provides the best performance. The dynamic heuristic is executed
by the Redundancy thread, and the table is also cleared if the RL value is modified.
Figure 5.12 shows the performance of our dynamic heuristic with respect to the
Baseline and the Static scheme. Note that the static scheme uses a fixed RL value
and is identical to the redundancy-aware mechanism previously discussed. Our
results shows that our proposed dynamic heuristic is able to dynamically adapt to
the trace. So in case of Week-2 and Week-3 traces, the dynamic heuristic provides
11% and 16% performance improvement over the baseline respectively. Addition-
ally, the Local Honeypot trace provides 13% performance improvement over the
116 Architecture Support for Intrusion Detection Systems

CHAPTER 5. Exploiting Redundancy in Network Traffic
0
2
4
6
8
10
12
14
64 256 512 1024 1280 1664 2048
Clo
ck-C
ycle
s p
er
Byte
RL
Static Scheme Baseline
Dynamic Heuristic
(a) Week-1
0
2
4
6
8
10
12
14
64 256 512 1024 1280 1664 2048
Clo
ck-C
ycle
s p
er
Byte
RL
Static Scheme Baseline
Dynamic Heuristic
(b) Week-2
0
2
4
6
8
10
12
14
64 256 512 1024 1280 1664 2048
Clo
ck-C
ycle
s p
er
Byte
RL
Static Scheme Baseline
Dynamic Heuristic
(c) Week-3
0
2
4
6
8
10
12
14
64 256 512 1024 1280 1664 2048
Clo
ck-C
ycle
s p
er
Byte
RL
Static Scheme Baseline
Dynamic Heuristic
(d) Local Honeypot
Figure 5.12: Execution Time Comparison for the Dynamic Heuristic
baseline. However, the Week-1 trace shows a mild performance degradation of 5%.
This degradation is due to the relatively lesser redundancy present in the Week-1
trace. The performance gains thus obtained by the dynamic heuristic is due to the
detection of the optimal RL ranges for the traces. Thus for the Local Honeypot
trace, the RL value lies between 256 and 512, and is only changed less than 3 times
in the entire run. A similar behaviour is also observed for the Week traces, with
the RL varying between 256 and 1280.
Architecture Support for Intrusion Detection Systems 117

CHAPTER 5. Exploiting Redundancy in Network Traffic
As mentioned earlier, the redundancy table is implemented using the Unordered
map in the Boost library. The redundancy table can also be implemented as a
specialized logic for accelerating the IDS processing. Earlier works have explored
dedicated hardware logic for accelerating the FSM traversal in an IDS[9, 13, 17, 25,
43, 44, 59, 62, 68, 72]. Thus the table can be viewed as a dedicated redundancy
cache, and the table look-up operations can also be viewed in terms of cache
accesses. The hash computation in our table look-up implementation is equivalent
to indexing the sets of a cache. Further, the memory comparison operation in our
table look-up implementation is a tag comparison operation in a cache. Since a
specialized hardware structure will not incur the software overheads as discussed
earlier. So deploying such a specialized structure will help to even further improve
the performance.
It is very interesting to compare the redundancy present in the datagram (refer
to Figure 5.10) to the redundancy in the packet payload (refer to Figure 5.3). In
the datagram, we observe a moderate to significant redundancy is present even
for large RLs (RL = 1280). However, interestingly the redundancy in the payload
at large RLs is not as significant in comparison. This divergent behaviour is due
to the much bigger size of the datagram. The datagram, which is created after
packet re-assembly, can be up-to 64 KB. In contrast, the maximum payload size
in the Ethernet is 1.4 KB. So in the case of the payload redundancy, fewer packets
are as large as the RL (for large RLs). Thus the payload redundancy consequently
also clearly drops for large RLs. Note also the subtle difference in the datagram
redundancy and payload redundancy. The datagram redundancy is due to the
redundant processing, while the payload redundancy is due to the redundant bytes.
118 Architecture Support for Intrusion Detection Systems

CHAPTER 5. Exploiting Redundancy in Network Traffic
5.8 Related Work
The literature related to this work falls broadly under two categories:
• Temporal locality studies in network traffic
• Performance optimizations in IDS.
We briefly summarize the prior work done in each of these areas.
Redundancy in payload has been studied recently [1, 4]. Anand at al. [4] study
the redundancy in payload in a variety of enterprise traces. They further investi-
gate various sampling techniques for detecting and exploiting redundancy. Their
goal is to maximize bandwidth saving in payload. Similarly Aggarwal et al [1] have
proposed and evaluated a performance efficient sampling technique for bandwidth
saving. In contrast, our work concentrates on eliminating redundant processing
in payload processing applications. Further, we have focussed on datagram bytes
(reassembled packets), while [1, 4] study for packet payloads. So packet sizes are
typically less than 1500 B (in case of Ethernet), while reassembled packets can
be up-to 64 KB. This difference in granularity is also reflected in the redundancy
results, and is very similar to our earlier observation in the previous section.
Redundancy has also been studied and exploited in packet headers. Notably,
packet forwarding (look-ups) exhibits redundancy in destination IP addresses.
So [5, 28, 39] have studied memory architectures for efficient packet look-ups.
Similarly, other packet header fields also exhibit redundancy, and it is exploited in
packet classification [34, 53].
Redundancy in HTTP requests sent to web servers has been extensively stud-
ied. Web caches are as a consequence of this redundancy. There have been several
Architecture Support for Intrusion Detection Systems 119

CHAPTER 5. Exploiting Redundancy in Network Traffic
interesting studies in this area for at-least the last fifteen years. Notably Almeida
et al. [3] comprehensively characterize the redundancy in web requests.
Earlier works on FSM in IDS have either investigated mechanisms to com-
pactly store the FSM, and/or accelerate its traversal. The FSM built using the
base Aho-Corasick algorithm can get very bloated. So Tuck et al [70] propose
using a bitmap structure for states in the FSM. They further investigate various
mechanisms including eliminating failure edges from the FSM. Becchi et al [6] in-
vestigate merging similar states in the FSM. Kumar et al. [29] propose a compact
FSM storage that eliminates failure edges. Randy et al [57] propose various FSM
enhancements for eliminating duplicate states in the FSM.
There have also been works on accelerating the FSM traversal. Brodie et al
[9] propose traversing the FSM with multiple bytes (instead of a byte at a time).
Tan et al [68] have investigated parallelizing the FSM traversal. So they propose
a bit-wise traversal instead of the standard byte-wise traversal. Luchaup et al [33]
speculate the FSM traversal, speculation is used since there are only few unique
states traversed by the FSM. Hua et al. [25] investigate using a variable stride FSM
and so the FSM is also built accordingly. They tune their traversal specifically
for TCAMs. Anirban et al. [35] study clustering regular expressions based on
their popularity. They dynamically build the FSM (DFA) only for frequently used
regular expressions. On the other hand, the remaining regular expressions are
stored as NFAs. Note that NFAs, unlike DFAs, are compact. However, NFAs
incur severe traversal overhead due to their inherent non-determinism.
It is very interesting to note that these techniques either compact the FSM,
and/or accelerate the FSM traversal. In contrast, our redundancy-aware FSM
120 Architecture Support for Intrusion Detection Systems

CHAPTER 5. Exploiting Redundancy in Network Traffic
traversal, identifies and skips the redundant FSM traversal. So it is orthogonal
and complements all these techniques in accelerating the FSM traversal.
5.9 Summary and Future Directions
In this chapter we have investigated the temporal locality of packet payload. We
observe significant locality in all traces analyzed, and so study mechanisms to
exploit it. IDS is an example of payload processing application which is critically
dependent on processing of payload bytes. So we take IDS as a case study to
exploit the temporal locality.
We observe that the string matching module in IDS is the critical module for
performance in Snort IDS. This module inspects packet payload for attack strings
from a database of attack strings. Snort IDS commonly uses the Aho-Corasick
algorithm for string matching, where it builds an FSM from the attack strings.
Subsequently, the FSM is traversed using payload bytes.
We propose a redundancy-aware FSM traversal that dynamically identifies
redundant payload bytes. So it enables us to skip their redundant processing.
We further parallelize our mechanism by performing the redundancy identifica-
tion concurrently with stages in Snort packet processing. We have implemented
our redundancy-aware pattern matching in Snort, and evaluate on an Intel Core
i3. Our performance results indicate that all traces without exception have sig-
nificant redundancy. Unfortunately, the look-up overhead cancels out any gains
thus obtained. But the overhead also get amortized on increasing the redundant
chunk length (RL). An increase in RL also means lesser redundancy. So it is a
Architecture Support for Intrusion Detection Systems 121

CHAPTER 5. Exploiting Redundancy in Network Traffic
performance-redundancy trade-off. We observe performance gain when the look-
up overhead is minimal and for large RLs (RL > 256). We propose a dynamic
heuristic that dynamically modulated the RL depending on the performance. Our
results indicate that the dynamic heuristic provides up-to 16% performance im-
provement over the base Snort FSM traversal.
An extension of this work is to study a redundancy-aware mechanism in the
IPSec algorithms used by VPNs. A potential issue, however, could be the possibil-
ity of compromising the confidentiality/integrity of data. So the redundancy-aware
mechanism will have to take into consideration this potentially sticky issue. A key
insight of our study is the presence of significant redundant processing in all traces.
This points to the possibility of predicting the processing (header or payload) of
packet. Packet processing prediction can be useful during packet bursts, when
congestion may force the router to drop packets.
122 Architecture Support for Intrusion Detection Systems

6Conclusions
System security is a prerequisite for efficient day-to-day transactions. Security can
be provided either at the host-level, or for the entire network. Security at the
network, also referred to as network security, has the advantage of monitoring the
entire network. Firewalls and Intrusion Detection Systems (IDS) are examples
of network security. A firewall inspects the packet header, and depending on
the configured policy, allows or denies network services to the LAN. An IDS, in
contrast, examines the entire packet including the payload, and analyzes for prior
reported attacks. So an IDS like Snort[49] detects attacks by comparing bytes in
a packet with a database of prior reported attacks.
Snort uses the Aho-Corasick algorithm[2] to detect attacks in a packet. This
algorithm functions by first constructing a Finite State Machine (FSM) using the
attack strings. Later bytes in a packet are used to traverse the FSM, and thus
detect an attack. The main advantage in using the Aho-Corasick algorithm is that
it guarantees a linear-time search, and is independent of the number of strings.
The issue, however, lies in devising a practical implementation. The FSM thus
123

CHAPTER 6. Conclusions
constructed gets bloated in terms of storage space. This also affects its performance
efficiency due to the huge memory footprint. Another issue with this algorithm is
the limited scope for parallelism, due to the sequential nature of FSM traversal.
In this work we explore hardware and software techniques to accelerate the
attack detection using the Aho-Corasick algorithm. The first part of the work
focusses on improving the performance and area efficiency of an IDS. We propose
a hybrid and a compact storage for the FSM. It leverages the characteristics of the
attack strings used to build the FSM. We also observe that the root-node in the
FSM is very frequently accessed. So we explore techniques to accelerate accesses to
the root-node. Notable among our contributions, includes a pipelined architecture
that accelerates successive root-node accesses. We further evaluate our proposed
architecture and compare it with the popular BS-FSM based approaches[44, 45,
68]. We observe that Our Proposal significantly reduces the area required to
store the FSM by a factor of 2.2X. Furthermore, the performance results indicate
that Our Proposal outperforms by up-to 73% the BS-FSM based approaches.
In the second part of this work, we study the resilience of an IDS. An adver-
sary can throttle an IDS by crafting performance throttling packets to saturate its
performance. Once the IDS is unable to process packets at the incoming rate, then
it can get disabled to prevent a network breakdown. Such attempts to circumvent
an IDS are broadly referred to as evasion attempts. In this work we study an eva-
sion attempt against the Aho-Corasick algorithm used by an IDS. We observe that
packet bytes, on an average, traverse 1 FSM state. However, we also observe that
there are packet bytes that need to traverse up-to 31 FSM states for the process-
ing of a single byte. The processing of these bytes results in a severe performance
124 Architecture Support for Intrusion Detection Systems

CHAPTER 6. Conclusions
drop, and we observe a 22X performance degradation. We investigate hardware
and software mechanisms to counter this performance drop. Notable among our
contributions includes a parallel architecture that directly identifies the candidate
FSM state to traverse. We evaluate our proposal and observe a 3X performance
improvement in the processing of these performance throttling bytes.
In the final part of this work, we explore techniques to accelerate IDS pro-
cessing by leveraging the network traffic characteristic. Redundancy in the packet
header is well known and well studied over the years. A routing cache is a conse-
quence of this redundancy. However, there has not been any significant study on
redundancy in the payload. In this work, we observe significant redundancy in the
payload bytes in all the evaluated traces. This motivates us to explore mechanisms
to skip their redundant processing. We propose a redundancy-aware FSM traver-
sal that skips the redundant FSM traversal. For this purpose, a redundancy table
is used to identify and capture the redundancy. We further accelerate the redun-
dancy identification by performing it in parallel with the regular IDS processing
by Snort. We have implemented our proposal in Snort, and compared with the
standard Snort FSM traversal. Our results indicate that our redundancy-aware
FSM traversal outperforms by up-to 16% the standard Snort FSM traversal.
6.1 Future Directions
We discuss below a few future directions in the context of this work.
• In our proposed techniques to improve the efficiency of an IDS, we observe
that the root-node is the most frequently accessed node in the FSM. So we
Architecture Support for Intrusion Detection Systems 125

CHAPTER 6. Conclusions
propose a distinct structure for the root-node, and additionally also place
it in an on-chip memory. There exists a possibility of nodes in the FSM
being frequently accessed in selective phases or epochs. Hence, it will be
interesting to study a dynamic heuristic that identifies these hot nodes, and
dynamically places them in an on-chip memory similar to the root-node
memory. An orthogonal study can explore speculation heuristics, based on
the traversal pattern in the FSM, to accelerate the FSM traversal.
• An IDS uses regular expressions to specify attack strings. Regular expres-
sions are converted to Non-Deterministic Finite Automata (NFA) or Deter-
ministic Finite Automata (DFA), and later these automatas are traversed
using the bytes from a packet. Snort uses NFA and a backtracking heuris-
tic to traverse the NFA. Note that in a NFA, multiple states can be active,
and so NFA traversal heuristics are needed for performance efficiency. The
backtracking heuristic is similar1 to failure pointer. A next step could study
heuristics, similar to accelerating the traversal of a failure pointer chain, for
NFA traversal.
• An IDS like Bro[42] dynamically infers the high-level application (like a
HTTP GET request) by examining the application header. So Bro uses
a Dynamic Protocol Detection Heuristic (DPD)[19] to predict the high-level
application. This prediction can be accelerated by augmenting the analysis
with the payload redundancy. Furthermore, Bro dynamically invokes high-
level application analyzers for a packet. These analyzers can be pre-fetched,
1Note that it is similar but not identical
126 Architecture Support for Intrusion Detection Systems

CHAPTER 6. Conclusions
using a redundancy heuristic, to speed up the execution of Bro.
• Intrusion Detection System is an example of a payload processing applica-
tion. There are other payload processing applications like a Virtual Private
Network (VPN). A VPN encrypts a packet using the IPSec algorithm[22] and
transmits it to a remote host. The packet encryption by the IPSec algorithm
can be accelerated by exploiting the redundancy in the payload bytes.
Architecture Support for Intrusion Detection Systems 127

Bibliography
[1] B. Aggarwal, A. Akella, A. Anand, A. Balachandran, P. Chitnis, C. Muthukr-
ishnan, R. Ramjee, and G. Varghese. EndRE: An End-system Redundancy
Elimination Service for Enterprises. In Proceedings of the 7th USENIX Con-
ference on Networked Systems Design and Implementation, 2010.
[2] A. V. Aho and M. J. Corasick. Efficient String Matching: An Aid to Biblio-
graphic Search. Communications of the ACM, 1975.
[3] V. Almeida, A. Bestavros, M. Crovella, and A. D. Oliveira. Characterizing
Reference Locality in the WWW. In Proceedings of the Fourth International
Conference on Parallel and Distributed Information Systems, 1996.
[4] A. Anand, C. Muthukrishnan, A. Akella, and R. Ramjee. Redundancy in
Network Traffic: Findings and Implications. In Proceedings of the 11th In-
ternational Conference on Measurement and Modeling of Computer Systems,
2009.
[5] J.-L. Baer, D. Low, P. Crowley, and N. Sidhwaney. Memory Hierarchy Design
128
Bibliography
for a Multiprocessor Look-up Engine. In Proceedings of the 12th Parallel
Architecture and Compiler Techniques, 2003.
[6] M. Becchi and S. Cadambi. Memory Efficient Regular Expression Search
Using State Merging. In Proceedings of the 26th IEEE Infocom, 2007.
[7] M. Becchi and P. Crowley. An Improved Algorithm to Accelerate Regular
Expression Evaluation. In Proceedings of the 4th ACM/IEEE Symposium on
Architecture for Networking and Communications Systems, 2007.
[8] B. H. Bloom. Space/time Trade-offs in Hash Coding with Allowable Errors.
Communications of the ACM, 1970.
[9] B. C. Brodie, D. E. Taylor, and R. K. Cytron. A Scalable Architecture For
High Throughput Regular-Expression Pattern Matching. In Proceedings of
the 33rd Annual International Symposium on Computer Architecture, 2006.
[10] D. Burger and T. Austin. The Simplescalar Tool-set Version 2.0. Technical
Report 1342. Technical report, Univ Wisconsin at Madison, 1997.
[11] X. Cai, Y. Gui, and R. Johnson. Exploiting Unix File-System Races via
Algorithmic Complexity Attacks. In Proceedings of the 30th IEEE Symposium
on Security and Privacy, 2009.
[12] F. Chang, W. Feng, and K. Li. Approximate Caches for Packet Classifications.
In Proceedings of the 23rd IEEE Infocom, 2004.
[13] C. Clark and D. Schimmel. Scalable Pattern Matching for High Speed Net-
works. In Proceedings of the 12th Annual Symposium on Field Programmable
Custom Computing Machines, 2004.
[14] Defcon Conference. http://defcon.org.
Architecture Support for Intrusion Detection Systems 129

Bibliography
[15] S. A. Crosby and D. S. Wallach. Denial of Service via Algorithmic Com-
plexity Attacks. In Proceedings of the 12th Conference on USENIX Security
Symposium - Volume 12, 2003.
[16] Defcon-8, Capture-the-Flag Game Traces. http://cctf.shmoo.com.
[17] S. Dharmapurikar, P. Krishnamurthy, T. Sproull, and J. Lockwood. Imple-
mentation of a Deep Packet Inspection Circuit using Parallel Bloom Filters
in Reconfigurable Hardware. In Proceedings of the IEEE Hot Interconnects
(HOTi), 2003.
[18] S. Dharmapurikar and V. Paxson. Robust TCP Stream Reassembly in the
Presence of Adversaries. In Proceedings of the 14th Conference on USENIX
Security Symposium, 2005.
[19] H. Dreger, A. Feldmann, M. Mai, V. Paxson, and R. Sommer. Dynamic
Application-layer Protocol Analysis for Network Intrusion Detection. In Pro-
ceedings of the 15th Conference on USENIX Security Symposium, 2006.
[20] J. Edler and M. Hill. Dinero IV Trace-Driven Uniprocessor Cache Simulator.
Technical report, Univ Wisconsin at Madison. http://www.cs.wisc.edu/
~markhill/DineroIV.
[21] Phishing Signatures for ClamAV.
www.clamav.net/doc/latest/phishsigs_howto.pdf.
[22] S. Frankel, K. Kent, R. Lewkowski, A. Orebaugh, R. Ritchey, and S. Sharma.
Guide to IPSec VPNs. NIST Special Publication 800-877 (draft), 2005.
130 Architecture Support for Intrusion Detection Systems

Bibliography
[23] M. Handley, V. Paxson, and C. Kreibich. Network Intrusion Detection: Eva-
sion, Traffic Normalization, and End-to-end Protocol Semantics. In Proceed-
ings of the 10th USENIX Security Symposium, 2001.
[24] J. Hasan, A. Jalote, T. Vijaykumar, and C. Brodley. Heat Stroke: Power-
density-based Denial of Service in SMT. In Proceedings of the 11th High
Performance Computer Architecture, 2005.
[25] N. Hua, H. Song, and T. V. Lakshman. Variable-Stride Multi-Pattern Match-
ing For Scalable Deep Packet Inspection. In Proceedings of the 28th IEEE
Infocom, 2009.
[26] Intel Corporation. Intel IXP 2400 Network Processor Hardware Reference
Manual, Revision 7, 2003.
[27] Internet Assigned Numbers Authority (IANA), TCP/UDP/DCCP/SCTP
Port Number Registry.
http://www.iana.org/assignments/service-names-port-numbers/
service-names-port-numbers.xml.
[28] A. Kumar, L. De Carli, S. J. Kim, M. de Kruijf, K. Sankaralingam, C. Es-
tan, and S. Jha. Design and Implementation of the PLUG Architecture for
Programmable and Efficient Network Lookups. In Proceedings of the 19th In-
ternational Conference on Parallel Architectures and Compilation Techniques,
2010.
[29] S. Kumar, S. Dharmapurikar, F. Yu, P. Crowley, and J. Turner. Algorithms
to Accelerate Multiple Regular Expressions Matching for Deep Packet Inspec-
tion. In SIGCOMM Computer Communication Review, 2006.
Architecture Support for Intrusion Detection Systems 131

Bibliography
[30] W. Lee and S. J. Stolfo. Data Mining Approaches for Intrusion Detection. In
Proceedings of the 7th USENIX Security Symposium, 1998.
[31] Boost C++ Library and Unordered Maps. http://www.boost.org/doc/
libs/1_46_0/doc/html/unordered.html.
[32] C.-H. Lin, Y.-T. Tai, and S.-C. Chang. Optimization of Pattern Matching Al-
gorithm for Memory-based Architecture. In Proceedings of the 3rd ACM/IEEE
Symposium on Architecture for Networking and Communications Systems,
2007.
[33] D. Luchaup, R. Smith, C. Estan, and S. Jha. Multi-byte Regular Expres-
sion Matching with Speculation. In Proceedings of the 12th International
Symposium on Recent Advances in Intrusion Detection, 2009.
[34] Y. Ma, S. Banerjee, S. Lu, and C. Estan. Leveraging Parallelism for Multi-
dimensional Packet Classification on Software Routers. In Proceedings of the
ACM SIGMETRICS International Conference on Measurement and Modeling
of Computer Systems, 2010.
[35] A. Majumder, R. Rastogi, and S. Vanama. Scalable Regular Expression
Matching on Data Streams. In Proceedings of the 2008 ACM SIGMOD In-
ternational Conference on Management of Data, 2008.
[36] J. Mirkovic and P. Reiher. A Taxonomy of DDoS attack and DDoS Defense
Mechanisms. SIGCOMM Computer. Communication Review, 2004.
[37] MIT Lincoln Labs, DARPA Intrusion Detection Evaluation. http://www.
ll.mit.edu/mission/communications/ist/corpora/ideval/.
132 Architecture Support for Intrusion Detection Systems

Bibliography
[38] T. Moscibroda and O. Mutlu. Memory Performance Attacks: Denial of Mem-
ory Service in Multi-core Systems. In Proceedings of the 16th USENIX Security
Symposium on USENIX Security Symposium, 2007.
[39] J. Mudigonda, H. M. Vin, and R. Yavatkar. Overcoming the Memory Wall
in Packet Processing: Hammers or Ladders. In Proceedings of the 2005
ACM/IEEE Symposium on Architecture for Networking and Communication
Systems, 2005.
[40] Clock Gettime Manual Page. http://linux.die.net/man/3/clock_
gettime.
[41] GNU Gprof Manual Page. http://sourceware.org/binutils/docs/
gprof/.
[42] V. Paxson. Bro: A System for Detecting Network Intruders in Real-time. In
Proceedings of the 7th Conference on USENIX Security Symposium - Volume
7, 1998.
[43] P. Piyachon and Y. Luo. Efficient Memory Utilization on Network Processors
for Deep Packet Inspection. In Proceedings of the 2006 ACM/IEEE Sympo-
sium on Architecture for Networking and Communications Systems, 2006.
[44] P. Piyachon and Y. Luo. Compact State Machines for High Performance
Pattern Matching. In Proceedings of the 44th Annual Design Automation
Conference, 2007.
[45] P. Piyachon and Y. Luo. Design of High Performance Pattern Matching
Engine through Compact Deterministic Finite Automata. In Proceedings of
the 45th Annual Design Automation Conference, 2008.
Architecture Support for Intrusion Detection Systems 133

Bibliography
[46] F. Pouget, M. Dacier, and H. Pham. Leurre.com: On the Advantages of
Deploying a Large Scale Distributed Honeypot Platform. E-Crime and Com-
puter Conference, 2005.
[47] N. Provos. Honeyd - A Virtual Honeypot Daemon. In 10th DFN-CERT
Workshop, Hamburg, Germany, 2003.
[48] T. Ptacek and T. Newsham. Insertion, Evasion, and Denial of Service: Elud-
ing Network Intrusion Detection. Technical report, Secure Networks Inc, 1998.
[49] M. Roesch. Snort - Lightweight Intrusion Detection for Networks. In Pro-
ceedings of the 13th USENIX Conference on System Administration, 1999.
[50] J. Rohrer, K. Atasu, J. Lunteren, and C. Hagleitner. Memory Efficient Distri-
bution of Regular Expressions for Fast Deep Packet Inspection. In Proceedings
of the 7th IEEE/ACM International Conference on Hardware/Software Co-
design and System Synthesis, 2009.
[51] S. Schleimer, D. S. Wilkerson, and A. Aiken. Winnowing: Local Algorithms
for Document Fingerprinting. In Proceedings of the 22nd ACM SIGMOD
International Conference on Management of Data, 2003.
[52] R. Sidhu and V. Prasanna. Fast Regular Expression Matching using FPGAs.
In Proceedings of the 9th Annual Symposium on Field Programmable Custom
Computing Machines, 2001.
[53] S. Singh, F. Baboescu, G. Varghese, and J. Wang. Packet Classification using
Multidimensional Cutting. In Proceedings of the 2003 SIGCOMM Confer-
ence on Applications, Technologies, Architectures, and Protocols for Computer
Communications, 2003.
134 Architecture Support for Intrusion Detection Systems
Bibliography
[54] S. Singh, C. Estan, G. Varghese, and S. Savage. Automated Worm Finger-
printing. In In Proceedings of the 6th Conference on Symposium on Operating
Systems Design and Implementation, 2004.
[55] R. Smith, C. Estan, and S. Jha. Backtracking Algorithmic Complexity At-
tacks against a NIDS. In Proceedings of the 22nd Annual Computer Security
Applications Conference, 2006.
[56] R. Smith, C. Estan, and S. Jha. XFA: Faster Signature Matching with Ex-
tended Automata. In Proceedings of the 29th IEEE Symposium on Security
and Privacy, 2008.
[57] R. Smith, C. Estan, S. Jha, and I. Siahaan. Fast Signature Matching Using
Extended Finite Automaton (XFA). In Proceedings of the 29th IEEE Sympo-
sium on Security and Privacy, 2008.
[58] R. Sommer and V. Paxson. Outside the Closed World: On Using Machine
Learning for Network Intrusion Detection. In Proceedings of the 31st IEEE
Symposium on Security and Privacy, 2010.
[59] T. Song, W. Zhang, D. Wang, and Y. Xue. A Memory Efficient Multiple
Pattern Matching Architecture for Network Security. In Proceedings of the
27th IEEE Infocom, 2008.
[60] The Clam Open-source AntiVirus Engine.
http://www.clamav.net.
[61] I. Sourdis, V. Dimopoulos, D. Pnevmatikatos, and S. Vassiliadis. Packet
Pre-filtering for Network Intrusion Detection. In Proceedings of the 2006
Architecture Support for Intrusion Detection Systems 135

Bibliography
ACM/IEEE Symposium on Architecture for Networking and Communications
Systems, 2006.
[62] G. Sreekar Shenoy, J. Tubella, and A. Gonzalez. A Performance and Area
Efficient Architecture for Intrusion Detection Systems. In Proceedings of the
25th IEEE International Conference on Parallel and Distributed Processing
Symposium (IPDPS), 2011.
[63] G. Sreekar Shenoy, J. Tubella, and A. Gonzalez. Exploiting Temporal Lo-
cality in Network Traffic Using Commodity Multi-cores. In International
Symposium on Performance Analysis of Systems and Software (short paper)
ISPASS, 2012.
[64] G. Sreekar Shenoy, J. Tubella, and A. Gonzalez. Hardware/Software Mech-
anisms for Protecting an IDS Against Algorithmic Complexity Attacks. In
International Workshop on Security and Trust of Distributed Networking Sys-
tems (STDN), 2012.
[65] G. Sreekar Shenoy, J. Tubella, and A. Gonzalez. Improving the Performance
Efficiency of an IDS by Exploiting Temporal Locality in Network Traffic.
In Proceedings of the International Symposium on Modeling, Analysis,and
Simulation of Computer and Telecommunication Systems (MASCOTS), 2012.
[66] G. Sreekar Shenoy, J. Tubella, and A. Gonzalez. Improving the Resilience of
an IDS Against Performance Throttling Attacks. In Proceedings of the 8th In-
ternational Conference on Security and Privacy in Communication Networks
(SECURECOMM), 2012.
[67] G. E. Suh, J. W. Lee, D. Zhang, and S. Devadas. Secure Program Execution
136 Architecture Support for Intrusion Detection Systems

Bibliography
via Dynamic Information Flow Tracking. In In Proceedings of the 11th In-
ternational Conference on Architectural Support for Programming Languages
and Operating Systems, 2004.
[68] L. Tan and T. Sherwood. A High Throughput String Matching Architecture
for Intrusion Detection and Prevention. In Proceedings of the 32nd Annual
International Symposium on Computer Architecture, 2005.
[69] T. Thozhiyoor, N. Muralimanohar, J. Ahn, and N. Jouppi. CACTI 5.1. Tech-
nical Report. Technical Report HP-2008-20, HP Labs, 2008.
[70] N. Tuck, T. Sherwood, B. Calder, and G. Varghese. Deterministic Memory-
Efficient String Matching Algorithms for Intrusion Detection. In Proceedings
of the 23rd IEEE Infocom, 2004.
[71] F. Yu, Z. Chen, Y. Diao, T. Lakshman, and R. Katz. Fast and Memory
Efficient Regular Expression Matching for Deep Packet Inspection. In Pro-
ceedings of the 3rd ACM/IEEE Symposium on Architecture for Networking
and Communications Systems, 2006.
[72] F. Yu, R. H. Katz, and T. V. Lakshman. Gigabit Rate Packet Pattern-
Matching Using TCAM. In Proceedings of the 12th IEEE International Con-
ference on Network Protocols, 2004.
[73] T. Zhang, X. Zhuang, S. Pande, and W. Lee. Anomalous Path Detection with
Hardware Support. In Proceedings of the 2005 International Conference on
Compilers, Architectures and Synthesis for Embedded Systems, 2008.
[74] X. Zhuang, T. Zhang, and S. Pande. Using Branch Correlation to Identify
Architecture Support for Intrusion Detection Systems 137

Bibliography
Infeasible Paths for Anomaly Detection. In Proceedings of the 39th Annual
IEEE/ACM International Symposium on Microarchitecture, 2006.
138 Architecture Support for Intrusion Detection Systems