archived: the relationship between … · web viewthe relationship between postsecondary degree...
TRANSCRIPT

Archived Information
New Program Development Strategy
and Supply/Demand Analysis:
The Relationship Between Postsecondary Degree Program
Outcomes and Occupational Needs in Minnesota
Pradeep Kotamraju, Ph.D.
Institutional Planning & Research
Customized Training
Dakota County Technical College
Bruce Steuernagel and Mary Jacquart, Ph.D.
Office of the Chancellor
Minnesota State Colleges and Universities
March 1, 2002
1
This paper was prepared for the Office of Vocational and Adult Education, U.S. Department of Education pursuant to contract no. ED-99-CO-0160. The findings and opinions expressed in this paper do not necessarily reflect the position or policies of the U.S. Department of Education.
1

New Program Development Strategy and Supply/Demand Analysis:The Relationship Between Postsecondary Degree Program
Outcomes and Occupational Needs in Minnesota
Pradeep Kotamraju, Ph.D., Bruce Steuernagel, and Mary Jacquart, Ph.D.
Introduction
Minnesota State Colleges and Universities (MnSCU) is the largest system of higher education in the state, serving 225,000 students annually in credit courses and nearly 95,000 students in non-credit courses. The system includes 7 state universities and 27 community, technical, and consolidated1colleges located on 53 campuses across the state. By virtue of its unique makeup of two- and four-year higher education institutions providing a wide array of occupational and technical education, the liberal arts and general education, MnSCU strives to deliver flexible and responsive education and training to meet the lifelong learning needs of individuals at different stages of their work life.
MnSCU institutions have always been major players when it comes to building the economic vitality of Minnesota regions as well as statewide. Their strategic role in workforce and economic development, however, has come under greater scrutiny whenever evidence appears that points to worker shortages and/or a mismatch between program offerings and workforce needs. Nevertheless, industry need is but one of an ever-increasing number of multiple and conflicting missions that MnSCU institutions are being asked to meet by a variety of stakeholders. Besides personal study and career interests of students and learners, other interests include the traditional goals of wider access to academic and occupational education, contracted and customized training, and workforce and economic development imperatives driven by local, regional, state, and national policy. These competing stakeholder interests have traditionally influenced the way in which MnSCU institutions offer their degree programs. When observing academic program activity at MnSCU institutions, there is an ever-present churn. New courses and programs are continuously introduced, those that have outlived their need are closed, and existing programs are modified as 1
Endnotes? In 1995, when the then separate Technical College System, the Community College System, and the State University System all merged into the MnSCU System, the Minnesota State Legislature mandated the creation of a consolidated two-year college that was made up of a previously independent technical college and a community college. There are currently 11 consolidated colleges within the MnSCU System.
1

campuses attempt to balance internal and external stakeholder interests. This paper addresses only one aspect of this churn how new program development strategies developed by individual MnSCU campuses address the under- or oversupply of graduates in meeting Minnesota’s short-term and long-term occupational need.
1

New Program Development Strategy and Supply/Demand Analysis: The Relationship Between Postsecondary Degree Program Outcomes and Occupational Needs in Minnesota
The paper is divided into five sections. The paper begins by discussing why connecting demographic trends, learner segments, and labor market information become crucial in not only helping to decide which specific new program ideas become fully implemented, but also to assist in balancing the many competing demands for a regional and statewide new program development strategy. The paper then goes on to briefly describe a potentially new program approval process that explicitly considers a supply/demand analysis in the approval of new program ideas solicited from the different MnSCU institutions. While it would have been ideal for this paper to document the impact and outcomes that the use of this labor market information has made, that is not possible at this time, since the new program approval process is still in its pilot stage.2 However, by refining the supply/demand analysis described in Appendix B, a more precise estimate for the potential total number of graduates that enter the labor force and obtain employment is constructed. An estimate for the number of additional graduates that would result from implementing the new program approval process is also estimated. The last two sections provide some preliminary results from the analysis, and some conclusions and implications are drawn about why MnSCU in particular, but all postsecondary institutions in general, must understand the critical way in which labor market information could contribute to successfully mediating the conflicting and competing interests of various stakeholders when it comes to new program development strategies.
What Drives A New Program Development Strategy
Identifying new academic majors and programs to better serve students is the desired outcome of any new program development strategy. This means seeking out new program ideas that would lead to the approval of programs not currently offered,
2 It should be pointed out that the new program approval is not really new in structure (see Appendix B), but its intent is to go beyond simply approving new program ideas. The MnSCU Board of Trustees on July 18, 2001, approved Chancellor James H. McCormick's McCormick’s first-year action plan aimed at building consistent standards of high quality, accountability, collaboration, and service to students. Work began on refining the current program approval process in August 2001, as part of the MnSCU Chancellor’s Strategic Work Plan. One goal (MnSCU Work Plan Goal F1.1) is:
To Develop New Majors And and Programs To to Better Serve Students
The outcome for this goal was to establish an operational plan to encourage responsive MnSCU programmatic development, including intra-system academic programming articulation and collaboration. However, full implementation of the goal requires, for first time in its history, for MnSCU to develop new analytic processes, new program plans, and new program approval procedures with increased intra-system articulation and collaboration. While the goal could be interpreted as just developing a program process, it was ultimately decided to identify new programs as well. This paper uses this list of new programs in the supply/demand analysis, outlined in the next section.
1
1

New Program Development Strategy and Supply/Demand Analysis: The Relationship Between Postsecondary Degree Program Outcomes and Occupational Needs in Minnesota
but for which labor market information indicates that a workforce need exists. There are two elements to any new program development strategy:
The labor market data elements, as identified by the Workforce Information Council, that are particularly valuable include the following:
Labor Market Conditions Data provide information on the overall structure and condition of the labor market, including its demographic composition, trends in employment and unemployment, labor turnover information, and information on labor force dynamics — the movement of people into and out of the labor force.
Industry Data organize employment, wages, and other information by the type of production processes used. Industry data also include information on job creation and destruction and the life cycle of business establishments.
Occupational Data organize employment wages, and other information by the type of work performed and identify the skill requirements and other occupational characteristics of workers and jobs
Labor Market Projections examine labor force, industry, and occupational trends and provide a picture of future employment and job openings based on assumptions about economic growth.
Current Job Vacancies information identifies job openings for which employers are actively seeking workers.
The learner segment data elements, as developed for MnSCU by PricewaterhouseCoopers, which divides the adult (postsecondary) student population into six separate learner segments:
Degree completion, adult learners — students who are seeking to complete a degree program (graduate or undergraduate). They are frequently working adults over age 25.
Corporate learners — students who are seeking education to maintain skills or advance their careers. The education service purchase decision is made by the employer and not by the individual acting alone.
Professional enhancement and life-fulfillment — students who are seeking to advance or shift careers taking credit or non-credit courses. These learners are typically employed.
2
2

New Program Development Strategy and Supply/Demand Analysis: The Relationship Between Postsecondary Degree Program Outcomes and Occupational Needs in Minnesota
College experience learners — students age 18-25 who are preparing for life and career.
Remediation learners — students who need studies as prerequisite for enrollment in another program.
Pre-college learners — students interested in taking college-level work prior to completion of secondary school.
Taken together, labor market and learner segment data elements can:
Help inform decisions made by pre-college and college experience learners at the front end of their work life.
Advise corporate learners looking to upgrade skills to meet changing technological needs.
Help degree completion, adult learners, or professional enhancement and life-fulfillment learners improve skills in order to enhance their employment options.
Guide remedial learners to learn new skills as they seek to enter the labor force for the first time.
What connects the two sets of data elements is demographic information, since population growth and trends influence the pace and distribution of employment and labor force growth. At the same time, how students get placed into the different learner segments depends on demographic information, particularly as it relates to age, ethnicity, and life style.
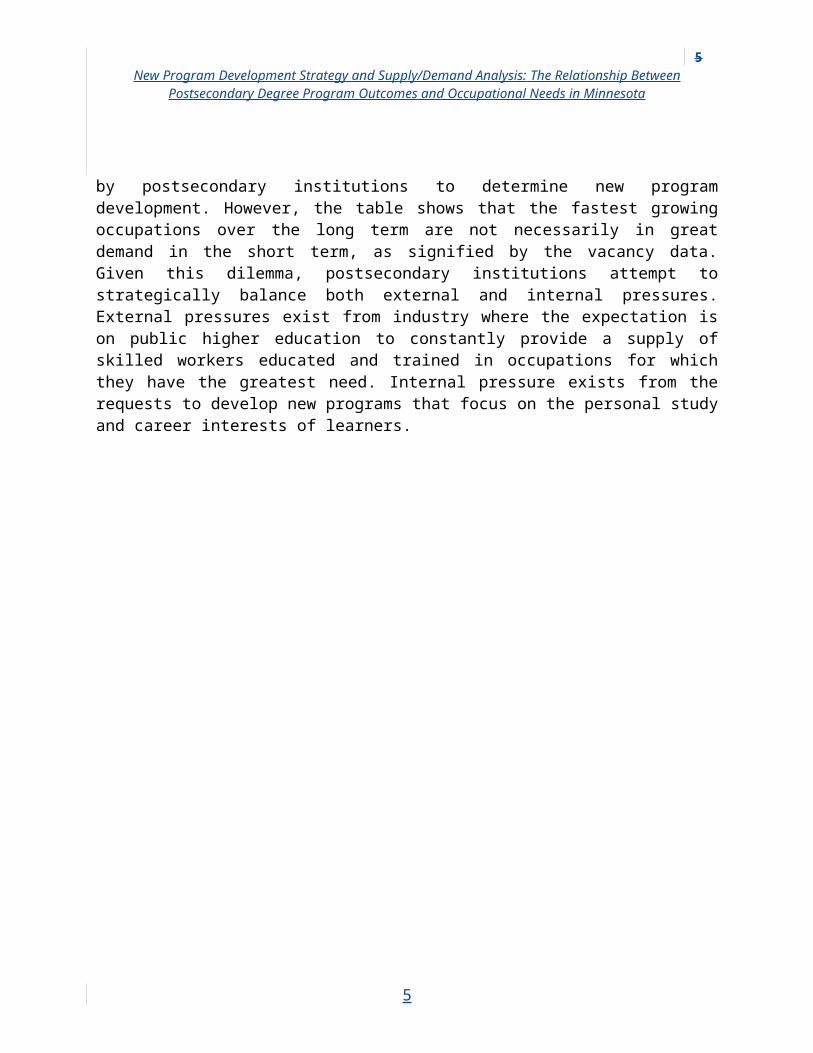
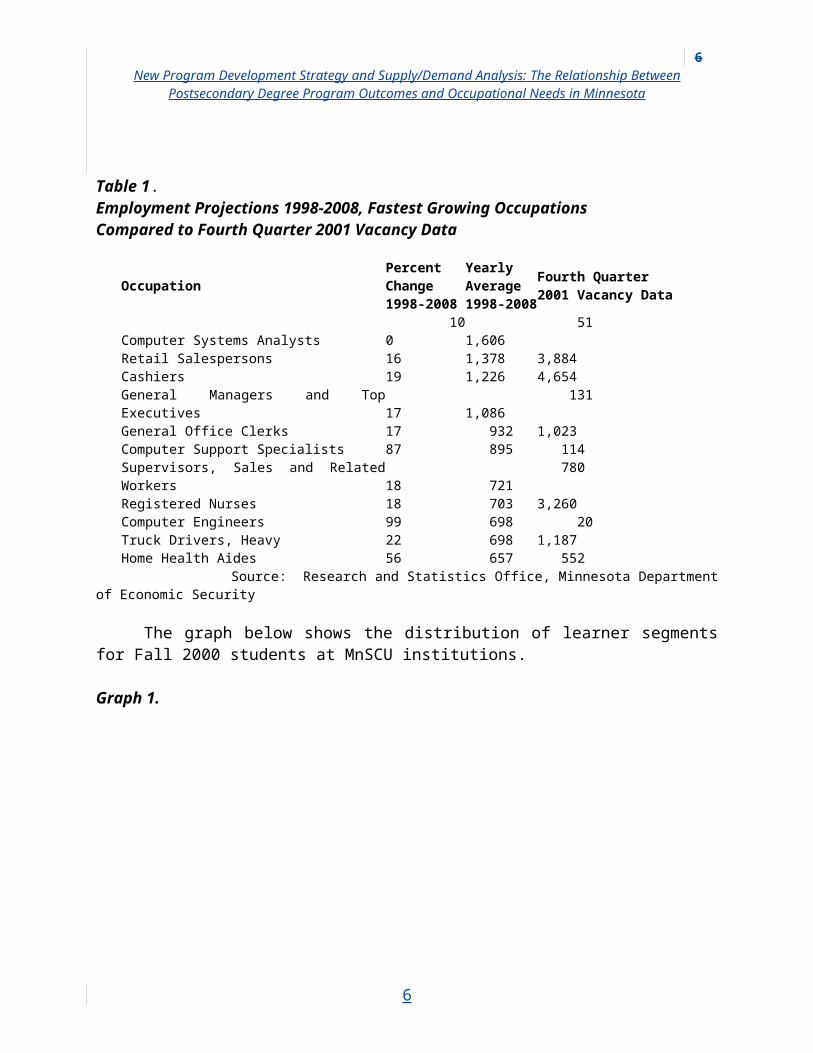
The table below shows two types of labor market information — employment projections and vacancy data — that are often used by postsecondary institutions to determine new program development. However, the table shows that the fastest growing occupations over the long term are not necessarily in great demand in the short term, as signified by the vacancy data. Given this dilemma, postsecondary institutions attempt to strategically balance both external and internal pressures. External pressures exist from industry where the expectation is on public higher education to constantly provide a supply of skilled workers educated and trained in occupations for which they have the greatest need. Internal pressure exists from the requests to develop new programs that focus on the personal study and career interests of learners.
3
3

New Program Development Strategy and Supply/Demand Analysis: The Relationship Between Postsecondary Degree Program Outcomes and Occupational Needs in Minnesota
Table 1.Employment Projections 1998-2008, Fastest Growing OccupationsCompared to Fourth Quarter 2001 Vacancy Data
Source: Research and Statistics Office, Minnesota Department of Economic Security
The graph below shows the distribution of learner segments for Fall 2000 students at MnSCU institutions.
Graph 1.
Source: Research and Planning, MnSCU, Office of the Chancellor, 2001
Information on learner segments can prove valuable to postsecondary institutions as they embark on a new program development strategy. However, more precise information on the learner segment data elements is just now being gathered in the MnSCU Office of the Chancellor. At the present time, only indirect information obtained
4
OccupationPercent Change1998-2008
Yearly Average 1998-2008
Fourth Quarter 2001 Vacancy Data
Computer Systems Analysts 100 1,606 51Retail Salespersons 16 1,378 3,884Cashiers 19 1,226 4,654General Managers and Top Executives 17 1,086 131General Office Clerks 17 932 1,023Computer Support Specialists 87 895 114Supervisors, Sales and Related Workers 18 721 780Registered Nurses 18 703 3,260Computer Engineers 99 698 20Truck Drivers, Heavy 22 698 1,187Home Health Aides 56 657 552
4
New Program Development Strategy and Supply/Demand Analysis: The Relationship Between Postsecondary Degree Program Outcomes and Occupational Needs in Minnesota
from recent census population and other demographic information is available to assess the impact of a new program development strategy on learner segments.
The graphs on the next pages give some important demographic features of Minnesota postsecondary students, which may also be reflective of similar patterns in other states, particularly in the Midwest and Northeast. An understanding of the trends in the population served has important implications for postsecondary institutions and regional economic development strategies. This is especially important when faced with labor shortages in specific occupational areas and changing demographics in the workforce reflect an aging population and/or increased diversity, especially as a result of immigration.
Over the next decade, as illustrated in Graph 2, Minnesota will see significant relative declines in the kindergarten through grade 12 (K-12) (age 5-17) population and the young worker population (age 25-44). These declines will be offset by a strong increase in the (age 18-24) college-going population.
Graph 2.
Source: Demographer’s Office, MN Planning
One out of two Twin Cities Metro MnSCU students, three out of five Greater Minnesota (outside the Twin Cities) two-year college students, and two out of three Greater Minnesota universities are students below age 25. However, MnSCU institutions have a significant proportion of students between the ages of 25 to 34.
5
5
Projected Population Change in Minnesota: 2000 to 2010
-8.4%
16.9%
9.8%
36.2%
12.6%
-12.4%
-2.6%
-20% -10% 0% 10% 20% 30% 40%
Preschool, 0-4
K-12, 5-17
College, 18-24
Young worker, 25-44
Older worker, 45-64
Younger old, 65-79
Older old, 80+
New Program Development Strategy and Supply/Demand Analysis: The Relationship Between Postsecondary Degree Program Outcomes and Occupational Needs in Minnesota
Graph 3.
Research and Planning Office, MnSCU, Office of the Chancellor
Recently released 2000 census data have documented the rapid growth of people of color in Minnesota during the past decade (Graph 4). There have been over 100 percent increases in both the Hispanic and the Asian population in Minnesota.
Graph 4.
6
6
Age of Minnesota Postsecondary Students in Fall 2000
21.8%32.6% 28.5% 24.3%
29.4%
28.4%48.7%
41.6%
25.3%15.3%
13.4%
21.0%
15.5%
8.4%6.0%
12.3%
4.8%8.1% 11.5%3.4%
0%
10%
20%
30%
40%
50%
60%
70%
80%
90%
100%
Metro MnSCU Institutions Greater MN MnSCU Two-Year Colleges
Greater MN MnSCUUniversities
All Other EducationalProviders
19 and Younger 20-24 25-34 35-44 45 and Older

New Program Development Strategy and Supply/Demand Analysis: The Relationship Between Postsecondary Degree Program Outcomes and Occupational Needs in Minnesota
While still predominantly white, over the last ten years or so, the MnSCU student body has become somewhat more diverse, as can be seen in Table 2. This is true for both two-year colleges and four-year state universities.
Table 2.MnSCU Enrollment Profile
The brief overview of the demographic trends in Minnesota, and the underlying learner segments within the MnSCU student body, reveal that, while enrollment at MnSCU institutions will likely grow, its distribution in terms of age, race, study choice, and career goals will be different from the past. More generally, knowing more details about specific learner segments should help MnSCU institutions craft a new program development strategy that takes into consideration student personal interests beyond the usual career interest of finding employment soon after graduation.
New Program Approval Process and New Program Activity
All new program activity has a life cycle. Usually, completion of program development through the approval stage averages about 18 months, but there are wide time variations for various programs. When approved, program ideas become active programs and then continue to be offered for many years. New program ideas come from a wide variety of sources, but one likely source is labor market information. Criteria such as available resources, institution size, program complexity, and community needs are also used to select programs for further development. Program approval begins within an institution. Each institution sets its own internal program approval process. Commonly, advisory committees and department faculty may review a program proposal. Institution-wide curriculum committees and administrative sign-off are also
7
7
Technical and Community Colleges Racial/Ethnic Background Fall 1991 Fall 2000
Number Percent Number Percent Students of Color Total 6,538 7.1% 9,112 11.2% American Indian 1,838 2.0% 1,195 1.5% Asian and Pacific Islander 1,657 1.8% 2,627 3.2% Black 2,157 2.3% 4,017 5.0% Hispanic 886 1.0% 1,273 1.6% White 85,369 92.9% 71,978 88.8% Foreign Students 598 0.7% 1,238 1.5%
State Universities Racial/Ethnic Background Fall 1991 Fall 2000
Number Percent Number Percent Students of Color Total 2,094 3.8% 2,763 6.2% American Indian 425 0.8% 435 1.0% Asian and Pacific Islander 668 1.2% 935 2.1% Black 651 1.2% 911 2.1% Hispanic 350 0.6% 482 1.1% White 53,048 96.2% 41,450 93.8% Foreign Students 1298 2.4% 1,938 4.4%
Source: Minnesota Higher Education Services Office

New Program Development Strategy and Supply/Demand Analysis: The Relationship Between Postsecondary Degree Program Outcomes and Occupational Needs in Minnesota
included in the approval process. Program proposals that have been approved by an institution are then submitted to the Office of the Chancellor. The Academic Program Unit staff in the MnSCU Office of the Chancellor review the program proposals for conformance to criteria set in the current program approval policy and procedure. The new program is then submitted for action to the MnSCU Board of Trustees for approval.3
Upon approval, the institution begins implementation of the new program. Implementation includes marketing, supply and equipment purchases, hiring of faculty, course scheduling, and may include facility renovation. Existing programs, through institution-designed procedures, are continuously reviewed and improved, leading to program expansion and improvement through modification. In fact, some institutions do not separate process of program review from those designed for program improvement. Last but not least, if external (market) and internal (campus) conditions dictate, these review procedures may lead to program reduction, suspension, and finally closure. The charts below provide some indication about overall program activity at MnSCU institutions.
The graphs that follow show program activity by transaction type4, with the breakdown by education clusters and award levels. Program modification dominates, while opening and closing programs is still a relatively small activity. Certificate and master’s level programs comprise a proportionately higher share of new program activity. Colleges respond to internal funding constraints and external workforce demands through the program modification process. More importantly, many of these program modifications or redesigns generally do not require Board action. More to the point, program modifications across different groupings, and over time, seem to suggest that the perception that colleges and universities are unresponsive to changing labor market information is not quite accurate.
Graph 5.
3 Appendix A briefly describes the steps, and the criteria necessary for program approval, as currently laid out by the MnSCU Board of Trustees.4
? Any time an institution is engaged in opening, closing or modifying programs, the activity is referred to as a transaction. In the charts, “OTHER” refers to reinstating, suspending, or relocating programs.
8
8

New Program Development Strategy and Supply/Demand Analysis: The Relationship Between Postsecondary Degree Program Outcomes and Occupational Needs in Minnesota
Source: Academic Program Review and Approval Unit, Office of the Chancellor, MnSCU
1=Agric./Nat. Res; 2=Architecture & Constr.; 3=Manufacturing; Trans., Dist., & Logistics; 5=Info. Tech.; 6=Ret. & Wholesale Sales & Service; 7=Fin. & Ins.; 8=Hosp. & Tourism; 9=Bus. & Admin.; 10=Health Science; 11=Human Service; 12=Arts, A.V. Tech. & Comm.; 13=Law & Public Safety; 14=Sci. Res./Eng.; 15=Ed. & Training; 16=Govt. & Pub. Admin; 17=Interdisciplinary Studies; 18=Humanities; 19=Soc. Sc.; 20=Math & Nat. Sc.
Graph 6.
Source: Academic Program Review and Approval Unit, Office of the Chancellor, MnSCU
Graph 7.
9
9

New Program Development Strategy and Supply/Demand Analysis: The Relationship Between Postsecondary Degree Program Outcomes and Occupational Needs in Minnesota
Source: Academic Program Review and Approval Unit, Office of the Chancellor, MnSCU
10
10
New Program Development Strategy and Supply/Demand Analysis: The Relationship Between Postsecondary Degree Program Outcomes and Occupational Needs in Minnesota
Coordinating the New Program Development Process
As part of the MnSCU Chancellor’s First-Year Work Plan, the new program development process under MnSCU Work Plan Goal F1.1 – New Programs undertook two major activities to identify potential new program ideas. First, a survey of the Chief Academic Officers (CAOs) of the 34 MnSCU institutions was completed to collect new program ideas. The second activity was a supply/demand analysis of occupations typically requiring postsecondary education for six sub-state regions and the state as a whole.5 These two activities complemented each other, in that the CAO survey captured the informal scanning and communication from local employers and students that is often the genesis of new programs. The labor market analysis provided a quantitative reference to help identify gaps in current programs. The shortage/surplus report for the appropriate region was then sent to CAOs of the MnSCU institutions in that region. Conference calls were held on a regional basis to identify and discuss new programs candidates, and to identify lead institution(s) and potential location(s).
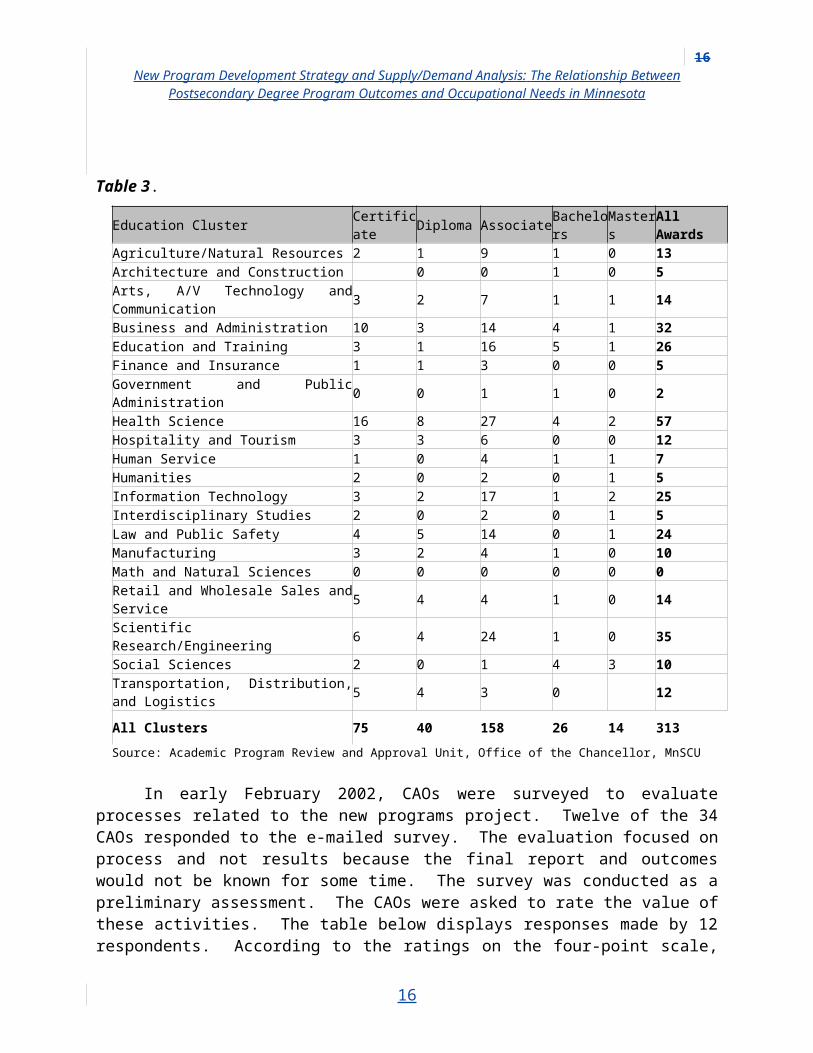
The list of program ideas (a total of 313 programs6) ranged from those where a good deal of work had been done on them to programs in emerging technologies about which little is known at this time. The following table shows the distribution of new program ideas by award levels and education cluster.
Table 3.
5
? The procedure to develop the supply/demand analysis is described in Appendix B. 6
? This number is a conservative estimate since to be included in the estimation for the total number of projected awards resulting from the new program approval process must meet the following criteria: a program (CIP) identification and the award levels at which the program will be offered.
11
Education Cluster Certificate Diploma Associate Bachelors MastersAll Awards
Agriculture/Natural Resources 2 1 9 1 0 13Architecture and Construction 0 0 1 0 5Arts, A/V Technology and Communication 3 2 7 1 1 14
Business and Administration 10 3 14 4 1 32Education and Training 3 1 16 5 1 26Finance and Insurance 1 1 3 0 0 5Government and Public Administration 0 0 1 1 0 2Health Science 16 8 27 4 2 57Hospitality and Tourism 3 3 6 0 0 12Human Service 1 0 4 1 1 7Humanities 2 0 2 0 1 5Information Technology 3 2 17 1 2 25Interdisciplinary Studies 2 0 2 0 1 5Law and Public Safety 4 5 14 0 1 24Manufacturing 3 2 4 1 0 10Math and Natural Sciences 0 0 0 0 0 0Retail and Wholesale Sales and Service 5 4 4 1 0 14Scientific Research/Engineering 6 4 24 1 0 35Social Sciences 2 0 1 4 3 10Transportation, Distribution, and Logistics 5 4 3 0 12
All Clusters 75 40 158 26 14 313
11
New Program Development Strategy and Supply/Demand Analysis: The Relationship Between Postsecondary Degree Program Outcomes and Occupational Needs in Minnesota
Source: Academic Program Review and Approval Unit, Office of the Chancellor, MnSCU
In early February 2002, CAOs were surveyed to evaluate processes related to the new programs project. Twelve of the 34 CAOs responded to the e-mailed survey. The evaluation focused on process and not results because the final report and outcomes would not be known for some time. The survey was conducted as a preliminary assessment. The CAOs were asked to rate the value of these activities. The table below displays responses made by 12 respondents. According to the ratings on the four-point scale, all program-planning activities have some value. Where a rating of 1 is very valuable and a 4 is not valuable, the labor market analysis was deemed the most valuable (1.3) and the survey of CAOs was the least valuable (2.6). Conference calls (2.3) and the follow-up survey (2.3) were moderately valuable.
12
12

New Program Development Strategy and Supply/Demand Analysis: The Relationship Between Postsecondary Degree Program Outcomes and Occupational Needs in Minnesota
Table 4.
Program Planning ActivitiesFor each row, mark an X under one column.VeryValuable1 2 3
Not Valuable4
a. Labor Market Analysis 9 3 0 0
b. CAO New Program Idea Survey (Oct)
2 2 6 1
c. Conference Calls (Nov and Jan)
2 5 5 0
d. Follow-up Survey (Dec) 2 6 3 1
Source: Academic Program Review and Approval Unit, Office of the Chancellor, MnSCU
The fact that 75 percent of the CAOs surveyed indicated that the labor market analysis provided to them was useful is evident, as reflected in the above table. The evaluation also reflected several themes, which indicated the need to
Allow time for in-depth communication and collaboration
Align rewards and reduce barriers and burdens
Improve program planning through better techniques, training, standards, definitions, research, and rules of engagement
Create regions that are flexible so as to align programs with needs of the state.
In addition to meeting the intent of MnSCU Work Plan Goal F1.1 – New Programs, both the conversation with CAOs, and the shortage supply report7 provided some valuable insights into the relationship between labor market outcomes and new program development strategies. First, it was an opportunity talk about the reasons why there were shortages in some of the occupations that were identified. Will starting new programs reduce labor shortages? Were there already programs, but not enough students enrolling or completing? Were employers seeking customized training for incumbent workers rather than academic program graduates to fill the demand? Could more workers be trained if the courses were available on-line? While the analysis presented below does not directly answer these questions and address other caveats,8
it does focus on attempting to estimate a more precise shortage/surplus measure, using
7
? A sample page from one of the reports is shown in Appendix B.8
? Appendix B discusses the limitations of the supply/-demand approach in general.
13
13

New Program Development Strategy and Supply/Demand Analysis: The Relationship Between Postsecondary Degree Program Outcomes and Occupational Needs in Minnesota
different need criteria, and relating them to new program development strategies developed under MnSCU Work Plan Goal F1.1 – New Programs.9
New Program Development Strategy and Supply/Demand Analysis10
To decide whether or not to introduce a new academic program, college faculty and administrators usually review industry and occupational information (demand), demographic information (supply), and emerging economic, business, and social trends (connecting supply to demand). As already indicated in previous sections, while useful in the aggregate, reviewing these sets of information does not provide a precise measure for the average under- and oversupply of graduates in meeting current and future occupational demand. Also, such information provides limited guidance when it comes to introducing new academic programs. The analysis presented below attempts to calculate an estimate of awards for different occupational clusters and for different job zones within the State of Minnesota. Federal and Minnesota sources were used to gather the necessary data on occupational employment projections, vacancies for different occupations, the number of awards granted in different program clusters and by the level of award granted. Additionally, the analysis indicates how new academic program development strategies relate to labor market information. By estimating the number of additional projected awards, a comparison can be made to the estimated surplus/shortage in the labor market.
The basic problem in comparing employment demand information with the supply of graduates is how each is generally presented. Employment projection and vacancy information is given as the total number of jobs that would be required in the future (projections) or the number of openings (vacancy) for a particular occupation.11 On the
9
? The current MnSCU Academic Approval Manual requires colleges and universities to, among other things, show that current and projected job openings significantly exceed the projected number of graduates and the intent of the Chancellor’s Office is to continue using labor market information under MnSCU Work Plan Goal F1.1 – New Programs. 10
? Appendix B outlines the original supply/ demand analysis procedure that was developed in conjunction with MnSCU Work Plan Goal F1.1 – New Programs. Subsequent to that analysis, the procedure, while fundamentally remaining the same, was improved upon by developing a more robust crosswalk by using additional data from 1999 and 2000. The original procedure used data from 1998 only. Also, the analysis in this paper does not attempt to identify shortages or surpluses at a disaggregated level, as in the original. Nevertheless, the limitations pointed in Appendix B still hold. However, the refined analysis makes it easier to overcome those limitations once more data becomes available.
11 Such information can also be presented by industry. However, this paper uses occupations to define demand. The occupations are classified by the Federal Department of Labor Standard Occupational Classification (SOC) codes, which are then grouped into 22 different occupational clusters.
14
14

New Program Development Strategy and Supply/Demand Analysis: The Relationship Between Postsecondary Degree Program Outcomes and Occupational Needs in Minnesota
other hand, the number of awards12 granted determines the supply of graduates.13 In other words, obtaining a direct estimate for the average under- and oversupply of graduates is not possible because supply and demand are presented using separate and noncomparable classification systems. What is needed is a crosswalk that connects the supply of graduates to the demand for workers. Since 1998, MnSCU has been doing an annual graduate follow-up survey that collects, among other things, graduate employment status and job title. The job titles were coded using the Standard Occupational Classification (SOC). The information in this follow-up survey is used to build a crosswalk that connects supply to demand. The crosswalk is then used to establish an estimate for the total number of awards, including those that may arise when new program development strategies are put in place, for each of the four job zones, or for each occupational cluster used in the analysis.14
Given that this paper focuses on those occupations that graduates of existing and new postsecondary academic programs would be expected to enter, demand was limited to job openings in selected occupations in Job Zone 2 and all occupations in Job Zones, 3, 4, and 5.15 A total of 505 SOC occupations were included in the analysis, the SOS occupations were then organized into the 22 occupational clusters. Two estimates for the annual average openings in Minnesota are obtained, one using the Minnesota
12
? Information on the total number of awards granted are is presented at the Classification of Instructional Program (CIP) level, which are then organized as 16 education clusters and a NONE cluster, as identified by the Federal Department of Education. MnSCU has broken the NONE cluster further into four separate clusters to identify the different liberal arts and general education programs, creating a total of 20 education clusters. Within each of these 20 clusters, five types of awards are generally granted —- Certificatescertificates, Diplomasdiplomas, Associate associate Degreesdegrees, Bachelors bachelor’s Degreesdegrees, and Masters master’s Degreesdegrees. The Bachelors bachelor’s Degrees degrees includes post-baccalaureate certificates, and Masters master’s includes post-Masters master’s certificates, First first Professional professional Degreesdegrees, and Doctoratesdoctorates.13
? While the term graduates is often used, particularly in the MnSCU Graduate Follow-up Survey, the focus of the supply estimate developed here is on the number of awards granted for each award level and for each CIP code. To the extent that some students have double majors, and some gather several awards within a specific area of study, the number of graduating students will be less fewer than the number of awards granted. 14
? One could also establish an estimate for total openings for each of the education clusters. However, this would imply that the crosswalk that has been built for the analysis, using only MnSCU data, reflects the program cluster and award level distribution of overall Minnesota employment within an occupational cluster. This is a much stronger assumption, and, without any knowledge of how Minnesota businesses hire graduates that receive different award levels, is much harder to justify. On the other hand, the analysis appears to be on stronger ground using the somewhat weaker assumption that the crosswalk reflects the occupational distribution of total awards in Minnesota within each education cluster. 15
? About half of the occupations in Job Zone 2 (some preparation) were included in the analysis if there existed a current postsecondary program in operation. Examples include drywall installers, fire inspectors, flight attendants, pharmacy technicians, truck drivers, to name a few.
15
15
New Program Development Strategy and Supply/Demand Analysis: The Relationship Between Postsecondary Degree Program Outcomes and Occupational Needs in Minnesota
Department of Security 1998-2008 Projections data,16 and the other using the Minnesota Department of Security Fourth Quarter 2001 Job Vacancy Survey.17 On the one hand, the projections data provide an indication of the long-term need for workers in the specific occupations, and the clusters to which they belong. Using the vacancy data, on the other hand, shows whether an immediate need for workers in particular occupations, and the underlying clusters, exists.
Data on the number of graduates from Minnesota higher education institutions were used as a measure of the supply of graduates. For ease of analysis, the supply estimate was calculated for each of the 20 education clusters (see Note 11) and the four job zones. Next, a three-year average (1998-2000) for the number of awards granted was obtained, one for MnSCU degree programs, and another for non-MnSCU degree programs.18 Summing the two, an overall estimate of the total number of awards in Minnesota is developed for each cluster. Not all students receiving an award join the labor force. Some in this group choose to continue on with their education, others are not available for work, and the status of still others is unknown. Therefore, to estimate the potential supply of graduates in Minnesota for each education cluster, the total awards number was adjusted downwards to more accurately reflect the inclusion of only those graduates who made themselves available for the labor market.
The MnSCU Crosswalk Database, developed specifically for the analysis in this paper, uses information available in the MnSCU Graduate Follow-up Survey.19 Among other things, in the MnSCU Graduate Follow-up Survey, respondents are asked to
16
? This These data uses the older Occupational Employment Statistics (OES) classification and was were re-estimated for each of the SOC Codes codes using the OES-SOC Crosswalk crosswalk developed by the National Crosswalk Center. 17
? Minnesota began collecting vacancy information in fourth quarter, 2000. Another was conducted in the second quarter 2001. A third was collected in fourth quarter 2001. Initially, the methodologies used for each were slightly different. Only recently has the MN Minnesota Department of Economic Security (MDES) readjusted the three vacancy surveys to make them comparable. The question of using data from just one quarter is troublesome. Ideally, one would like an annualized measure, but MDES has conducted vacancies for only the second and fourth quarters. But when using short- term labor market information, particularly for new program development, the tendency appears to use the most recent. Since the purpose of this paper was to contrast long- term need from short- term need measures, when each is compared to projected awards generated from a new program development strategy based on a common ranking system , only the most recent vacancy data was were used.18
? The data source for the MnSCU estimate is the Research and Planning Unit, MnSCU Office of the Chancellor. The Federal Department of Education National Center for Educational Statistics Integrated Postsecondary Education Data System (IPEDS) Peer Analysis Data files is the source for non-MnSCU private and public institutions, including proprietary schools.19
? It is this database that is different from the one developed for the MnSCU Program Goal F1.1 – New Programs (see Appendix B).
16
16

New Program Development Strategy and Supply/Demand Analysis: The Relationship Between Postsecondary Degree Program Outcomes and Occupational Needs in Minnesota
identify the job title in which they are currently employed.20 These job titles are then individually coded into specific six-digit SOC codes. Three years (1998-2000) of the follow-up data have been made available. For all three years combined, approximately 37,000 of the over 55,000 job titles have specific SOC codes. Further, all Job Zone 1 occupations and those Job Zone 2 occupations that did not require a postsecondary education were removed. For each job title, the database identifies a six-digit Classification of Instructional Program (CIP) code (indicating a particular educational program), the associated award with which the respondent graduates, the six-digit SOC Code, and the related job zone where the graduate finds employment.
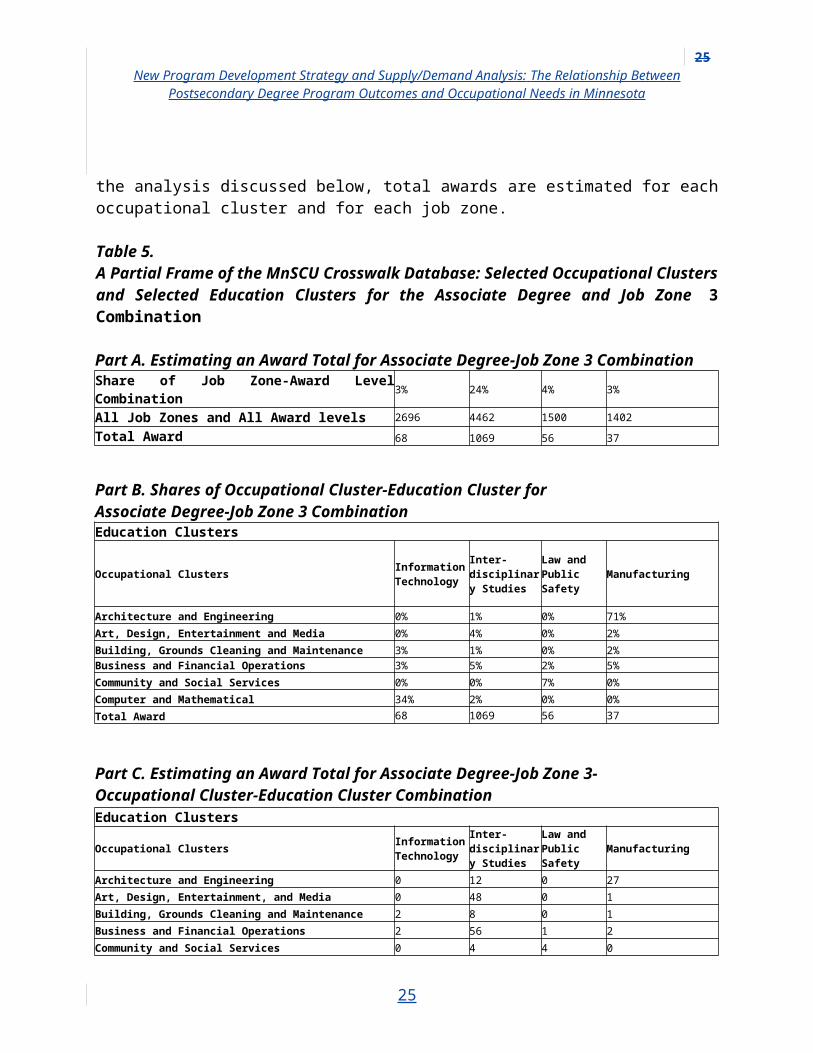
The MnSCU Crosswalk Database is a matrix consisting of 8,800 cells (4 job zones 5 award levels 22 occupational clusters 20 educational clusters). Each cell in the matrix shows, for a specific job zone-award levels combination, the percentage of total graduates within each education cluster who find employment in a particular occupational cluster. The following table, Table 5, shows a very tiny slice (24 of the 8,800 cells) of the matrix. The example presented in the table shows how a single cell in the MnSCU Crosswalk Database is calculated. Using the MnSCU Crosswalk Database, summary information can then be obtained for different groupings, or combinations of groupings, such as occupational clusters, educational clusters, job zones and award levels. For the analysis discussed below, total awards are estimated for each occupational cluster and for each job zone.
Table 5.A Partial Frame of the MnSCU Crosswalk Database: Selected Occupational Clusters and Selected Education Clusters for the Associate Degree and Job Zone 3 Combination
Part A. Estimating an Award Total for Associate Degree-Job Zone 3 CombinationShare of Job Zone-Award Level Combination 3% 24% 4% 3%
All Job Zones and All Award levels 2696 4462 1500 1402
Total Award 68 1069 56 37
Part B. Shares of Occupational Cluster-Education Cluster forAssociate Degree-Job Zone 3 Combination
20
? The MnSCU Graduate Follow-up Survey was collected for the first time in 1998, and follow follow-up surveys for 1999 and 2000 have been completed. Generally speaking, respondents’ employment status, and what work they might be employed in, is usually determined during the year following their individual graduating dates. Since information is collected for an entire cohort (e.g., the Class of 1998 —– graduates receiving degrees anytime between July 1, 1997, to June 30, 1998), the collection period extends through June 30, 1999.
17
17

New Program Development Strategy and Supply/Demand Analysis: The Relationship Between Postsecondary Degree Program Outcomes and Occupational Needs in Minnesota
Education Clusters
Occupational Clusters Information Technology
Inter-disciplinary Studies
Law and Public Safety
Manufacturing
Architecture and Engineering 0% 1% 0% 71%Art, Design, Entertainment and Media 0% 4% 0% 2%Building, Grounds Cleaning and Maintenance 3% 1% 0% 2%Business and Financial Operations 3% 5% 2% 5%Community and Social Services 0% 0% 7% 0%Computer and Mathematical 34% 2% 0% 0%Total Award 68 1069 56 37
Part C. Estimating an Award Total for Associate Degree-Job Zone 3-Occupational Cluster-Education Cluster CombinationEducation Clusters
Occupational Clusters Information Technology
Inter-disciplinary Studies
Law and Public Safety
Manufacturing
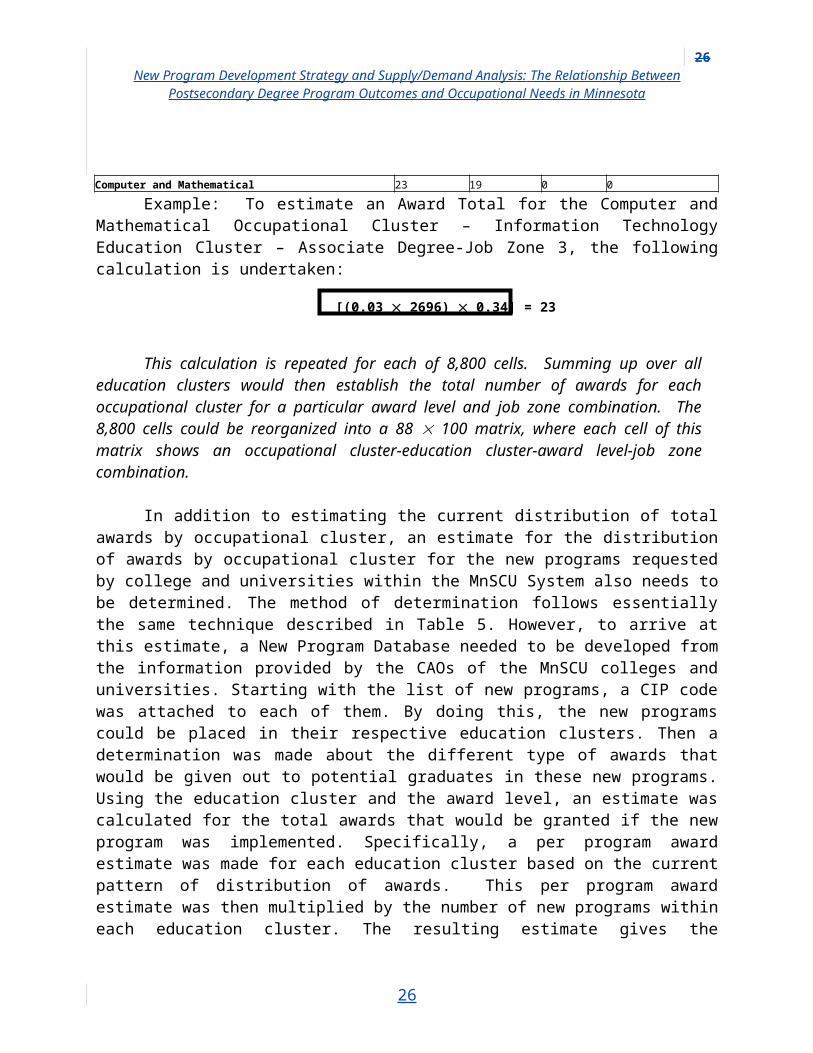
Architecture and Engineering 0 12 0 27Art, Design, Entertainment, and Media 0 48 0 1Building, Grounds Cleaning and Maintenance 2 8 0 1Business and Financial Operations 2 56 1 2Community and Social Services 0 4 4 0Computer and Mathematical 23 19 0 0
Example: To estimate an Award Total for the Computer and Mathematical Occupational Cluster – Information Technology Education Cluster – Associate Degree-Job Zone 3, the following calculation is undertaken:
[(0.03 2696) 0.34] = 23
This calculation is repeated for each of 8,800 cells. Summing up over all education clusters would then establish the total number of awards for each occupational cluster for a particular award level and job zone combination. The 8,800 cells could be reorganized into a 88 100 matrix, where each cell of this matrix shows an occupational cluster-education cluster-award level-job zone combination.
In addition to estimating the current distribution of total awards by occupational cluster, an estimate for the distribution of awards by occupational cluster for the new programs requested by college and universities within the MnSCU System also needs to be determined. The method of determination follows essentially the same technique described in Table 5. However, to arrive at this estimate, a New Program Database needed to be developed from the information provided by the CAOs of the MnSCU colleges and universities. Starting with the list of new programs, a CIP code was
18
18

New Program Development Strategy and Supply/Demand Analysis: The Relationship Between Postsecondary Degree Program Outcomes and Occupational Needs in Minnesota
attached to each of them. By doing this, the new programs could be placed in their respective education clusters. Then a determination was made about the different type of awards that would be given out to potential graduates in these new programs. Using the education cluster and the award level, an estimate was calculated for the total awards that would be granted if the new program was implemented. Specifically, a per program award estimate was made for each education cluster based on the current pattern of distribution of awards. This per program award estimate was then multiplied by the number of new programs within each education cluster. The resulting estimate gives the potential number of additional awards that would be generated as a result of implementing the new program development strategy. Once this estimate was obtained, the technique described in Parts B and C of Table 5 was used to determine the additional awards by occupational cluster and job zone.
The following three measures are estimated:
1. A long-term indicator, using 1998-2008 projections data, is estimated as the difference between total awards and total openings (growth plus replacement); and
2. A short-term indicator, using the vacancy data, is estimated as the difference between total awards and total vacancies.
3. Additional awards resulting from implementing new program development strategies.
A series of summary tables (Appendix C, Tables C1-C6) are generated and from these tables ranking information for the above three measures are derived. The rankings are done for occupational clusters only. It should be noted since the awards data, current and new, are averaged over three years, the supply measure is an average for the three years 1998- 2000. The projections data are an average of the ten-year projection (1998-2008). Finally, the vacancy information is currently collected during only two quarters of the year. The fourth quarter of 2001 reflects the most current labor market conditions.
Results
The purpose of obtaining the shortage/surplus measures is to determine which occupational clusters are in greatest demand and to use that information as one element in developing new academic programs. College faculty and administrators are constantly suggesting the development of new programs. From a macro perspective, there is need to use some uniform way to determine the efficacy of developing new programs. As already indicated, labor market information is generally used unsystematically and often comes from heterogeneous sources. The MnSCU Crosswalk
19
19

New Program Development Strategy and Supply/Demand Analysis: The Relationship Between Postsecondary Degree Program Outcomes and Occupational Needs in Minnesota
Database attempts to provide uniformity and rationality in the new academic program development process, particularly when it comes to the use of labor market information.
Tables C1-C6 in Appendix C summarize the information developed for this analysis. Table C1 shows the average annual shortage/surplus for the years 1998-2000. The table shows that, on average, over the three-year period, the number of graduates being produced by educational institutions in Minnesota is not going to be sufficient to meet long-term occupational demand in Minnesota.21 There are many more occupation clusters that show shortages over the long term. The five occupational clusters (in order) showing the greatest shortages are Production, Management; Sales and Related; Personal Care and Service; and Installation, Maintenance, and Repair. The bottom five (in order) showing the greatest surpluses are Healthcare Practitioners and Technical; Office and Administrative Support; Education, Training, and Library; Community and Social Services; and Protective Services. Table C2 below provides the same information from Table C1, but this time the estimates are shown for different job zones. Other than Job Zone 4, all other job zones show a shortage, indicating long-term need for occupations in those job zones. Even though Job Zone 4 shows a surplus, it is not very large (five percent of average total openings).
Interestingly, when compared to Table C1, Table C3 shows relatively fewer occupational clusters indicating a shortage. The five occupational clusters (in order) showing the greatest shortages are Healthcare Support; Personal Care and Service; Food Preparation and Serving Related; Healthcare Practitioners and Technical; and Transportation and Material Moving. The bottom five (in order) showing the greatest surpluses are Office and Administrative Support; Education, Training, and Library; Computer and Mathematical; Management; and Architecture. Also, overall, there is a surplus of awards. The huge surplus in Job Zone 4 occupations stands out in Table C4. On the other hand, Job Zone 2 shows a significant shortage.
Tables C5 and C6 combine the two aspects that underlie the analysis of this paper — linking new academic program development with the different estimates of under- and oversupply of graduates in Minnesota. Table C5 shows the five occupational clusters (in order) with highest number of projected additional awards are Healthcare Practitioners and Technical; Office and Administrative Support; Protective Services; Education, Training and Library; and Computer and Mathematical. The five occupational clusters (in order) with the least number of additional awards are Farming, Fishing, and Forestry; Building, Grounds Cleaning and Maintenance; Transportation
21
? It should be kept in mind that many students, particularly in two-year institutions, are often incumbent workers seeking to advance themselves in their careers, and who are going to school and working at the same time. A more realistic estimate of the total awards should discount these individuals since, more than likely, even after receiving an award from an educational institution, these individuals will be employed at their place of work, lowering the total number of graduates that will be made available for work, and thereby affecting estimates of the shortage and surplus for a specific occupational cluster.
20
20
New Program Development Strategy and Supply/Demand Analysis: The Relationship Between Postsecondary Degree Program Outcomes and Occupational Needs in Minnesota
and Material Moving; and Life, Physical, and Social Science. However, when observing the rankings of the shortage/surplus indicators, the occupational clusters with the greatest surpluses match up with those occupational clusters that have the highest number of projected additional awards. Table C6 clearly shows that the greatest need, short- or long-term, for new program development appears to be in jobs with some preparation (Job Zone 2) or for jobs with extensive preparation (Job Zone 5). On the other hand, only one-quarter of new program requests are programs that address the needs in these two job zones. Table 6 below presents the different rankings for occupational clusters, ordered by the ranking for new program development. Spearman rank correlations are estimated for these rankings and are presented in Table 7 below.
21
21

New Program Development Strategy and Supply/Demand Analysis: The Relationship Between Postsecondary Degree Program Outcomes and Occupational Needs in Minnesota
Table 6
Source: Table C5
Table 7.
22
Comparing New Program Ranking to Long-Term and Short-Term Need Rankings, 1998-2001 Minnesota
Occupational Cluster New Program Ranking
Long-Term Need Ranking
Short-Term Need Ranking
Healthcare Practitioners and Technical 1 22 4Office and Administration Support 2 21 22Protective Service 3 18 15Education, Training, and Library 4 20 21Computer and Mathematical 5 6 20Business and Financial Operations 6 9 14Management 7 2 19Healthcare Support 8 10 1Installation, Maintenance, and Repair 9 5 13Community and Social Services 10 19 16Sales and Related 11 3 10Architecture and Engineering 12 17 18Production 13 1 6Personal Care and Service 14 4 2Legal 15 14 11Art, Design, Entertainment, and Media 16 16 17Construction and Extraction 17 12 7Food Preparation and Serving Related 18 7 3Life, Physical, and Social Science 19 13 12Transportation and Material Moving 20 8 5Building, Grounds Cleaning and Maintenance 21 11 9Farming, Fishing, and Forestry 22 15 8
22
New Program Development Strategy and Supply/Demand Analysis: The Relationship Between Postsecondary Degree Program Outcomes and Occupational Needs in Minnesota
*Spearman Correlation is significant at the 0.05 level (2-tailed)
Table 6 shows that occupational clusters that show a high relative need are often ones where there have been fewer new program requests. This is true for when new program ranking is compared to the rankings of both short- and long-term need. Also, there appears to be a discrepancy between the short-term and the long-term need rankings. These perceptions are confirmed when one looks at the correlation matrix in Table 7. Interestingly, though, the only statistically significant relationship appears to be between the new program ranking and the short-term need ranking. In addition, while the relationship between short-term and long-term need appears to have the right sign (they are positively related), it is not statistically significant.
Conclusions and Implications
23
Rank Correlation Matrix
New Program Ranking
Long-Term Need Ranking Short-Term Need Ranking
New Program Ranking 1 -0.258 -0.447*
Long-Term Need Ranking -0.258 1 0.327
Short-Term Need Ranking -0.447** 0.327 1
23

New Program Development Strategy and Supply/Demand Analysis: The Relationship Between Postsecondary Degree Program Outcomes and Occupational Needs in Minnesota
Given current patterns of award granting, it appears that Minnesota, at least over the long-term, is unlikely to produce a sufficient number of graduates to meet the needs of the economy. This is true for several occupational clusters and for virtually all levels of preparation. The fact that a significant number of clusters, particularly in job zones with lower levels of preparation, show shortages may indicate the slowness with which educational institutions are adjusting to the realities of the new economy. It might also indicate that there is a slow response to newer learner segments who generally prefer short-term education and training programs and even shorter certification processes. The undersupply of graduates, when looking several years out, may be of concern from an economic development perspective. Once again, it brings to the forefront the oft-quoted refrain that educational institutions are not adequately addressing the workforce needs of the economy.
One could also argue that, given the relationship22 between new program ranking and the long-term need ranking is statistically insignificant, a new program development strategy discounts labor market information based on employment projections and therein lies the problem. When reviewing program activity within MnSCU, however, it becomes apparent that modifications at all award levels are taking place, and colleges and universities are not just focusing in on new program activity. More than likely, individual MnSCU institutions are, on their own, modifying their existing program structure, taking into consideration their local and regional needs and not necessarily statewide needs.23 The workforce development community simply does not hear about these changes within the system the churn of overall program activity. More importantly, the case has to be made that this churn in overall program activity does have a valuable impact on the economic vitality of a region or the entire state.24
22
? When employment projections data is are disaggregated into replacement and new openings, a preliminary analysis by the Minnesota Department of Economic Security (MDES) suggests a strong relationship between replacement openings and the vacancy data, but no significant one between new openings and vacancy data. This being the case, it would imply new program development strategies must pay attention to the non-degree- seeking incumbent worker the corporate learner and the professional enhancement and life-fulfillment learner, who are usually employed and the education service decision is made both by employer and the employee. 23
? Expanding the MnSCU Crosswalk Database to include regions and individual institution information, as well to which college configuration each belongs, will provide more detailed analysis about the relationship between new program activity and labor market information. Also see the discussion on limitations in Appendix B.24
? One possible way would be to link the graduate follow-up data with unemployment insurance (uiUI) wage detail data. Recently, MnSCU has been engaged in a partnership with MDES (the keepers of the wage detail data) to examine the employment success of MnSCU graduates. A preliminary analysis of this linkage has indicated that nearly 75 % percent of MnSCU graduates work in Minnesota immediately upon completing their degree programs. Another possibility would be to have Minnesota become more actively involved in the WRIS project at the US Department of Labor. This would enable to find out information about graduates who have left Minnesota and now work in other states.
24
24
New Program Development Strategy and Supply/Demand Analysis: The Relationship Between Postsecondary Degree Program Outcomes and Occupational Needs in Minnesota
When looking at the very near term, the results of the analysis suggest an overproduction of graduates in several occupational clusters and graduates requiring four-year college degrees (Job Zone 4). This result is reinforced by the statistically significant relationship between new program ranking and the short-term need ranking. The results obtained here may relate more to the current performance of the Minnesota economy, which has seen vacancies for occupations requiring a postsecondary education cut by one-half over a period of 18 months (Summer 2000 to Winter 2001). A real concern that arises is what happens to the backlog of graduates from current program activity and how they might influence a new program development strategy. Coupling this with demographic information, which indicates a reduction in the college worker population, seems to suggest the inclusion of new programs that directly address the retraining of these graduates as they wait out economic downturns, such as the one now taking place.25
It goes without saying that, when the short-term and long-term needs match, (say that the clusters have a top ten ranking on both criteria), the labor market information will simply reinforce any of the other justification for implementing a new program development strategy. This appears to be the case for Healthcare Support, Sales and Related, Production, Personal Care and Service, Food Preparation and Serving Related, and Transportation and Material Moving. Interestingly, though, among these occupational clusters, only Healthcare Support, based on the new program ranking, is in the top ten. On the face of it this may appear surprising and implies the discounting of labor market information by individual colleges and universities. But upon closer examination, local knowledge and experience about initiating, running, and marketing new programs may have had an equally important influence when submitting new program ideas. More specifically, as indicated in the CAO conference calls, lack of student interest (for example, in programs relating to Production), or institutional resource constraints (Transportation and Material Moving, as another example) may have precluded their inclusion on the new program list, even though the labor market need factor dictates otherwise.
It appears that, if the suggested new program ideas are fully implemented, it will have the effect of more or less adding to the surpluses that already exist for some occupational clusters. Some of these clusters have been in great demand until recently (Computer and Mathematical, and Installation, Maintenance, and Repair), but as the industries that would potentially employ these graduates have seen a decline in activity, the demand for workers in these occupations has suffered. Nevertheless, it should be pointed out that the long-term need for these occupations would be high and growing. 25
? The American Association of Community Colleges (AACC) has recently argued that two-year colleges are the “new graduate schools” wherein four-year graduates are returning to acquire technical skills to complement their liberal arts and general education degrees. The AACC estimates that one out of three currently enrolled two-year college students already has a four-year degree.
25
25
New Program Development Strategy and Supply/Demand Analysis: The Relationship Between Postsecondary Degree Program Outcomes and Occupational Needs in Minnesota
To what extent new program development strategies take into account long-term need is still subject to debate. In other words, are tables such Table 1 merely informational or are they much more? In the case of Computers and Mathematical, while long-term need may have been a factor, one suspects that a “bandwagon” effect may have had more to do with starting or modifying programs in Information Technology. Also, in the case of technical programs such as Installation, Maintenance, and Repair, where student interest is at best tenuous, initiating a new program development strategy based on long-term need could prove costly. In either case, intra-system articulation and collaboration must be integral to a new program development strategy if the risks from using long-term labor market information are to be minimized.
When clusters (Health Practitioners and Technical, for example), indicate that the short-term need is high but the shortage over the long term is nonexistent, the new program development requires a modification. Initiating only new programs in this case may prove risky particularly in those areas where resource costs and institutional constraints are considerable. Here the strategy might be to rely more on program modifications and shorter length programs such as a certificates. Additionally, the fact that immediate vacancies exist in these clusters implies that the strategy should include alternative program delivery formats, as non-degree learner segments see an opportunity for career advancement.
For clusters where neither a long-term need nor a short-term need dictates a new program development strategy (for example, Protective Services, and Education, Training, and Library), advocating for more new programs in these clusters might make little sense. However, a new program development strategy may include these clusters if there are strategic reasons for including them, for example the need for heightened security (Protective Services)26 or a strategic interest to expand into areas customarily reserved for only certain segments of higher education system (Education, Training, and Library). In other words, when labor market information does not provide direction for how to move forward on a new program development strategy, alternative justifications must countervail the nonexistent workforce need imperative.
Next Steps and Policy Directions
This paper creates an occupational need measure (shortage/surplus indicators) by connecting postsecondary degree program outcomes (graduation leading to a job) to labor market data elements (employment projections and vacancy information). These occupational need measures (based on a ranking of the shortage/surplus indicators) are then related to an overall new program development strategy for a large publicly funded higher education system (based on a ranking of potential awards resulting from new
26
? Its third position in the new program ranking was probably dictated by response to the events of 9-11-01September 11, 2001.
26
26

New Program Development Strategy and Supply/Demand Analysis: The Relationship Between Postsecondary Degree Program Outcomes and Occupational Needs in Minnesota
programs submitted under a new approval process). The strength and direction of the relationship, together with demographic trends, learner segments, and overall program activity information provide some guidance for what might be elements in a new program development strategy. An implication drawn appears to be that labor market data elements describing the near future are more useful than ones that are more distant. Nevertheless, the analysis in the paper points out the conclusion that while labor market information is definitely a necessary condition, it is not always a sufficient condition in a new program development strategy. Other factors such as current program activity, student interest, and institutional constraints may have an equal bearing, and sometimes more, when campuses begin the approval process for new programs. Last but not least, the workforce need imperative may not always be the driving force behind a new program development strategy.
Much work needs to be done to refine the supply/demand analysis, including populating and benchmarking the MnSCU Crosswalk Database. Other labor market data elements such as wage rates, the relative health of the industries in which the graduates are employed, mobility of the graduate after program completion, and shortage/surplus indicators based on skill rather than employment information should be included. Gathering more direct and precise information on learner segments will help to determine more accurately the true availability of the graduates for work and the specific conditions under which they might be employed. This, in turn, would provide a more precise shortage/surplus indicator that would become more useful as a policy tool.
Once a more robust Crosswalk Database is constructed, the analysis could move in several directions. First, one could compare different program development strategies (based on factors such as e-learning, centers of excellence, and regionalism) using the analysis laid out in this paper. Second, by parsing the Crosswalk into its different sub-elements, a more disaggregated analysis, down to the regional, sub-regional or even at the college level, could be done. Third, gathering more specific data on the occupational distribution of graduates for different types of college configurations (for example, the private two- or four-year colleges) should allow the analysis to mimic more correctly what might be happening out in the workforce. This would also test much more precisely what is only anecdotal at this stage. Fourth, knowing how industry degree requirements for different jobs and clusters of jobs (for example, the proportion of computer jobs in which industry requires the incumbents to have at least a two-year degree) are distributed should allow a comparable analysis using education career clusters instead of occupational clusters. In other words, the shortage/surplus indicators will be developed from a program (education) perspective rather than viewing them in an occupational (labor market) framework. More generally, the subsequent refinements in the Crosswalk Database, and more varied applications of the analysis developed in this paper, should create a more flexible but common policy framework in which educators and labor market analysts both could function.
27
27

Appendix A:Current MnSCU Program Approval Policies and Procedures
Initiating new programs, making changes to existing programs, or suspending existing programs usually starts with the faculty at each institution. The process of approving changes to the curriculum varies from one institution to another depending on the size of the institution, tradition, or the formality and complexity of decision-making structures. In some cases external review boards or advisory boards contribute to curriculum development and change. Generally, a formal institution-wide committee of the faculty then reviews the proposals and makes recommendations. The faculty’s recommendation is then forwarded to the institution’s administration where it receives its final review and, if approved, is submitted to the Board office for review.
The development of program recommendations generally follows a scanning of environmental factors, such as industry and occupational employment, trends in skills required by employers and emerging fields of knowledge. In addition, the strengths and mission of the college or university, and ways to enhance cooperation and collaboration with other colleges and universities and industry partners is considered.
According to the MnSCU Academic Approval Manual, new program applications submitted by institutions must do the following:
1. Demonstrate that the proposed program does not unnecessarily duplicate existing programs
2. Indicate that student interest in the program significantly exceeds the projected number of enrollment openings
3. Show that current and projected job openings significantly exceed the expected number of graduates
4. Reflect the statutory mission of the institution
5. Fall within credit length requirements as set by policy.
Programs that meet these criteria are further reviewed for student interest and occupational demand, resources, external relations, and collaboration. In addition, graduate program applications must undergo two external reviews: a peer review by a colleague in the same discipline, and an internal review by a member of the MnSCU Graduate Council.
Usually, the progress of a proposal toward final approval involves numerous questions, discussions, and negotiations. Proposals are subject to critical editing, and suggestions may be provided before it is submitted to the Board of Trustees. In some cases, proposals may be modified significantly, they may be delayed, contingencies
28
28

may be assigned such as closing the program after a span of time, or the staff and the institution may not reach consensus that the proposal should go forward.
In the past, the development of new programs took place in a somewhat isolated manner — that is, individual institutions assessed the needs of their service area and responded. There is a trend towards regional collaboration as multiple institutions in a region have been consolidated under one president, such as in northeastern Minnesota. Also, the Minnesota Legislature provided impetus for 11 MnSCU institutions located in the Minneapolis-St. Paul region to form the Metro Alliance and develop a master academic plan. The goals of the Metro Alliance are
Program and service alignment
Increased enrollment
Innovative teaching and learning
Facilities planning
Participate in and facilitate regional linkages.
The following flow chart shows the current process.
29
29

An academic program listserv was instituted in December 2001 that has expanded the communication of program intent to all Chief Academic Officers (CAOs). There is now a thirty-day comment period during which concerns can be raised. The institution must address all concerns about the new program before the proposal goes to the Board of Trustees for final approval.
The diagram below illustrates the loose configuration that now exists between the current approval process and the refinements suggested under the MnSCU Chancellor’s Strategic Work Plan. The flow chart above shows four basic paths that a new program could follow to become approved by the Board of Trustees. Path One, following the left-hand boxes, describes the current new program process. Path Two, following the right-hand boxes, describes the new program process envisioned under MnSCU Work Plan Goal F1.1 – New Programs.
Alternatively, program ideas could begin in the MnSCU Goal F1.1 program process but be diverted back into the current monthly program approval process. For example, this could occur for programs determined to be a redesign of an existing program or for programs that need a faster development time line. Lastly, Path Four would allow programs in the current monthly program approval process to be included in the MnSCU Goal F1.1 program process and the biennial budget.
The two program development processes described above each have their advantages. The current program approval process is monthly. This allows institutions to concentrate on local time lines with minimal concern for Board of Trustee approval time lines. Unless there are extenuating circumstances, coordination with Office of the Chancellor staff and Board approval usually takes six to eight weeks. The program development process under MnSCU Work Plan Goal F1.1 – New Programs has distinctly different advantages. Integral to the process is intra-MnSCU collaboration including staffs from the Office of the Chancellor.
30
30

Appendix B:The Supply/Demand Analysis for MnSCU Work Plan Goal F1.1–New Programs
Four databases were created. The first was an occupational demand database. The 1998-2008 Occupational Employment Projections for Minnesota and six sub-state regions produced by the Research and Statistics Office of the Minnesota Department of Economic Security were used. The total job openings figure (growth plus replacement demand) was divided into10 to get average annual (annualized) openings. The occupations are currently coded by Occupational Employment Statistics (OES) code. The OES to Standard Occupational Classification (SOC) crosswalk from the National Crosswalk Center was used to develop annualized openings by SOC code.
The second was a supply database. Data on the number of awards from Minnesota higher education institutions were used. At times the term graduates is used, particularly with the MnSCU Graduate Follow-up Survey. Because an individual can receive more than one award, the Graduate Follow-up Survey focuses on the award—degree, diploma, and certificate — conferred to an individual. The 1998 MnSCU awards by Classification of Instructional Program (CIP) code and institution came from the Research and Planning Unit, MnSCU, Office of the Chancellor. The 1998 IPEDS27
awards by CIP and institution were used for Minnesota private colleges, proprietary schools, and the University of Minnesota. The source was the IPEDS Peer Analysis web site, National Center for Educational Statistics. Minnesota institutions were assigned to one of the six sub-state regions.
Data used in the first two databases are available in all states. The third database is unique and promises to provide valuable information as it is developed in the future. A CIP-SOC database was created from the 1998 MnSCU Graduate Follow-up Survey. About 22,800 of the 28,800 MnSCU graduates responded to the Follow-up Survey. About 18,350 of these respondents reported that they were employed and listed their job title. This title was coded by SOC and was used to create a CIP-SOC crosswalk for each region. The significance of this crosswalk is that it provides information on the new supply of workers in a particular occupation and the connection of instructional program(s) to the occupation. There has been a national CIP-OES crosswalk for some time, but having a crosswalk based on actual Minnesota data marks a noteworthy improvement in understanding the occupational outcomes of instructional programs.
The Research and Planning Unit, MnSCU, Office of the Chancellor, compiles the MnSCU Graduate Follow-up Survey. The Research and Planning Unit staff did
27
? Integrated Postsecondary Education Data System (IPEDS) is a national reporting system managed through the U.S. Department of Education, National Center for Education Statistics.
31
31

occupation coding of 1998 graduates. Coding of the job titles is still in progress. A database of job titles with SOC codes is being built to automate the coding process.
32
32

Other Resources: As identified by the Federal Department of Labor O*NET project, occupations were classified into five job zones (1-5), in which each indicates the minimum occupational entry in terms of the levels of preparation, going from little or no preparation to extensive preparation (For a description of the job zones, please see http://online.onetcenter.org/)
The five Job Zones are for occupations that need
Job Zone 1 - Little or no preparation
Job Zone 2 - Some preparation
Job Zone 3 - Medium preparation
Job Zone 4 - Considerable preparation
Job Zone 5 - Extensive preparation.
Labor demand was limited to job openings in selected occupations in Job Zone 2 and all occupations in Job Zones 3, 4, and 5. This was done to focus the analysis on those occupations that graduates of existing and new postsecondary education academic programs would be expected to enter.
About half of the occupations in Job Zone 2 were included in the analysis. Information from the Statewide Job Vacancy Survey collected from Minnesota employers gave an indication of the educational requirements for the job openings by SOC code. In addition, some Job Zone 2 occupations were included if there was currently a postsecondary program in operation. The following gives a brief description of Job Zone 2 occupations.
Job Zone 2 (Some Preparation): Examples: These occupations often involve using your knowledge and skills to help others. Examples include drywall installers, fire inspectors, flight attendants, pharmacy technicians, salespersons (retail), and tellers. The specific vocational preparation range is between 4.0 and 6.0. These occupations usually require a high school diploma and may require some vocational training or job-related course work. In some cases, an associate or bachelor’s degree could be needed. Similarly, on the supply side, we included graduates only if they were employed in an occupation that was coded in the selected Job Zone 2 or higher.
Initially, the framework for the supply/demand analysis was to be US Department of Education Career Cluster Framework. The advantage was to be able to present supply/demand relationships in a more aggregated way. While this approach still deserves additional development, the supply/demand data were presented on a more detailed occupational level for two reasons. The more detailed occupational level offered the most direct way to evaluate whether or not a new program should be considered. Second, the career cluster crosswalk was not as clearly defined as was
33
33
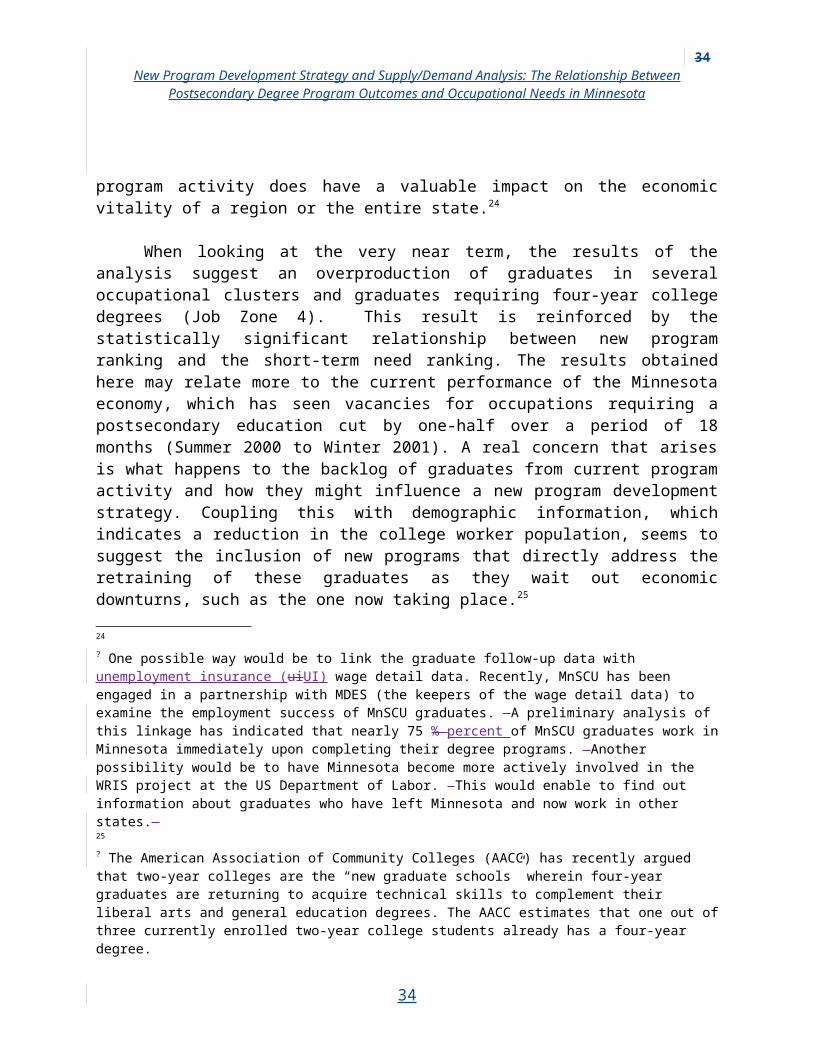
needed. Some occupations did not clearly fit into a single cluster and some programs, such as liberal arts, were not included in a cluster. However, the further development of career clusters and skill standards should make linkage to labor market data more valuable.
The purpose of the supply-demand comparison is to assist institutions to identify program gaps. The gap, or shortage, was determined by comparing the projected annual number of job openings for an occupation in a region to the number of graduates who found employment in that occupation following the completion of an instructional program. An occupation was identified as a shortage occupation when the comparison of supply and demand for the detailed occupation (at a six-digit SOC code level) showed that there was a shortage of 40 or more workers. It should be noted here that the accuracy of the regional supply figures is limited because it does not take into account geographic mobility. An assumption is made that the graduate is employed in the same region that the institution is located. Accuracy of supply data should be improved in the future because we are now able to link the graduate data to the employer location through the Unemployment Insurance Wage Detail File. Other benefits of this data linkage will be the understanding of which regional industries hire program graduates and the wage levels at which they are hired.
SOC codes for occupations related to the new program ideas submitted by the Chief Academic Officers were also identified. The supply/demand data were included for those SOC codes, even if the shortage was less than 40. In some cases, no supply/demand data were available because the program is for a new or emerging occupation or it was not yet possible to identify the program or occupational outcome with enough specificity.
The following limitations on the accuracy of both the demand and supply data need to be acknowledged:
Average annual openings data will overstate or understate the actual labor market demand. While the ten-year projections take business cycles into account, in any given year the demand will probably be stronger or weaker than average. In 1998, for example, demand for labor was quite strong and by 2000 labor demand was weak.
Occupational projections are less accurate for more detailed occupations that have small employment levels and for more specific geographic regions than for occupations with substantial employment or for the state as a whole.
Demand reflects openings in Minnesota only. There may be strong demand for labor in a community from a neighboring state where employers hire Minnesota program graduates. The demand for the occupation in that region would be undercounted because it is limited to only Minnesota openings. A good example would be demand for health care practitioners and technicians from northwestern
34
34

Minnesota who go to work at hospitals or clinics in Fargo and Grand Forks, North Dakota.
Supply data do not take geographic mobility into account. This is particularly important for the Twin Cities regional analysis and for state university program graduates. Graduates often complete a program at an institution in greater Minnesota and then go to work for a firm located in the Twin Cities. The shortage situation in the Twin Cities is offset to some degree, or perhaps entirely, by mobility of graduates from other regions of the state. Mobility of graduates from programs in neighboring states is also not considered in these data.
Supply data reflect program graduates only. Some individuals leave a program before completing all the requirements and find employment in a related occupation. The result is that the actual supply for this occupation is understated.
The total supply reflects the employment pattern of MnSCU program graduates only. There are a number of potential areas where errors occur. Not all MnSCU graduates responded to the follow-up survey or provided a job title. Job titles were coded with a SOC code, but the job titles are sometimes ambiguous and coding errors were made. We have assumed that the occupational employment distribution of graduates of non-MnSCU programs is the same as MnSCU programs.
Other subtle errors occur for selected occupations. For example, graduates who receive a master’s in teaching do not add to the available labor supply. Most, estimated to be about 85 percent, are already teaching. In other cases, graduates may not be qualified to enter a profession with a bachelor’s degree. This occurs in social work where a graduate degree is required. Accommodations for these nuances were not made due to a lack of available time.
The following page is a sample from one of the regional supply/demand reports. The 00.0000 SOC code indicates that this is a new program idea proposed from the Chief Academic Officer survey. For each shortage occupation, there was a list of the programs, institution, degree level, and number of graduates who reported on the follow-up survey that they were working in that occupation.
35
35

Sample Page from a Supply/Demand Analysis
Report01
Standard Occupational Code (SOC), SOC Title,Corresponding MnSCU Academic Classification of Programs
(CIP),Location, Degree Level, and MnSCU Graduates Working within
the SOC
98 Graduates
McSCU Regional
Institutions
SUPPLY 98Graduates
All MN Regional Higher Ed Institutions
DEMAND Regional
Annualized Openings
Shortage/ Surplus
New Program Request
00.0000 Protection Services Normandale CC YES00.0000 Security St. Paul TC YES33-3051 Police and Sheriff’s Patrol Officers 121 144 191 -4624.0101 Liberal Arts and Sciences/
Liberal StudiesCentury CTC AA 2
24.0101 Liberal Arts and Sciences/Liberal Studies
North Hennepin CC
AA 4
24.0102 General Studies Metropolitan SU BA 843.0107 Law Enforcement/Police Science Metropolitan SU Cert 843.0107 Law Enforcement/Police Science Inver Hills CC AS 1543.0107 Law Enforcement/Police Science Inver Hills CC AAS 143.0107 Law Enforcement/Police Science North
Hennepin CCAS 31
43.0107 Law Enforcement/Police Science Normandale CC AS 2143.0107 Law Enforcement/Police Science Century CTC AS 843.0107 Law Enforcement/Police Science Minneapolis
CTUAS 5
43.0107 Law Enforcement/Police Science Metropolitan SU BS 1544.0401 Public Administration Metropolitan SU BS 152.0201 Business Administration and
Management, GeneralMetropolitan SU MBA 3
A zero value for MnSCU Awards indicates either the graduate did not enter the SOC occupation or no awards were given in the year for which follow-up information was gathered. Total MN awards includes only those non MnSCU programs for which MnSCU currently offers awards. A zero value for openings could occur if the SOC was rolled into another, a declining occupation indicating very little need, or one with missing data.
36
36

Appendix C: Supply/Demand Analysis Tables
* Source: Minnesota Department of Economic Security, Employment Projections, 1998-2008** Source: Minnesota State Colleges and Universities (MnSCU); US Department of Education, IPEDS Data, Authors’ Estimates
37
Table C1: Average Openings, Average Awards, and Average Shortage/Surplus by Occupational Cluster, 1998-2000, Minnesota
Occupational ClusterAverage Annual
Openings 1998-2000*
Average Annual Awards
1998-2000**
Average Annual Shortage/Surplus
1998-2000
Long-Term Need Ranking
Production 5939 2216 -3723 1Management 6405 3307 -3098 2Sales and Related 4641 1711 -2930 3Personal Care and Service 2524 949 -1575 4Installation, Maintenance, and Repair 3544 2099 -1445 5Computer and Mathematical 4718 3374 -1344 6Food Preparation and Serving Related 1701 708 -993 7Transportation and Material Moving 1370 423 -947 8Business and Financial Operations 3665 3256 -409 9Healthcare Support 1668 1333 -335 10Building, Grounds Cleaning and Maintenance 233 77 -156 11Construction and Extraction 1634 1506 -128 12Life, Physical, and Social Science 924 824 -100 13Legal 513 467 -46 14Farming, Fishing, and Forestry 58 38 -20 15Art, Design, Entertainment, and Media 1981 2032 52 16Architecture and Engineering 2183 2419 236 17Protective Service 1093 1387 293 18Community and Social Services 1184 1563 379 19Education, Training, and Library 5872 6857 985 20Office and Administration Support 4896 5929 1033 21Healthcare Practitioners and Technical 4887 6183 1296 22All Occupational Clusters 61633 48657 -12975
37

Table C2: Average Openings, Average Awards, and Average Shortage/Surplus by Job Zone and by Type of Postsecondary Award, 1998-2000, Minnesota
JOB ZONES*Average Annual Awards 1998-2000**
Average Annual
Openings 1998-
2000***
Average Annual
Shortage/Surplus
1998-2000Certificate Diplom
aAssociat
eBachelor’
s Master’s All Awards
Job Zone 2 - Some Preparation Needed (High School Required; Included Occupations Require 2-Yr College)
7% 32% 33% 27% 1% 9700 13401 -3701
Job Zone 3 - Medium Preparation Needed (Two-year College Required; Some Occupations Require a 4-Yr Degree)
5% 46% 23% 24% 2% 13431 21784 -8353
Job Zone 4 - Considerable Preparation Needed (Usually Four-Year College Required; Some Occupations May not Need 4-Yr Degree)
5% 14% 21% 49% 12% 23940 22848 1092
Job Zone 5 - Extensive Preparation Needed (Four-Year College or More Required)
3% 8% 11% 60% 19% 1586 3600 -2014
All Job Zones 5% 26% 24% 38% 7% 48657 61633 -12975
*Job Zones Indicate Minimum Occupational Entry. Source: O*NET Database; US Department of Labor**Source: Minnesota State Colleges and Universities (MnSCU); US Department of Education, IPEDS Data, Authors’ Estimates***Source: Minnesota Department of Economic Security, Employment Projections, 1998-2008
Table C3: Vacancies, Average Awards, and Shortage/Surplus by Occupational Cluster, 1998-2001, Minnesota
38
38
Occupational Cluster Vacancies 2001*
Average Annual Awards
1998-2000**
Shortage/Surplus
1998-2001Short-Term Need
Ranking
Healthcare Support 3112 1333 -1779 1Personal Care and Service 2593 949 -1644 2Food Preparation and Serving Related 2232 708 -1524 3Healthcare Practitioners and Technical 7150 6183 -967 4Transportation and Material Moving 1283 423 -860 5Production 3010 2216 -794 6Construction and Extraction 1558 1506 -52 7Farming, Fishing, and Forestry 23 38 15 8Building, Grounds Cleaning and Maintenance 49 77 28 9Sales and Related 1674 1711 37 10Legal 316 467 151 11Life, Physical, and Social Science 672 824 152 12Installation, Maintenance, and Repair 1601 2099 498 13Business and Financial Operations 2502 3256 754 14Protective Service 266 1387 1121 15Community and Social Services 338 1563 1225 16Art, Design, Entertainment, and Media 691 2032 1341 17Architecture and Engineering 817 2419 1602 18Management 1560 3307 1747 19Computer and Mathematical 566 3374 2808 20Education, Training, and Library 4014 6857 2843 21Office and Administration Support 2836 5929 3093 22All Occupational Clusters 38863 48657 9794
* Source: Minnesota Department of Economic Security, Vacancy Data, Fourth Quarter 2001** Source: Minnesota State Colleges and Universities (MnSCU); US Department of Education, IPEDS Data, Authors’ Estimates
Table C4: Vacancies, Average Awards, and Shortage/Surplus by Job Zone and by Type of Postsecondary Award, 1998-2001, Minnesota
39
39

JOB ZONES*Average Annual Awards 1998-2000** Vacancies
2001***Shortage/Surplus
1998-2000Certificat
eDiplom
aAssociat
eBachelor’
s Master’s All Awards
Job Zone 2 - Some Preparation Needed (High School Required; Included Occupations Require 2-Yr College)
7% 32% 33% 27% 1% 9700 12720 -3020
Job Zone 3 - Medium Preparation Needed (Two-year College Required; Some Occupations Require a 4-Yr Degree)
5% 46% 23% 24% 2% 13431 13172 259
Job Zone 4 - Considerable Preparation Needed (Usually Four-Year College Required; Some Occupations May not Need 4-Yr Degree)
5% 14% 21% 49% 12% 23940 11220 12720
Job Zone 5 - Extensive Preparation Needed (Four-Year College or More Required)
3% 8% 11% 60% 19% 1586 1751 -165
All Job Zones 5% 26% 24% 38% 7% 48657 38863 9794
*Job Zones Indicate Minimum Occupational Entry. Source: O*NET Database; US Department of Labor**Source: Minnesota State Colleges and Universities (MnSCU); US Department of Education, IPEDS Data, Authors’ Estimates*** Source: Minnesota Department of Economic Security, Vacancy Data, Fourth Quarter 2001
40
40

Table C5: Comparing Additional Awards Generated by New Program Development To The Two Measures of Shortage/Surplus by Occupational Cluster 1998-2001 Minnesota
Occupational Cluster
Average Annual Additional Awards From New Program
Development2001*
New Program Ranking
Average Annual Shortage/Surplus
1998-2000**
Long-Term Need
RankingShortage/Surplus
1998-2001***Short-Term
Need Ranking
Healthcare Practitioners and Technical 1071 1 1296 22 -967 4Office and Administration Support 537 2 1033 21 3093 22Protective Service 328 3 293 18 1121 15Education, Training, and Library 289 4 985 20 2843 21Computer and Mathematical 271 5 -1344 6 2808 20Business and Financial Operations 269 6 -409 9 754 14Management 248 7 -3098 2 1747 19Healthcare Support 237 8 -335 10 -1779 1Installation, Maintenance, and Repair 187 9 -1445 5 498 13Community and Social Services 146 10 379 19 1225 16Sales and Related 145 11 -2930 3 37 10Architecture and Engineering 132 12 236 17 1602 18Production 116 13 -3723 1 -794 6Personal Care and Service 113 14 -1575 4 -1644 2Legal 100 15 -46 14 151 11Art, Design, Entertainment, and Media 89 16 52 16 1341 17Construction and Extraction 70 17 -128 12 -52 7Food Preparation and Serving Related 58 18 -993 7 -1524 3Life, Physical, and Social Science 51 19 -100 13 152 12Transportation and Material Moving 44 20 -947 8 -860 5Building, Grounds Cleaning and Maintenance 6 21 -156 11 28 9Farming, Fishing, and Forestry 3 22 -20 15 15 8All Occupational Clusters 4511 -12975 9794
* Authors’ Estimates, MnSCU Academic Program Unit** Source: Table C2***Source: Table C4
41
41

*
MnSCU Academic Program Unit** Source: Table C3*** Source: Table C5
42
Table C6: Comparing Additional Awards Generated by New Program Development To Two Measures of Shortage/Surplus by Occupational Cluster, 1998-2001 Minnesota
JOB ZONES
Average Annual Additional Awards From New Program
Development2001*
Average Annual Shortage/Surplus
1998-2000**Shortage/Surplus
1998-2001***
Job Zone 2 - Some Preparation Needed (High School Required; Included Occupations Require 2-Yr College)
1100 -3701 -3020
Job Zone 3 - Medium Preparation Needed (Two-year College Required; Some Occupations Require a 4-Yr Degree)
1498 -8353 259
Job Zone 4 - Considerable Preparation Needed (Usually Four-Year College Required; Some Occupations May not Need 4-Yr Degree)
1829 1092 12720
Job Zone 5 - Extensive Preparation Needed (Four-Year College or More Required)
83 -2014 -165
All Job Zones 4511 -12975 9794
42