ijesrt /archives 2013/april_2013... · 2013-10-13 · http: // (c) ... established at the vertices...
TRANSCRIPT
[Ziggah, 2(4): April, 2013]
http: // www.ijesrt.com (C) International Journal of Engineering Sciences & Research Technology
IJESRT INTERNATIONAL JOURNA
Determination of GPS Coordinate Transformation Parameters of Geodetic Data between Reference Datums-A Case
Yao Y. Ziggah*1, Hu Youjian*1 Department of Geodesy and Survey Engineering, China University of Geosciences, Wuhan
The issues of datum transformation of GPS coordinates from the War Office to the WGS84 coordinate systems are a real, persistent and serious problem in Ghana that requires pragmatic measures for solutions. The Ghana national mapping coordinates data are based on a noof 1926, which like many others around the world was realized through conventional methods of surveying. Therefore, GPS based WGS84 coordinates data are not compatible with the War Office. This study ainvestigating and comparing the similarity (abridged Molodensky, Bursaposition dependent (3D projective and 12determining their associated transformation parameters so that users from all related disciplines can utilize them without any problem. To achieve the aims of this research, nineteen common points between the War Office and WGS84 system were used to estimate the transformation parametderived transformation parameters, the reference standard deviation, reference adjustment variance and the individual standard deviations of the parameters determined were used. Residual analysis using maximumaximum positive, mean error and standard error was then conducted to evaluate the performance of the transformation models. The test of normality of residuals, deterministic model, correlation coefficient r, tderived transformation parameters, t-test on the correlation coefficient, Root Mean Square error and Root Mean square error distribution were used to evaluate and check the adequacy of the transformation models. Tests were carried out on nineteen points with coordinates known indicated that the Bursa-Wolf, MolodenskyWar Office coordinates accurate to ±1 m and the abridged Molodensky parameters produce War Office accurate to ±1.9 m. In the case of the position dependent methods, the 3D projective model is in the order of approximately ±1.7 m and ±0.8 m for the 12 parameter linear affine model. Based on the results it was found that both similarity and position dependent methods generate results consistent with their accuracies that have been quoted in scientific literature. Keywords: Global Position Systems, Coordinate Systems, Transformation models Introduction
In the broad spectrum of activities covered by geodesy, one of the primary tasks is the establishment of a well-defined coordinate system and datum for accurate positioning on the Earth surface. These coordinate systems or datums, may be of a local or regional nature or even of global extent, have a variety of uses in the realms of both scientific and applied geodesy. For example, recently, there is an increasing interest in positioning techniques based on Global Navigation Satellite Systems (GNSS) such as Global Positioning System (GPS) in Ghana.
GNSS furnishes the principal technology for geomatics and geodetic activities in Ghana. It is well acknowledged that the use of GPS as a costeffective tool for the majority of future geodetic surveys is on the ascendancy in Ghana (Dadzie
ISSN: 2277
International Journal of Engineering Sciences & Research Technology
INTERNATIONAL JOURNAL OF ENGINEERING SCIENCES & RESEARCH TECHNOLOGY
Determination of GPS Coordinate Transformation Parameters of Geodetic Data A Case Study of Ghana Geodetic Reference Network, Hu Youjian1, Christian O. Amans1, Dong L. Fan
Department of Geodesy and Survey Engineering, China University of Geosciences, [email protected]
Abstract of datum transformation of GPS coordinates from the War Office to the WGS84 coordinate
systems are a real, persistent and serious problem in Ghana that requires pragmatic measures for solutions. The Ghana national mapping coordinates data are based on a non-geocentric coordinate system known as the War Office of 1926, which like many others around the world was realized through conventional methods of surveying. Therefore, GPS based WGS84 coordinates data are not compatible with the War Office. This study ainvestigating and comparing the similarity (abridged Molodensky, Bursa-Wolf, Veis and Molodenskyposition dependent (3D projective and 12-parameter linear affine) transformation models for the study area by
transformation parameters so that users from all related disciplines can utilize them without any problem. To achieve the aims of this research, nineteen common points between the War Office and WGS84 system were used to estimate the transformation parameters. In order to ascertain the precision of the derived transformation parameters, the reference standard deviation, reference adjustment variance and the individual standard deviations of the parameters determined were used. Residual analysis using maximumaximum positive, mean error and standard error was then conducted to evaluate the performance of the transformation models. The test of normality of residuals, deterministic model, correlation coefficient r, t
test on the correlation coefficient, Root Mean Square error and Root Mean square error distribution were used to evaluate and check the adequacy of the transformation models. Tests were carried out on nineteen points with coordinates known in both WGS84 and War Office systems. The results
Wolf, Molodensky-Badekas and Veis models parameters transform WGS84 coordinates to War Office coordinates accurate to ±1 m and the abridged Molodensky parameters produce War Office accurate to ±1.9 m. In the case of the position dependent methods, the 3D projective model is in the order of approximately ±1.7 m and ±0.8 m for the 12 parameter linear affine model. Based on the results it was found that
osition dependent methods generate results consistent with their accuracies that have been
: Global Position Systems, Coordinate Systems, Transformation models.
the broad spectrum of activities covered by geodesy, one of the primary tasks is the
defined coordinate system and datum for accurate positioning on the Earth surface. These coordinate systems or datums, may be
l nature or even of global extent, have a variety of uses in the realms of both scientific and applied geodesy. For example, recently, there is an increasing interest in positioning techniques based on Global Navigation Satellite Systems (GNSS) such
bal Positioning System (GPS) in Ghana. GNSS furnishes the principal technology
for geomatics and geodetic activities in Ghana. It is well acknowledged that the use of GPS as a cost-effective tool for the majority of future geodetic
ancy in Ghana (Dadzie et al.,
2008) due to its numerous advantages over classical methods of surveying. However, the use of GPS as a tool for geodetic positioning in Ghana has some limitations. Thus, no generally accepted standards exist for its use in Ghana due to inconsistencies in the transformation parameters derived among researchers. As a result, users adopt different methods in the post-processing of the GPS observational raw data and these generate a lot of uncertainty and inconsistency in the use of the GPS data from different sources Therefore, the rapid growth of utilizing GPS technology in Ghana necessitates the derivation of transformation parameters for transforming
ISSN: 2277-9655
International Journal of Engineering Sciences & Research Technology[956-971]
ENCES & RESEARCH
Determination of GPS Coordinate Transformation Parameters of Geodetic Data Study of Ghana Geodetic Reference Network
, Dong L. Fan1 Department of Geodesy and Survey Engineering, China University of Geosciences, Wuhan-P.R.China
of datum transformation of GPS coordinates from the War Office to the WGS84 coordinate systems are a real, persistent and serious problem in Ghana that requires pragmatic measures for solutions. The
geocentric coordinate system known as the War Office of 1926, which like many others around the world was realized through conventional methods of surveying. Therefore, GPS based WGS84 coordinates data are not compatible with the War Office. This study aims at
Wolf, Veis and Molodensky-Badekas) and parameter linear affine) transformation models for the study area by
transformation parameters so that users from all related disciplines can utilize them without any problem. To achieve the aims of this research, nineteen common points between the War Office and
ers. In order to ascertain the precision of the derived transformation parameters, the reference standard deviation, reference adjustment variance and the individual standard deviations of the parameters determined were used. Residual analysis using maximum negative, maximum positive, mean error and standard error was then conducted to evaluate the performance of the transformation models. The test of normality of residuals, deterministic model, correlation coefficient r, t-test on the
test on the correlation coefficient, Root Mean Square error and Root Mean square error distribution were used to evaluate and check the adequacy of the transformation models. Tests were
in both WGS84 and War Office systems. The results Badekas and Veis models parameters transform WGS84 coordinates to
War Office coordinates accurate to ±1 m and the abridged Molodensky parameters produce War Office coordinates accurate to ±1.9 m. In the case of the position dependent methods, the 3D projective model is in the order of approximately ±1.7 m and ±0.8 m for the 12 parameter linear affine model. Based on the results it was found that
osition dependent methods generate results consistent with their accuracies that have been
2008) due to its numerous advantages over classical methods of surveying. However, the use of GPS as a tool for geodetic positioning in Ghana has some limitations. Thus, no generally accepted standards exist for its use in Ghana due to inconsistencies in he transformation parameters derived among researchers. As a result, users adopt different
processing of the GPS observational raw data and these generate a lot of uncertainty and inconsistency in the use of the GPS
(Dzidefo, 2011). Therefore, the rapid growth of utilizing GPS technology in Ghana necessitates the derivation of transformation parameters for transforming

[Ziggah, 2(4): April, 2013] ISSN: 2277-9655
http: // www.ijesrt.com (C) International Journal of Engineering Sciences & Research Technology[956-971]
observational data from War Office to WGS84 datum.
The issue of transforming GPS-based coordinates to the national coordinates system and vice versa has become a crucial concern for geodetic and geomatics applications (Dawod et al., 2011). For example, geospatial and non-geospatial professionals in their day-to-day activities are challenged with the task of integrating geodetic information based on two different incompatible geodetic datums. The problem of having different datums was not recognized as a major problem in the past because most Geographic Information Systems (GIS) applications have been applied on small or medium scales where errors due to different datums of up to 100-500 m do not show up (LUPMIS, 2012). The complexity of this incompatibility between different mapping systems or datums is of general concern to those involved in the collection of natural resources data where projections and conversion between datums are required. Graham et al. (2000) emphasized that “the Ghana National Grid (GNG) is an example of a mapping system that is not defined in image processing and Geographic Information System (GIS) software and for which the transformation parameters are not readily available in the literature. Therefore, integrating GNG topographic map data within a GIS with data derived from other sources can be problematic”. Therefore, there is much need to determine transformation parameters that will mathematically convert observed GPS based data to the national geodetic reference system in order to avoid discrepancies caused by the change of geodetic datum data from one geodetic datum to another. For instance, the Ghana Geodetic Datum has the War Office ellipsoid adopted as the reference ellipsoid to meet the requirement for mapping and engineering projects in Ghana. Consequently, using GPS as a tool for geodetic positioning in Ghana requires that the datum transformation from WGS84 to the Ghana geodetic datum (War Office) have to be defined. Efforts have been made by researchers (for example, Poku-Gyamfi and Schueler, 2008; Ayer and Fosu, 2008; Ayer and Tienhah, 2008; Ayer, 2008; Dzidefo, 2011) in Ghana and foreign agencies to determine an appropriate procedure and transformation parameters for the Ghana Geodetic Reference Network called the Golden Triangle. No conclusion has been reached as to which of them is the preferred approach and no doubt this is an area where discussions will continue for some time to come. As a result, an optimal set of transformation parameters between the Accra and WGS84 datum does not exist, this makes it difficult for Ghana to utilize the massive potential of GPS
services. In order to establish compatibility in data obtained from GPS measurements correctly and effectively in Ghana, it is necessary to determine appropriate transformation parameters that relate the coordinates in the War Office system to the WGS84 system using relevant transformation models.
Several transformation models have been put forth to compute transformation parameters for geodetic reference network of countries (Thomson, 1994; Hofmann-Wellenhof et al., 1997; Constantin-Octavian, 2006; Ayer and Tienhah, 2008). The most commonly used among these models are the conformal similarity methods such as Helmert Similarity Transformation, Bursa-Wolf and Molodensky-Badekas because of their ease in application and resulting accuracy (Kutoglu et al., 2002). In this study, four similarity coordinate transformation methods namely; Bursa-Wolf Model, Molodensky-Badekas Model, Veis Model and abridged Molodensky model were studied. In addition, two position-dependent models namely; three-dimensional polynomial projective transformation and 12-parameter linear affine transformation were also investigated. The position dependent techniques applied in this study were chosen to experiment on its application to global and local geodetic datums transformation and how much they differ from the seven-parameter similarity methods. This idea was motivated by the fact that their applications are mostly used in the field of photogrammetry and remote sensing and limited literature is available on its application on global and local datums especially in developing countries like Ghana where geodesy has not yet reached the advance stage. It is worth mentioning that these position dependent methods are widely used within local systems but rarely applied for global and local datums transformation parameter determination. Transformation parameters and tests results obtained from the similarity and position dependent models for transforming curvilinear coordinates from Ghana geodetic datum (War Office) to WGS84 datum and vice versa were compared. The study is therefore limited to; the determination of transformation parameters within Ghana Geodetic Reference Network (GGRN) between the War Office datum and the WGS84 datum; estimation of the accuracy measures of the models; normality test of the residuals; a hypothesis test on the derived transformation parameters; a comparative study of the above mentioned models and finally evaluating the performance of the models using existing coordinates information within the GGRN.

[Ziggah, 2(4): April, 2013]
http: // www.ijesrt.com (C) International Journal of Engineering Sciences & Research Technology
Materials and Methods Study area
Ghana is located in West Africa, bordered by Cote D’Ivoire to the West, Togo to the EBurkina Faso to the North and the Gulf of Guinea to the South. The country spans an area of 239,460 sq. km with the land mass generally consisting of low plains with a dissected plateau in the southarea and scattered areas of high relief (Baabereyir, 2009). Lying just above the equator, Ghana has a tropical climate with mean annual temperatures ranging between 26ºC and 29ºC but temperaturgenerally higher in the North than in the S(Baabereyir, 2009). Ghana lies between latitudes 4and 120 N and longitude 40 E and 20 W (Anon, 2013). The country is divided into ten administrative regions as shown in figure 1 below.
Figure 1: Map of Ghana showing the study area (Anon, 2013)
This study covers five out of the ten
administrative regions in Ghana. That is; Ashanti, Greater Accra, Western, Central and Eastern (figure 1). These regions form the first phase of the new established geodetic reference network referred as the Golden triangle. The Golden Triangle of Ghana has the three largest cities and covers a little over a third of the country with 58% of the total population (Poku-Gyamfi and Schueler, 2008). These regions have almost all the natural resources such as gold, bauxite, manganese, oil, timber found in the country and thus are of high economic importance. Three permanently operating reference stations have been established at the vertices of this triangle with eighteen-second order reference stations spatially well distributed in this area in question.
ISSN: 2277
International Journal of Engineering Sciences & Research Technology
Ghana is located in West Africa, bordered Togo to the East,
orth and the Gulf of Guinea to the South. The country spans an area of 239,460 sq. km with the land mass generally consisting of low
with a dissected plateau in the south-central area and scattered areas of high relief (Baabereyir, 2009). Lying just above the equator, Ghana has a tropical climate with mean annual temperatures ranging between 26ºC and 29ºC but temperatures are
higher in the North than in the South (Baabereyir, 2009). Ghana lies between latitudes 40
W (Anon, 2013). The country is divided into ten administrative
ing the study area (Anon,
This study covers five out of the ten administrative regions in Ghana. That is; Ashanti, Greater Accra, Western, Central and Eastern (figure 1). These regions form the first phase of the new
network referred as the Golden triangle. The Golden Triangle of Ghana has the three largest cities and covers a little over a third of the country with 58% of the total population
Gyamfi and Schueler, 2008). These regions resources such as gold,
bauxite, manganese, oil, timber found in the country and thus are of high economic importance. Three permanently operating reference stations have been established at the vertices of this triangle with
e stations spatially well distributed in this area in question.
Materials
Primary data of geodetic coordinates for both WGS84 and War Office ellipsoid were collected from the Ghana Survey Department with secondary data obtained from research publicationsthe transformation parameters. Computer programming codes in Matlab (2012b) was written to handle the parameter estimation for the various transformation models. Plotted control points, data structures, descriptive and summary statistics for entire study were also produced using Matlab (2012b), Microsoft Excel 2007, SPSS (Version 20) and Surpac (Version 6.1.2). Methods
Curvilinear geodetic coordinates of common points in both the WGS84 and War Office system were first converted into rectacoordinate (X, Y, Z). To accomplish this task, the following relationships were applied;
φφφ
λφφ
λφ
]sin)2(1[
sin)1(
]sin)2(1[
sincos
]sin)2(1[
coscos
2/12
2
2/12
2/12
ff
faZ
ff
aY
ff
aX
+−−
−=
+−−
=
+−−
=
Where; h = ellipsoidal height a = semi major axis of the reference ellipsoidf = flattening which measures the differences between the two axes of an ellipsoid.
),( λφ = geodetic latitude and geodetic longitude
The ellipsoidal parameters used in equation (1) for WGS84 are; semi-major axis value of 6378137.0 m and a flattening of 1/298. The War Office on the other hand has a semi-major value of 6378299.99899 m and a flattening of 1/296.
Equation (1) was applied directly to the
WGS84 curvilinear geodetic coordinates
obtain its related rectangular cartesian coordinates
84),,( WGSZYX . However, equation (1) cannot be
readily applied directly in deriving the rectangular cartesian coordinate for the War Office ellipsoidal system. This is because data in the War Office
ellipsoid expressed as ,,( Hλφorthometric height. Hence, the applicability of equation (1) is limited in this scenario. In view of this development, the iterative abridged Molodensky
ISSN: 2277-9655
International Journal of Engineering Sciences & Research Technology[956-971]
Primary data of geodetic coordinates for both WGS84 and War Office ellipsoid were collected from the Ghana Survey Department with secondary data obtained from research publications to determine the transformation parameters. Computer programming codes in Matlab (2012b) was written to handle the parameter estimation for the various transformation models. Plotted control points, data structures, descriptive and summary statistics for the entire study were also produced using Matlab (2012b), Microsoft Excel 2007, SPSS (Version 20)
Curvilinear geodetic coordinates of common points in both the WGS84 and War Office system were first converted into rectangular cartesian coordinate (X, Y, Z). To accomplish this task, the following relationships were applied;
φ
λφ
λφ
sin
sincos
coscos
h
h
h
+
+
+
(1)
a = semi major axis of the reference ellipsoid f = flattening which measures the differences etween the two axes of an ellipsoid.
= geodetic latitude and geodetic longitude
The ellipsoidal parameters used in equation (1) for major axis value of 6378137.0 m
and a flattening of 1/298. The War Office on the major value of 6378299.99899
was applied directly to the
WGS84 curvilinear geodetic coordinates ),,( hλφ to
obtain its related rectangular cartesian coordinates
However, equation (1) cannot be
readily applied directly in deriving the rectangular cartesian coordinate for the War Office ellipsoidal system. This is because data in the War Office
)H contains only
height. Hence, the applicability of equation (1) is limited in this scenario. In view of this development, the iterative abridged Molodensky

[Ziggah, 2(4): April, 2013] ISSN: 2277-9655
http: // www.ijesrt.com (C) International Journal of Engineering Sciences & Research Technology[956-971]
transformation model equation (Deakin, 2004) was
first applied to the War Office data ),,( Hλφ to
determine the approximate (change) difference in ellipsoidal height, h∆ . This was then used to
estimate h for the War Office using
hhh WGSwar ∆−= 84 . Having derived the war office
ellipsoidal height, equation (1) was then applied to calculate the rectangular cartesian coordinates for the War Office datum. Hence, there exist common points of all coordinates in both systems at this stage. The above mentioned transformation models used in the study were executed on the cartesian coordinates of common points in both systems to determine a sets of transformation parameters. These parameters were estimated via parametric least square adjustment technique expressed mathematically as
fBXV =+ (2)
Where: V = the vector of residuals B = the design matrix X = the vector of parameter estimates and f = the vector of observations.
In all, nineteen control stations (figure 2) tied to both reference systems within the geodetic reference network were used for the parameter estimation. Figure 2 below has a black background because of the Surpac software used to do the plotting.
Figure 2: Control points within the Golden Triangle
Finally, statistical analysis was carried out on all parameters determined by each of the six models. A summary of the transformation procedures is shown in the flow chart (figure 3) below:
Figure 3: Computational Procedures for transformation Parameters determination
Results and Discussion Transformation models applied
The conformal transformation models computed parameters and their corresponding statistic values for transforming War Office data to WGS84 system are shown in Table 1 below. It is evident from table 1 that the two origins of the reference ellipsoids have a negative displacement on the X-axes and positive displacement on the Y and Z-axes. The X-axes displacement direction suggests that the movements of both reference systems are in the opposite direction whilst the reverse situation exists for the Y and Z-axes. The translation parameter X∆ revealing the existence of a negative displacement from the geocenter is because both X-axes in the two reference ellipsoids are moving in opposite directions. Conversely, Y∆ and Z∆ translation parameters from the geocenter evident from table 1 below show that the axes of both reference ellipsoids move in the same direction.
Table 1: Summary of the derived parameters results
Parameter Conformal Similarity Transformation Models
Abridged Molodensky Bursa-Wolf Veis Molodensky-Badekas UNITS
X∆ -196.63455±0.1618 -151.18907±10.1714 -196.61977±0.1360 -196.6211±0.1360 m
Y∆ 33.36035±0.1618 31.59312±16.9151 33.36126±0.1360 33.36129±0.1360 m
Z∆ 322.51867±0.1618 327.17669±16.8742 322.34385±0.1360 322.34378±0.1360 m
a∆ -162.99899 - - - m
f∆ -255677.13631 - - -
RX - 0.44514±1.6E-06 0.44411±1.5848E-06 0.44514±1.6042E-06 seconds

[Ziggah, 2(4): April, 2013] ISSN: 2277-9655
http: // www.ijesrt.com (C) International Journal of Engineering Sciences & Research Technology[956-971]
RY - -0.00582±2.65E-6 -0.03304±2.6477E-06 -0.00582±2.6521E-06 seconds
RZ - 0.02199±2.64E-6 -0.00535±2.6548E-06 0.02199±2.6397E-06 seconds
S∆ - -7.16775±1.58E-6 -7.16775±1.5827E-06 -7.16775± ppm
Reference SD
0.70518 0.59297 0.59298 0.59298 m
Reference AV
0.49728 0.35162 0.35163 0.35163 m
The reference SD and reference AV from
table 1 represent the reference standard deviation and reference adjustment variance. The a∆ and f∆ellipsoidal change provided the scale change in conjunction with X∆ , Y∆ and Z∆ in the case of the abridged Molodensky model. A Visual observation of table 1 presents a negative scale factor values for Bursa-Wolf, Veis and Molodensky-Badekas models. This negative scale factor denotes that the geometric shapes of the Ghana War Office and WGS84 system are reduced when the scale factor is applied in conjunction with the derived parameters for transforming coordinates from War Office to WGS84 datum and vice versa. Therefore, this corroborates the facts that, similarity transformation preserves shapes and angles but the lengths of lines and the position of points may change. The introduction of rotation angles in the Bursa Wolf, Veis and Molodensky models brings about massive changes in the geocentric (translation) parameters compared to the abridged Molodensky model (table 4.1). Intuitively, it is easy to see that a small rotation around the geodetic X or Y-axis leads to a substantial change in the relative position of the ellipsoid centers which is equivalent to a change in the geocentric translations shown clearly in table 1 above. The introduction of the centroid coordinate for the War Office datum in the Veis and Molodensky-Badekas model tends to eliminate the correlation of transformation parameters that exists in Bursa-Wolf model. The centroid coordinates in (X, Y, Z) used in the derivation of the parameters are; X = 6339126.39570231 m, Y = -133380.293067743 m and Z = 689482.733775943 m. To have an indication on the precision of the transformation to know how well the transformed coordinates from War Office system agree with the known coordinates in the WGS84 system, the reference standard deviation for the entire observation and the individual standard deviations for the computed parameters were estimated. Identical standard deviation values for the geocentric translation parameters were achieved for abridged Molodensky, Veis and Molodensky-Badekas model (table 1 above). The general results in table 1 above
show relatively smaller standard deviation values for each model parameters determined, thus, warrant its acceptance. The statistical results also indicate that there is 68% probability that the observation and its associated parameters lie between plus or minus the reference standard deviation from their estimated values in table 1 above. In addition, this standard deviation obtained will indicate a steep bell-shape on the normal distribution curve.
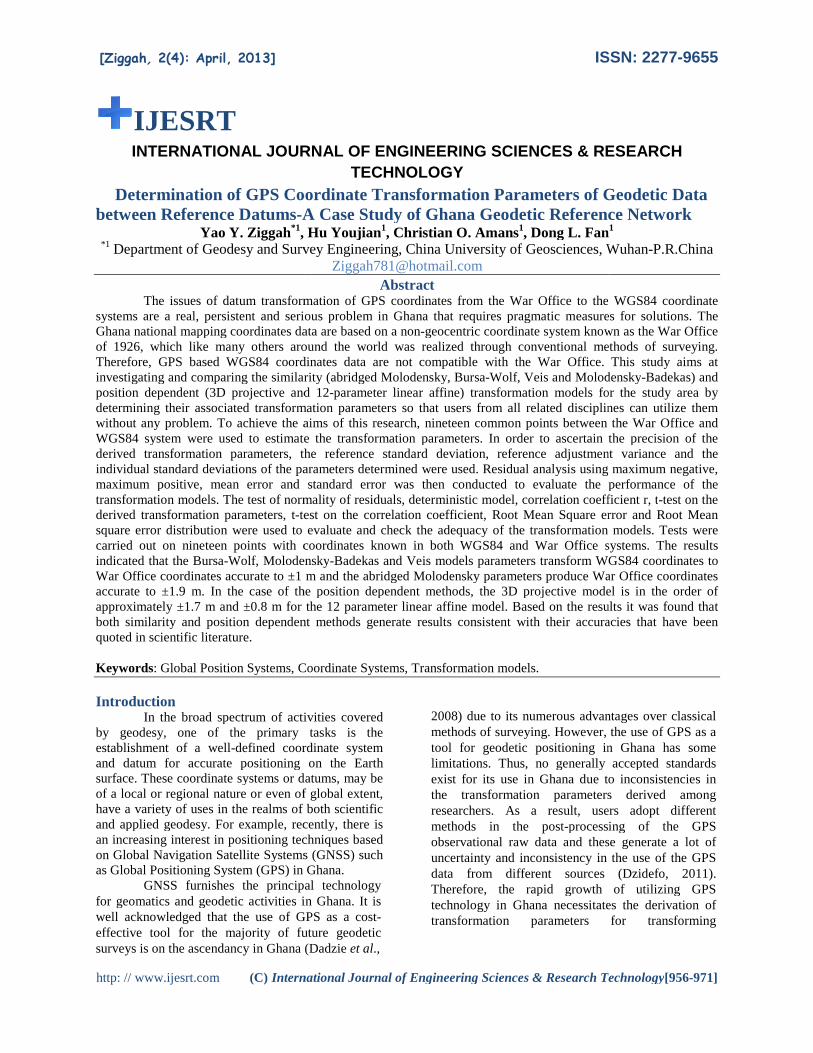
The position dependent methods (3D projective and 12 parameter affine) experimented in this study showed some limitations. Firstly, because there was no change in datum and the coordinate data were converted directly from the War Office to the WGS84 system. It was also observed that although the reference standard deviation for the entire data gave a better precision, the opposite was realized especially in the translation parameters when their standard deviations were estimated. This was also attributed to the fact that the distortions existing in the War Office system surveyed by conventional techniques could not be modeled and absorbed completely by the position dependent methods. It can therefore, be inferred that the position dependent methods experimented in this study can be very reliable for a smaller region (study area) in Ghana having data in the same reference coordinate system and not for national datum transformations even though the final results obtained after applying the parameters were reliably accurate. However, if the position dependent methods experimented in this study are to be applied nationally in Ghana, the author is proposing that an introduction of rotation parameters and scale factor should be introduced into the position dependent equations, thus developing a new model. This new developed model will absorb the systematic distortions in the old datum hence, improvement in its reliability and accuracy. Tables 2 and 3 present the results of the position dependent methods in meters.
[Ziggah, 2(4): April, 2013] ISSN: 2277-9655
http: // www.ijesrt.com (C) International Journal of Engineering Sciences & Research Technology[956-971]
Table 2: Results from 3-D Projective Transformation
3D Projective
Parameter a1 a2 a3 a4
Estimated value 0.630343 0.00458 -0.01956 1178583.4
Standard Deviation 0.0562063 0.0005435 0.00292 179117.86
Parameter b1 b2 b3 b4
Estimated value 0.0033657 0.8139463 0.0003518 -21614.112
Standard Deviation 0.0008232 0.0282877 8.258E-05 5276.1054
Parameter c1 c2 c3 c4
Estimated value -0.0207096 0.000512 0.8118304 132593.31
Standard Deviation 0.0008232 0.0282877 8.258E-05 5276.1054
Parameter d1 d2 d3
Estimated value -2.899E-08 7.23E-10 -3.087E-09
Standard Deviation 4.409E-09 8.574E-11 4.611E-10
Table 3: Results from 12 Parameter Linear Affine Transformation
12 Parameter
Parameter a1 a2 a3 a4
Estimated value 0.9998539 3.346E-06 -1.444E-05 -0.0002641
Standard Deviation 0.0002469 5.631E-06 2.621E-05 0.0002469
Parameter a5 a6 a7 a8
Estimated value 0.9999976 -2.799E-05 0.0012028 -3.033E-05
Standard Deviation 5.631E-06 2.621E-05 0.0002469 5.631E-06
Parameter a9 XO YO ZO
Estimated value 1.0001182 739.98285 1726.7374 -7387.6435
Standard Deviation 2.621E-05 1584.1411 1584.1411 1584.1411
The reference standard deviations obtained for 3D projective and 12-parameter affine models are 0.754328 m and 0.474532 m. These values show that the precision of the data set is within the range of ± 0.754328 and ± 0.474532, respectively. Residual Analysis from Derivation of the Parameters
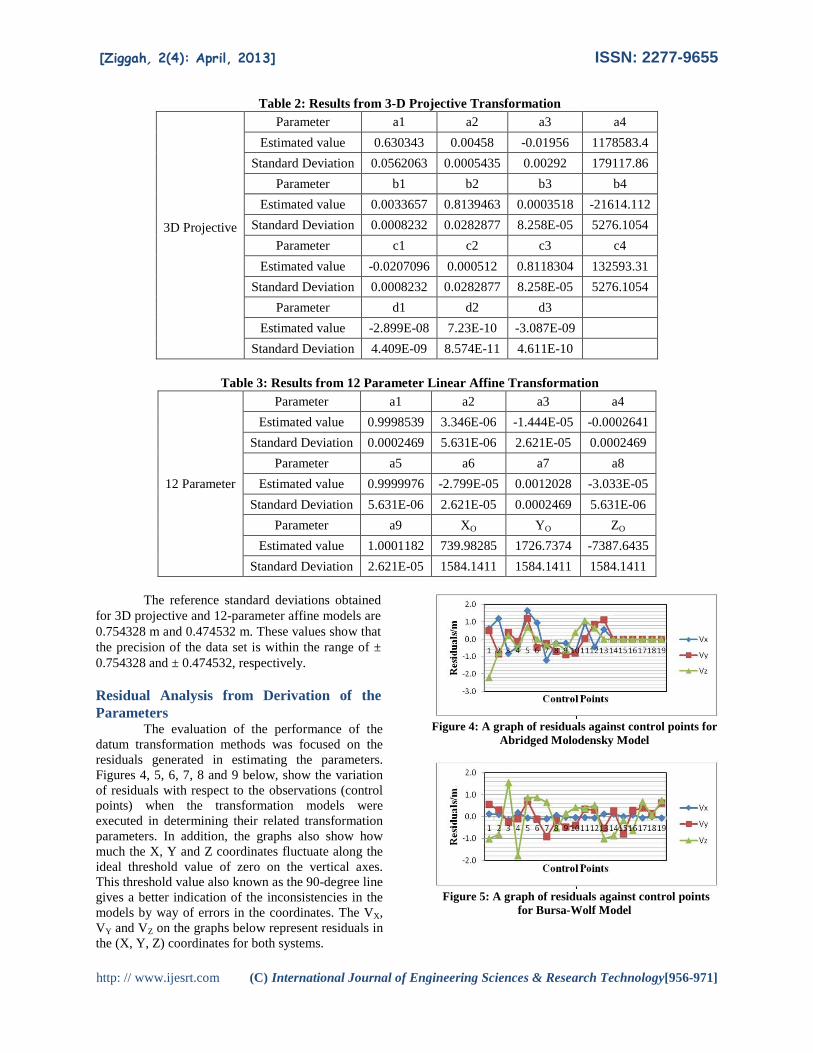
The evaluation of the performance of the datum transformation methods was focused on the residuals generated in estimating the parameters. Figures 4, 5, 6, 7, 8 and 9 below, show the variation of residuals with respect to the observations (control points) when the transformation models were executed in determining their related transformation parameters. In addition, the graphs also show how much the X, Y and Z coordinates fluctuate along the ideal threshold value of zero on the vertical axes. This threshold value also known as the 90-degree line gives a better indication of the inconsistencies in the models by way of errors in the coordinates. The VX, VY and VZ on the graphs below represent residuals in the (X, Y, Z) coordinates for both systems.
Figure 4: A graph of residuals against control points for
Abridged Molodensky Model
Figure 5: A graph of residuals against control points for Bursa-Wolf Model

[Ziggah, 2(4): April, 2013] ISSN: 2277-9655
http: // www.ijesrt.com (C) International Journal of Engineering Sciences & Research Technology[956-971]
Figure 6: A graph of residuals against control points for
Veis Model
Figure 7: A graph of residuals against control points for
Molodesnky-Badekas Model
Figure 8: A graph of residuals against control points for
3D Projective Model
Figure 9: A graph of residuals against control points for
12-Parmeter Affine Model
A striking observation in figures 4, 5, 6, 7, 8 and 9 above show a large VX in the abridged Molodensky five-parameter model compared to the other transformation models where there is a graphical evidence of improvement in the horizontal fluctuation along the threshold. However, uniformity in displacement was observed upon inspection at control points GCS 302 to CFP 207 in the abridged Molodensky compared to the other transformation models.
Comparatively, the residuals in the horizontal positions of the seven-parameter similarity approach show a fairly consistent rise and fall around the threshold. Nonetheless, based on visual observations of the seven parameter similarity transformation graphs of figures 5, 6 and 7, it was seen that, in the VZ component, there was a significant rise from control point CFP 200 to CFP 225 and a downward fall from control point CFP 225 to GCS 102 and another sharp increase from control point GCS 102 to CFP 155 respectively. In the case of the position dependent, the VX residuals are relatively smaller and closer to the displacement threshold value than the VY residuals which have a steady rise and fall. However, the VZ component residuals in the position dependent methods had larger fluctuations around the threshold compared to all the conformal similarity models applied in this study. These inconsistencies incurred as explained above during the parameter determination can be attributed to three factors. The first is due to the distortions in scale and orientation existing in the old datum (War Office) which could not be absorbed and modeled completely by the transformation models. Secondly, the possible non-parallelism existing between the axes of the coordinate systems of WGS84 and War Office datum. Finally, random errors existing in both observation data applied in the parameter determination have an influence on the outcome of the estimation even though this depends on the confidence interval. These factors however, have contributed to the inability of the similarity transformation models to notice its potential of providing higher (sub-meter or even sub-centimeter) accuracy even though they are rigorous models.
The observational residuals obtained from each transformation model can be statistically tested and the better method can be chosen. It is therefore imperative to determine whether the residuals are normally distributed before any statistical test can be carried out. However, if the residuals are not normally distributed then the results obtained may be biased by systematic errors. Therefore, to test the normality assumptions of the residuals, normality probability plots for all the seven models were carried out. A sample of the normality probability plots of the residuals is shown in figure 10 below.

[Ziggah, 2(4): April, 2013] ISSN: 2277-9655
http: // www.ijesrt.com (C) International Journal of Engineering Sciences & Research Technology[956-971]
(a) Normality P-P Plots
(b) Detrended Normal P-P Plot
Figure 10: 3D Projective Normality Probability Plots for the X-Coordinate
Table 4: Residual Estimation Accuracy Measures
Transformation Error Term Max(-)/m Max(+)/m Mean Error (m) Standard Error (m)
Abridged Molodensky
VX -1.200652694485370 1.632192018604710 0.090493410 0.713109842
VY -0.902514314280317 1.183510564459880 -0.005235780 0.494964469
VZ -0.367083085805358 1.056066321658440 -0.093677902 0.624947662
Bursa-Wolf Model
VX -0.161517126175141 0.169559252613851 -0.000000000000012 0.08899041
VY -0.918136195970270 0.709633269562069 0.000000000000000 0.464964103
VZ -1.795210838887440 1.542592777792660 0.000000000000075 0.837377676
Veis Model
VX -0.152126695960760 0.173266176134348 0.000000001666580 0.089595057
VY -0.918067855876871 0.709828763647238 -0.000000000058208 0.464913725
VZ -1.794841314316730 1.543590024812150 0.000000000165432 0.837359175
Molodensky-Badekas Model
VX -0.161517125554383 0.169559250585735 0.000000001666580 0.088990409
VY -0.918136195716215 0.709633269143524 -0.000000000059739 0.464964103
VZ -1.795210837968620 1.542592778103420 0.000000000214450 0.837377676
3D Polynomial Projective Model
VX -0.199499413672494 0.148815443237087 0.000000000000000 0.102491526
VY -0.872173108872741 1.408923863644180 0.000000000000000 0.72155547
VZ -1.188935449226870 1.727083708193740 0.000000000000000 0.852446501
12 Parameter Affine Model
VX -0.108525931835175 0.159129785373807 0.000000000686238 0.062490749
VY -0.611474014169289 0.809538537432673 0.000000000031880 0.435115889
VZ -1.668185951071790 1.247234170441520 0.000000000042890 0.631946059
For the statistical tests of the residuals (VX,
VY, VZ), the maximum negative error, maximum positive error, mean error and standard error values were calculated as shown in table 4 above. The analysis of the maximum negative error, maximum
positive error and mean error values given in table 4 shows that, the seven-parameter similarity transformation models are more than three times better than the five parameter Molodensky model in both X, Y and Z respectively. However, in the case

[Ziggah, 2(4): April, 2013] ISSN: 2277-9655
http: // www.ijesrt.com (C) International Journal of Engineering Sciences & Research Technology[956-971]
of the position dependent methods it was realized that the 3D projective model gave negligible values of mean errors compared to the 12 parameter affine model. In addition, it can be seen from table 4 above that the horizontal coordinates (X, Y) are much better than the vertical coordinate (Z). This arises from the different horizontal and vertical surveys of the Ghana War Office datum. A careful study of table 4 above shows that the seven-parameter models estimated the 3D coordinates (X, Y, Z) with a significantly better accuracy than the abridged Molodensky in terms of the standard error. Comparatively, both the similarity based datum shift and position dependent methods gave closer accuracies . Checking the Statistical Validity of the Derived Transformation Parameters
A hypotheses test for each of the transformation parameters derived in the computational process was performed at 5% level of significance. This was done to ascertain whether all the values of the parameters determined could be
judged statistically different from zero and thus, significant. Tables 5 and 6 below presents the calculated t statistic results for both similarity based datum shift and position dependent transformation methods. In order to test the hypothesis, the measures of dispersion (standard deviation) around the ‘true’ mean were calculated. Testing of Hypothesis: H0:β1 = 0 (Each parameter is not statistically different from zero)
H1:β1 ≠ 0 (Each parameter is statistically different from zero)
Significance Level: α = 0.05
Test Statistic: Parameter
tSD
= where SD is the
standard deviation of the individual parameters shown in table 1. Decision Rule: Reject H0 if t > t (α/2, V), where V is the degree of freedom. Conclusion: If the calculated t is greater than t
α/2, V, reject the null hypothesis of that parameter and vice versa.
Table 5: Computed t-test Values for Similarity Based Datum Shift Methods
Parameter/Transformation tX tY tZ RX RY RZ S
Abridged Molodensky 1215.40 206.2090 1993.570 - - - -
Bursa-Wolf 14.86418 1.86775 19.38915 277471.77025 2193.15324 8330.58422 4.52883
Veis Model 1445.27034 245.22024 2369.37023 280236.69171 12479.83665 2013.44821 4.52875
Molodensky-Badekas 1445.34312 245.23572 2369.51835 277471.77046 2193.15214 8330.58223 4.52883
Table 6: Computed t-test Values for Position Dependent Methods
3D Projective
Parameter a1 a2 a3 a4 b1 b2 b3 b4
t-value 11.21482 8.43106 6.69552 6.57993 4.0887 28.7738 4.25996 4.0966
Parameter c1 c2 c3 c4 d1 d2 d3
t-value 25.15847 0.0181 9830.7 25.1309 6.57449 8.43268 6.6952
12 Parameter
Parameter a1 a2 a3 a4 a5 a6 a7 a8
t-value 4048.84493 0.59417 0.55087 1.06961 177586.88429 1.06777 4.87050 5.38632
Parameter a9 XO YO ZO
t-value 38159.37390 0.46712 1.09001 4.66350
From student t-distribution table, the following critical values (table 7) were obtained. Table 7: Tabular t values
Transformation Models t (α/2, V) Abridged Molodensky 2.145 7-Paramater Similarity 2.179
3D Projective 2.776 12 Parameter 2.365

[Ziggah, 2(4): April, 2013] ISSN: 2277-9655
http: // www.ijesrt.com (C) International Journal of Engineering Sciences & Research Technology[956-971]
Judging from the t values obtained (tables 5 and 7) for the abridged Molodensky model parameters, it can be concluded that all parameters are significantly different from zero at 95% confidence interval, hence, H0:β1 = 0 is rejected. Also, by comparing the tabular t value (table 5) against its related computed value (table 7) in the case of the seven parameter similarity models, all geocentric translation values, rotations and their respective scale factors were significantly different from zero at 95% confidence interval. Hence, the null hypothesis (H0:β1 = 0) for these parameters were rejected. Therefore, there is a non-zero relationship between the War Office and WGS84 reference coordinate system. As a result, the conclusion to be drawn here is that, the parameters of the abridged Molodensky model and the seven-parameter similarity models applied in this study are all statistically significant. However, the position dependent methods proved otherwise. It is evident by making comparison between table 6 and 7 that, not all parameters calculated are statistically different from zero. This is because coordinate positions are directly transformed between the reference systems when the parameters were derived hence, having a major influence on the standard deviations of the parameters determined. This further corroborates that the position dependent methods do have a close association between the War Office and WGS84 reference coordinate system, thus, not all parameters are statistically significant. Nevertheless, the position dependent methods can still be applied for local survey work, for example, in Ghana where coordinates are in the same system. This will tend to some extent reduce the discrepancies existing when it is applied for parameter determination between two different datums, for example, WGS84 and Ghana War Office. Comparison of Bursa-Wolf, Molodensky-Badekas and Veis Models
There are several significant differences in the Bursa-Wolf, Molodensky-Badekas and Veis Models. Based on the knowledge and properties of the models, comparisons were made on their respective similarities and differences in determining the transformation parameters. All three models contain a maximum of seven unknown transformation parameters obtained via a parametric least squares estimation procedure.
From the Bursa-Wolf model equation (Deakin, 2006) and the Molodensky-Badekas model equation (Deakin, 2006), the two transformations can be written in vector form as
2 1(1 )B B BI t S R I= + + ∆
(3)
2 1(1 )M M MI t S R I−
= + + ∆
(4) Where: tM and tB are Bursa-Wolf and Molodensky-Badekas translations .
BS∆ , MS∆ are Bursa-Wolf and Molodensky-
Badekas models scale factors.
BR and MR are Bursa-Wolf and Molodensky-
Badekas models rotations respectively. Constructing similarity transformation
equations in terms of the coordinate differences computed from the origin to the ith point, equation (3) and (4) can be rewritten as:
( ) 0(1 ) ( , , )( )io B B B X Y Z iX S R R R R X X∆ = + ∆ − (5)
( ) 0(1 ) ( , , )( )io M M M X Y Z iX S R R R R X X∆ = + ∆ − (6) It is obvious from equations (5) and (6) that both models are identical due to the cancellations of the translation parameters in equations (3) and (4) respectively. Since I∆ must be the same from both
equations; and ioI is the same, the equality of
equations (5) and (6) implies the following:
( , , ) ( , , )B M
B X Y Z M X Y Z
S S
R R R R R R R R
∆ = ∆=
(7)
This means from equation (7) that, the scale
factor and the rotational parameters derived from executing Bursa-Wolf and Molodensky-Badekas models should yield identical results. This mathematical analogy (equation 7) presented was further substantiated with reference to table 1 (Bursa-Wolf and Molodensky-Badekas results) where identical values were obtained for the scale factor and rotational parameters of the two models respectively. However, the translation components obtained after the models were executed differ from each other. The reason for this is that, with reference to Bursa-Wolf model equation (Deakin, 2006) it can be seen that the scale factor S is applied to all position vectors, including the terrestrial initial point while in the case of Molodensky-Badekas model the scale difference parameter S, is applied only to the coordinate differences. It is also clear from Bursa-Wolf and Molodensky-Badekas equations that, the translation component of the Molodensky-Badekas model equals that of the Bursa-Wolf model only when the centroid coordinates is equal to zero or the

[Ziggah, 2(4): April, 2013] ISSN: 2277-9655
http: // www.ijesrt.com (C) International Journal of Engineering Sciences & Research Technology[956-971]
scale factor is equal to one and the rotation is an identity matrix. Therefore equating equations (3) and (4) gives
1 1(1 ) (1 )s M s BS R I t S R I t−
+ ∆ + = + ∆ +
(8)
Let 1S S= + ∆ and 1 1 1I I g= − as defined in
Deakin, 2006. Hence, substituting and expanding equation (8) becomes
1 1 1s B s s MSR I t SR I SR g t+ = − +
1B M st t SR g= − (9)
The resulting equation shows the mathematical relationship between the Bursa-Wolf translations and Molodensky-Badekas Translations. Moreover, equation (9) depicts the outcome of the rotations and the scale factor on the translation in the Bursa-Wolf model. The magnitude of this effect is
the 1sSR g− . Several investigators such as (Thomson,
1974; Kutoglu et al., 2002; Deakin, 2006) have carried out this translation test. A fundamental difference between Molodensky-Badekas, Veis and Bursa-Wolf models is that, the latter has no provision for an initial point of the second network thereby treating all network points equivalently.
Recalling equations (3) (Bursa-Wolf model) and Veis model equation (Rapp, 1993), the two models can be represented in vector form as
2 1(1 )B B BI t S R I= + + ∆ (10)
12 (1 )V V VI S R I t= + ∆ + (11)
Where: tV is the Veis model translation
VS∆ is the Veis model scale factor
VR is the Veis model rotation
Comparing the new coordinates difference computed with Bursa-Wolf system with those computed by the Veis system from the origin to the ith point, equations (10) and (11) in the new system can be written as:
( ) 0(1 ) ( , , )( )io B B B X Y Z iX S R R R R X X∆ = + ∆ − (12)
( ) 0 0 0(1 ) ( , , , , )( )io V v V iX s R X Xφ λ α ξ η∆ = + ∆ − (13)
Because X∆ and 0( )iX X− must be the same
from both equations, equating equations (12) and (13) implies the following:
0 0( , , ) ( , , , , )B V
B X Y Z M
S S
R R R R R ϕ λ α ε η∆ = ∆
= (14)
It is obvious from equation (14) that the scale factor in the Veis model and Bursa Wolf system must be the same after parameter estimation. This mathematical theorem as stated in equation (14) was further corroborated with the results obtained in this study reference to table 1 where the same scale factor of -7.16775 was obtained for both Veis and Bursa Wolf models respectively. However, the rotation parameters did not yield identical results although the Veis model is mathematically comparable to Molodensky-Badekas model. This is because of the orientation of the Veis model in the coordinate system at the initial point. To estimate the relationship between the two rotation parameters, the Veis model equation must be equated to Molodensky-Badekas equation. In addition, the translation components evident from table 1 differ from each other. The same analogy as discussed in the case of Bursa-Wolf and Molodensky-Badekas models translations explains the situation. The Molodensky-Badekas and Veis models are mathematically equal to each other. Both models require an initial point in the terrestrial network, apply their respective rotations and scale differences to model the errors in the terrestrial network. Furthermore, these models are based on the same a priori assumption of parallelism of coordinate system axes. In addition, both models use the same observables in their respective equations. The only fundamental difference existing between Molodensky-Badekas and Veis models is the rotations at the initial point of the coordinate system. However, based on the results tabulated in 1, it was noticed that this fact does not have any bearing on the final solution or interpretation of the final transformation results. That is, identical results were achieved for the translation components and scale factors with small changes in the rotations that do not have any major influence in the final coordinates transformed. It is also worth mentioning that unless the localized datum shift (centroid) are used, the Molodensky-Badekas and Veis models do not give a best account for variable scale, survey errors and distortions within the War Office local geodetic network, thus, requiring more terms other than the other similarity transformation methods due to non homogeneity in local geodetic datums . Comparison between Position Dependent Methods
There are a number of significant differences and similarities in the 3D Polynomial Projective and 12 Parameter Linear Affine models based on their properties and applications in

[Ziggah, 2(4): April, 2013] ISSN: 2277-9655
http: // www.ijesrt.com (C) International Journal of Engineering Sciences & Research Technology[956-971]
determining their transformation coefficients via a parametric least squares estimation procedure. Comparison of both models describes a change in the two coordinate system and do not include a change of datum. That is, positions are directly calculated into the other coordinate systems. In the 12 parameter affine transformation, there is an allowance of rotation, translation, skew and differential scaling on the geometric network while preserving parallelism of lines. This method maps point in one coordinate reference system into their geometrical points in another coordinate reference system. In addition, there is also an assumption that coordinates of War Office systems has a linear relationship of coordinates of the WGS84 system. On the other hand, the projective transformation allows both angular and length distortions, thus, allowing the geodetic network coordinates to be transformed into an irregular shape. The major advantage of the affine transformation over the projective is its linearity equations, thus, making it easy to use for the transformation parameter determination.
In the case of the projective transformation, the equations require to be linearized and initial approximate values closer to the ‘true’ parameter values are needed before estimating the parameters. This iterative nature of the model makes estimation of the parameters cumbersome. Based upon inspection of the 3D Projective equations (Ghosh, 1979; Burtch, 2010), it was noticed that, when their respective denominator parameters are equal to zero a 12 Parameter linear affine model is formed. Finally, based on the results obtained, the 12parameter affine transformation model was able to estimate the positions of coordinates to a better accuracy than the 3D projective transformation method. Test Results Analysis
In order to compare the validity and the stability of the solutions obtained from both transformation techniques; nineteen check points (existing coordinates) were utilized. A summary of the coordinate differences between the projected and existing coordinates are shown in table 8 below.
Table 8: Summary of coordinate differences test results
Transformation Maximum E
(m) Minimum E
(m) Maximum N
(m) Minimum N
(m) Abridged Molodensky 0.90074 -1.12094 1.87158 -2.07593
Bursa-Wolf 0.91941 -0.70927 1.80296 -1.55013
Veis 0.91930 -0.70943 1.80293 -1.55023
Molodensky-Badekas 0.91941 -0.70930 1.80296 -1.55010
3D Polynomial Projective
1.40947 -0.87246 1.73641 -1.19508
12 Parameter Affine 0.80919 -0.60970 1.25236 -1.67940
From table 8 above, it can be seen that the overall accuracy of abridged Molodensky and 3D polynomial projective techniques are in the order of approximately 0.9 meter and 1.4 meters in the Eastings and 1.9m and 1.7m in the Northings respectively. This implies that the abridged Molodensky model horizontal accuracy achieved in this study was higher than the anticipated standard accuracy level of ±5m. This improvement in accuracy means that, the distortions in the War Office datum are at a minimum. A careful study of the results obtained for the 7-parameter similarity transformation models reveal that, the CFP 180R control points recorded 0.9 meter in the Eastings and GSC 102 had 1.80 meters coordinate differences in the Northings. Conversely, the rest of the controls were within 0.6 meter and 1.0 meter coordinate
differences for Eastings and Northings which meet the standard accuracy requirement for 3-dimensional similarities of 1m. The inference to be drawn here based on the above mentioned evidence from the results is that, the control points CFP 180R and GSC 102 are acting as an outlier and should be resurveyed and checked for stability by the Ghana Survey Department. Furthermore, the 12-parameter affine transformation buttress this inference made above because a similar situation was also observed for the controls mentioned above. The computed differences between the projected coordinates of the test points represented graphically in figures 11 and 12 clearly reflect the residuals for the nineteen coordinates test points.

[Ziggah, 2(4): April, 2013] ISSN: 2277-9655
http: // www.ijesrt.com (C) International Journal of Engineering Sciences & Research Technology[956-971]
Figure 11: Northing Coordinate Differences
Figure 12: Easting Coordinate Differences
To evaluate the performance and adequacy of the datum transformation techniques applied in this study, the coefficient of determination, correlation coefficient and root mean square error were the statistical estimation accuracy measures utilized. These estimation accuracy measures help in assessing the values of the estimation models as well as displaying them graphically. The statistical values (R2 and r) and the root mean square error (RMSE) values of the test data set’s coordinate residuals are presented in table 9 below.
Table 9: Results from statistical test
Transformation R2 r RMSE
(m)
Abridged Molodensky
Eastings 1.0 1.0 0.68389
Northings 1.0 1.0 0.99162
Bursa-Wolf Model
Eastings 1.0 1.0 0.48042
Northings 1.0 1.0 0.86180
Veis Model
Eastings 1.0 1.0 0.48043
Northings 1.0 1.0 0.86183
Molodensky-Badekas Model
Eastings 1.0 1.0 0.48042
Northings 1.0 1.0 0.86180
3D Polynomial Projective Model
Eastings 1.0 1.0 0.73460
Northings 1.0 1.0 0.87652
12 Parameter Affine Model
Eastings 1.0 1.0 0.45089
Northings 1.0 1.0 0.65101
In this study, the coefficient of determination (R2) was used as a criterion to measure the adequacy of the transformation techniques predictions (projected coordinates) when their related transformation parameters were applied to the observations. On the basis of the results (Table 9), the R2 values for all the transformation techniques yielded 1 respectively. These values of R2 indicated that the models describe the variation in the data with highly reliable accuracy. The coefficient of correlation (r) corroborated this high strength of linear dependence between the existing and projected coordinates. A sample of the correlation graphs are shown in figure 12 below.
Figure 12: Scatter plots of existing against projected
coordinates for Abridged Molodensky
To further confirm the degree of linearity (correlation) between actual and projected coordinates for the transformation techniques, a test of hypotheses (t statistic) at 5% significance level was conducted on the correlation coefficients determined.

[Ziggah, 2(4): April, 2013] ISSN: 2277-9655
http: // www.ijesrt.com (C) International Journal of Engineering Sciences & Research Technology[956-971]
Testing of Hypothesis: Null hypothesis: Existing coordinates do not have any correlation with the projected coordinates
H0 : ρ = 0 Alternative Hypothesis: Existing coordinates do have correlation with the projected coordinates
H1 : ρ ≠ 0 Significance Level: α = 0.05
Test Statistic: 21
2
r
nrt
−
−=
Where; r = correlation coefficient (refer to table 9) n = number of observations = 19 Decision Rule: Reject H0 if | t | > t
α/2, n-2 Conclusion: If the calculated | t | is greater than t
α/2, n-
2, reject the null hypothesis and vice versa. From the student t-distribution tables, t (0.025,
17) = 2.110. Observation of the test statistic equation above shows that the test statistic is at infinity and therefore the test will be at the tail end of the distribution; this makes it highly significant. Hence, the null hypothesis is rejected and the alternative accepted since the calculated t is greater than the critical value. This further confirms that the results established a strong correlation between the existing and projected coordinates.
The RMSE shown in table 9 above, were used in the evaluation process of the transformation methods because the RMSEs are sensitive to even small errors and can determine the quality of a transformation, making it good in comparing small changes between projected and observed differences in models. From table 9 above, it is evident that the 12 parameter affine model estimated the 2D coordinates (E, N) of the test points with a significantly better accuracy than the other transformation models in terms of the RMSE. That is, the 12 parameter affine gave the smallest RMSE values (0.45089 m, 0.65101 m) of the 2D coordinate residuals. In addition, the 7-parameter similarity transformation methods produced identical results of RMSE values. This further confirms the assertion that there is no much significant difference between the 7-parameter similarity transformation models.
Figure 9 below, is a root mean squared error distribution in both Eastings and Northings for the transformation models. This distribution shows the accuracy of the transformation models estimations for a set of test data and determines how well the estimation performed. The bar chart shows the root mean square error distribution and the bar height represents the root mean square of the difference between the existing coordinates that fall within the range of the bin and their projected coordinate
values. Moreover, to ensure the accuracy of the transformation, the RMSE should be within a tolerance value. If the RMSE is within the acceptable range, then it is assumed that the transformation of the entire coordinates is acceptable. By comparing the RMSE’s values to the achievable accuracy standard for the models, it can fairly be stated that the transformation is within tolerance.
Figure 4.12: A graph of RMSE in Eastings and
Northings for the transformation models
Visual observation of figure 9 shows that the estimations in Northings coordinates gave a lower accuracy compared to the Eastings. This may perhaps be attributed to the effect of the height determined for the Ghana War Office ellipsoid when the Orthometric height were converted into ellipsoidal height using iterative abridged Molodensky since there is no existence of geoid in Ghana. Thus, the geoid undulation could not be determined. Therefore, applying the Z coordinate in the inverse computation of the latitude will incur some errors that will affect the final projected coordinates in Northings. However, the projected Eastings coordinates of the Ghana War Office system were better because the computation of the longitude uses the horizontal coordinates (X, Y) which are determined to a better accuracy.
Conclusion
Coordinate transformations are necessary to convert War Office coordinates to the GPS based WGS84 coordinates system. In order to obtain an accurate and consistent transformation parameter sets in Ghana, it requires a herculean task due to the inaccuracies and inconsistencies in the War Office geodetic network. In this study, datum transformations between War Office and WGS84 involving two-dimensional (2D) and three-dimensional (3D) coordinates systems have been studied. This procedure involves combining axes rotations, scale change and origin shift by applying transformation equations. A 3D similarity transformation comprising of Bursa-Wolf, Veis and Molodensky-Badekas models have been investigated. In addition, position dependent methods

[Ziggah, 2(4): April, 2013] ISSN: 2277-9655
http: // www.ijesrt.com (C) International Journal of Engineering Sciences & Research Technology[956-971]
namely; 3D polynomial projective and 12 parameter linear affine models were also studied. The abridged Molodensky transformation model was also investigated within the Golden Triangle. Based on the results, it was found that both similarity and position dependent methods produce results consistent with their accuracies that have been quoted in scientific literature. It was also found that the 3D similarity methods do not exhibit any significant differences based on their identical results and precision estimates obtained. Transformation of WGS84 coordinates to the War Office coordinates system can be expected to be within ±1m of the War Office values without any outliers for the 3D similarity models. The results further confirm the uncertainty of 1m existing in 3D similarity methods. The obtained results are a solution for majority of GIS and mapping problems as well as for cadastral work in Ghana. Moreover, the comparison of these 3D similarity models revealed that the Veis and Molodensky-Badekas models were superior to Bursa-wolf model. Hence, it is concluded in this study that the Veis and Molodensky-Badekas models are the most precise 3D similarity transformation model within the Golden Triangle. It must be noted that, before the transformation parameters from the Veis and Molodensky-Badekas model are to be applied to transform coordinates of points within the Golden Triangle, it is essential for the user to know the centroidal coordinate system values used in the derivation of the parameters. This will enable the user to know the positions about which the coordinate reference frame was rotated in the War Office local geodetic network. On the other hand, the abridged Molodensky values based on the results at the test points can produce War Office coordinates accuracy to ±1.9m better than the anticipated accuracy of ±5m. The results suggest that this model can be suitable, for example, for farm compensation surveys, reconnaissance survey using hand-held GPS where higher accuracies are not required. In the case of the position dependent methods, the 12-parameter linear affine model gave better estimation accuracy within ±0.8m compared to the 3D projective model. Numerical investigations revealed that the 12-parameter affine model is superior to the seven-parameter similarity models. This corroborates the scientific findings that the higher the number of parameters in a model; existing in the 12-parameter affine, the better the model fit and a reduction in residuals. In spite of this, the 12-parameter affine model cannot be chosen as the preferred method for transformation of data between the two coordinate reference systems within the Golden Triangle. This is
because, not all of the 12-parameter affine model parameters were statistically significant when the t-test statistic was performed. Therefore, the 3D similarity transformation models that satisfied all the numerical tests are recommended as the proposed methods for datum transformation within the Golden Triangle. However, based on the author’s opinion, the 3D similarity method is also not the optimal transformation model for the Golden Triangle. This is because the criteria for choosing the most optimal transformation model are beyond the scope of this work. Therefore, this study can only propose a better method based on empirical evidence from the numerical investigations but cannot state categorically the optimal model. This is in line with the objectives of this study. A conclusion was drawn from the numerical results that the accuracies of the derived transformation parameters are dependent on the spatial distribution of the geodetic network than on the number of observation points. It was also concluded from the results that, the main cause of obtaining different transformation parameter estimates by researchers in Ghana for the Golden Triangle was attributed to the War Office geodetic network formed by conventional procedures. These networks have, for many reasons, distortions most likely originating from systematic and random errors found in the coordinates of the points. These errors are largely produced by low accuracy heights obtained mostly by trigonometric leveling in the War Office networks and by the absence of geoid undulations required for the conversion to ellipsoidal heights. To conclude, issues of datum transformation of GPS coordinates from the War Office to the WGS84 coordinate systems are a real, persistent and serious problem in Ghana that requires pragmatic measures for solutions. References
[1] Anon, 19th March, 2013, Ghana from: http://en.wikipedia.org/wiki/Ghana
[2] Ayer, J. and Fosu, C. “Map coordinates referencing and the use of GPS datasets in Ghana”. Journal of Science and Technology. KNUST, Kumasi, Ghana, vol. 28., no.1, pp. 116-127, 2008.
[3] Ayer, J. “Transformation models and Procedures for Framework Integration of the Ghana National Geodetic Network”. The Ghana Surveyor, vol. 1, no. 2, pp. 52-58, 2008.
[4] Ayer, J. and Tiennah, T. “Datum Transformation by the Iterative Solution of the Abridging Inverse Molodensky

[Ziggah, 2(4): April, 2013] ISSN: 2277-9655
http: // www.ijesrt.com (C) International Journal of Engineering Sciences & Research Technology[956-971]
Formulae”. The Ghana surveyor, Vol. 1, no. 2, pp. 59-66, 2008.
[5] Baabereyir, A. “Urban environmental problems in Ghana: case study of social and environmental injustice in solid waste management in Accra and Sekondi-Takoradi” Thesis submitted to the Department of Geography, University of Nottingham for the Degree of Doctor of Philosophy, UK, 2009.
[6] Burtch, R. “Surveying Engineering” SURE 440-Advance Photogrammetry, BSc. Lecture Notes, Ferris State University, pp.27-33, 2010.
[7] Constantin-Octavian, A. “3D Affine coordinate transformations” Master’s of Science Thesis in Geodesy No. 3091 TRITA-GIT EX 06-004, School of Architecture and the Built Environment, Royal Institute of Technology (KTH), 100 44 Stockholm, Sweden, 2006.
[8] Dadzie, I., Osei, E. and Djaba, S. “Geoid Determination for Effective Integration of GPS-Derived Data into Ghana National Coordinate System”. Integrating Generations FIG Working Week, Stockholm, Sweden 14-19, 1pp., 2008.
[9] Deakin, R.E, “A Note on the Bursa-Wolf and Molodensky-Badekas Transformations”. School of Mathematical and Geospatial Sciences, RMIT University pp.1-21, 2006.
[10] Deakin, R.E. “The standard and Abridged Molodensky Coordinate Transformation Formulae” Department of Mathematical and Geospatial Sciences, RMIT University pp.1-21,2004
[11] Dawod, G.M., Mirza, N.M. and Al-Ghamdi, A. K. “TS 8 Simple Precise Coordinates Transformations for Geomatics Applications in Makkah Metropolitan Area, Saudi-Arabia” Bridging the Gap between Cultures FIG Working Week, Marrakech, Morocco, pp. 18-22, 2010.
[12] Dzidefo, A. etermination of Transformation Parameters between the World Geodetic System 1984 and the Ghana Geodetic Network” Master’s Thesis, Department of Civil and Geomatic Engineering, Kwame Nkrumah University of Science and Technology, Kumasi, Ghana, 2011.
[13] Ghosh, S.K. Analytical Photogrammetry, Pergamon Press, New York, 203 pp., 1979.
[14] Graham, T., Sannier, C.A.D. and Taylor, J.C. “Mapping Systems and GIS: A Case Study using the Ghana National Grid” The Geographical Journal, vol. 166, no. 4, page 306-311., December 2000.
[15] Poku-Gyamfi, Y. and Schueler, T. “Renewal of Ghana’s Geodetic Reference Network” 13th FIG Symposium on Deformation Measurement and Analysis, 4th IAG Symposium on Geodesy for Geotechnical and Structural Engineering, LNEC, LISBON, pp.1-9, 2008.
[16] Rapp, R.H. Geometric Geodesy-PART II, Department of Geodetic Science and Surveying, Ohio State University, USA, pp.68-72, 1993.
[17] Thomson, D.B. “A study of the Combination of Terrestrial and Satellite Geodetic Networks”, Department of Surveying Engineering, University of New Brunswick, Canada, pp. 89-128, 1994.
[18] Hofmann-Wellenhof, B., Lichtenegger, H. and Collins, J. GPS Theory and Practice, 4th edition, Springer-Verlag, Wien, New York, 1997
[19] LUPMIS, 18th March, 2013, GIS User Manual for Land Use Planning from: http://www.ghanalap.gov.gh/privatecontent/LUPMIS/a22_projection_and_datum.html.