arctic energy office u.s. department of...
TRANSCRIPT

Arctic Energy OfficeU.S. Department of Energy
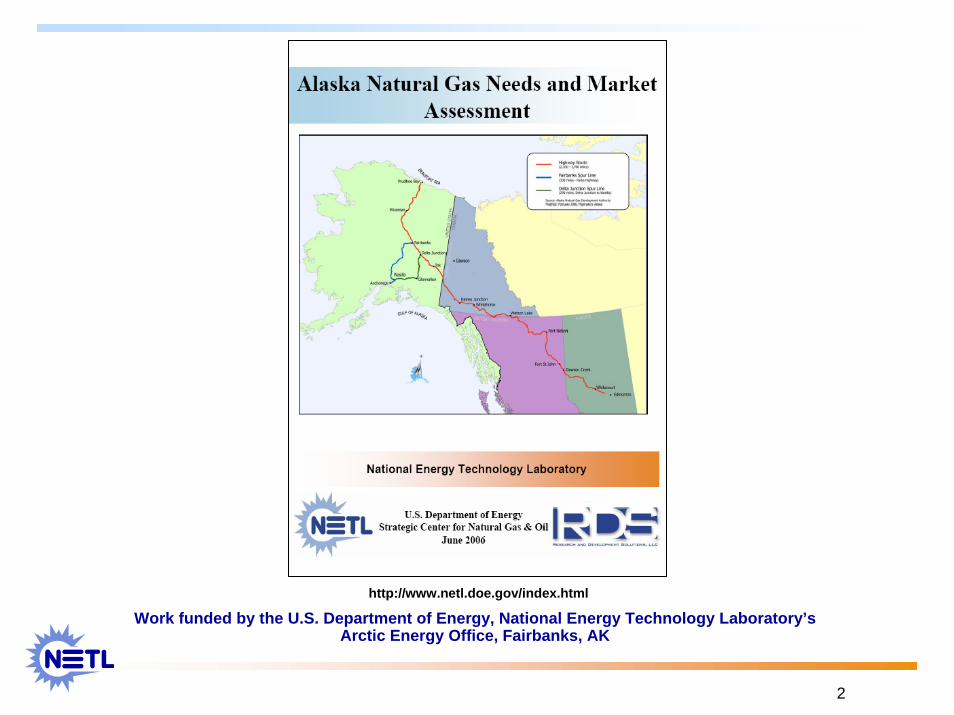
Spur Line AnalysisAlaska Natural Gas Needs and
Market Assessment
South Central Alaska Energy ForumSept. 20-21, 2006
Charles Thomas - SAICAnchorage, Alaska
Brent J. Sheets, National Energy Technology Laboratory ([email protected])Charles P. Thomas, National Energy Technology Laboratory, SAIC, ([email protected])
2
http://www.netl.doe.gov/index.html
Work funded by the U.S. Department of Energy, National Energy Technology Laboratory’s Arctic Energy Office, Fairbanks, AK

3
Overall Study Objective
• Develop an estimate of potential Spur Pipeline demand in South Central Alaska
• Estimate natural gas demand in Central Alaska (Fairbanks area)
• Provides inputs to a second study− engineering specifications of the
pipeline. − socio-economic impacts.

4
Methodology
• AGP from ANS to Chicago: 4.5 – 6 Bcf/d, dense phase gas, in operation by 2015
• Spur pipeline scenarios:− Dry gas line – Residential/commercial, power generation,
LNG, ammonia-urea, gas-to-liquids − Dense phase line containing NGLs: All of the above and
petrochemicals and propane • Financial modeling to estimate economically viable
demand − Determine the maximum price each sector can pay and
be viable in South Central Alaska• Fairbanks area demand independent of a spur pipeline
5
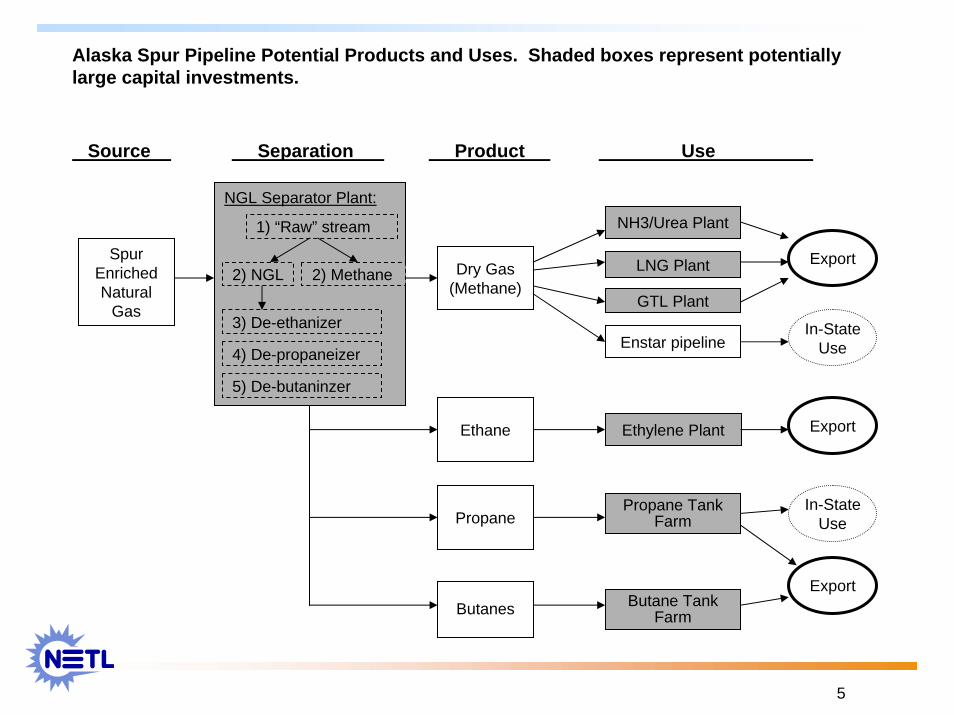
Alaska Spur Pipeline Potential Products and Uses. Shaded boxes represent potentially large capital investments.
Butanes
Spur Enriched Natural
Gas
Ethylene PlantEthane
Propane
Dry Gas(Methane)
NH3/Urea Plant
Enstar pipeline
Butane Tank Farm
GTL Plant
Separation . Product . Use .Source .
LNG Plant
NGL Separator Plant:
1) “Raw” stream
3) De-ethanizer
2) Methane
4) De-propaneizer
5) De-butaninzer
2) NGL
In-StateUse
Export
Export
Export
In-StateUse
Propane Tank Farm
6
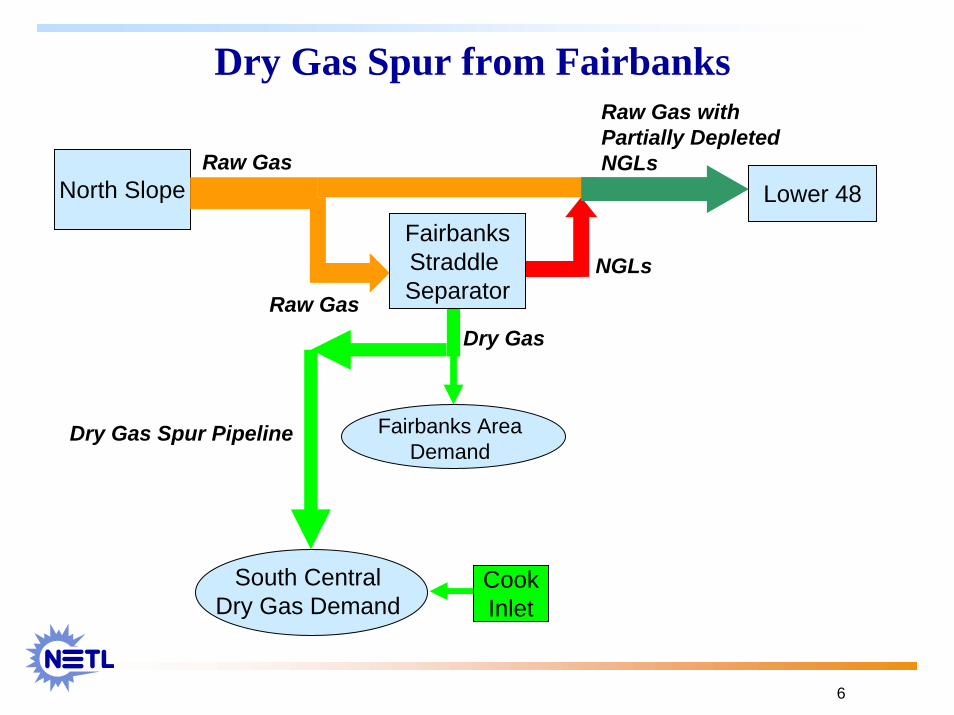
Lower 48North Slope
Dry Gas
Raw Gas withPartially DepletedNGLs
NGLsFairbanksStraddle SeparatorRaw Gas
Raw Gas
Fairbanks Area Demand
Dry Gas Spur Pipeline
South Central Dry Gas Demand
CookInlet
Dry Gas Spur from Fairbanks

7
Lower 48North Slope
Raw Gas withPartially DepletedNGLs
Dry Gas
NGLsFairbanksStraddle Separator
Raw Gas
Fairbanks Area Demand Dry Gas
Spur Pipeline
South Central Dry Gas Demand
CookInlet
Delta Junction Straddle Separator
Dry Gas Spur from Delta Junction

8
Lower 48North Slope
NGLs
Raw Gas withPartially DepletedNGLs
NGL EnrichedRaw Gas
Dry Gas
FairbanksStraddle
Sep. PlantRaw Gas
Raw Gas
Fairbanks Area Demand
South Central Dry Gas DemandDry Gas
NGLPetrochemical Ind.
& Propane
CookInlet
South CentralGas Sep. Plt.
Dense Phase Spur Line from Fairbanks

9
Study Assumptions
• All large gas-intensive industries scaled as world class • 12% discount rate, over a 20 year project life • 2005$ • 4.5 – 6.0 Bcf/d AGP becomes operational in 2015• ANS wellhead price is determined by Lower 48 gas
prices minus AGP Tariff • Fairbanks gas price = ANS price + AGP tariff to
Fairbanks• South Central Alaska price = ANS price + AGP tariff to
Fairbanks + spur pipeline tariff• Future gas demand in the Fairbanks region is not
included in spur pipeline capacity estimates • South Central natural gas supply = Existing Cook Inlet
natural gas reserves only
10
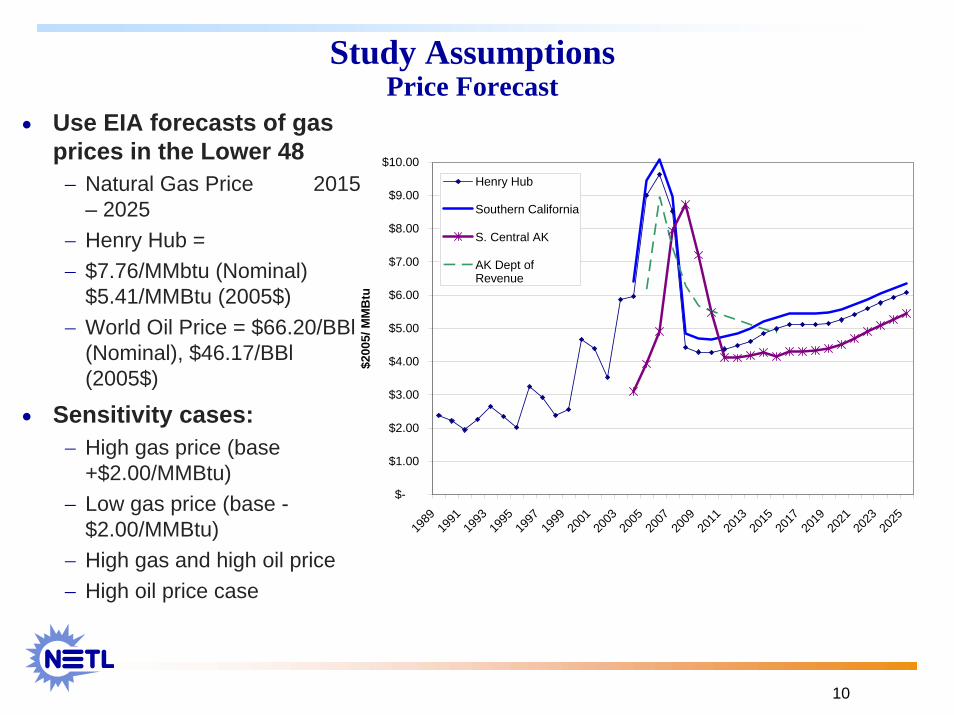
Study AssumptionsPrice Forecast
• Use EIA forecasts of gas prices in the Lower 48 − Natural Gas Price 2015
– 2025− Henry Hub =− $7.76/MMbtu (Nominal)
$5.41/MMBtu (2005$)− World Oil Price = $66.20/BBl
(Nominal), $46.17/BBl (2005$)
• Sensitivity cases:− High gas price (base
+$2.00/MMBtu)− Low gas price (base -
$2.00/MMBtu)− High gas and high oil price− High oil price case
$-
$1.00
$2.00
$3.00
$4.00
$5.00
$6.00
$7.00
$8.00
$9.00
$10.00
1989
1991
1993
1995
1997
1999
2001
2003
2005
2007
2009
2011
2013
2015
2017
2019
2021
2023
2025
$200
5/ M
MB
tu
Henry Hub
Southern California
S. Central AK
AK Dept ofRevenue
11
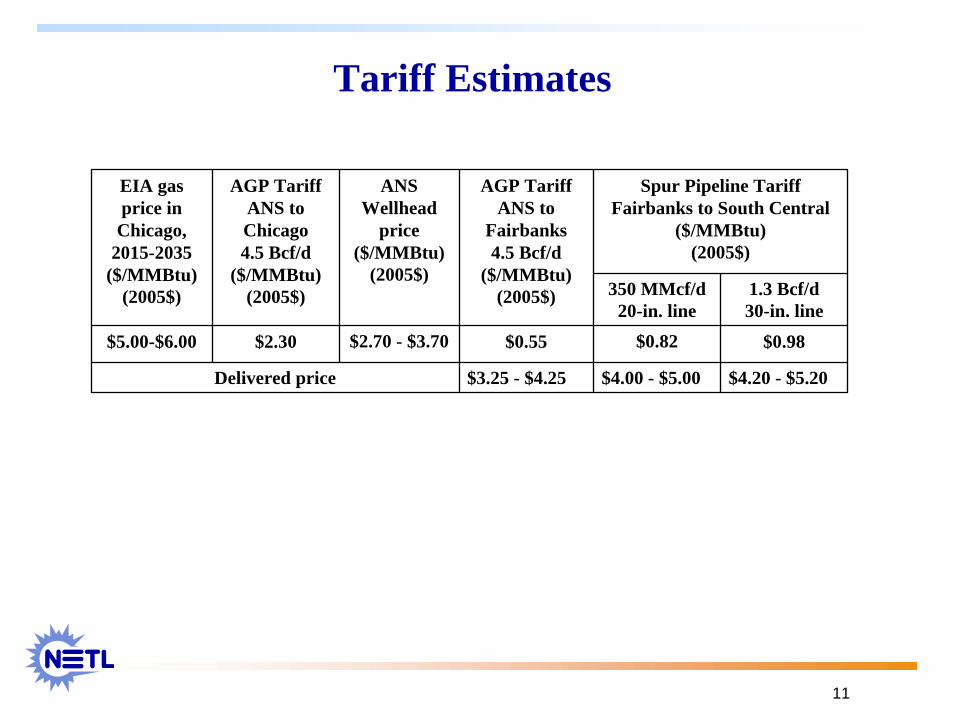
Tariff Estimates
Spur Pipeline TariffFairbanks to South Central
($/MMBtu)(2005$)
EIA gas price in Chicago,
2015-2035 ($/MMBtu)
(2005$)
AGP Tariff ANS to Chicago4.5 Bcf/d
($/MMBtu)(2005$)
ANS Wellhead
price ($/MMBtu)
(2005$)
AGP Tariff ANS to
Fairbanks4.5 Bcf/d
($/MMBtu)(2005$) 350 MMcf/d
20-in. line1.3 Bcf/d30-in. line
$5.00-$6.00 $2.30 $2.70 - $3.70 $0.55 $0.82 $0.98
Delivered price $3.25 - $4.25 $4.00 - $5.00 $4.20 - $5.20

12
Potential Consumption and Prices by Sector
Potential Demand Sector
Maximum Price
$/MMBtu*(2005$) Demand in 2025
Residential / Commercial $8.50 134 MMcf/d methane
Power $5.20 131 MMcf/d methane
Ammonia / Urea $2.79 145 MMcf/d methane
LNG $3.20 212 MMcf/d methane
GTL $3.20 480 MMcf/d methaneTotal Potential Demand for Dry Gas 1,102 MMcf/d methane
Petrochemicals $4.60 3 MMcf/d methane75,000 bbl/d [118 MMcf/d] ethane
LPG $4.2063,000 bbl/d [96 MMcf/d] butane and
propane, and 15,000 bbl/d [20 MMcf/d] pentane
Total Potential Demand w/Wet Gas 1,339 MMcf/d methane equivalent.
Additional Wet Gas Demand
Dry Gas Demand
* Average price between 2015 and 2025

13
Base Price Scenario (2025 Snapshot)Va
lue
$/M
MB
tu
Quantity MMcfd
9
8
7
6
5
4
3
2
1
0100 200 300 400 500 600 700 800 900 1000 1100 1200
LPG
(Pro
pane
)
LNGFertilizer
Petro
Che
m (E
than
e)
GTL
Res
iden
tial C
omm
erci
al
Power
Valu
e $/
MM
Btu
Quantity MMcfd
9
8
7
6
5
4
3
2
1
0100 200 300 400 500 600 700 800 900 1000 1100 1200
LPG
(Pro
pane
)
LNGFertilizer
Petro
Che
m (E
than
e)
GTL
Res
iden
tial C
omm
erci
al
Power
Market Prices in South Central Alaska (2015-2035)

14
Study Conclusions350 MMcf/d Dry Gas Pipeline – Least Speculative
• Pipeline sized to run at high capacity all year.• Satisfies gas demand from only residential/commercial, and power
sectors • Requires approximately 80 MMcfd of storage deliverability.
0
50
100
150
200
250
300
350
400
450
500
Jan-1
5Ja
n-16
Jan-1
7Ja
n-18
Jan-1
9Ja
n-20
Jan-2
1Ja
n-22
Jan-2
3Ja
n-24
Jan-2
5Ja
n-26
Jan-2
7Ja
n-28
Jan-2
9Ja
n-30
Jan-3
1Ja
n-32
Jan-3
3Ja
n-34
Jan-3
5
MM
cfd
Residential / Commerical Power Cook Inlet Production
Spur Pipeline
0
100
200
300
400
500
600
2005
2007
2009
2011
2013
2015
2017
2019
2021
2023
2025
2027
2029
2031
2033
2035
MM
cfd
Residential/Commerical Power Industrial Cook Inlet Supply
15
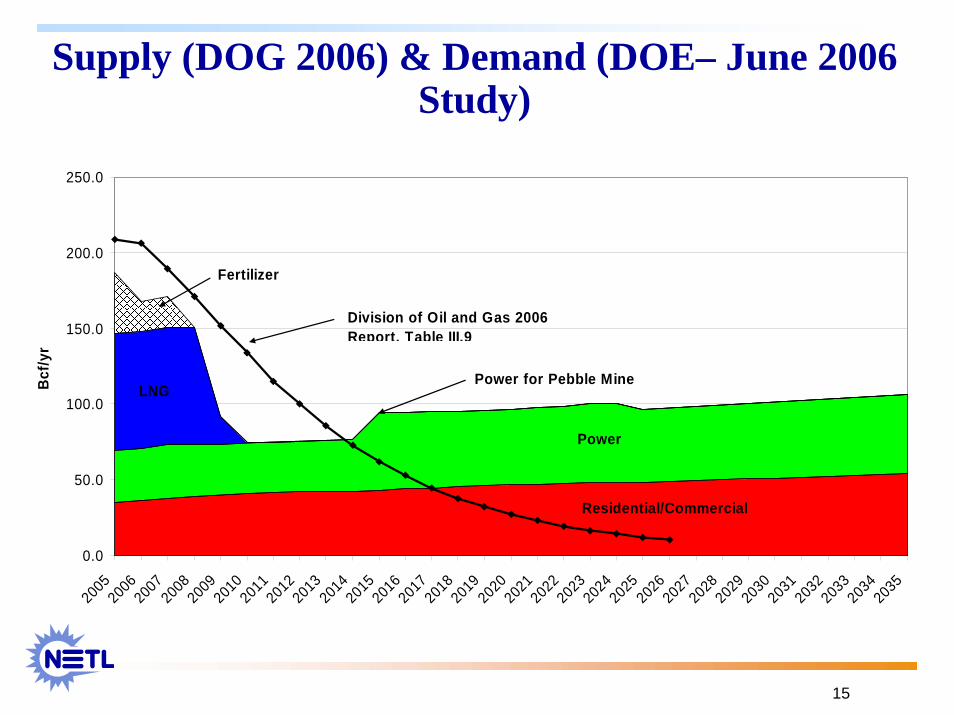
Supply (DOG 2006) & Demand (DOE– June 2006 Study)
0.0
50.0
100.0
150.0
200.0
250.0
2005200620072008200920102011201220132014201520162017201820192020202120222023202420252026202720282029203020312032203320342035
Bcf
/yr
Division of Oil and Gas 2006 Report, Table III.9
Residential/Commercial
Power
Power for Pebble MineLNG
Fertilizer

16
Low Gas Price Case (Base-$2.00/MMBtu)
17
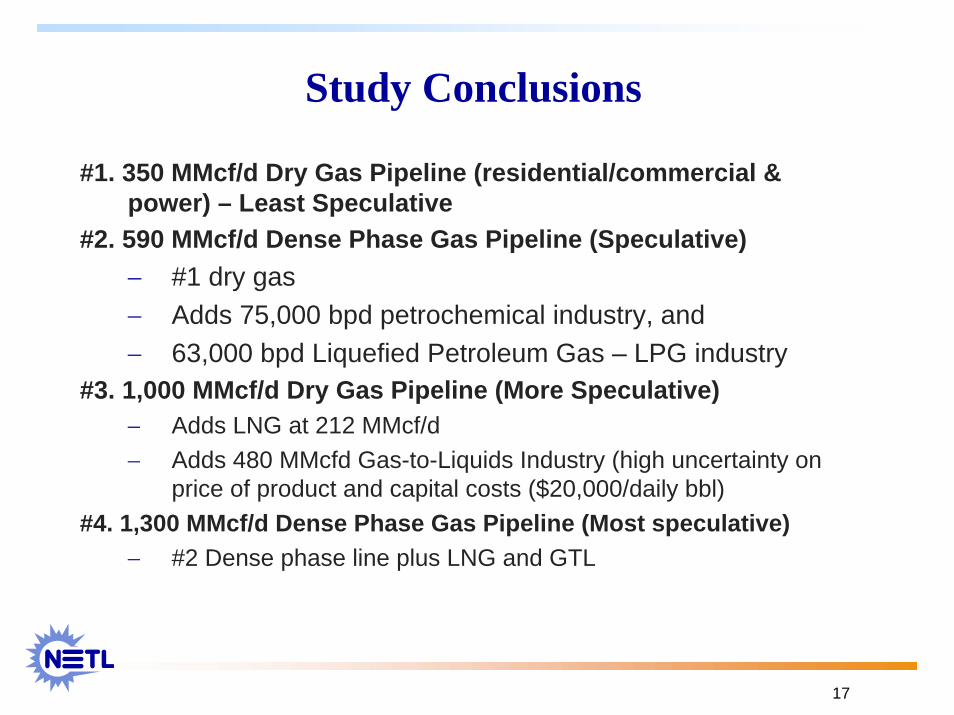
Study Conclusions
#1. 350 MMcf/d Dry Gas Pipeline (residential/commercial & power) – Least Speculative
#2. 590 MMcf/d Dense Phase Gas Pipeline (Speculative)− #1 dry gas− Adds 75,000 bpd petrochemical industry, and − 63,000 bpd Liquefied Petroleum Gas – LPG industry
#3. 1,000 MMcf/d Dry Gas Pipeline (More Speculative)− Adds LNG at 212 MMcf/d− Adds 480 MMcfd Gas-to-Liquids Industry (high uncertainty on
price of product and capital costs ($20,000/daily bbl)#4. 1,300 MMcf/d Dense Phase Gas Pipeline (Most speculative)
− #2 Dense phase line plus LNG and GTL

18
Central Alaska Gas Demand Forecast Monthly Consumption – Residential, Commercial, and
Power Generation
0.0
20.0
40.0
60.0
80.0
100.0
120.0
140.0
Jan-
15
Jan-
16
Jan-
17
Jan-
18
Jan-
19
Jan-
20
Jan-
21
Jan-
22
Jan-
23
Jan-
24
Jan-
25
Jan-
26
Jan-
27
Jan-
28
Jan-
29
Jan-
30
Jan-
31
Jan-
32
Jan-
33
Jan-
34
Jan-
35
MM
cfd
Residential / Commercial Power
Residential & Commercial (2025) = 24 MMcfd(11-44 MMcfd)
Power Generation (2025) = 44 MMcfd (250 MW)

19
FUTURE ENERGY SUPPLY OPTIONS FOR SOUTH CENTRAL ALASKA
• Cook Inlet conventional natural gas resources• Unconventional gas; e.g., Coal bed natural gas (CBM) • Import gas from outside South Central Alaska
− Spur gas pipeline to bring gas from North Slope (or other undeveloped basins)
− Import LNG into Alaska• Other potential contributing factors
− Gas storage – offset season demand variations − Conservation and increased efficiency − Reduce industrial use (or convert to coal) − Power generation alternatives to offset NG use:
• Coal, wind, geothermal, hydropower, biomass, etc.

20
Summary & Observations • Additional cost-benefit analysis comparing South Central
Alaska options is needed:− Increased/continued Cook Inlet oil and gas E&P− Spur pipeline− Coal gasification for industrial input and power− Coal power plants− Alternative power options− LNG imports
• What is the optimum mix of supply options?− Maintain Cook Inlet Oil and Gas industry− Maintain and expand industrial base (value added exports)
• What if the lowest price gas in South Central is from LNG imports? −Negative impact on economic growth?

Descriptor - include initials, /org#/date
NETL’s Website –Oil & Natural Gas Technologies Section
Use our website to access a wealth of
information:• Program Information
• Current Announcements
• Detailed Information about Each Project
• Project Reports
• Newsletters
• Publications
• Software
• Tech Transfer
• …And Lots More
Internet Address: http://www.netl.doe.gov/technologies/oil-gas/index.html